inshore fisheries and fish population changes in lake ... · inshore fisheries and fish population...
TRANSCRIPT
Rev. 09/02/2004
INSHORE FISHERIES AND FISH POPULATION CHANGES IN LAKE KARIBA
J. Kolding, B. Musando and N. Songore
1. INTRODUCTION
Since the creation in 1958 of Lake Kariba, situated on the Zambezi River and shared betweenZambia and Zimbabwe, substantial changes in both its fisheries and in the fish communitieshave been observed. Although probably one of the best studied fresh water systems in Africa(Karenge and Kolding, 1995a), the sustainable exploitation levels of its fish communities arestill largely unknown (Anon., 1992; Kolding, 1994). Fear of overfishing, or at least indicationsof fully exploited resources, has repeatedly been expressed (Marshall, 1981; Marshall, Junorand Langerman, 1982; Kenmuir, 1982; Marshall 1985, Machena and Mabaye, 1987; Marshalland Langermann, 1988; Moyo, 1990; Scholz, 1993; Sanyanga, Machena and Kautsky, 1995;Sanyanga, 1995; Machena and Kwaramba, 1997), whereas other studies have contested theseviews (NORAD, 1985; Ramberg et al., 1987; Marshall, 1992; Machena, Kolding andSanyanga, 1993; Kolding, 1994; Karenge and Kolding, 1995a). Most of the attempts tocalculate sustainable yields (Marshall, Junor and Langerman, 1982; Marshall, 1985; Moyo,1986, 1990) are from classic fisheries stock assessment models based on catch and effortvariables, with the underlying basic assumption of ecological stability and constantregenerative capacity. Most of the results from these analyses have proven of dubious value(see Box 5.2 in Volume I).
Lake Kariba is not a stable system as most other small or medium sized lakes in Africa.Karenge and Kolding (1995b) showed that the environment, in terms of the changinghydrological regime, explains a large proportion of the variability in catch rates (CPUE). Theyconcluded that Lake Kariba was an allothropic riverine lake where productivity was largelydriven by the nutrient pulses carried by the annual floods. The question is therefore how muchof the observed changes can be attributed to fishing activities and how much is due to naturalenvironmental fluctuations. Another important management issue, particularly on the Zambianside, is the high fishing pressure and changing fishing pattern in terms of increased use ofsmall mesh sizes and customary use of illegal fishing methods such as drive fishing(Kutumpula). It is widely believed that such uncontrolled development is a potential sign ofoverfishing and poses a threat to the biodiversity (FAO, 1992; Lowe-McConnell, 1994;Pitcher, 1995). On the other hand, in highly variable systems, susceptibility to increasedfishing effort is thought to be low, while resilience is high and recovery potential is rapid.
Lake Kariba is a man-made grand-scale ecological laboratory with a unique chance to observeand monitor the intricate pathways of natural succession under exploitation, and a relativelygood catch and effort monitoring scheme has been in place since its creation. In addition, theinshore fisheries of Zambia and Zimbabwe have evolved differently and have been subject todifferent types of management regimes (see Bourdillon, Cheater and Murphree, 1984;Malasha, 2003; Jul-Larsen, 2003 and Overå, 2003 for a detailed historical account andanalysis). Since the overall fishing effort, catch rates and fishing patterns on the two sides ofthe lake are very different due to different management and enforcement, a comparative studymay shed some light on the impact that these different fisheries have on each side of the sameecosystem.
68After a brief description of the physical and biological environment, and the differentmanagement regulations in place, we will use the long-term time series of commercial andexperimental catch rates available to describe and discuss the observed development andchanges on both sides of the lake. From this comparison we will evaluate the impact of fishingon the fish stocks relative to their natural succession and fluctuations in the environment.
There are two distinct fisheries in Lake Kariba: the low cost, non-mechanized, multispecies,inshore artisanal fishery, and the highly mechanized, capital intensive, semi-industrial single-species offshore fishery on the introduced pelagic clupeid Kapenta (Limnothrissa miodon).The biological, technical, and socio-economic interactions between these two fisheries are sosmall (Karenge and Kolding, 1995a; Bourdillon, Cheater and Murphree, 1985) that thefisheries must be treated separately. As the particular problems of the industrial Kapentafishery are not the main focus of this study, it will be described and analysed only cursorily.
2. BACKGROUND INFORMATION
2.1 The environment
Lake Kariba (277 km long; 5 364 km2; 160 km3; 29 m mean depth and 120 m max. depth) islocated on the Zambezi River between latitudes 16E 28’ to 18E 04’S and longitudes 26E 42’ to29E 03’E. It was the largest man-made reservoir in the world at the time of construction. Todayit is the second largest reservoir in Africa by volume. The catchment area covers 663 817 km2
extending over parts of Angola, Zambia, Namibia, Botswana and Zimbabwe. The dam wall(128 x 580 m) was completed in 1960 and the filling phase lasted from December 1958 toSeptember 1963 when the water reached the mean operation level at 485 m above mean sealevel. The lake is naturally divided into five basins (Figure 1) and is almost equally shared bythe two riparian countries Zambia and Zimbabwe with 45 percent and 55 percent respectively.The impact of the artisanal inshore fishery on the two sides of the lake can be considered notto affect each other because of the deep channel in between the two shores along most of thelake.
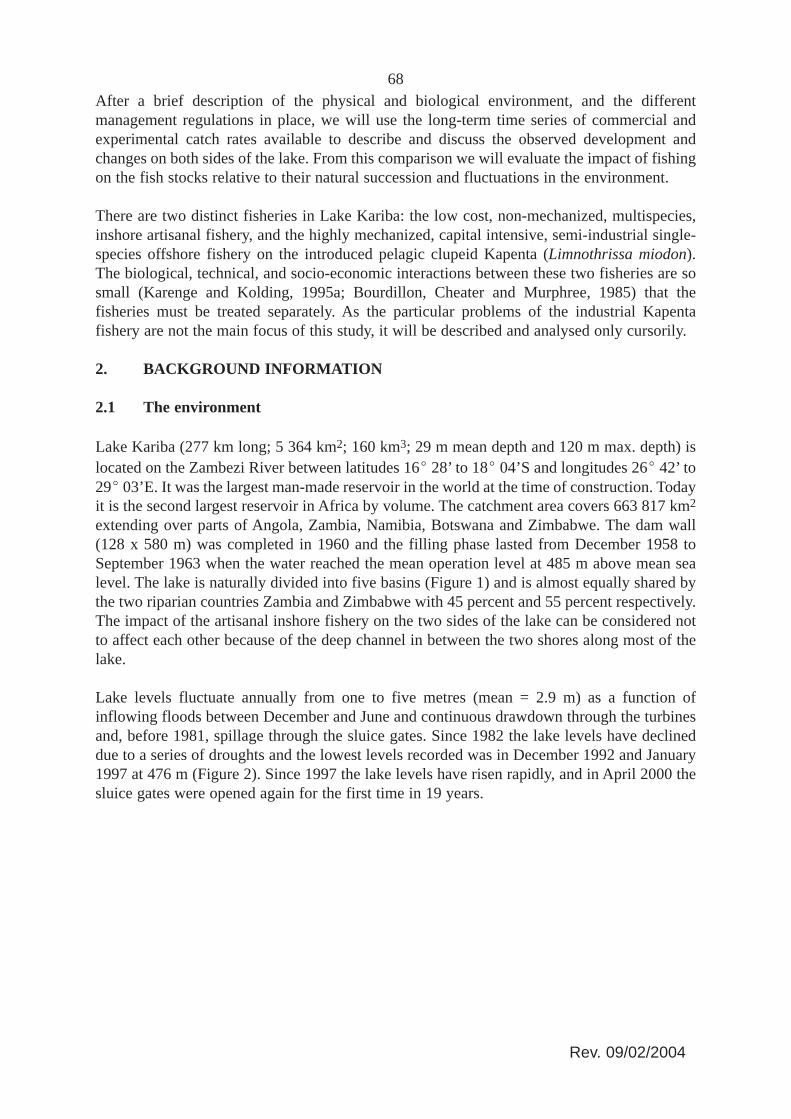
Lake levels fluctuate annually from one to five metres (mean = 2.9 m) as a function ofinflowing floods between December and June and continuous drawdown through the turbinesand, before 1981, spillage through the sluice gates. Since 1982 the lake levels have declineddue to a series of droughts and the lowest levels recorded was in December 1992 and January1997 at 476 m (Figure 2). Since 1997 the lake levels have risen rapidly, and in April 2000 thesluice gates were opened again for the first time in 19 years.
Rev. 09/02/2004

69
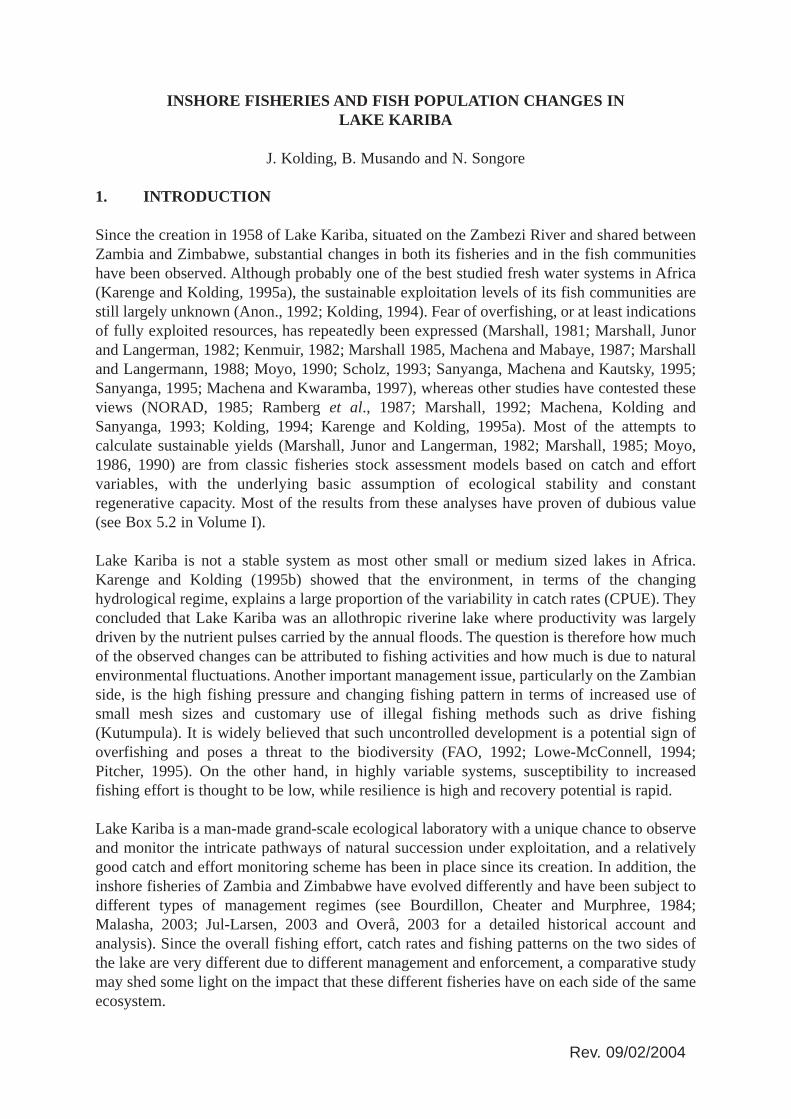
FIGURE 1. Map of Lake Kariba showing the five natural basins (B1..B5), the designatedinshore fishing grounds on the Zimbabwean side (C1..C7), the sampling strata in Zambia(S1..S4), the selected experimental fishing stations in Zambia around Sinazongwe (opencircles), and the experimental fishing station (Lakeside) in Zimbabwe near Kariba town (opensquare).
FIGURE 2. Mean monthly and mean annual lake levels (m a.m.s.l.) in Lake Kariba from 1962to 2000. Between 1981 and 2000 no surplus spillage through the dam wall floodgates havebeen performed.
Rev. 09/02/2004
70The limnological and various biological characteristics of Lake Kariba are well describedelsewhere (see e.g. Coche, 1968; Balon and Coche, 1974; Marshall, Junor and Langerman,1982; Marshall, 1984; Machena, 1988 and Moreau, 1997 for comprehensive reviews). Themost salient features are a warm (mean surface temperature of 26E), oligotrophic, monomicticlake with overturn occurring in June–July. Stratification begins around September with athermocline around 15 m depth which gradually moves down to around 35 m at the time of theturnover. The oxygen concentration in the hypolimnion declines steadily during thestratification period and often reaches a stage of deoxygenation. The volume to inflow (c. 50-70 km3 per year) ratio is low giving a mean water retention time of only 2.6 years. TheZambezi River provides about 80 percent of the inflow and there is a natural gradient in thelake ecosystem from east to west. Basin 1 and 2 have more riverine characteristics graduallyattaining a more lacustrine environment to Basin 5 near the dam wall.
The waters from the Zambezi River are very clear and low in plant nutrients. Phytoplanktonblooms occur just after turnover and locally at the onset of floods from tributaries, but most ofthe year primary production may be very low. Zooplankton abundance shows variation inresponse to phytoplankton biomass (Begg, 1976; Marshall, 1997). Initially after filling, thelake was eutrophic due to the vast amount of dissolved nutrients through inundation ofvegetation and land. From 1963 the lake became slightly alkaline with a marked decrease inphosphate and nitrates (Thornton, 1980). During the early eutrophic years the floating fern,Salvinia molesta, colonized large areas of the lake and retained vast amounts of plant nutrients(Mitchell, 1973). From the 1970s it has gradually decreased and been replaced by increasingamounts of rooted macrophytes down to a depth of around 10 m (Machena, 1989).
2.2 The fish fauna
The natural limnological gradient in the lake is also reflected in the fish communities whichare dominated by potamodromous species in the east (cyprinidae and distichodontidae) and bymore sedentary cichlids in the western basins (Begg, 1974). The fish community and biologyof the fish species is well described in a number of reviews and research works (Balon andCoche, 1974; Mitchell, 1976a; Marshall, Junor and Langerman, 1982; Kenmuir, 1984;Marshall, 1984; Karenge, 1992; Machena, Kolding and Sanyanga, 1993, Musando, 1996;Karenge and Kolding, 1995a). Several of these discuss the observed biological succession indetail and only a brief update will follow. Most notable is that the number of fish species inLake Kariba seems to be steadily increasing.
Jubb (1967) listed 55 species occurring in the Middle and Lower Zambezi River system, thatis the portion of the drainage system from below the Victoria Falls to the mouth of the ZambeziRiver into the Indian ocean. In a pre-impoundment gillnet survey (Jackson 1961b), 28 fishspecies were caught in the Zambezi river at the location of the new lake (but very small meshsizes were not used). Shortly after filling in 1964, Harding (1966) reported 33 species. In theearly 1970s, Balon (1974a) recorded 39 species, later updated to 43 species by Marshall(1984). Since then five more species, the garpike Hepsetus odoe (Sanyanga and Feresu, 1994),the tilapias Tilapia sparmanii and Oreochromis niloticus, the chiselmouth Varicorhinusnasutus, and the largemouth bass Micropterus salmoides (Karenge and Kolding, 1995b; Anon.,1995) have been caught in the lake by the Lake Kariba Fisheries Research Institute. Bell-Crossand Minshull (1988) list 62 species in Lake Kariba area, defined by the Victoria Falls upriverand all south bank tributaries. Several of these have not been recorded in the lake itself.
Rev. 09/02/2004
712.3 Invasions, introductions and disappearances
The presence of non-introduced Upper Zambezi fish (i.e. above the Victoria Falls) in LakeKariba a decade after creation, such as the cichlids Sargochromis giardi, Sargochromiscarlottae, Oreochromis andersonii, and Pseudocrenilabrus philander, the mormyridMarcusenius macrolepidotus, the cyprinid Labeo cylindricus, the schilbeid Schilbeintermedius (mystus), and the small barbs Barbus poechii, B. paludinosus and B. unitaeniatus,caused some scientific debate when Balon (1974c) suggested that they survived the drop downthe mighty Victoria Falls (e.g. Jubb, 1976a, 1976b, 1977). There are, however, indications thatthe so called “upper Zambezi invaders” may also have been present in the middle Zambezibefore inundation but were missed in the sampling programs. They may also have beenaccidentally introduced or could have reached the lake through the Victoria Falls power stationoverflow (Jubb, 1976a; Kenmuir, 1984; Bell-Cross and Minshull, 1988). Whatever the origin,it seems that the new lacustrine environment give these species enhanced conditions to becomeestablished.
Presently 50 different fish species have been observed in the lake, five of which are introduced(Songore and Kolding, 2003). However, seven species have been reported just once(Leptoglanis rotundiceps, Serranochromis angusticeps, Hepsetus odoe, Barbus radiatus,Labeo lunatus, Varicorhinus nasutus, and the introduced Micropterus salmoides). Thus it canbe is questioned whether they are stray specimens or have established viable populations in thelake. Two of the introduced species, Tilapia rendalli and Serranochromis robustus, may aswell have invaded the lake naturally (e.g. Kenmuir, 1984). In fact T. rendalli was alreadycaught by Jackson (1961b) during the pre-impoundment survey. Thus only three truly exoticspecies have established in the lake. One is the cichlid Oreochromis macrochir, which wasstocked into the lake in 1959–62 from Chilanga, Zambia. It was never caught during Balon’s(1974a, 1974b) intensive sampling programme and was believed extinct, but started appearingin the Lakeside sampling programme in 1974. It has since then been caught every year in theexperimental surveys at Lakeside but only in very small numbers (on average about tenspecimens per year out of 5–10 000 total sampled). In the Zambian experimental gillnetsurveys it has been recorded only three times: in 1985, 1992 and 1996. The other true exoticis the small pelagic clupeid Limnothrissa miodon introduced from Lake Tanganyika in1967–1969 (Bell-Cross and Bell-Cross, 1971). This introduction is a well-known success story(see section below) and there are no indications that this by far largest single stock in the lakewith an annual total production rate around 125-150 000 tonnes, has had adverse effect on theother species (Marshall, 1991; Karenge and Kolding, 1995b). The third true exotic is the Niletilapia (Oreochromis niloticus) which since 1993 has been caught in ever increasing quantitiesin gillnets by Lake kariba Fisheries Research Institute (LKFRI). This species was neverintroduced deliberately but is cultured at several farms along the lakeshore, which draindirectly into the lake.
Some species have disappeared or have become rare (Kenmiur, 1984). The rheophilic species,Chiloglanis neumanii, Opsaridium zambezense (and possibly also Leptoglanis rotundiceps) arenow confined to the tributaries or the two more lotic western basins (Balon, 1974a,1974b).Species diversity could be greater in the eastern effluent part of the lake than is assumed today(Begg, 1974), as Balon (1974a, 1974b) recorded 39 species in the Zinazongwe area (Basin 3) in
Rev. 09/02/2004
72a poisoning sampling programme. In a similar study in the Sanyati basin (Basin 5) only 27species were recorded (Mitchell, 1976a). It was feared that the potamodromous mottled eel,Anguilla bengalensis, eventually would disappear from the lake, since the elvers coming up fromthe sea would not be able to mount the 128 m dam wall (Jubb, 1967). Marshall, Junor andLangerma (1982) considered the situation even more problematic with the construction of theformidable Cahora Bassa dam wall (160 m high) about 400 km down-river. However, someelvers still seem able to do so, although in low numbers, and eels have been recorded in the lakeat all times (Marshall, Junor and Langerman, 1982). For instance, two mottled eel of around 60cm TL were captured in March 1993 near the dam wall. If these have not ascended the two damwalls on their way up the Zambezi river, they were by then more than 30 years old (Anon., 1993).
2.4 Management and regulations:
The lake was primarily constructed to generate hydro-electricity but additional expectations werealso derived from different estimates of the potential fish yields. Before inundation, an area ofsome 950 km2 (about 18 percent of the lake area) was bush cleared at various places within the20 m contour in order to establish inshore fishing grounds. Between 1959 and 1962, 26 tonnesof cichlid fingerlings (Tilapia rendalli and Oreochromis macrochir) were stocked into the lake toboost the fishery (Coche, 1971). From the very beginning the essential issue in the managementof the fishery was the question “Who was to fish”? On this question the Zambian andZimbabwean1 authorities fundamentally disagreed, which eventually led to divergent policiesthat still mark the fisheries in the two countries today (Bourdillion, Cheater and Murphree, 1985). In Zimbabwe the authorities divided the shorelines into 14 areas, separated in spheres of whiteand black interest. Along the “Native Area” shoreline, black fishers, who were encouraged tobecome “professionals”, would exploit the inshore fishery. Therefore the 26 camps in whichthey were located were strictly for fishing: permanent settlement and shoreline agriculturewere prohibited. The native areas were shared with white-owned concessionaires, who inaddition to their own fishing concession areas, would also purchase the fish from the blackfishers. The area demarcations and concessions allocated for fishing were changed in 1972 intoeight larger areas and again in 1976 into the present seven areas (Figure 1), (Marshall, Junorand Langerman, 1982; Karenge and Games, 1995), mainly to conserve the stocks and to meetthe demands for more recreational waters from the burgeoning tourist industry. Whilst the totalarea available for inshore fishing was reduced by these changes, the area allocated to localfishers was increased slightly. At present about 470 km2 (63 percent) of the fishable water onthe Zimbawean side is available to the inshore fishery (Marshall, Junor and Langerman, 1982)and the number of fishing villages has grown to about 40.
From the very beginning, the Zambian authorities took a different view. The interest of thelocal population was paramount and there was no racially based segmentation. The wholeZambian shoreline was designated as “Native trust land” and could not be utilized withoutconsent of the local people. Furthermore, the Zambian authorities initiated infrastructure andinstitutions for developing the fishery. A large resettlement compensation was paid to theGwembe Rural Council, mainly used for development of the fishery. In addition, a FisheriesTraining Centre was build in Sinazongwe with harbour, boat building, and ice plant facilities.Up to 1994 there were about 270 fishing villages on the Zambian shoreline, but these wereamalgamated into 67 villages in 1995 (Jul-Larsen, 2003). In Zimbabwe, preparations for the
1 Before 1964 called Northern and Southern Rhodesia under the Central African Federation of Rhodesia and Nyasaland.
Rev. 09/02/2004
73initial fishery were much more modest and little money was allocated for the fisherydevelopment. Since its beginning until today any kind of economic investment in the inshorefishery in Zimbabwe has been virtually absent (Marshall, Junor and Langerman, 1982;Bourdillon, Cheater and Murphree, 1985), in contrast with a relatively strong managementregime and enforcement capacity.
In Zimbabwe the inshore fishery is controlled by the State through the Department of NationalParks and Wildlife Management (DNPWM) who limits access, closes areas to fishing and restrictsfishing gear methods. A permit system is in place whereby the DNPWM informs the two riparianlocal authorities, the Nyaminyami (west) and Binga (east) District Councils (separated by theSengwe river in Basin 3), of the limits placed on the number of fishing permits that may be issuedfor the particular year. The Councils then issue these fishing permits to the individual fishers orfishing co-operatives. The distribution of permits per individual fisher can differ according to localauthorities. For example for the greater part of the 1980s individual fishers in Binga were allocated2.5 nets each whilst fishers in Nyaminyami were allowed five nets each. Fishing permits forfishers operation off state lands are issued directly from DNPWM. According to officially setlimits there should be a maximum of 2 530 nets on the Zimbabwian side of the lake belonging to771 fishers, independent fishers and cooperative members inclusive. It is however difficult toestablish how these effort limits were arrived at since it proved impossible to obtaindocumentation on the method used (Songore, 2000). The official limit, however, has never beenreviewed and the actual recorded number of nets and fishers, although fluctuating, for most of thetime has been below these values (Figure 4).
The fishing patterns are very simple because only one type of gear (gillnets) are usedthroughout the whole Zimbabwean inshore fishery. Fishing is not permitted using nets withless than a four-inch (102 mm stretched) mesh size. In addition explosives, chemicals, poisons,intoxicating substances, scoop nets, jigging and fish driving may not be used to catch fish.Fishing is also not permitted along parts of the shoreline (about 20 percent, Figure 1)belonging to the DNPWM, notably all the Chete Safari Area, most of the Matusadona NationalPark and parts of the Charara Safari Area. Other restrictions are in place for river mouths, largepopulation centres, harbours, and river estuaries. Fish net manufacturing is not permitted forpersons who do not hold a valid manufacturer and dealer’s license and fishing nets can onlybe sold to holders of valid fishing permits.
Two institutions dealing with the fishery resort under the DNPWM: The Lake Kariba FisheriesResearch Institute conducts research and collects data on the fish stocks, the fishers and theircatches, while the management branch of the DNPWM is tasked with policing the fishery.
In Zambia access to the fishery is free in principle and fishers can fish anywhere. When thelake was created the management regulations were similar to the other fisheries in the country,but these were seen as interim to be revised after obtaining further information (Malasha,2003). Initially, therefore, the legal minimum mesh size was set to four inches and a closedseason was to be observed from 16 December to 16 March. In 1962 the Department of Gameand Fisheries in Northern Rhodesia tried to abolish the mesh size regulation based on theresults of experimental fishing. However, the authorities in Southern Rhodesia rejected this onthe grounds that the Lake Kariba Fisheries Research Institute had not yet conducted sufficientexperiments to support this move. From the independence of Zambia in 1964 to 1986 no meshrestrictions for gillnet existed and beach seines were allowed. After 1986 the minimum mesh
Rev. 09/02/2004
74size for gillnets was set at three inches (76 mm) and beach seining was prohibited. In practice,however, there has been little enforcement due to lack of resources (Musando, 1996). Also thekutumpula method (fish driving) is very popular among fishers although it is officially bannedby the Fisheries Act (Scholz, 1993).
3. MATERIALS AND METHODS
3.1 Data: origin and treatment
Fish yield data collection in both Zambia and Zimbabwe has been in operation since thefishery started in 1961 (Zambia) and 1962 (Zimbabwe). In addition both the Lake KaribaResearch Unit (LKRU) in Sinazongwe (Zambia) and the Lake Kariba Fisheries ResearchInstitute (LKFRI) in Kariba town (Zimbabwe) (Figure 1) have carried out extensivemonitoring with experimental gillnets. Very little data, however, are available from Zambia inthe period 1974–1980 when the fishery was officially closed due to the Zimbabwean civil war.
Hydrological data were obtained from the Zambezi River Authority (ZRA) as daily lake levelrecordings, which were averaged on a monthly and annual basis (Figure 2).
3.2 Inshore fishery, Zimbabwe
Fisheries catch and effort data collection has been in operation since the fishery started in 1962on the Zimbabwean side. Until 1992 a data collection system referred to as Catch AssessmentSystem (CAS) was in place. From 1993 the CEDRS system, unified with Zambia, wasintroduced as one of the activities under the Zambian-Zimbawean SADC Fisheries Project.Artisanal fishing on the Zimbabwean shores of the lake is conducted in seven fishing areas (C1to C7, Figure 1). A description of these fishing areas and changes that they underwent duringthe history of the fishery is given in Marshall, Junor and Langerman (1982) and Karenge andGames (1995). A compilation and partial analysis of the catch-effort data on the Lake Karibaartisanal fishery in Zimbabwe is given in Songore (2000). Methods of data collection differedaccording to how fishing activities were organized. Operators of concessions (fishing areasC1, C3 and part of C5) were required to submit monthly returns of their daily catches, effort,and sales. The annual catch of this group was worked out from the returns. Data from theremaining fishing areas operated by the local communities were collected through anenumeration programme. Staff from LKFRI carried out enumeration in two fishing areas (C2and C4) while staff from the Binga District Administrator’s office enumerated catches from thethree other areas (part of C5, C6 and C7).
Prior to the intensification of the liberation war in Zimbabwe, data were collected fromgenerally all the fishing areas. Later, during the period 1975–1979, when the war escalated,data collection operations were disrupted with some of the sampling areas being abandoneddue to closure of fishing villages. This mostly affected data collection in fishing areas that werefished by local communities. The concessionaires continued sending in their catch, effort andsales returns undisrupted. Attempts to normalize data collection again were made in 1980when the war ended. However, due to inadequate manpower and financial constraints, it wasnot possible for LKFRI to cover all the landing sites using its own resources. Hence the BingaDistrict continued for some time to collect data from landing sites under their jurisdiction. But,data from these areas (C5 to C7) were sent in irregularly. From 1973 to 1984 total yield was
Rev. 09/02/2004
75estimated from mean monthly catch from all villages (where catches from villages notenumerated were estimated) through multiplication by 12 months and adding the reportedcatches from the concessionaires. From 1985 some of the concessionaires were transformedinto cooperatives, and during the period 1985–1992 enumeration activities were scaled downto ten fishing villages which were all in the areas C2 and C4. Therefore yield estimates for thewhole lake were based on extrapolation of data collected from C2 and C4.
A critical analysis of the sampling strategy and a number of recommendations were made bySanyanga, Lupikisha and Thorsteinson (1991). This led to the introduction in 1993 of theCEDRS in order to unify the data collection systems of Zambia and Zimbabwe. As it was foundimpossible to sample either all villages or the total landings for any particular village for thewhole year, ten representative villages were to be enumerated for ten days every month on eachside of the lake. The sampled catch was to be raised to an estimate of the total catch bymultiplying by the ratio between total number of days sampled and days in the year and the ratiobetween the number of fishers in the villages sampled and the total number of fishers. CEDRSonly operated well for a short period, but broke down due to diminishing human resources.Enumerators who retired, resigned or died were never replaced. Furthermore, very few of theproposed strategies for improving were implemented. Hence the quality of data collectedcontinued to be questionable in terms of representing the whole fishery (Songore, 2000).
Total yield estimates from 1985 to present have been calculated using the following formula:
(1) total # days = 365 until 1993, thereafter = 360.(2) from 1985 to 1992 total # fishers used in the calculation was constant (= 765), from1993 the total # fishers was obtained from Frame surveys, keeping the number constantin between each survey.
3.3 Inshore fishery, Zambia
Scholz (1993) gives a detailed account of various sampling designs used and an analysis of thedata from 1961–1990. Aggregated data from his thesis are used for the period 1961–1980.Data from 1980 to 1999 are based on a compilation and partial analysis of the catch-effort dataon the Lake Kariba artisanal fishery in Zambia by Musando (2000). Two different systems ofcollecting catch-effort data have been used. From 1980 to 1993 the so-called CAS (CatchAssessment Surveys) was used, a two stage stratified random sampling system to estimatecatch rates (Cpue) supplemented by a framesurvey to count total effort (f) and activity level(A), based on which total catch (C) could be estimated (). During three survey days atrandomly selected sampling units (PSUs), fishers met at their landing sites were asked toreport on catch, mesh sizes and number of nets set. Settings with no catch are said to have beenreported as well. The catch was identified by fish family and weighed in kilos. The “CEDRS”(Catch and Effort Data Recording System) was introduced during 1993; in order to unify thedata recording system with the Zimbabwean side of the lake. The CEDRS programme wasdesigned to carry out the survey for ten days per month per stratum (Figure 1), in ten selectedfishing villages, as well as record catch rate by species name other than the family name.
Rev. 09/02/2004
76Unfortunately the execution of the sampling programme for both the CAS/CEDRS designs hasbeen highly irregular due to budget shortcomings and lack of staff (Scholz, 1993, Musando,2000). Moreover, it appears that the total estimated effort is made as a simple summation ofstrata sampled, irrespective on the number of strata actually sampled. In this way, the “effort”thus becomes a function of number of strata and on the number of times each strata has beensampled during a year (Musando, 2000).
3.4 Frame surveys on Lake Kariba
Lake wide frame surveys on Lake Kariba were initiated in 1990 under the auspices of theZambia/Zimbabwe SADC Fisheries Project (ZZSFP) and repeated in 1993. Additional framesurveys have been conducted in 1995 and 1999 on the Zambian side and in 1998 and 2000 onthe Zimbabwean side.
3.5 Experimental data
Since 1960 LKFRI in Zimbabwe has conducted an experimental gillnet fishery at Lakesidestation close to Kariba town in the Sanyati basin (Basin 5, Figure 1). Here commercial fishingwas only permitted between 1962 and 1972 (Kenmuir, 1984) and limited fishing took placefrom 1977 to 1980, but this probably had little effect on the fish stocks (Marshall, 1984).Experimental fishing during the early years was somewhat sporadic with few settings(Kenmuir, 1984). However, from 1970 to 1975 settings were done twice a month and since1976 sampling has been done weekly, except for 1981 when no fishing took place (Karenge,1992; Karenge and Kolding, 1995a). The sampling design has remained constant over thewhole period and consists of multifilament nets in multimesh fleets with 12 panels rangingfrom 38 mm to 178 mm stretched mesh sizes with 12.5 mm increments. The fleet, 550 m intotal length, was set overnight perpendicular to the shore with the smaller meshes inshore.Each individual fish caught was recorded for species, mesh size, weight, length, sex andmaturity stage. All experimental gillnet data from 1969 to 1999 have been digitized intoPASGEAR (Kolding, 2001) which now contains more than 185 000 individual fish recordsfrom 39 species and represents more than 14 000 panel settings. A detailed analysis of this dataset up to 1992 is given in Karenge (1992) and Karenge and Kolding (1995a).
In Zambia, the Lake Kariba Research Unit (LKRU) under DoF, based in the former FisheryTraining Centre in Sinazongwe, has carried out an experimental fishing with multimeshgillnets since 1980. Under this programme, every month three experimental localities(stations) were sampled for three consecutive days. Multifilament nets were in use during 1980to May 1984 and also from 1992 to 1995, whereas monofilament nets were used between June1984 to part of 1992 and 1993. Both gear types were set at a hanging ratio of 0.5. A fleet ofnets with stretched mesh sizes ranging from 25 mm to 178 mm with 12.5 mm increments, wereset. A detailed description and analysis of these data up to 1995 is given in Musando (1996).All experimental gillnet data from 1980 to 1999 have been digitized into PASGEAR. Thedatabase now contains more than 118 000 individual fish records from 36 species andrepresents more than 13 000 panel settings. Unfortunately, the choice in stations sampledduring this programme has shifted repeatedly, the gillnet fleets were not always complete dueto difficulties in replacing worn out nets while the sampling programme occasionally was notcarried out because of fuel-shortages, net thefts and bad weather. For the present analysis, dueto the irregular sampling design, only the most used sampling stations in close proximity to
Rev. 09/02/2004

77Sinazongwe (Charlets Island (st.12), Samaria Island (st.21), Zongwe estuary (st.42), Ngoma(st.82), and Nang’ombe (st.132)), have been included (Figure 1). From 1994 to 1995 onlyCharlets Island and Zongwe estuary were sampled. From 1996 to 1999 only Zongwe estuaryremained in the sampling programme. Furthermore, only the mesh sizes in the range 50 mmstretched to 152 mm stretched have been included as only this part of the fleet was more orless complete (except for 1989 when only mesh sizes from 89 mm to 152 mm were used).
Catch per unit effort (C/f) in the both the Zambian and Zimbabwean experimental fishery isexpressed as catch (kilo wet weight or number of fish) per standard gear unit per setting. Thestandard gear unit of each mesh size is one panel of 45 m (50 yards) long.
3.6 Multiple regression of hydrology and fishing effort on catch rates
Multiple regressions were performed with mean annual total catch rates (CPUE) as dependentvariable, and hydrological indices and effort as independent variables. From the monthly orannual mean lake levels five differently time-lagged indices for the hydrological dynamics inLake Kariba were tested following (Karenge and Kolding, 1995b):
The absolute mean annual lake levels (m a.s.l.).The annual amplitude (m), i.e. the difference between the lowest and highest recorded levelwithin one year.Delta (Î) lake levels (m), defined as the difference between the mean annual lake levels of oneyear and the immediately preceding year. This will permit the estimation of the effect inchange of lake level of one year on the catch rate the succeeding year.A combination of 2) and 3) by adding the two figures (Î lake level + amplitude), thus takinginto account the combined effect of two consecutive years.The Îy + Îy-1 (m), which is the sum of the delta lake levels of one and the preceding year,thus giving the combined effect of three consecutive years.
Fishing effort was expressed as total annual number of nets or fishers (inshore fisheries) ortotal annual boat nights (Kapenta fishery).
Using cross-correlations, where all variables were made orthogonal by subtracting the meanfrom the original series, it was established whether there was a lag-phase between detrendedannual mean water levels and detrended annual mean catch rates, and which of thehydrological variables was more informative. The rise in lake level normally terminates inMay-June every year, whereas the lowest lake levels normally are found in lateDecember–early January. The annual fishery statistics are the average of the whole year, butwith generally higher catches in the latter part of the year during low lake levels (Marshall,1988; Karenge, 1992).
The multiple regressions were always of the form:
CPUEi = µi + efforti + hydrological indexlag(x) + effortChydrological indexlag(x) + εi
Rev. 09/02/2004
78Where, CPUEi = time series of annual mean catch ratesµi = overal meanefforti = total number of nets, fishers, or boat nights for yearihydrological indexlag(x) = one of the 5 hydrological indices at lag(x), x = 0 – 5effortAhydrological indexlag(x) = interaction of effort and hydrological index at lag(x)εi = residual error
In all cases non-significant explanatory variables were removed from the model using stepwiseregression. The interaction effect is interpreted as reflecting possible changes in catch rateeither as a result of changes in efficiency or of usage of gears in relation to water levels. Incase of confounded effects between effort and hydrological variables (i.e. when both variableswere significant alone, but one or the other fell out in the combined model) interaction wasalways high and cannot be interpreted. All statistical analyses were carried out using Statistica(StatSoft ®).
4. RESULTS AND DISCUSSION
4.1 Development of the Kapenta fishery
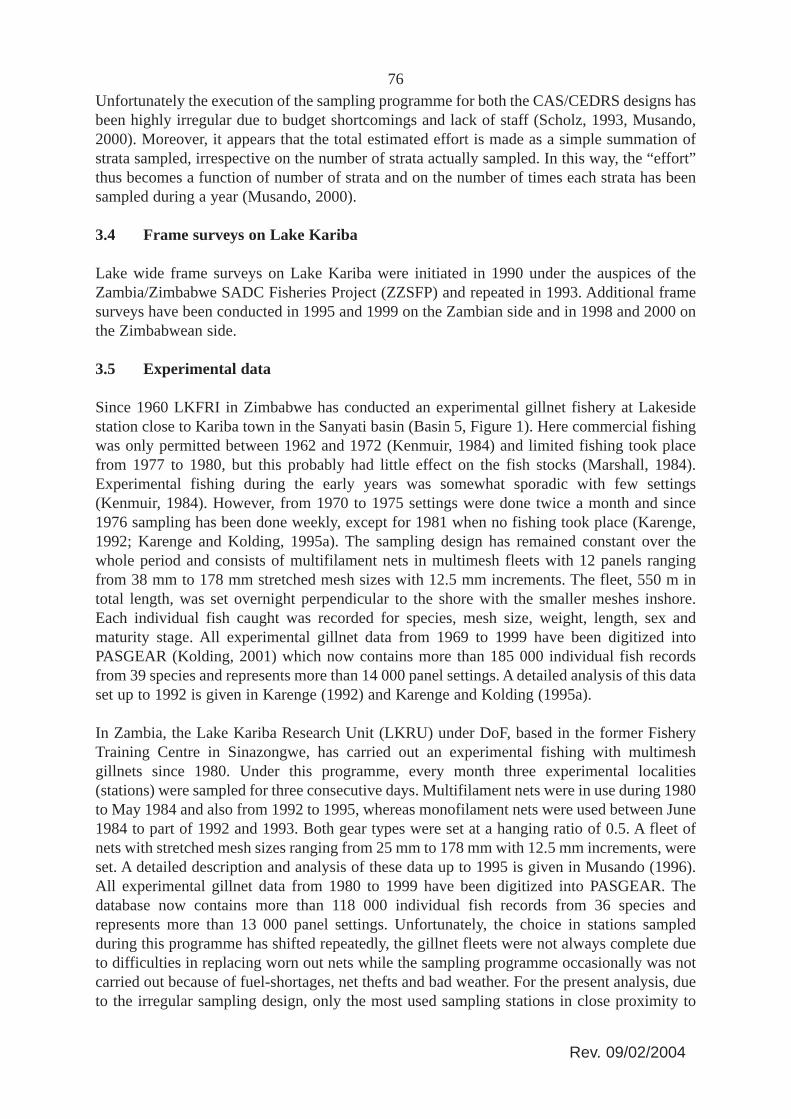
From a pre-impoundment study, Jackson (1961) predicted that the pelagic habitat of LakeKariba would remain non-colonized since the species present in the Zambezi river had evolvedin a riverine habitat and would therefore only inhabit the shallow littoral zones. Coke (1968)and Mitchell (1978) later confirmed this. Following Jackson’s recommendation Kapenta,Limnothrissa miodon, (a small pelagic clupeid, which in Kariba reaches a size of around fivecentimetres) was introduced by the Zambian government into Lake Kariba between 1967 and1969 from Lake Tanganyika (Bell-Cross and Bell-Cross; 1971, Junor and Begg, 1971). Theintroduction was a success and, although the colonial Rhodesian Government was notinformed about the introduction, the researchers at the Lake Kariba Fisheries Instituteobserved the widespread presence already in 1969. Commercial Kapenta fishing, or theoffshore fishery, began in July 1973 in Zimbabwe with a single purse-seiner. But effort grewrapidly (Figure 3) and from 1976 this fishery changed to using lift nets from pontoons at nightwith light attraction, which considerably increased the catch rates. From 1978 the fisherystarted to expand along the Zimbabwean shoreline to six different bases, and in 1981, after thetermination of the civil war in Zimbabwe, this fishery started in Zambia (Overå, 2003). Thepredominantly white-owned, capital intensive Kapenta fishery has now developed into amillion dollar industry, with between 20 and 30 000 t landed annually, economically vastlyoutstripping the inshore fishery, and with theoretical potential for further expansions (Anon.,1992; Machena, Kolding and Sanyanga, 1993; Marshall, 1992, 1993; Kolding, 1994). TheKapenta fishery alone, through its profitability, is according to Bourdillon, Cheater andMurphree (1985) directly responsible for most of the infrastructural development that hasoccurred on the Zimbabwean shoreline. Cheater (1985) gives a detailed account of thedevelopment of this fishery in Zimbabwe until the mid 1980s. From the early 1990s no newlicenses were issued in Zimbabwe and the effort development seemed also to stabilize inZambia around this time (Figure 3) with a corresponding stabilization in catch rates of 150-200 kg per rig per night in both countries. From 1998 there has been a decrease in the reportedZimbabwean effort.
Rev. 09/02/2004
79
FIGURE 3. Development in the offshore Kapenta fishery in Zimbabwe (1974-2000) andZambia (1982-2000). CPUE in tonnes/boat night. Note effort values have been multiplied by0.1 for scaling reasons. Source: Zambia-Zimbabwe Fisheries Joint Annual Statistical reports.
4.2 Development in inshore fisheries
Commercial gillnet fishing started on the Zambian shore in 1958 immediately after theimpoundment had begun, and from 1962 on the Zimbabwean side because the authoritieswanted the filling and stocking complete before a fishery was initiated (Minshull, 1973;Bourdillon, Cheater and Murphree, 1985). Initially, the catches were very high due to theeutrophic state of the lake from the fresh inundation and the rapid colonization of opportunisticriverine detritus feeding species such as mudfish (labeo’s) and distichodontids. In 1962 thecatches started to decline in Zambia, followed by Zimbabwe four years later (Minshull, 1973).This initial boom and bust of the catches was reflected in the fishing effort. By 1962 about2,500 fishers were operating on the Zambian side producing around 3 000 tonnes of fish,whereas by 1967 the number of fishers had decreased to less than 500 (Scudder, 1967; Jul-Larsen, 2003; Overå, 2003), (Figure 6). Similarly, on the Zimbabwean side the number offishers peaked at just over 1 000 in 1966, subsequently declining to less than 500 in 1971(Minshull, 1973) (Figure 4).
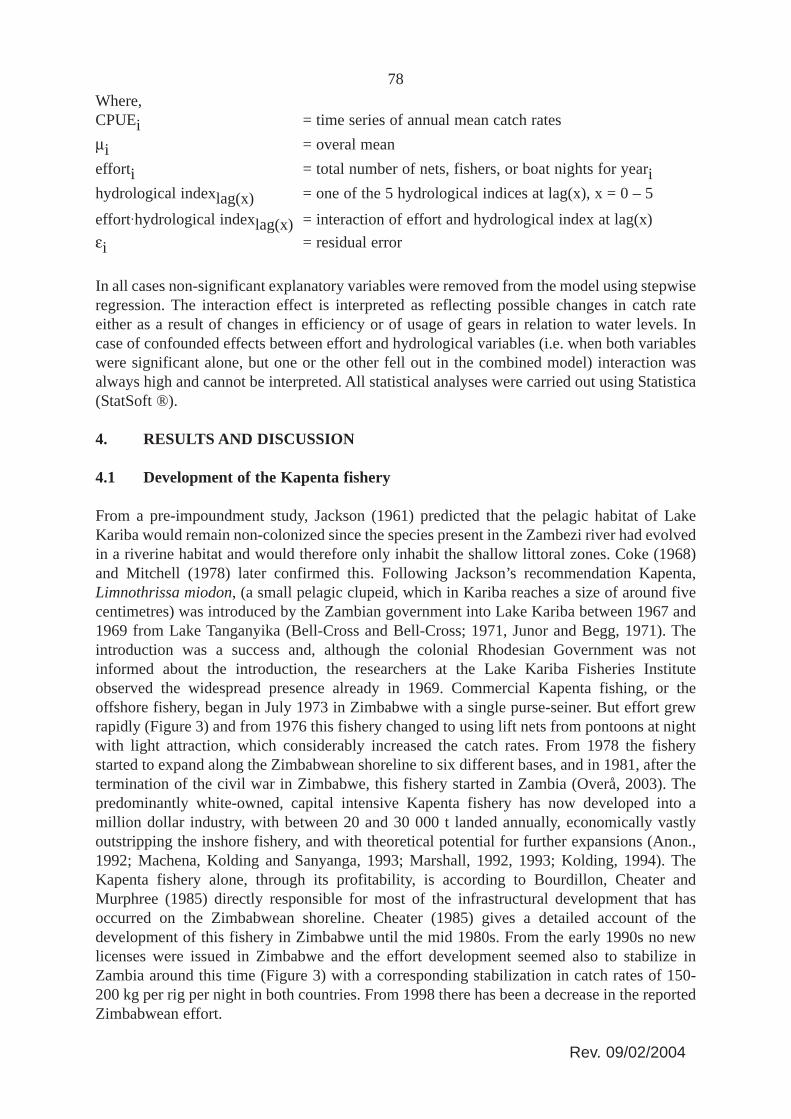
The number of fishers in Zimbabwe increased again during the 1980s with a subsequentdecline during the 1990s to same low level as the 1970s (Figure 4). The number of nets perfisher in Zimbabwe, however, has remained relatively stable around an average value of 4+1.5SD (Figure 4) with no significant development over time.
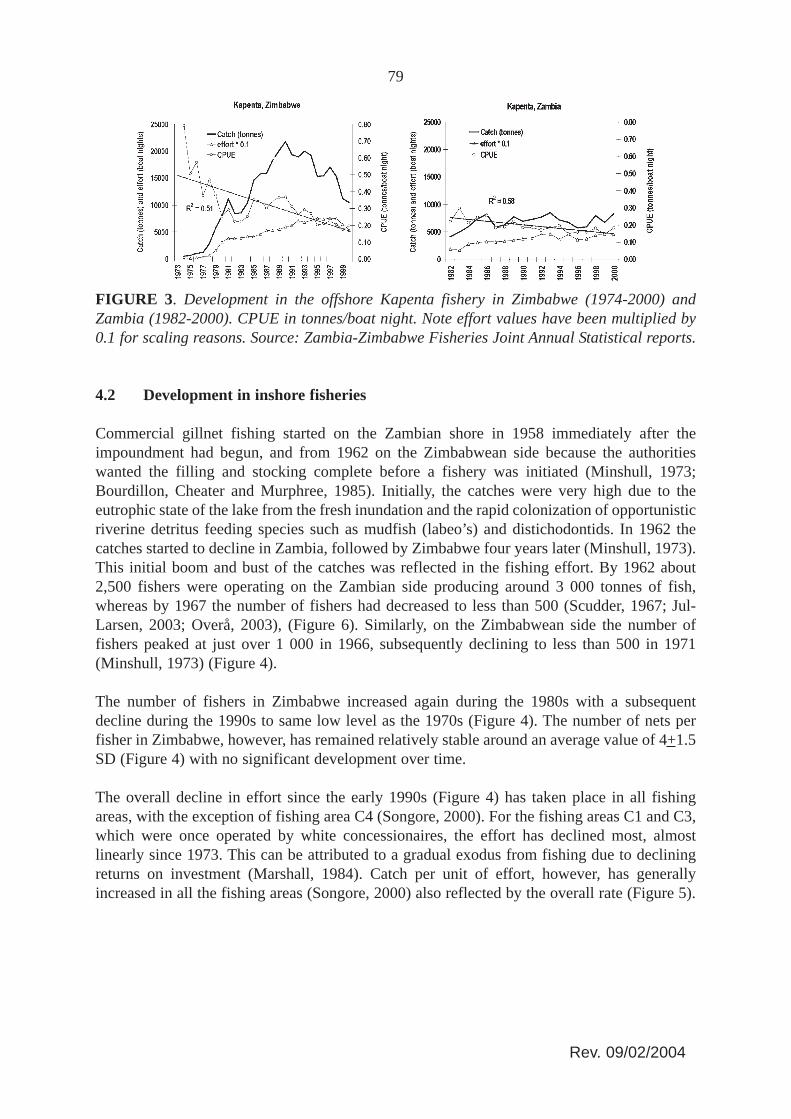
The overall decline in effort since the early 1990s (Figure 4) has taken place in all fishingareas, with the exception of fishing area C4 (Songore, 2000). For the fishing areas C1 and C3,which were once operated by white concessionaires, the effort has declined most, almostlinearly since 1973. This can be attributed to a gradual exodus from fishing due to decliningreturns on investment (Marshall, 1984). Catch per unit of effort, however, has generallyincreased in all the fishing areas (Songore, 2000) also reflected by the overall rate (Figure 5).
Rev. 09/02/2004
80
FIGURE 4. Estimated total annual effort (numbers of fishers and nets) and reported annualyield (tonnes) from the Zimbabwean inshore fishery between 1962 to 1999. Source: Songore(2000).
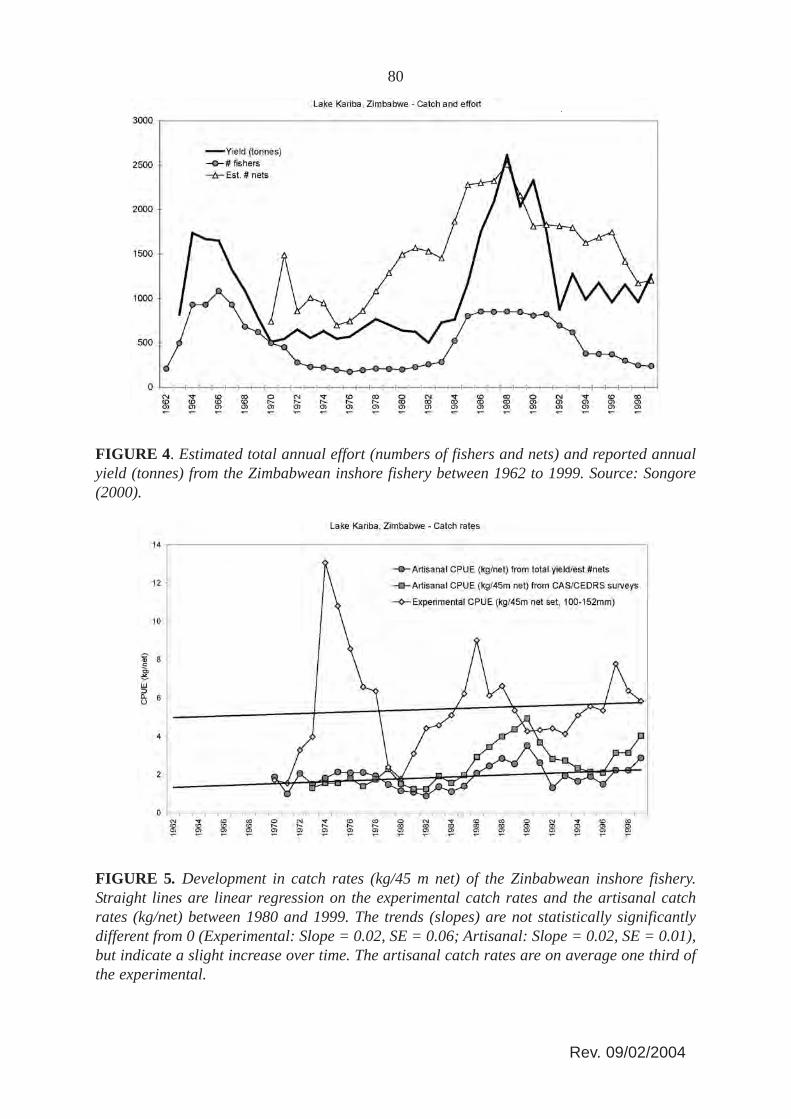
FIGURE 5. Development in catch rates (kg/45 m net) of the Zinbabwean inshore fishery.Straight lines are linear regression on the experimental catch rates and the artisanal catchrates (kg/net) between 1980 and 1999. The trends (slopes) are not statistically significantlydifferent from 0 (Experimental: Slope = 0.02, SE = 0.06; Artisanal: Slope = 0.02, SE = 0.01),but indicate a slight increase over time. The artisanal catch rates are on average one third ofthe experimental.
Rev. 09/02/2004
81Both the artisanal and experimental catch rates in the Zimbawean inshore fishery show thesame overall trend since 1970 (Figure 5). Since the Lakeside station is in an unfished area, thisindicates that the overall development in the inshore biomass appears to be independent of thechange in fishing effort. It also indicates that the efficiency of the fishers (catchabilitycoefficient) has not changed much over time which does not sustain the general notion that thefishers are increasingly under-reporting the number of nets used (e.g. Sanyanga, Lupikisha andThorsteinson, 1991). Mean annual fishing effort (Figure 4) consistently has been operatingbelow the maximum legal limit of 2 530 nets. This may be due to fishers being unable to securefishing gear or some fishers being passive, keeping their licenses so as to utilize them in timesof hardships. Fishers have always indicated that it is very difficult to acquire fishing gear(Songore, 2000). The average catch rates in the fished areas, however, are generally only onethird of the experimental catch rates: this difference could be attributed to fishing.
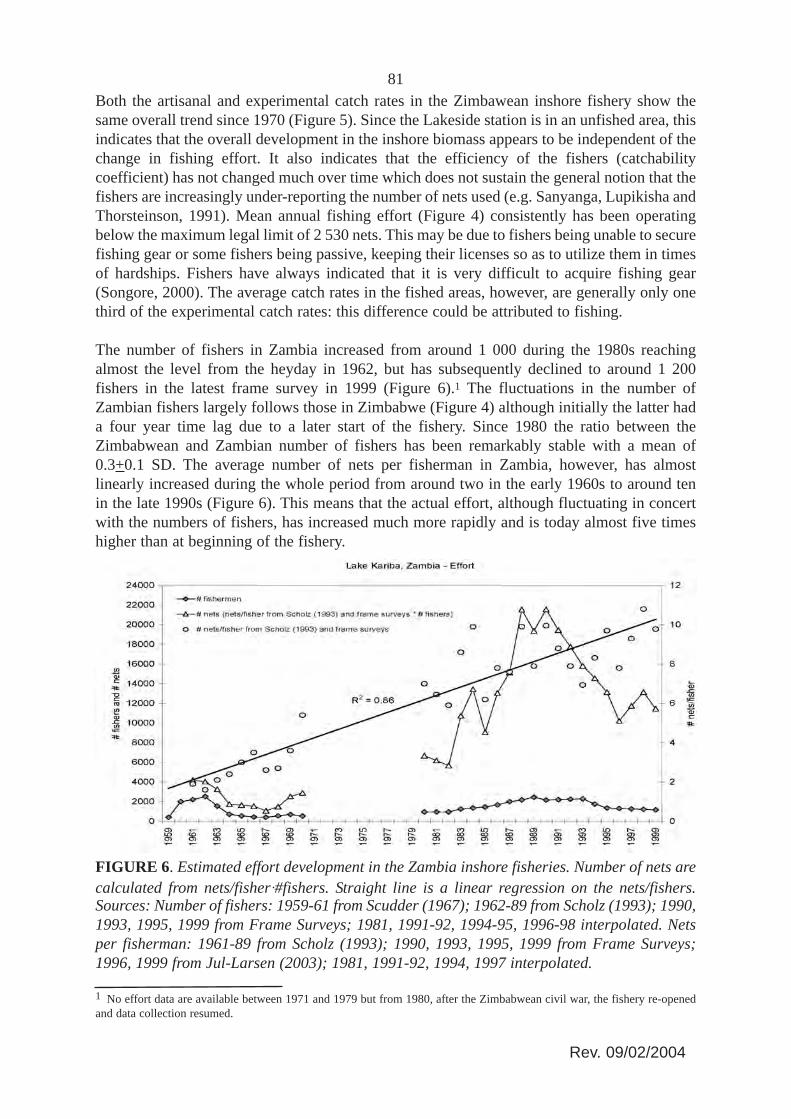
The number of fishers in Zambia increased from around 1 000 during the 1980s reachingalmost the level from the heyday in 1962, but has subsequently declined to around 1 200fishers in the latest frame survey in 1999 (Figure 6).1 The fluctuations in the number ofZambian fishers largely follows those in Zimbabwe (Figure 4) although initially the latter hada four year time lag due to a later start of the fishery. Since 1980 the ratio between theZimbabwean and Zambian number of fishers has been remarkably stable with a mean of0.3+0.1 SD. The average number of nets per fisherman in Zambia, however, has almostlinearly increased during the whole period from around two in the early 1960s to around tenin the late 1990s (Figure 6). This means that the actual effort, although fluctuating in concertwith the numbers of fishers, has increased much more rapidly and is today almost five timeshigher than at beginning of the fishery.
FIGURE 6. Estimated effort development in the Zambia inshore fisheries. Number of nets arecalculated from nets/fisherA#fishers. Straight line is a linear regression on the nets/fishers.Sources: Number of fishers: 1959-61 from Scudder (1967); 1962-89 from Scholz (1993); 1990,1993, 1995, 1999 from Frame Surveys; 1981, 1991-92, 1994-95, 1996-98 interpolated. Netsper fisherman: 1961-89 from Scholz (1993); 1990, 1993, 1995, 1999 from Frame Surveys;1996, 1999 from Jul-Larsen (2003); 1981, 1991-92, 1994, 1997 interpolated.
1 No effort data are available between 1971 and 1979 but from 1980, after the Zimbabwean civil war, the fishery re-openedand data collection resumed.
Rev. 09/02/2004
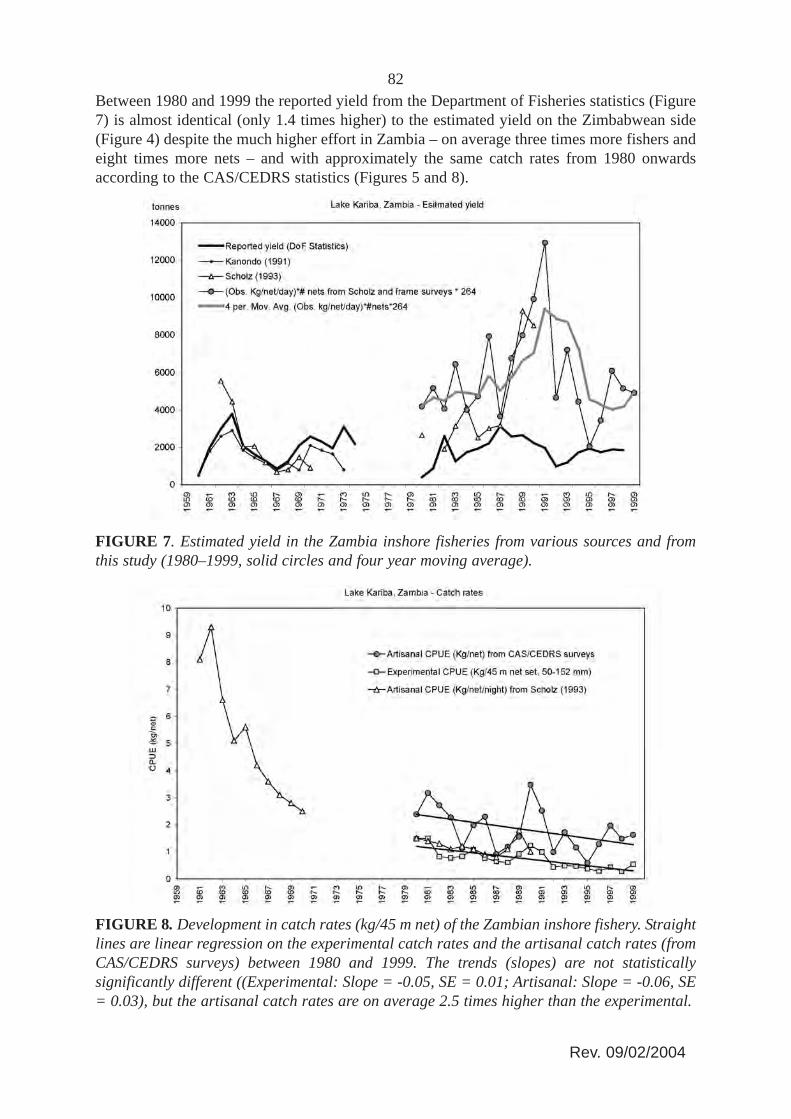
82Between 1980 and 1999 the reported yield from the Department of Fisheries statistics (Figure7) is almost identical (only 1.4 times higher) to the estimated yield on the Zimbabwean side(Figure 4) despite the much higher effort in Zambia – on average three times more fishers andeight times more nets – and with approximately the same catch rates from 1980 onwardsaccording to the CAS/CEDRS statistics (Figures 5 and 8).
FIGURE 7. Estimated yield in the Zambia inshore fisheries from various sources and fromthis study (1980–1999, solid circles and four year moving average).
FIGURE 8. Development in catch rates (kg/45 m net) of the Zambian inshore fishery. Straightlines are linear regression on the experimental catch rates and the artisanal catch rates (fromCAS/CEDRS surveys) between 1980 and 1999. The trends (slopes) are not statisticallysignificantly different ((Experimental: Slope = -0.05, SE = 0.01; Artisanal: Slope = -0.06, SE= 0.03), but the artisanal catch rates are on average 2.5 times higher than the experimental.
Rev. 09/02/2004
83These data strongly suggests that the reported Zambian yield is seriously underestimated, aswas concluded by Scholz (1993) and Scholz, Mudenda and Moller (1997) as well. By usingScholz’s (1993) figures of average active fishing days per fisher of 264 per year times theobserved catch per net per day from CAS/CEDRS (Musando, 2000), and the estimated numberof nets, a re-calculated estimate of the annual yields in the Zambian inshore fishery has beenmade (Figure 7). For the period 1980–1999 these recalculated yield estimates are on averagethree times higher than the reported yield.
After the initial boom in the Zambian fishery a strong decrease in the catch rates between 1962and 1970 occurred (Figure 8). From 1980 to 1999 the trend continued to decline, although ata much lower rate. The experimental and artisanal catch rates follow the same trend, but incontrast to the Zimbabwean side, the enumerated artisanal catch rates are on average 2.5 timeshigher than the experimental (Sinazongwe area) for the same range of mesh sizes. Thisdifference could be attributed to the different experience and ways of setting the nets betweenfishers and research personnel. A similar much lower catch rate of the research personnelcompared with the full-time fishers was observed in Bangweulu (Kolding, Ticheler andChanda, 1996, 2003).
4.3 Seasonal and geographical differences
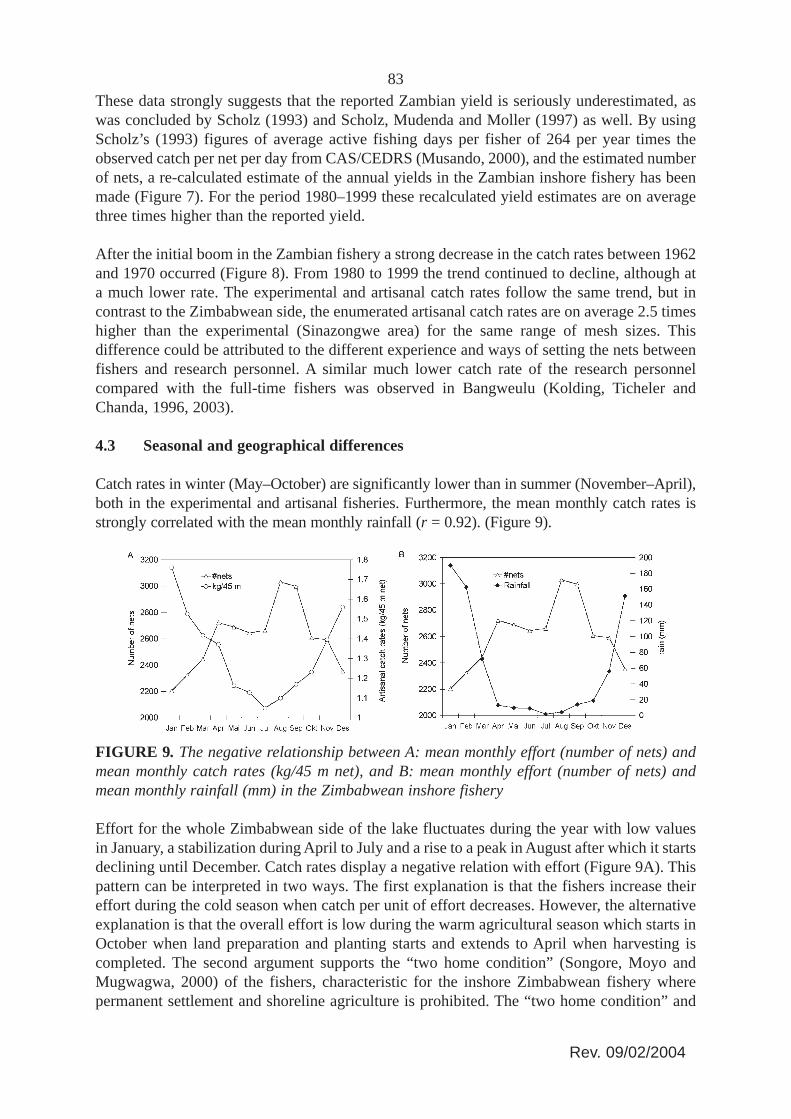
Catch rates in winter (May–October) are significantly lower than in summer (November–April),both in the experimental and artisanal fisheries. Furthermore, the mean monthly catch rates isstrongly correlated with the mean monthly rainfall (r = 0.92). (Figure 9).
FIGURE 9. The negative relationship between A: mean monthly effort (number of nets) andmean monthly catch rates (kg/45 m net), and B: mean monthly effort (number of nets) andmean monthly rainfall (mm) in the Zimbabwean inshore fishery
Effort for the whole Zimbabwean side of the lake fluctuates during the year with low valuesin January, a stabilization during April to July and a rise to a peak in August after which it startsdeclining until December. Catch rates display a negative relation with effort (Figure 9A). Thispattern can be interpreted in two ways. The first explanation is that the fishers increase theireffort during the cold season when catch per unit of effort decreases. However, the alternativeexplanation is that the overall effort is low during the warm agricultural season which starts inOctober when land preparation and planting starts and extends to April when harvesting iscompleted. The second argument supports the “two home condition” (Songore, Moyo andMugwagwa, 2000) of the fishers, characteristic for the inshore Zimbabwean fishery wherepermanent settlement and shoreline agriculture is prohibited. The “two home condition” and
Rev. 09/02/2004

84seasonally fluctuating effort clearly indicates that the original intentions of making theZimbabwean inshore fishers “professionals” has never succeeded and that fishing is for manyonly one of several activities.
FIGURE 10. A: Mean annual effort (km net) with 2ASE error bars, and B: mean annual catchper unit effort (kg/45 m net) by major families in fishing areas C1..C7 in the Zimbabeaninshore fishery for the period 1980 to 1999.
The mean annual effort and the mean annual catch rates are not uniform along the east-westgradient of the lake (Figure 10). Fishing area C2 between the Gachegache and Sanyati rivershas in general had the highest average effort, but also the highest variation. Otherwise there isa general decline in effort from the lacustrine eastern basin to the more riverine west of thelake. However, the average catch rates in each fishing area (Figure 10B) shows no apparentrelation with the overall effort. This indicates that the effort distribution is more a result ofvicinity to markets and the better infrastructure in Basin 5, and that catch rates and effort arelargely independent. The catch composition, however, reflects the natural gradient in the lakeecosystem where cichlids are dominant in Basins 4 and 5 whereas large cyprinids anddistichodontids become increasingly important towards Basin 1 concomitant with overalllower catch rates. The characids, dominated by tigerfish (Hydrocynus vittatus) are moreuniformly distributed, but with higher catch rates in fishing areas associated with largertributaries into the lake, such as the Sanyati river (C2) and the Bumi river (C4).
4.4 Changes in fishing pattern and species composition
FIGURE 11. Changes in recorded mesh size distribution in the Zambian inshore fishery. A:relative distribution of mesh sizes from 1980 to 1999, and B: average mesh size from 1961 to1999. 1961-1970 data from Scholz (1993), 1980-1999 data from Musando (2000).
Rev. 09/02/2004
85During the first decade of the Zambian fishery the average mesh-size ranged between 140-152 mm(Scholz, 1993, Figure 11). From 1980, when monitoring resumed, to 1999 the average mesh-size in the inshore fishery decreased from 120 mm to 90 mm (Figure 11). In addition to asignificant decrease in the mesh sizes used, the Zambian inshore fishers are reported toextensively use fish driving techniques (Kutumpula) to catch bream (Scholz, 1993; Malasha,2003). In Zimbabwe most fishers initially used 150-175 mm mesh until around 1970. As thecatches of the large migrating fish (labeo’s and distochodontids), remnants from the firstinundation period, decreased, the use of smaller mesh sizes increased gradually and by 1978about 60 percent of the nets were in the range 112–125 mm (Marshall, Junor and Langerman,1982). In the frame surveys of 1993, 1998 and 2000, the average mesh sizes were 128, 115 and118 mm respectively (Songore, 2000). In general there has been no significant changes in thefishing pattern of inshore Zimbabwean fishery since the 1970s.
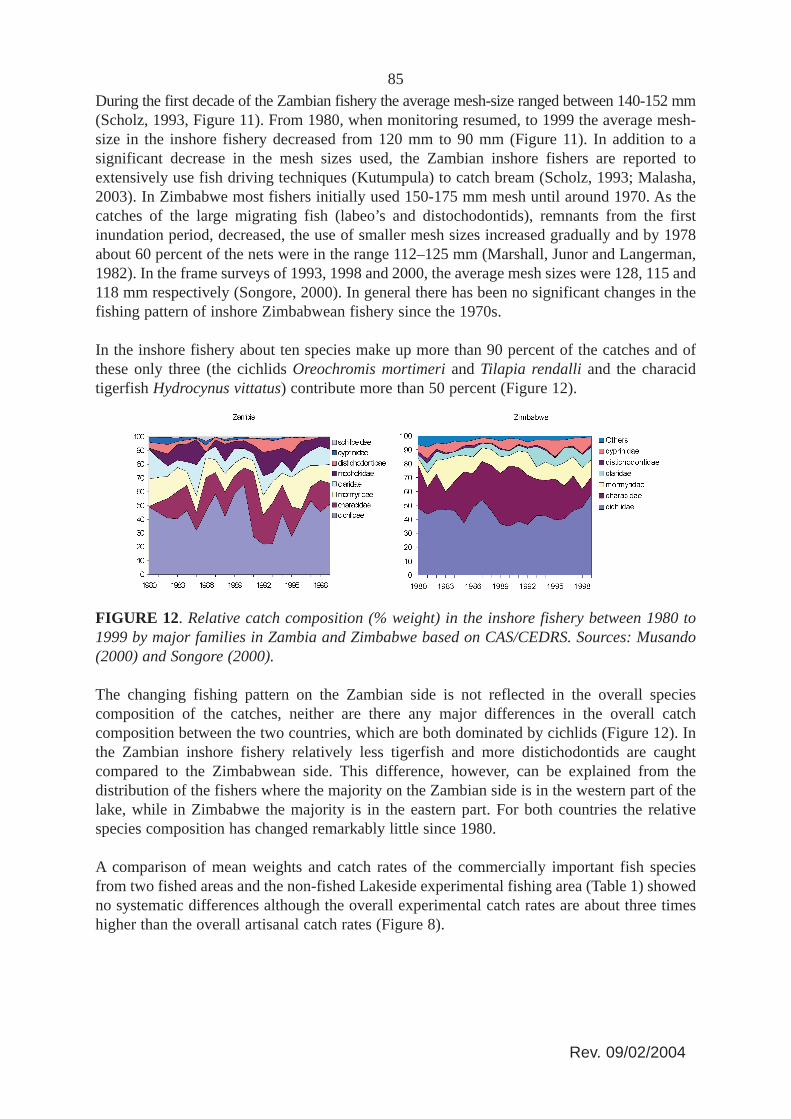
In the inshore fishery about ten species make up more than 90 percent of the catches and ofthese only three (the cichlids Oreochromis mortimeri and Tilapia rendalli and the characidtigerfish Hydrocynus vittatus) contribute more than 50 percent (Figure 12).
FIGURE 12. Relative catch composition (% weight) in the inshore fishery between 1980 to1999 by major families in Zambia and Zimbabwe based on CAS/CEDRS. Sources: Musando(2000) and Songore (2000).
The changing fishing pattern on the Zambian side is not reflected in the overall speciescomposition of the catches, neither are there any major differences in the overall catchcomposition between the two countries, which are both dominated by cichlids (Figure 12). Inthe Zambian inshore fishery relatively less tigerfish and more distichodontids are caughtcompared to the Zimbabwean side. This difference, however, can be explained from thedistribution of the fishers where the majority on the Zambian side is in the western part of thelake, while in Zimbabwe the majority is in the eastern part. For both countries the relativespecies composition has changed remarkably little since 1980.
A comparison of mean weights and catch rates of the commercially important fish speciesfrom two fished areas and the non-fished Lakeside experimental fishing area (Table 1) showedno systematic differences although the overall experimental catch rates are about three timeshigher than the overall artisanal catch rates (Figure 8).
Rev. 09/02/2004
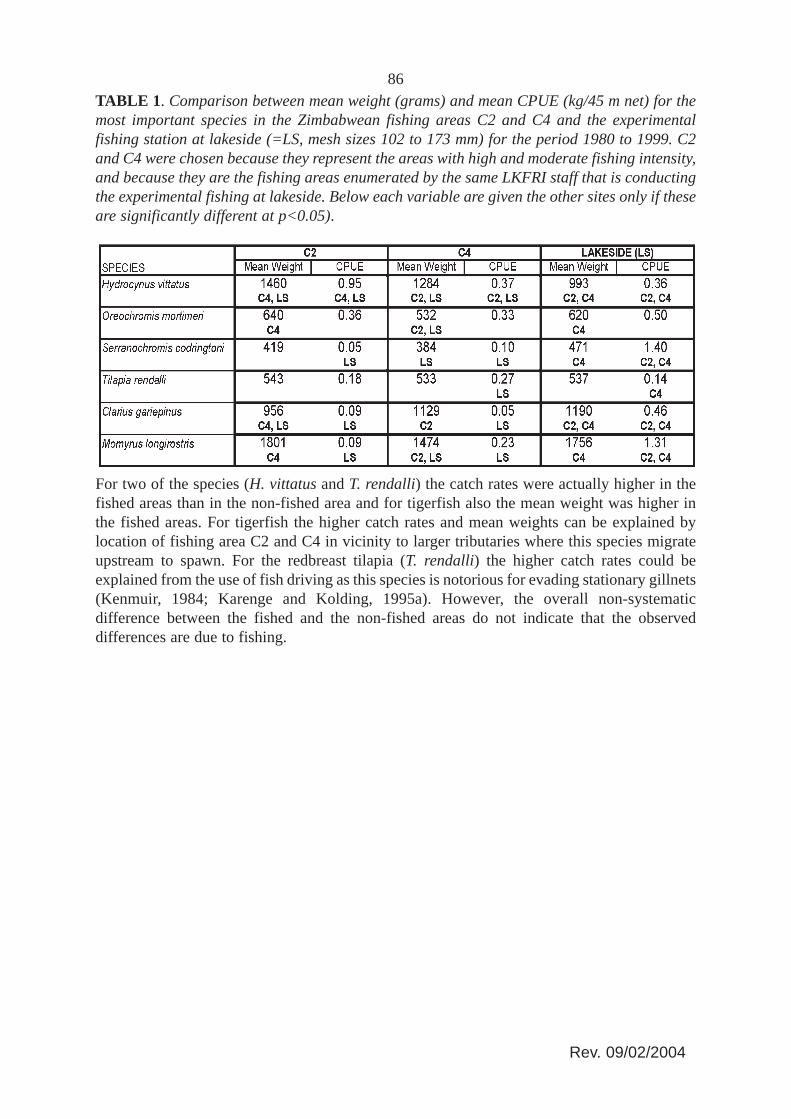
86TABLE 1. Comparison between mean weight (grams) and mean CPUE (kg/45 m net) for themost important species in the Zimbabwean fishing areas C2 and C4 and the experimentalfishing station at lakeside (=LS, mesh sizes 102 to 173 mm) for the period 1980 to 1999. C2and C4 were chosen because they represent the areas with high and moderate fishing intensity,and because they are the fishing areas enumerated by the same LKFRI staff that is conductingthe experimental fishing at lakeside. Below each variable are given the other sites only if theseare significantly different at p<0.05).
For two of the species (H. vittatus and T. rendalli) the catch rates were actually higher in thefished areas than in the non-fished area and for tigerfish also the mean weight was higher inthe fished areas. For tigerfish the higher catch rates and mean weights can be explained bylocation of fishing area C2 and C4 in vicinity to larger tributaries where this species migrateupstream to spawn. For the redbreast tilapia (T. rendalli) the higher catch rates could beexplained from the use of fish driving as this species is notorious for evading stationary gillnets(Kenmuir, 1984; Karenge and Kolding, 1995a). However, the overall non-systematicdifference between the fished and the non-fished areas do not indicate that the observeddifferences are due to fishing.
Rev. 09/02/2004

874.5 Development of catch rates in the experimental fishing nets The development of catch rates in the experimental fishing nets on the Zimbabwean side (the unfished Lakeside station) and the Zambian side (Sinazongwe area) show clear differences (Figure 13). In 1980 when the Zambian fishery reopened after the closure due to the war, catch rates on the two sides were almost similar. After this first year, however, the two time series rapidly separated with an increasing trend at Lakeside and a decreasing trend in Zambia. The trends in the two countries are similar to the trends in the inshore fisheries respectively (Figures. 5 and 8). However, the average experimental catch rate in Zambia is about seven times lower compared to Lakeside from the mid 1980s.
Lake Kariba (experimental CPUE, mesh 51-152 mm)
R2 = 0.1935
R2 = 0.5817
0
2
4
6
8
10
12
14
1970
1972
1974
1976
1978
1980
1982
1984
1986
1988
1990
1992
1994
1996
1998
2000
CPU
E (k
g/se
t)
Zimbabwe (Lakeside)
Zambia (Sinazongwe)
FIGURE 13. Mean catch rates (kg/set) in the experimental fishery (mesh size range 52-152 mm) on the Zimbawean and the Zambian side of Lake Kariba. 95 percent confidence intervals are indicated for 1980 when the Zambian inshore fishery reopened and the trend lines (both significantly different from 0) represent the period 1980 to 1999.
Lake Kariba (experimental mesh 51-152 mm)
R2 = 0.0261
R2 = 0.1622
0
100
200
300
400
500
600
700
800
900
1000
1970
1972
1974
1976
1978
1980
1982
1984
1986
1988
1990
1992
1994
1996
1998
2000
Mea
n w
eigh
t (gr
ams)
Zimbawe (Lakeside)
Zambia (Sinazongwe)
Zambia trend (1980-1994)
FIGURE 14. Development in the mean weight of individual fish in the experimental gillnets on the Zimbawean and the Zambian side of Lake Kariba. The trend line for Zimbabwe (1970-1999) is significantly different from 0, whereas the trend line for Zambia (1980-1994) is not significantly different from 0.
88Although the development in the mean weights of the experimental catches (Figure 14) showthe same trends as catch rates (increasing in Zimbabwe and decreasing in Zambia), the actualvalues were higher in Zambia until 1994 when the sampling areas were limited to around theZongwe estuary (Figure 1). The higher mean weight in the Zambian experimental gillnets canbe attributed to the much higher proportion of tigerfish and distichodontids than the Lakesidedata dominated by cichlids. Similarly the strong decrease in the Zambian mean weight after1994 is due to the predominance of squeakers (Synodontis zambezensis) in the Zongwe esturay(Figure 15) which means that the experimental gillnet data series in Zambia is not mutuallyrepresentative before and after 1994.
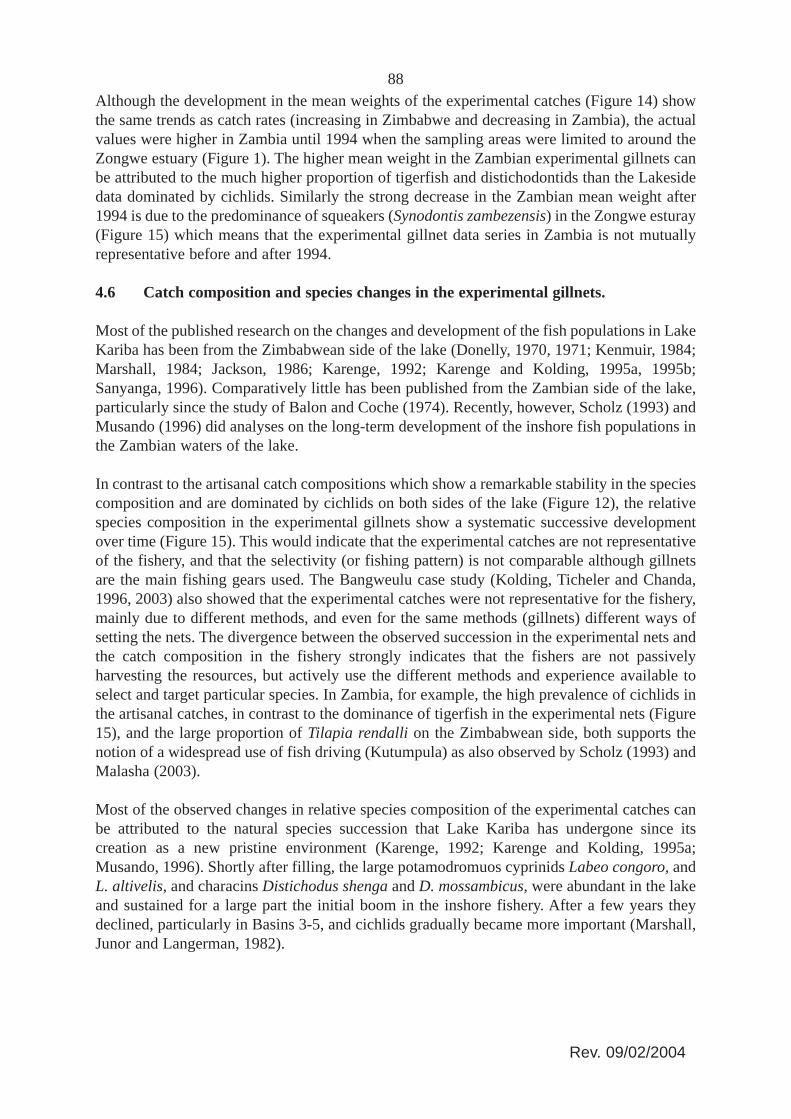
4.6 Catch composition and species changes in the experimental gillnets.
Most of the published research on the changes and development of the fish populations in LakeKariba has been from the Zimbabwean side of the lake (Donelly, 1970, 1971; Kenmuir, 1984;Marshall, 1984; Jackson, 1986; Karenge, 1992; Karenge and Kolding, 1995a, 1995b;Sanyanga, 1996). Comparatively little has been published from the Zambian side of the lake,particularly since the study of Balon and Coche (1974). Recently, however, Scholz (1993) andMusando (1996) did analyses on the long-term development of the inshore fish populations inthe Zambian waters of the lake.
In contrast to the artisanal catch compositions which show a remarkable stability in the speciescomposition and are dominated by cichlids on both sides of the lake (Figure 12), the relativespecies composition in the experimental gillnets show a systematic successive developmentover time (Figure 15). This would indicate that the experimental catches are not representativeof the fishery, and that the selectivity (or fishing pattern) is not comparable although gillnetsare the main fishing gears used. The Bangweulu case study (Kolding, Ticheler and Chanda,1996, 2003) also showed that the experimental catches were not representative for the fishery,mainly due to different methods, and even for the same methods (gillnets) different ways ofsetting the nets. The divergence between the observed succession in the experimental nets andthe catch composition in the fishery strongly indicates that the fishers are not passivelyharvesting the resources, but actively use the different methods and experience available toselect and target particular species. In Zambia, for example, the high prevalence of cichlids inthe artisanal catches, in contrast to the dominance of tigerfish in the experimental nets (Figure15), and the large proportion of Tilapia rendalli on the Zimbabwean side, both supports thenotion of a widespread use of fish driving (Kutumpula) as also observed by Scholz (1993) andMalasha (2003).
Most of the observed changes in relative species composition of the experimental catches canbe attributed to the natural species succession that Lake Kariba has undergone since itscreation as a new pristine environment (Karenge, 1992; Karenge and Kolding, 1995a;Musando, 1996). Shortly after filling, the large potamodromuos cyprinids Labeo congoro, andL. altivelis, and characins Distichodus shenga and D. mossambicus, were abundant in the lakeand sustained for a large part the initial boom in the inshore fishery. After a few years theydeclined, particularly in Basins 3-5, and cichlids gradually became more important (Marshall,Junor and Langerman, 1982).
Rev. 09/02/2004
89
FIGURE 15. Relative species changes in the experimental surveys represented by Index ofRelative Importance (Karenge and Kolding, 1995a). Above Zambia from the Sinazongwe area(Basin 3) and below Zimbabwe from the Lakeside experimental station (Basin 5). From 1994sampling stations in Zambia were reduced to only cover the Zongwe estuary which are notfully representative for the main lake (see also Figure 16).
The successive development in species diversity, and particularly the relative evenness, seemsmore pronounced at Lakeside in the most lacustrine part of the lake (Basin 5) than in theSinazongwe area (Basin 3). During the 1970s the relative abundance of Hydrocynus vittatusgradually declined after which it stabilized (Karenge and Kolding 1995a). Among thecichilids, Serranochromis condringtonii, which was not common in the lake in the early years(Kenmuir, 1984), has gradually replaced the Kariba bream (Oreochromis mortimeri) in Basin5. Oreochromis macrochir, which had been reported to have disappeared completely shortlyafter stocking (Balon, 1974a) has been caught in low, though regular, numbers since 1975. Thisperiod was also marked by the gradual decline of Marcusenius macropidotus andHippopotamyrus discorhynchus but with a substantial increase of the larger mormyrid speciesMormyrus longirostris. From around 1980 the squeaker Synodontis zambezensis graduallybecame important in the inshore system, while the “Upper Zambezi invader” Serranchromismacrocephalus appeared in the lake and increased in abundance.
The tigerfish (Hydrocynus vitattus), due to its important recreational value as an angling fish,has always attracted particular attention in the management regulations of Lake Kariba. Itsrelative decline (Figure 15) has been subject to repeated concern. This species is consideredparticularly vulnerable to fishing with small mesh sizes (Kenmuir, 1973; Marshall, Junor andLangerman, 1982; Langerman, 1984; Scholz, 1993). Sanyanga (1995) even considered itpresently endangered in Lake Kariba and recommended to give it conservation status.However, taking into account that the Lakeside catch data are from an unfished part of the lake
Rev. 09/02/2004
90and that the Zambian experimental catches are from an area with a continuously increasinglevel of fishing effort with decreasing mesh sizes, it is a paradox that the mean Index ofRelative Importance for 1980-1994 for tigerfish in Zambia was 57 percent while at Lakesideit was only 26 percent. (Figure 15). Thus, while tigerfish has decreased in absolute abundanceon the Zambian side since 1980, this decrease is proportionally following the same trend as allthe other species in the inshore fishery (Figures 8 and 13). From the available data it is difficultto support the notion that tigerfish is particularly vulnerable to fishing with small mesh sizes,neither that it is an endangered species in the Kariba ecosystem. Karenge and Kolding (1995b)found that the relative lake level changes were the most important factor for the abundance oftigerfish. Lake Kariba experienced a serious drought between 1982 and 1998, with asubsequent rapid rise to full capacity in 2000 (Figure 2). It is expected therefore that the catchrates will increase from 1999 which has been confirmed during 2001 (Patrick Ngalande, pers.comm).
4.7 Diversity
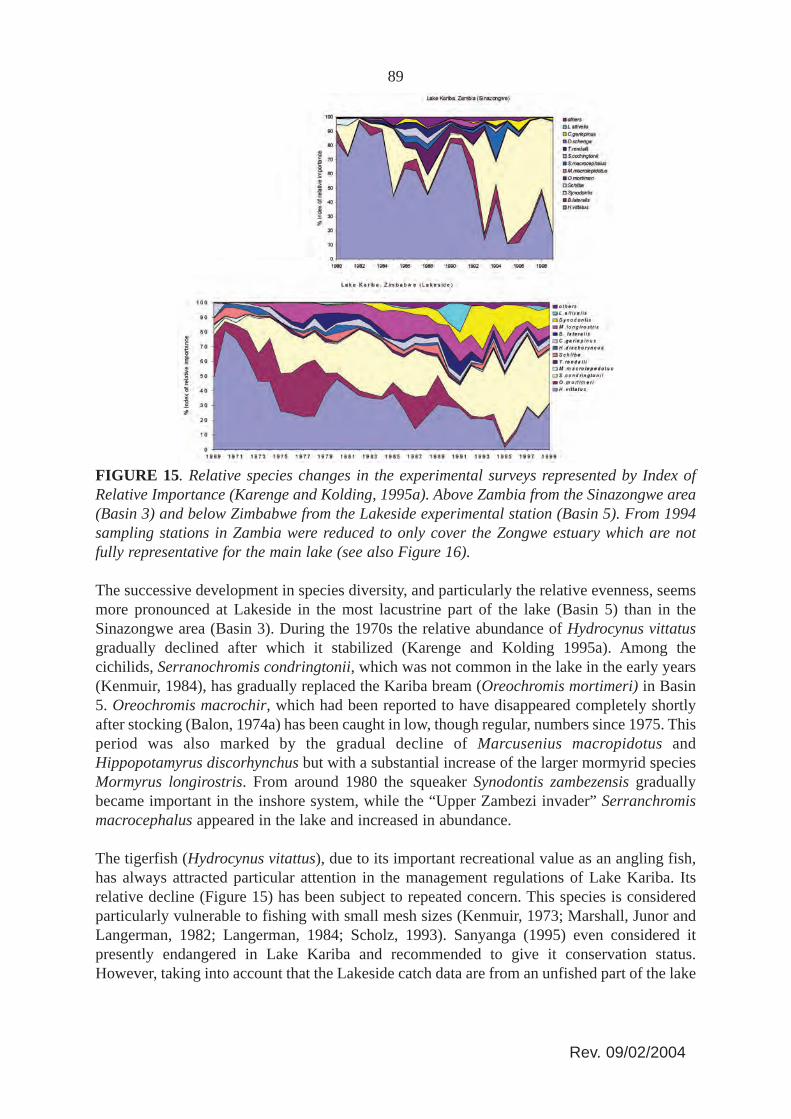
The appearance of new species and the increasing abundance of other species (like L. altivelisand S. zambezensis, which were common in the Zambezi River before inundation) haveresulted in steadily increased fish species diversity (Figure 16).
FIGURE 16. Development in species diversity in the Kariba experimental gillnets (mesh sizes50-152 mm) represented by A: annual mean number of species caught and B: Shannons’sdiversity index (H’). Continuos trendlines are for the whole period of observations (1970-1999and 1980-1999 in Zimbabwe and Zambia respectively). Broken trendlines are from the period1980-1994 in Zambia. The broken trendlines for Zambia (A: Slope = 0.21, SE = 0.15; B: Slope= 0.05, SE = 0.020) and the trendlines for Zimbabwe (A: Slope = 0.22, SE = 0.03; B: Slope =0.02, SE = 0.004) are statistically not significantly different at 95 percent confidence intervals.
An overall increase over time in the both the number of species caught and the Shannonsdiversity index can be observed at Lakeside, whereas around Sinazongwe an increase in the1980s was followed by a decrease after 1993 (Figure 16). The decrease in Zambia, however,is believed a sampling artefact because from 1994 only the stations within the Zongwe estuarywere sampled which due to the habitat has an overall lower diversity. The total number ofspecies caught over the period 1980-1994 is 32 in Zambia and 29 in Zimbabwe in theexperimental fleet of 50-152 mm mesh sizes. The average Shannon diversity index, however,is significantly different between the two countries due to a higher relative evenness amongthe species at Lakeside in Basin 5 (Table 2, Figure 15).
Rev. 09/02/2004
91Comparing the period 1980-1994 in Zambia with the whole period in Zimbawe the successivedevelopment in species diversity (slopes) is not significantly different on the two sides of thelake (Figure 16). The lower mean values in the Zambian experimental catches can beexplained from the different habitats in Basins 3 and 5 and the overall composition gradientalong the lake.
TABLE 2. Comparison of the species diversity in the Zambian and Zimbabwean inshoregillnet catches between 1980 and 1994. Shannons diversity index (H’) and evenness index (J’)with confidence limits of 2ASE from bootstrapping.
4.8 Biomass-size distribution
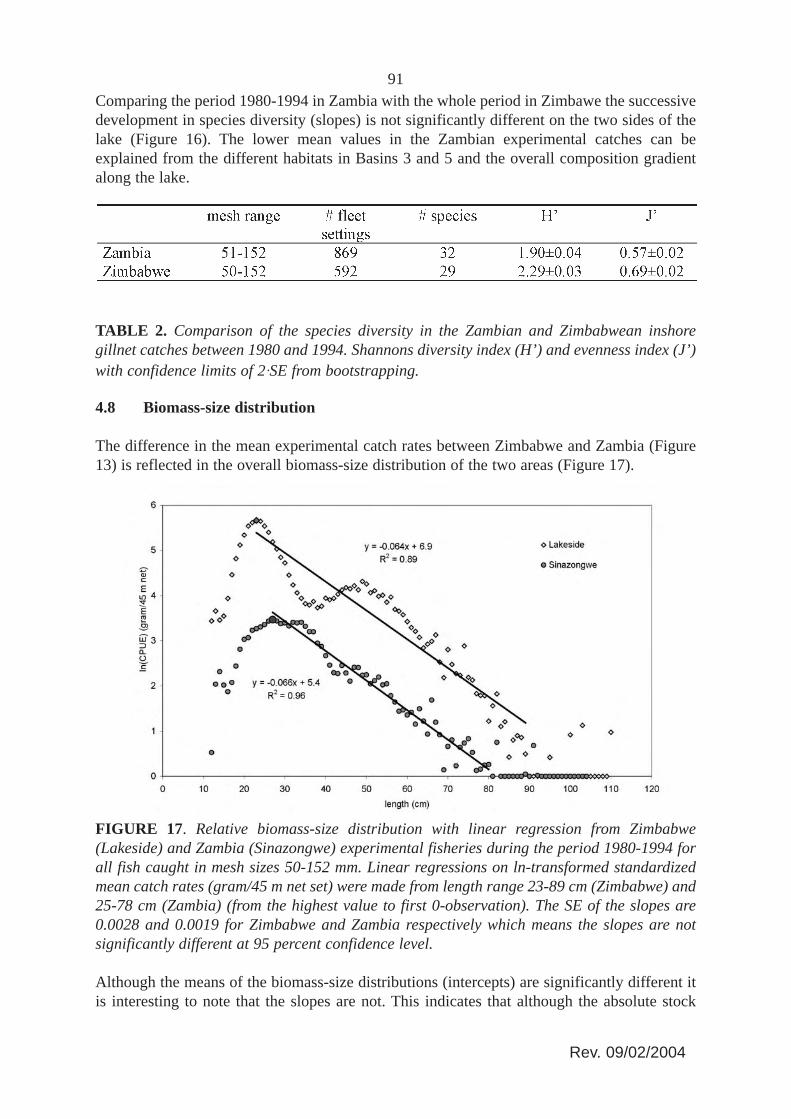
The difference in the mean experimental catch rates between Zimbabwe and Zambia (Figure13) is reflected in the overall biomass-size distribution of the two areas (Figure 17).
FIGURE 17. Relative biomass-size distribution with linear regression from Zimbabwe(Lakeside) and Zambia (Sinazongwe) experimental fisheries during the period 1980-1994 forall fish caught in mesh sizes 50-152 mm. Linear regressions on ln-transformed standardizedmean catch rates (gram/45 m net set) were made from length range 23-89 cm (Zimbabwe) and25-78 cm (Zambia) (from the highest value to first 0-observation). The SE of the slopes are0.0028 and 0.0019 for Zimbabwe and Zambia respectively which means the slopes are notsignificantly different at 95 percent confidence level.
Although the means of the biomass-size distributions (intercepts) are significantly different itis interesting to note that the slopes are not. This indicates that although the absolute stock
Rev. 09/02/2004
92abundance is clearly different between the unfished and fished areas, the overall communitysize structure is relatively the same. Comparing the biomass-size distributions with the relativeinshore catch composition (Figure 12) and the development in species diversity (Figures. 15and 16), it appears that the much higher fishing intensity in Zambia with smaller mesh sizesonly are affecting the overall biomass of the stocks, whereas the community structure andcomposition seems not affected. There are no indications that the present fishing level andfishing pattern in the Zambian inshore fishery show any potential threat to the biodiversity ofthe lake. As the overall yields have not declined (Figure 7), the lower catch rates are not a signof overfishing in a biological sense, but simply a sign of fishing. Furthermore, by decreasingthe mesh sizes, and thereby increasingly exploiting the smaller species/sizes in the biomass-size spectrum, the Zambian fishers are not only able to largely maintain their individual returns(CPUE) despite overall increasing effort, but also maintain the same relative size spectrum inthe community which ecologically speaking only makes sense (see Jul-Larsen et al. 2003,Chapter 5).
4.9 The relative impact of the environment
Both experimental, inshore, and offshore catch per unit of effort (CPUE) fluctuatedsynchronously with mean annual lake level fluctuations with a remarkably high correlation(Karenge and Kolding, 1995b). The question is therefore how much of the observed variationcan be attributed to fishing and how much to the changing environmental conditions.
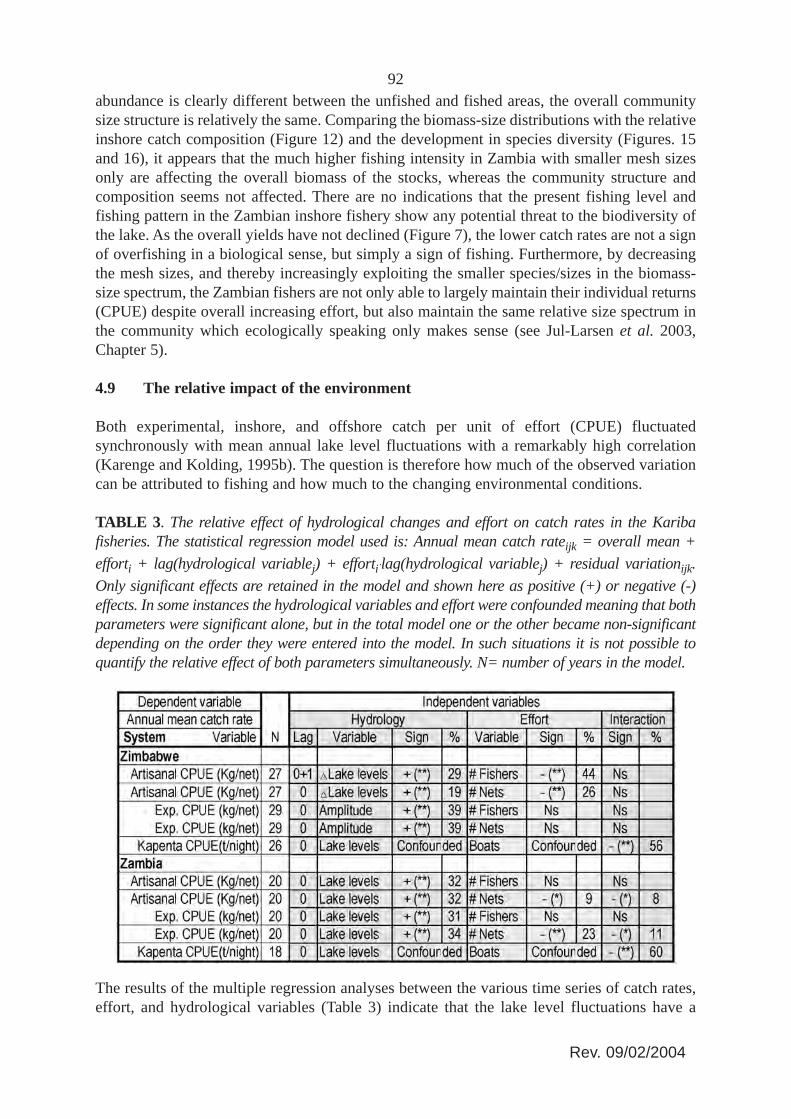
TABLE 3. The relative effect of hydrological changes and effort on catch rates in the Karibafisheries. The statistical regression model used is: Annual mean catch rateijk = overall mean +efforti + lag(hydrological variablej) + effortiAlag(hydrological variablej) + residual variationijk.Only significant effects are retained in the model and shown here as positive (+) or negative (-)effects. In some instances the hydrological variables and effort were confounded meaning that bothparameters were significant alone, but in the total model one or the other became non-significantdepending on the order they were entered into the model. In such situations it is not possible toquantify the relative effect of both parameters simultaneously. N= number of years in the model.
The results of the multiple regression analyses between the various time series of catch rates,effort, and hydrological variables (Table 3) indicate that the lake level fluctuations have a
Rev. 09/02/2004

93significant effect on the overall stock sizes in both the unfished area, the inshore, and theoffshore Kapenta. The fishing effort had no effect on the experimental catch rates in theunfished Lakeside area, which supports the notion that a closed area could act as a sanctuary.The fishing effort however had significant effect in all the exploited areas. In the Zimbabweinshore fishery both the number of fishers and the number of nets were significant, reflectingthe relatively constant number of nets per fisherman over time in this fishery. In the inshoreZambian fishery, however, only the number of nets were significant, reflecting the everincreased number of nets per fisherman (Figure 6) in this fishery.
Most interestingly, however, fishing effort had a higher relative effect in the lightly fished inshoreZimbabwean inshore fishery (44 percent and 26 percent for the number of fishers and number of netsrespectively) compared to the higher exploited Zambian inshore fishery (9 percent for the number ofnets). Conversely the environment had a higher effect in the inshore Zambian fishery than the inshoreZimbabwean fishery. Everything else being equal, this seems to indicate that as the fishing effortincreases and the stock levels are reduced, the annual catch rates become more and more dependenton the changing environmental conditions. In other words, in an unstable environment with a highexploitation level, the fishery will develop more and more into a boom and bust fishery with thechanging environmental conditions (see Figure 5.8, Volume 1). This situation would explain themuch more variable annual catch rates and relative species composition in the Zambian inshorefishery compared to the less exploited Zimbabwean side (Figures 8 and 12).
5. CONCLUSIONS
The inshore fisheries on the Zimbabwean and Zambian side of Lake Kariba have ever since thecreation of the lake undergone different management regimes. The Zimbabwean side is, comparedto the Zambian, much more regulated and enforced resulting in a fishing pressure and fishingpattern which has not changed much over time and where the fish stocks are only moderatelyexploited. In contrast, the Zambian inshore fishery, with virtually no enforcement of regulations,has experienced a much higher fishing intensity and a changed fishing pattern towardsincreasingly smaller mesh sizes resulting in a higher exploitation level and reduced stock sizes. Inboth countries effort has been fluctuating over time. However, in Zimbabwe the effort in generalhas shown a decreasing trend while CPUE has increased, whereas in Zambia effort generally hasincreased with a corresponding decreasing trend in CPUE. The overall fishing effort, in terms ofnumber of nets, is about seven times higher in Zambia than in Zimbabwe, while the averageexperimental catch rates are seven times lower. However, the artisanal catch rates are not verydifferent on both sides of the lake (1.8 and 2.8 kg/net in Zambia and Zimbabwe respectively). Thiswould indicate the Zambian fishers somehow are able to maintain the catch efficiency bydecreasing the mesh sizes (Figure 11) and, probably through increased use of fish driving.
Nevertheless, there are no indications of biological overexploitation in the Zambian inshorefishery in terms of reduced total yields or changed fish communities. This leads to theconclusion that the Zimbabwean inshore fishery is underutilized.
Lake Kariba, as a man-made artificial environment, is slowly but constantly changing in terms ofbiological species succession indicating that it has not yet reached its final maturity stage 40 yearsafter its creation. Both sides of the lake appear to undergo the same trends in diversity development,irrespective of fishing pressure and fishing pattern. The slopes of the biomass-size distributions areequal on both sides of the lake, although with significantly different intercepts. This indicates that
Rev. 09/02/2004
94the relatively high fishing pressure on the Zambian side does not have any negative impact on thecommunity structure, only that the stock sizes are reduced presumably due to fishing.
The seasonal inputs of nutrients (through the river and through inundation of shores) into thesystem has a significant effect on the regenerative capacity of the stocks, indicating that LakeKariba is a naturally fluctuating environment where effort limitations has limited effects on theconservation of stock size levels. In such a system the notion of sustainable long-term yieldsbecomes very difficult to define. Furthermore, there are indications that with increased fishingpressure the relative effect of the environmental changes become relatively more importantthan the fishing mortality resulting in an increased variability of the catch rates but reflectingthe high degree of resilience in the ecosystem. In such a situation, the fishery must adapt to thenatural fluctuations by taking advantage of the good flood years, and, by a diversifiedeconomy, be able to survive the lean periods. Management regulations such as limited entryand restricted mesh sizes as in Zimbabwe would result in a higher stability for the individualfisherman, but on the other hand in a severe underutilization of the potential yields.
6. REFERENCES
Anon. (1992), Working group on assessment of Kapenta (Limnothrissa miodon) in LakeKariba (Zambia and Zimbabwe). Zambia/Zimbabwe SADC Fisheries Project Report No 11.Kariba 4-17/3 1992. Lake Kariba Fisheries Research Institute, P.O. Box 75, Kariba,Zimbabwe.
Anon. (1993a), Working group on assessment of the inshore fisheries stocks of Lake Kariba.Zambia/Zimbabwe SADC Fisheries Project Report No. 26. Kariba 13-22/10 1993. LakeKariba Fisheries Research Institute, P.O. Box 75, Kariba, Zimbabwe.
Anon. (1993b), Zambia/Zimbabwe SADC Fisheries Project (Lake Kariba) Newsletter No. 1.October 1993, Lake Kariba Fish. Res. Inst., P.O. Box 75, Kariba, (mimeo).
Anon. (1995), Zambia/Zimbabwe SADC Fisheries Project (Lake Kariba) Newsletter No. 2.January 1995. Lake Kariba Fisheries Research Institute, Kariba, Zimbabwe. 18 p. (mimeo.)
Balon, E.K. (1974a), Fishes of Lake Kariba, Africa. T.F.H. Publications Inc. New Jersey, 144 p.
Balon, E.K. (1974b), Fishes from the edge of Victoria Falls, Africa: demise of a physicalbarrier for downstream invasions. Copeia, 1974:643-660.
Balon, E.K. (1974c), Fish production of a tropical ecosystem. p. 249-573 In: E.K. Balon andA.G. Coche (eds). Lake Kariba: A man-made tropical ecosystem in Central Africa,Monographiae Biologicae 24, Dr. W. Junk Publ., The Hague, 766 pp.
Balon, E.K. & Coche, A.G. (eds) (1974), Lake Kariba: A man-made tropical ecosystem inCentral Africa, Monographiae Biologicae 24, Dr. W. Junk Publ., The Hague, 766 pp.
Begg, G.W. (1974), The distribution of fish of riverine origin in relation to the limnologicalcharacteristics of the five basins in Lake Kariba. Hydrobiologia 44: 277-285.
Begg, G.W. (1976), The relationship between the diurnal movements of some of thezooplankton and the sardine Limnothrissa miodon in Lake Kariba. Limnol. Oceanogr., 21:529-539.
Rev. 09/02/2004
95Bell-Cross, G. & Bell-Cross, B. (1971), Introduction of Limnothrissa miodon and Limnocaridinatanganicae from Lake Tanganyika into Lake Kariba. Fish. Res. Bull. Zambia 5:207-214.
Bell-Cross, G. & Minshull, J.L. (1988), The Fishes of Zimbabwe. National Museums andMonuments of Zimbabwe. Harare, Zimbabwe. 291 pp.
Bourdillon, M.F.C., Cheater, A.P. & Murphree, M.W. (1985), Studies of Fishing on LakeKariba. Mambo Occasional Papers – Socio-Economic Series No. 20. Mambo Press, Harare,Zimbabwe, 185 pp.
Cheater, A.P. (1985), The Zimbabwean Kapenta Fishery. pp. 96-132 In Bourdillon, M.F.C.,Cheater, A.P. and Murphree, M.W. Studies of Fishing on Lake Kariba. Mambo OccasionalPapers – Socio-Economic Series No. 20. Mambo Press, Harare, Zimbabwe, 185 pp.
Coche, A.G. (1968), Description of physio-chemical aspects of Lake Kariba, an impoundmentin Zambia-Rhodesia. Fish. Res. Bull. Zambia, 5:200-267.
Coche, A.G. (1971), Lake Kariba basin: A multi-disciplinary bibliography, annotated andindexed, 1954-68. Fish. Res. Bull. Zambia, 5:11-87.
Coke, M. (1968), Depth distribution of fish on a bush cleared area of Lake Kariba, CentralAfrica. Trans. Amer. Fish. Soc. 97(4):460-465.
Donnelly, B.G. (1970), The fish population changes between 1960 and 1968: Part I. Cichlidae,Lake Kariba Fish. Res. Inst. Proj. Rept. (mimeo.)
Donnelly, B.G. (1971), The fish population changes on Lake Kariba between 1960 and 1968:Part II Characidae and Citharinidae, Lake Kariba Fish. Res. Inst. Proj. Rept. (mimeo.)
FAO (1992), Review of the state of world fishery resources, Part 1. The marine resources. FAO Fish.Circ. No. 710, Rev. 8, Part 1. Food and Agriculture Organization of the United Nations, Rome, 114 pp.
Harding, D. (1966), Lake Kariba, the hydrology and development of fisheries. pp 7-20 in R.H.Lowe-Mconnell (ed.) Man-made Lakes, Symposia of the Institute of Biology No 15. AcademicPress, London, 218 pp.
Jackson, P.B.N. (1961), Ichthyology. The fish of the middle Zambezi.Zambezi, Kariba Studies,1:1-36. National Museums and Monuments of Zimbabwe, Harare.
Jackson, P.B.N. (1986), Fish of the Zambezi system. p. 269-288 In B.R. Davies and K.F.Walker (eds.) The ecology of River Systems. Dr. W. Junk Publ. Dordrecht, The Netherlands.
Jubb, R.A. (1967), Freshwater fishes of Southern Africa. A.A. Balkema, Cape Town,Amsterdam. 248 pp.
Jubb, R.A. (1976), Unintentional introductions of fishes via hydro-electric power stations andcentrifugal pumps. J. Limnol. Soc. South. Africa 2(1):29-30.
Jubb, R.A. (1977), Comments on Victoria Falls as a physical barrier for downstream dispersalof fishes. Copeia 1977:198-199.
Jul-Larsen, E. (2003), Analysis of effort dynamics in the Zambian inshore fisheries of Lake Kariba,In E. Jul-Larsen, J. Kolding, R. Overå, J. Raakjær Nielsen and P.A.M. van Zwieten (eds.)Management, co-management or no-management? Major dilemmas in southern African freshwaterfisheries, Part 2: Case Studies, FAO Fisheries Technical Paper 426/2. 426/2, FAO, Rome.
Rev. 09/02/2004
96Jul-Larsen, E., Kolding, J., Overa, R., Nielsen, J.R.,Overa, R. & Zwieten, P.A.M.v. (2003),Management, co-management or no management? Major dilemmas in southern Africanfreshwater fisheries,Part 1: Synthesis Report. FAO Fisheries Technical Paper 426/1. FAO, Rome.
Junor, F.J.R. & Begg, G.W. (1971), A note on the successful introduction of Limnothrissa miodonthe Lake Tanganyika sardine to Lake Kariba.Kariba, Newsl. Limnol. Soc. Sth Afr. 16:8-14.
Karenge, L.P. (1992), Inshore fish population changes at Lakeside, Kariba, between 1969-1991. MPhil. thesis, University of Bergen, 61 pp.
Karenge, L. & Games, I. (1995), A boundary review of the inshore fishing zones of LakeKariba (Zimbabwe). Zambia-Zimbabwe SADC Fisheries Project.Project, Project Report 39.70 p. (mimeo.)
Karenge, L.P. & Kolding, J. (1995a), Inshore fish population changes in Lake Kariba,Zimbabwe. pp. 245-275 In T.J. Pitcher & P.J.B. Hart (eds.) Impact of species changes inAfrican lakes, Chapman & Hall, London.
Karenge, L.P. & Kolding, J. (1995b), On the relationship between hydrology and fisheries inLake Kariba, Central Africa. Fish. Res., 22:205-226.
Kenmuir, D.H.S. (1982), Fish production prospects in Zimbabwe. Zimbabwe Agric. J.,79(1):11-17.
Kenmuir, D.H.S. (1984), Fish population changes in the Sanyati basin, Lake Kariba,Zimbabwe. S. Afr. J. Zool. 19, 3:194-209.
Kolding, J. (1994), Plus ça change, plus c’est la même chose. On the ecology and exploitationof fish in fluctuating tropical freshwater systems.systems, Dr. Scient. thesis, Department ofFisheries and Marine Biology, University of Bergen, ISBN 82-7744-011-1. 197 pp.
Kolding, J. (2001). PASGEAR - A database package for experimental or artisanal fishery datafrom passive gears. An introductory manual. Dept. of Fisheries and Marine Biology,University of Bergen. 61 p.
Kolding, J., Ticheler, H. & Chanda, B. (1996), Assessment of the Bangweulu Swampsswampsfisheries. Final Report prepared for WWF Bangweulu Wetlands Project, SNV/NetherlandsDevelopment Organisation, and Department of Fisheries, Zambia. 51 p.
Kolding, J., Ticheler, H. & Chanda, B. (2003), The Bangweulu Swamp Fisheries, inManagement, co-management or no-management? Major dilemmas in southern Africanfreshwater fisheries, E. Jul-Larsen, J. Kolding, R. Overå, J. Raakjær Nielsen and P.A.M. vanZwieten,Jul-Larsen, E., Kolding, J., Overå, R., Raakjær Nielsen, J. and van Zwieten P.A.M.(eds.), FAO Fisheries Technical Paper 426/2. Rome, FAO.
Lowe-McConnell, R. (1994), Threats to, and conservation of, tropical freshwater fishes. Mitt.Int. Verein. Limnol., 24:47-52.
Machena, C. (1988), Predator-prey relationships, fisheries productivity and fish populationdynamics in Lake Kariba - a review. pp. 26-44 In: D. Lewis (ed.) Predator-prey relationships,population dynamics and fisheries productivities of large African lakes, CIFA Occas. Pap. 15,FAO, Rome.
Machena, C. (1989), Ecology of the hydrolittoral macrophyte communities in Lake Kariba,Zimbabwe. Ph.D. thesis, University of Uppsala.
Rev. 09/02/2004
97Machena, C. & Kwaramba, R. (1997), The creation of property rights to promote sustainabledevelopment in the Lake Kariba inshore fishery in Zimbabwe. pp. 245-254 In Rename, K.(ed.) African Inland Fisheries, Aquaculture and the Environment. Fishing News Books,Oxford.
Machena, C. & Mabaye, A.B.E. (1987), Some management aspects and constraints in the LakeKariba fishery. NAGA, ICLARM Q., 10(4):10-12.
Machena, C., Kolding, J. & Sanyanga, R.A. (1993), A preliminary assessment of the trophicstructure of Lake Kariba - a man-made lake, Africa, pp. 130-137 In V. Christensen and D.Pauly (eds.) Trophic models of aquatic ecosystems, ICLARM Conference Proceedings No. 26,ICLARM, Manila.
Malasha I. (2003), The emergence of colonial and post-colonial fisheries regulations: the caseof Zambia and Zimbabwe, In E. Jul-Larsen, J. Kolding, R. Overå, J. Raakjær Nielsen andP.A.M. van Zwieten (eds.) Management, co-management or no-management? Majordilemmas in southern African freshwater fisheries, Part 2: Case Studies, FAO FisheriesTechnical Paper 426/2. Rome, FAO.
Marshall, B.E. (1981), A review of the sardine fishery in Lake Kariba, 1973-1980. Lake KaribaFisheries Research Institute Project Report No. 40. Dept. of Nat. Parks and Wildlife Man.,Zimbabwe. 17 p. (mimeo.)
Marshall, B.E. (1984), Kariba (Zimbabwe/Zambia). pp. 105-153 In: J.M. Kapetsky & T. Petr(eds.). Status of African reservoir fisheries, CIFA Tech. Pap. 10.10, FAO, Rome.
Marshall, B.E. (1985), A study of the population dynamics, production and potential yield ofthe sardine Limnothrissa miodon (Boulenger) in Lake Kariba. PhD Thesis, University ofRhodes, South Africa.
Marshall, B.E. (1988), Seasonal and annual variations in the abundance of pelagic sardines inLake Kariba, with special reference to the effects of drought. Arch. Hydrobiologia. Arch.Hydrobiologia., 112:399-409.
Marshall, B.E. .(1991), The impact of the introduced sardine Limnothrissa miodon on theecology of Lake Kariba. Biol. cons., 55:151-165.
Marshall, B.E. (1992), The relationship between catch and effort and its effect on predictedyields of sardine fisheries in Lake Kariba. NAGA, ICLARM Q., 15(4):36-39.
Marshall, B.E. (1993), Biology of the African clupeid Limnothrissa miodon with reference toits small size in artificial lakes. Rev. Fish Biol. and Fisheries, 3:17-38.
Marshall, B.E. (1997), A review of zooplankton ecology in Lake Kariba. pp. 102-119 InMoreau, J. (ed.) Advances in the ecology of Lake Kariba. University of ZimbabwePublications, Harare, Zimbabwe, 270 pp.
Marshall, B.E., Junor, F.J.R. & Langerman, J.D. (1982), Fisheries and Fishfish production onthe Zimbabwean side of Lake Kariba. Kariba studies 10:175-271. National Museums andMonuments of Zimbabwe, Harare.
Marshall, B.E. & Langerman, J.D. (1988), A preliminary reappraisal of the biomass of inshorefish stocks in Lake Kariba. Fish. Res., 6:191-199.
Rev. 09/02/2004
98Minshull, J.L. (1973), The establishment of a fishery among the resettled Batonka people atLake kariba, Rhodesia. p. 413-419 In The collected papers of the symposium held by theCommission Internationale des Grand Barages, Madrid.
Mitchell, D.S. (1973), Supply of plant nutrient chemicals in Lake Kariba. p 165-169 in: W.C.Ackermann, G.F. White and E.B. Worthington (eds), Man-made lakes: their problems andenvironmental effects. Geophysical Monograph 17. Washington D.C. Ackermann, W.,American Geophysical Union.
Mitchell, S.A. (1976a), The marginal fish fauna of Lake Kariba. Kariba Studies 8:109-162.National Museums and Monuments of Zimbabwe, Harare.
Mitchell, S.A. (1976b), The impact of Salvinia molesta (Mitchell) on the margins. Kariba Studies8:128-131. National Museums and Monuments of Rhodesia.
Mitchell, S.A. (1978), The diurnal activity patterns and depth zonation of marginal fish asshown by gillnetting in Lake Kariba. Kariba Studies 9:163-173, National Museums andMonuments of Zimbabwe, Harare.
Moreau, J. (ed.) (1997), Advances in the ecology of Lake Kariba.Kariba, University ofZimbabwe Publications, Harare, Zimbabwe, 270 pp.
Moyo, N.A.G. (1986), Changes in the Cichlid population abundance in the C2 area of lakeKariba. Zimbabwe agric., J. 86:171-174.
Moyo, N.A.G. (1990), The inshore fish yield potential of Lake Kariba, Zimbabwe, Afr. J. Ecol.,28:227-233.
Musando, B. (1996), Inshore fish population changes in the Zambian Waters of Lake Karibafrom 1980 to 1995. MPhil thesis, University of Bergen, Norway. 57 pp.
Musando, B. (2000), Compilation and Analysis of Catch-Effort Data analysis of catch-effortdata on the Lake Kariba Artisanal Fishery, artisanal fishery, Zambia. Management, Co-management, or No Management Project. Internal report, mimeo. 25 p.
NORAD (1985), Report on the Lake Turkana Fisheries Development Project. EvaluationReport No. 5.85, NORAD, Oslo, 95 pp.
Overå, R. (2003), Market systems and investment “bottlenecks” in the fisheries of LakeKariba, Zambia, In E. Jul-Larsen, J. Kolding, R. Overå, J. Raakjær Nielsen and P.A.M. vanZwieten (eds.) Management, co-management or no-management? Major dilemmas insouthern African freshwater fisheries, Part 2: Case Studies, FAO Fisheries Technical Paper426/2, FAO, Rome.
Pitcher, T.J. (1995), Species changes and fisheries in African lakes: outline of the issues. pp 1-16 In T.J. Pitcher & P.J.B. Hart (eds.) The Impact of Species Changes in African Lakes.Chapman & Hall, London, 601 pp.
Ramberg, L., Björk-Ramberg, S., Kautsky, N. & Machena, C., (1987), Development andbiological status of Lake Kariba - A man-made tropical lake. Ambio, 16:314-321.Sanyanga, R. (1995), Management of the Lake Kariba inshore fishery and some thoughts onbiodiversity and conservation issues, Zimbabwe. Environmental conservation, 22:111-116.
Rev. 09/02/2004
99Sanyanga, R. (1996), The inshore fish populations of Lake Kariba with reference to thebiology of Synodontis zambezensis Peters, 1852. Doctoral thesis, Dept. of Systems Ecology,Stockholm University, ISBN 91-628-2260-8. 112 pp.
Sanyanga, R. A., Lupikisha, J. & Thorsteinson, V. (1991), The proposed catch and effort datarecording system for LKFRI (Zimbabwe and DoF (Zambia for the inshore fishery of LakeKariba. Zambia/Zimbabwe SADC Fisheries Project Report No 6. Lake Kariba FisheriesResearch Institute, P.O. Box 75, Kariba, Zimbabwe.
Sanyanga, R.A. & Feresu, F. (1994), First catches of the African pike Hepsetus odoe (Bloch,1974) (Pisces: Hepsetidae) in Lake Kariba, Zimbabwe. Rev. Hydrobiol. trop., 27(1):39-42.
Sanyanga, R., Machena, C. & Kautsky, N. (1995), Abundance and distribution of inshore fishin fished and protected areas in Lake Kariba, Zimbabwe. Hydrobiologia, 306:67-78.
Scholz, U. (1993), The development of inshore fish stocks and small-scale fishery on theZambian side of Lake Kariba 1961-1990. PhD thesis, University of Kiel. 162 p. Kiel.
Scholz, U., Mudenda, G. & Möller, H. (1997), Some aspects of the development of the small-scale fishery on the Zambian side of Lake Kariba 1961-1990 and implications for fisheriesmanagement, in African inland fisheries, aquaculture and the environment, K.RemaneRemane, K. (ed.),Oxford, Fishing News Books: 255-271.
Scudder, T. (1967), Lake Kariba Fishermen: Preliminary report. Unpublished FAO manuscript.
Songore, N. (2000), Compilation and analysis of catch-effort data on the Lake Kariba,artisanal fishery, Zimbabwe. Management, Co-management, or No Management Project.Internal report, mimeo. 66 p. (mimeo).
Songore, N. & Kolding, J. (2003). Diversity, disturbance, and ecological succession of theinshore fish populations in Lake Kariba, Zimbabwe from 1960 to 2001. Paper presented forThe Linnean Society of London Symposium on the use of long-term databases for theprediction of ecological change. London. October 23rd-24th, 2003.
Songore, N., Moyo, A. & Mugwagwa, M. (2000), Results of the 2000 Frame Survey, LakeKariba - Zimbabwe Shore, Lake Kariba Fisheries Res. Inst., Proj. Rep. No 97. 31p.
Thornton, J.A. (1980), A comparison of summer phosphorous loadings of three Zimbabweanwater supply reservoirs of varying trophic states. Water S. Afr. 6:163-170.
Rev. 09/02/2004