inside the mind of a stock market crash ...inside the mind of a stock market crash stefano giglio,...
TRANSCRIPT
NBER WORKING PAPER SERIES
INSIDE THE MIND OF A STOCK MARKET CRASH
Stefano GiglioMatteo MaggioriJohannes Stroebel
Stephen Utkus
Working Paper 27272http://www.nber.org/papers/w27272
NATIONAL BUREAU OF ECONOMIC RESEARCH1050 Massachusetts Avenue
Cambridge, MA 02138May 2020
Stephen Utkus is employed at Vanguard in a research capacity. Giglio, Maggiori, and Stroebel are unpaid consultants at Vanguard in order to access the anonymized data. Vanguard provided anonymized portfolio and survey data as well as survey research services for this project. We thank Jose Scheinkman and Alp Simsek as well as seminar participants at Stanford for helpful comments. The authors would also like to thank Catherine Clinton, Sophia Bunyaraksh, and Jean Young at Vanguard for their assistance with the survey and with understanding the data. The views expressed herein are those of the authors and do not necessarily reflect the views of the National Bureau of Economic Research.
NBER working papers are circulated for discussion and comment purposes. They have not been peer-reviewed or been subject to the review by the NBER Board of Directors that accompanies official NBER publications.
© 2020 by Stefano Giglio, Matteo Maggiori, Johannes Stroebel, and Stephen Utkus. All rights reserved. Short sections of text, not to exceed two paragraphs, may be quoted without explicit permission provided that full credit, including © notice, is given to the source.
Inside the Mind of a Stock Market CrashStefano Giglio, Matteo Maggiori, Johannes Stroebel, and Stephen UtkusNBER Working Paper No. 27272May 2020JEL No. G0,G00,G11,G12,R20
ABSTRACT
We analyze how investor expectations about economic growth and stock returns changed during the February-March 2020 stock market crash induced by the COVID-19 pandemic, as well as during the subsequent partial stock market recovery. We surveyed retail investors who are clients of Vanguard at three points in time: (i) on February 11-12, around the all-time stock market high, (ii) on March 11-12, after the stock market had collapsed by over 20%, and (iii) on April 16-17, after the market had rallied 25% from its lowest point. Following the crash, the average investor turned more pessimistic about the short-run performance of both the stock market and the real economy. Investors also perceived higher probabilities of both further extreme stock market declines and large declines in short-run real economic activity. In contrast, investor expectations about long-run (10-year) economic and stock market outcomes remained largely unchanged, and, if anything, improved. Disagreement among investors about economic and stock market outcomes also increased substantially following the stock market crash, with the disagreement persisting through the partial market recovery. Those respondents who were the most optimistic in February saw the largest decline in expectations, and sold the most equity. Those respondents who were the most pessimistic in February largely left their portfolios unchanged during and after the crash.
Stefano GiglioYale School of Management165 Whitney AvenueNew Haven, CT 06520and [email protected]
Matteo MaggioriStanford UniversityGraduate School of Business655 Knight WayStanford, CA 94305and [email protected]
Johannes StroebelStern School of BusinessNew York University44 West 4th StreetNew York, NY 10012and [email protected]
Stephen UtkusVanguard 100 Vanguard Boulevard, G13Malvern, PA [email protected]
The dynamics of beliefs play a central role in macroeconomics and finance. As a result, analyz-ing how beliefs vary with changes in the economic environment and how they affect investmentchoices is important for understanding asset markets and real economic activity. This paper of-fers a unique picture of the joint dynamics of beliefs and trading during a time of severe marketdistress, for a relevant set of market participants: retail investors who are clients of Vanguard, oneof the world’s largest asset managers. To conduct this analysis, we field a large-scale survey toelicit Vanguard investors’ beliefs about future economic growth and stock market returns before,during, and after the stock market crash of March 2020, which was triggered by the COVID-19pandemic. We then describe the evolution of beliefs and disagreement, as well as the relationshipbetween beliefs and investors’ trading activity during this period.
This paper is part of an ongoing project that we launched in 2017 in collaboration with Van-guard, with the aim of deepening our understanding of expectations in macroeconomics and fi-nance, and to provide insight into the relationship between beliefs and portfolio decisions (seeGiglio et al., 2019, for details). The heart of this project is a newly-designed survey, the GMSU-Vanguard survey, that elicits beliefs central to macro-finance. These beliefs include expected stockreturns and expected GDP growth in both the short run and the long run, as well as respondents’perceived probabilities of economic and stock market disasters. In this paper, we explore threewaves of the survey from early 2020. The first wave was administered in mid-February, near thepeak of the U.S. stock market; the second wave in mid-March, after the U.S. stock market haddeclined by about 20% from its peak; and the third wave was administered in mid-April, after thestock market had rallied by 25% from its low point, though it was still about 17% below its peak.
We find that average beliefs about stock returns over the next year turned substantially morepessimistic following the stock market crash; average expectations of GDP growth over the short-term (the next 3 years) also declined, although only moderately. Average expectations of short-run disaster probabilities in stock returns and GDP growth, defined respectively as a stock marketdrop of 30% or more in the next year and annual real GDP growth of less than -3% over the next 3years, both spiked during this episode. On the other hand, long-term expectations of GDP growthand stock returns over the next 10 years remained stable or even increased somewhat.
The dispersion of beliefs across investors, often referred to as disagreement, increased sub-stantially during the crash. Interestingly, the beliefs of optimists and pessimists, classified accord-ing to their pre-crash beliefs, moved in substantially different ways during this period. Overall,the vast majority of investors became more pessimistic about the short-run outlook of the stockmarket. However, among those investors who were relatively pessimistic before the crash (i.e.,those who, in February, were expecting negative 1-year stock market returns), about half actuallyrevised their expectations upwards in the March and April survey waves.
An important feature of our study is the ability to match survey responses to the clients’ port-folios and daily trading activity at Vanguard. This allows us to conduct a “high-frequency” studyof the relationship between beliefs and investment decisions at the individual level. February andMarch 2020 were periods of elevated trading activity both at Vanguard and more generally inthe markets. Consistent with the findings of Giglio et al. (2019), we show that, before the crash,respondents who were more optimistic about stock market returns had a higher fraction of their
1
portfolio invested in equity. We then document that when the crash occurs at the end of February,Vanguard clients in our sample rebalance their portfolios away from equities. Those investors whowere ex-ante more optimistic sell more equity immediately after the crash. Those investors whowere initially more pessimistic keep their portfolios largely unchanged. The trading decisions,therefore, align closely with the differential belief dynamics for initial optimists and pessimists.
The aim of this paper is to document these patterns in the data. We take no stance on whetherthe expectations measured by our survey are rational or include behavioral elements, or whetherthe trading decisions that we document were optimal. However, we note that even though thedynamics of individual and aggregate expectations after large shocks are among the most infor-mative moments for models of macroeconomics and finance, they are rarely observed.1 This isboth because the events themselves are rare and because large-scale surveys that track peopleover time have only recently become available. Therefore, we believe that our findings have thepotential to contribute a new important moment that can be used to calibrate and evaluate differ-ent models, especially models that feature rare disasters or belief heterogeneity. In Section III wereview the main qualitative implications for such models.
I BRIEF SURVEY DESCRIPTION
We explore responses to three waves of the GMSU-Vanguard survey. This survey elicits the beliefsof Vanguard investors about expected stock returns and expected GDP growth in both the shortrun and the long run, as well as investors’ perceived probabilities of economic and stock marketdisasters. The Appendix presents the full survey flow and the exact wording of the various ques-tions. The survey has been administered to retail and retirement clients of Vanguard every twomonths since February 2017.2 The surveyed population is one that is relevant for understandingfinancial markets: retail investors with substantial investments in both equity and fixed incomeproducts. The median respondent has 225,000 USD invested with Vanguard — 70% in equity in-struments and 15% in fixed income instruments — and is approximately 60 years of age. Giglioet al. (2019) provides more detailed summary statistics on the investor population sampled by thissurvey.
As part of our ongoing project, a regular survey was administered on February 11th, 2020,which turned out to be almost exactly the all-time high in the U.S. stock market. At this time,the COVID-19 outbreak in China had already occurred, but its implications had not yet beenwidely reported or understood. This survey wave therefore offers us a measure of investor beliefsbefore the subsequent crash. After one of the longest and most pronounced stock market boomson record during 2009-2019, the U.S. stock market then experienced a sudden crash starting onMonday, February 24th. By March 11th, the S&P 500 index had dropped 19.2% from its previoushigh. On that day, the financial press announced that U.S. stock markets had entered "bear market
1In the wake of the Covid-19 crisis there is a wave of interesting work measuring expectations with different ap-proaches (see, for example, Gormsen and Koijen, 2020; Landier and Thesmar, 2020).
2The sample selection rules are described in Giglio et al. (2019), and we encourage the reader to refer to that paperfor more background information on the survey. The only difference to the sample selection approach described inGiglio et al. (2019) is that the March survey wave did not add newly selected clients that had never been contactedbefore by our study. This is consistent with the focus in this article on changes in beliefs since February.
2
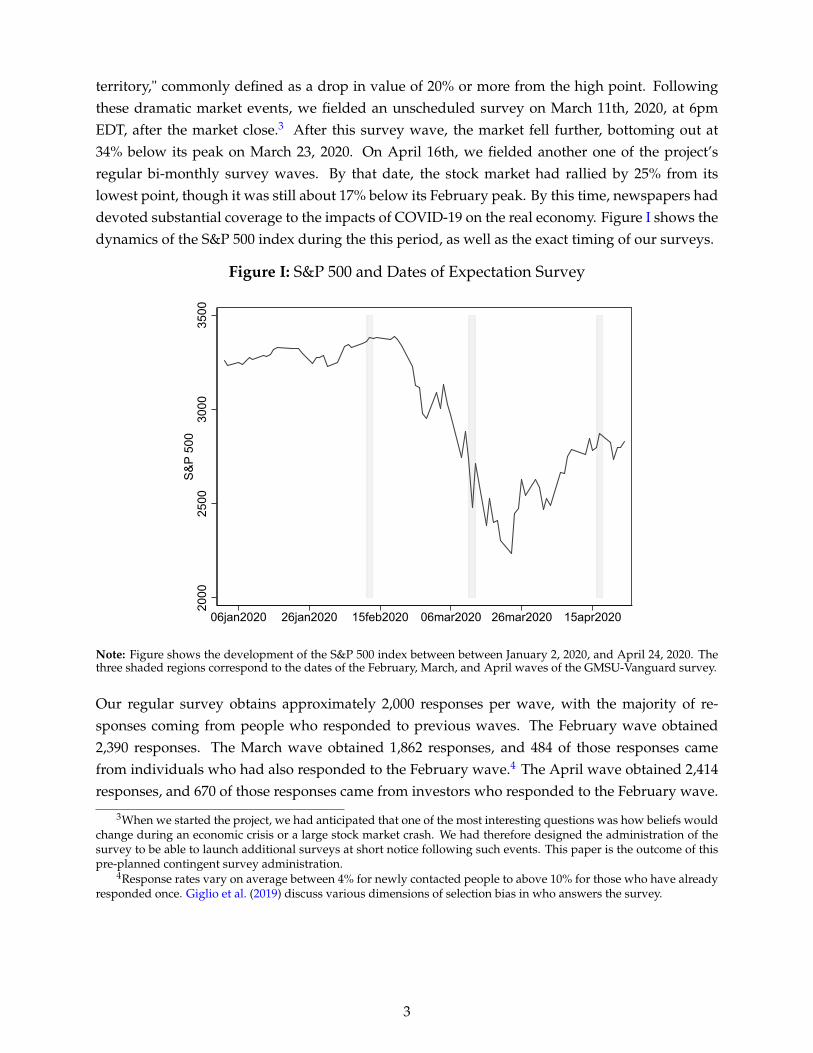
territory," commonly defined as a drop in value of 20% or more from the high point. Followingthese dramatic market events, we fielded an unscheduled survey on March 11th, 2020, at 6pmEDT, after the market close.3 After this survey wave, the market fell further, bottoming out at34% below its peak on March 23, 2020. On April 16th, we fielded another one of the project’sregular bi-monthly survey waves. By that date, the stock market had rallied by 25% from itslowest point, though it was still about 17% below its February peak. By this time, newspapers haddevoted substantial coverage to the impacts of COVID-19 on the real economy. Figure I shows thedynamics of the S&P 500 index during the this period, as well as the exact timing of our surveys.
Figure I: S&P 500 and Dates of Expectation Survey
2000
2500
3000
3500
S&
P 5
00
06jan2020 26jan2020 15feb2020 06mar2020 26mar2020 15apr2020
Note: Figure shows the development of the S&P 500 index between between January 2, 2020, and April 24, 2020. Thethree shaded regions correspond to the dates of the February, March, and April waves of the GMSU-Vanguard survey.
Our regular survey obtains approximately 2,000 responses per wave, with the majority of re-sponses coming from people who responded to previous waves. The February wave obtained2,390 responses. The March wave obtained 1,862 responses, and 484 of those responses camefrom individuals who had also responded to the February wave.4 The April wave obtained 2,414responses, and 670 of those responses came from investors who responded to the February wave.
3When we started the project, we had anticipated that one of the most interesting questions was how beliefs wouldchange during an economic crisis or a large stock market crash. We had therefore designed the administration of thesurvey to be able to launch additional surveys at short notice following such events. This paper is the outcome of thispre-planned contingent survey administration.
4Response rates vary on average between 4% for newly contacted people to above 10% for those who have alreadyresponded once. Giglio et al. (2019) discuss various dimensions of selection bias in who answers the survey.
3
II BELIEF DYNAMICS AND TRADING OVER THE COVID-19 CRASH
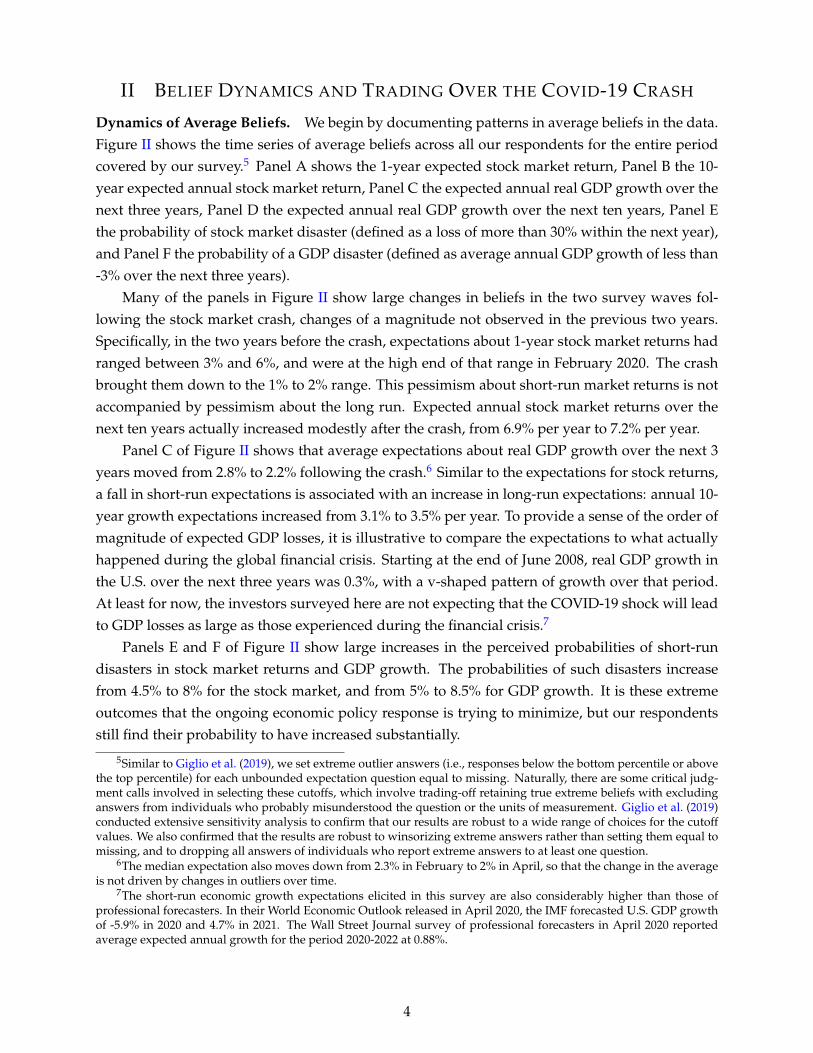
Dynamics of Average Beliefs. We begin by documenting patterns in average beliefs in the data.Figure II shows the time series of average beliefs across all our respondents for the entire periodcovered by our survey.5 Panel A shows the 1-year expected stock market return, Panel B the 10-year expected annual stock market return, Panel C the expected annual real GDP growth over thenext three years, Panel D the expected annual real GDP growth over the next ten years, Panel Ethe probability of stock market disaster (defined as a loss of more than 30% within the next year),and Panel F the probability of a GDP disaster (defined as average annual GDP growth of less than-3% over the next three years).
Many of the panels in Figure II show large changes in beliefs in the two survey waves fol-lowing the stock market crash, changes of a magnitude not observed in the previous two years.Specifically, in the two years before the crash, expectations about 1-year stock market returns hadranged between 3% and 6%, and were at the high end of that range in February 2020. The crashbrought them down to the 1% to 2% range. This pessimism about short-run market returns is notaccompanied by pessimism about the long run. Expected annual stock market returns over thenext ten years actually increased modestly after the crash, from 6.9% per year to 7.2% per year.
Panel C of Figure II shows that average expectations about real GDP growth over the next 3years moved from 2.8% to 2.2% following the crash.6 Similar to the expectations for stock returns,a fall in short-run expectations is associated with an increase in long-run expectations: annual 10-year growth expectations increased from 3.1% to 3.5% per year. To provide a sense of the order ofmagnitude of expected GDP losses, it is illustrative to compare the expectations to what actuallyhappened during the global financial crisis. Starting at the end of June 2008, real GDP growth inthe U.S. over the next three years was 0.3%, with a v-shaped pattern of growth over that period.At least for now, the investors surveyed here are not expecting that the COVID-19 shock will leadto GDP losses as large as those experienced during the financial crisis.7
Panels E and F of Figure II show large increases in the perceived probabilities of short-rundisasters in stock market returns and GDP growth. The probabilities of such disasters increasefrom 4.5% to 8% for the stock market, and from 5% to 8.5% for GDP growth. It is these extremeoutcomes that the ongoing economic policy response is trying to minimize, but our respondentsstill find their probability to have increased substantially.
5Similar to Giglio et al. (2019), we set extreme outlier answers (i.e., responses below the bottom percentile or abovethe top percentile) for each unbounded expectation question equal to missing. Naturally, there are some critical judg-ment calls involved in selecting these cutoffs, which involve trading-off retaining true extreme beliefs with excludinganswers from individuals who probably misunderstood the question or the units of measurement. Giglio et al. (2019)conducted extensive sensitivity analysis to confirm that our results are robust to a wide range of choices for the cutoffvalues. We also confirmed that the results are robust to winsorizing extreme answers rather than setting them equal tomissing, and to dropping all answers of individuals who report extreme answers to at least one question.
6The median expectation also moves down from 2.3% in February to 2% in April, so that the change in the averageis not driven by changes in outliers over time.
7The short-run economic growth expectations elicited in this survey are also considerably higher than those ofprofessional forecasters. In their World Economic Outlook released in April 2020, the IMF forecasted U.S. GDP growthof -5.9% in 2020 and 4.7% in 2021. The Wall Street Journal survey of professional forecasters in April 2020 reportedaverage expected annual growth for the period 2020-2022 at 0.88%.
4
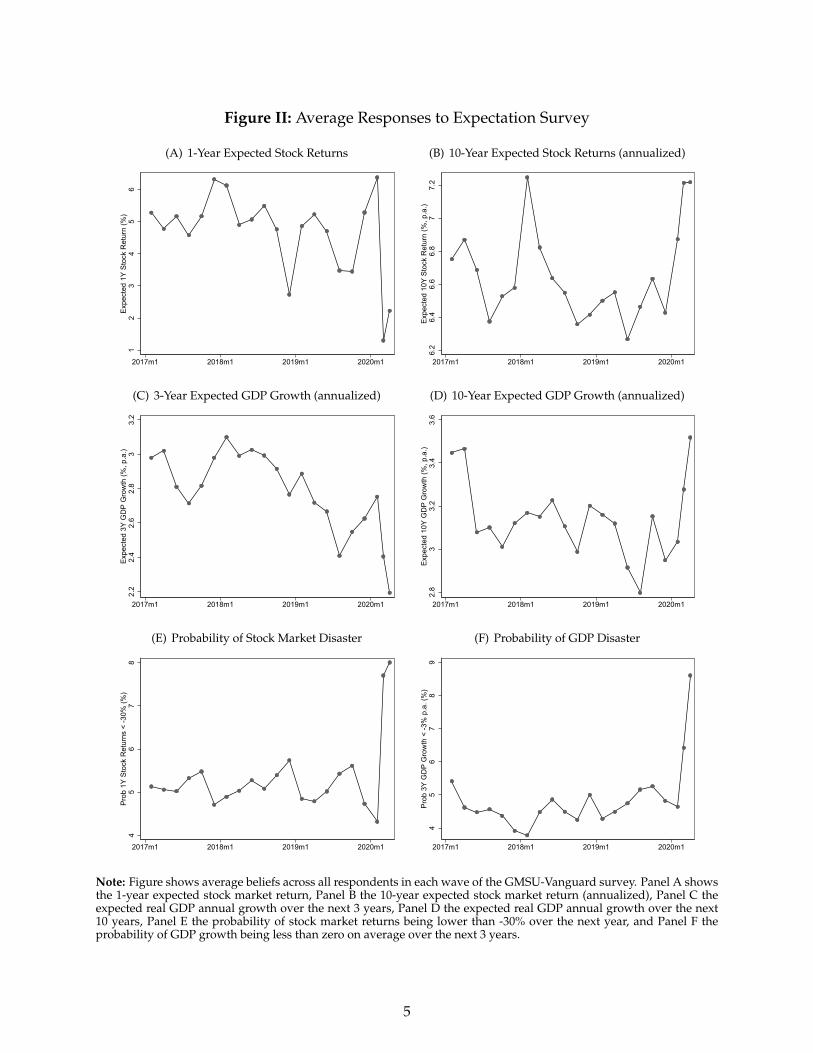
Figure II: Average Responses to Expectation Survey
(A) 1-Year Expected Stock Returns
12
34
56
Exp
ecte
d 1Y
Sto
ck R
etur
n (%
)
2017m1 2018m1 2019m1 2020m1
(B) 10-Year Expected Stock Returns (annualized)
6.2
6.4
6.6
6.8
77.
2E
xpec
ted
10Y
Sto
ck R
etur
n (%
, p.a
.)
2017m1 2018m1 2019m1 2020m1
(C) 3-Year Expected GDP Growth (annualized)
2.2
2.4
2.6
2.8
33.
2E
xpec
ted
3Y G
DP
Gro
wth
(%, p
.a.)
2017m1 2018m1 2019m1 2020m1
(D) 10-Year Expected GDP Growth (annualized)
2.8
33.
23.
43.
6E
xpec
ted
10Y
GD
P G
row
th (%
, p.a
.)
2017m1 2018m1 2019m1 2020m1
(E) Probability of Stock Market Disaster
45
67
8P
rob
1Y S
tock
Ret
urns
< -3
0% (%
)
2017m1 2018m1 2019m1 2020m1
(F) Probability of GDP Disaster
45
67
89
Pro
b 3Y
GD
P G
row
th <
-3%
p.a
. (%
)
2017m1 2018m1 2019m1 2020m1
Note: Figure shows average beliefs across all respondents in each wave of the GMSU-Vanguard survey. Panel A showsthe 1-year expected stock market return, Panel B the 10-year expected stock market return (annualized), Panel C theexpected real GDP annual growth over the next 3 years, Panel D the expected real GDP annual growth over the next10 years, Panel E the probability of stock market returns being lower than -30% over the next year, and Panel F theprobability of GDP growth being less than zero on average over the next 3 years.
5
Dynamics of Belief Disagreement. Beyond studying the behavior of average beliefs across in-vestors, our data also allow us to understand the evolution of disagreement among investors.Figure III shows smoothed kernel densities of the cross-section of beliefs, for the 1-year expectedreturn (Panel A) and for the probability of a stock market disaster (Panel B). In each Panel we plotthree densities, each corresponding to a different survey wave (February, March, and April).
Figure III: Distribution of Responses to Expectation Survey
(A) 1-Year Expected Stock Returns
0.0
2.0
4.0
6.0
8D
ensi
ty
-40 -20 0 20 40 60Expected 1Y Stock Return (%)
February 11/12 March 11/12April 16/17
(B) Probability of Stock Market Disaster
0.0
1.0
2.0
3.0
4.0
5D
ensi
ty0 20 40 60 80 100
Prob 1Y Stock Return < -30% (%)
February 11/12, 2020 March 11/12, 2020April 16/17
Note: Figure shows kernel density distributions over responses on the February 11-12, 2020, the March 11-12, 2020,and the April 16-17, 2020 waves of the GMSU-Vanguard survey. The left panel shows the distribution of beliefs about1-year expected stock returns, the right panel shows the distribution of beliefs about the probability of a stock marketdecline of more than 30 percent over the coming 12 months.
The dispersion in beliefs across individuals — the level of disagreement — increased substantiallyafter the market crash, as visible from the fattening of densities. The cross-sectional standard de-viation (across respondents) of reported 1-year expected stock returns almost doubled from 5.3%to 10.1% between the February and March waves. The April survey shows a level of disagreementvery similar to the March one, despite the fact that the stock market had rallied substantially in themeantime. The response of disagreement is asymmetric, with pessimism — the left tail of Panel A— becoming substantially more pronounced in the investor population: the cross-sectional skew-ness of beliefs increases from -0.32 to -0.47 from February to March. Consistent with this finding,the 10th percentile of the belief distribution moves from 2% to -10%, whereas the 90th percentileremains essentially stable, falling to 10% from 12%. Finally, the 90th percentile of the distributionof perceived probabilities of disaster, captured by the right tail of Panel B, doubles from 10% to20% between the February and March waves of the GMSU-Vanguard survey.
We can further refine our understanding of belief dynamics by digging deeper into the natureof disagreement. We seek to understand which people changed their beliefs, and how: did pes-simists become more pessimistic, or was the change in disagreement driven largely by investorswho were previously optimistic? Our survey is well suited to answering these questions, becausewe observe a significant number of investors who respond to multiple waves of the survey.
In Table I, we study the subset of investors that responded to the February wave as well asat least one of the March or April waves of the GMSU-Vanguard survey. Panel A focuses on the
6
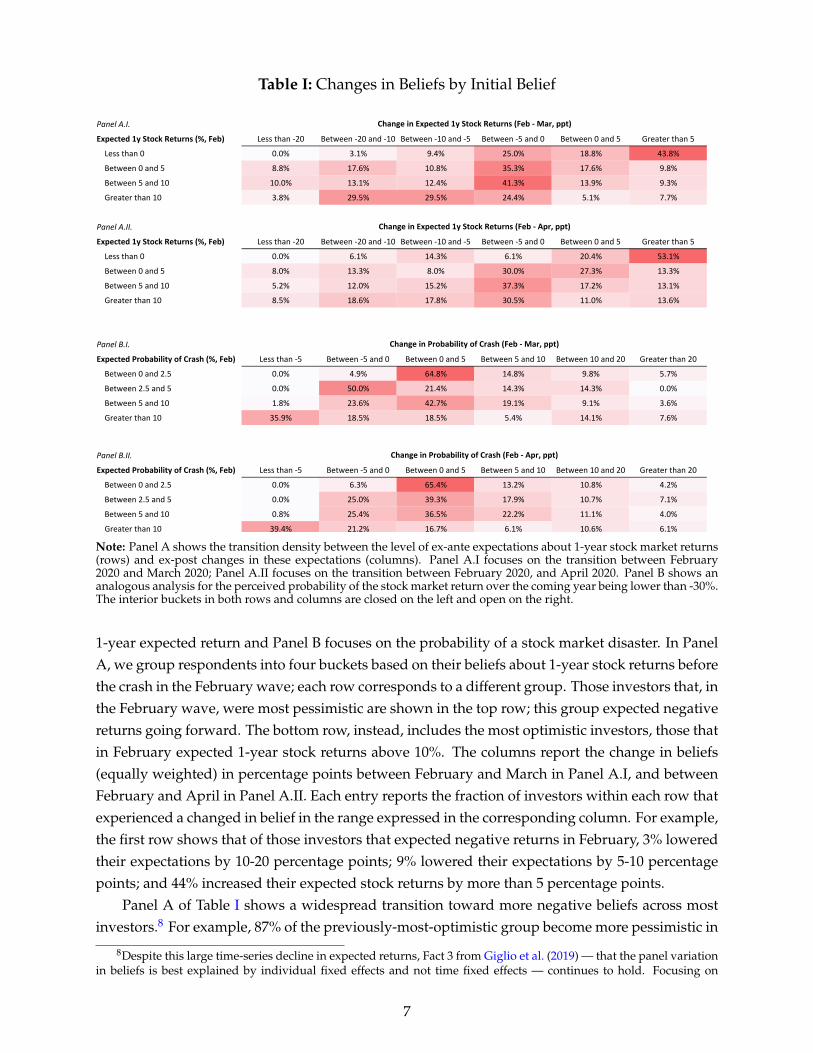
Table I: Changes in Beliefs by Initial Belief
Panel A.I.
Expected 1y Stock Returns (%, Feb) Less than -20 Between -20 and -10 Between -10 and -5 Between -5 and 0 Between 0 and 5 Greater than 5
Less than 0 0.0% 3.1% 9.4% 25.0% 18.8% 43.8%
Between 0 and 5 8.8% 17.6% 10.8% 35.3% 17.6% 9.8%
Between 5 and 10 10.0% 13.1% 12.4% 41.3% 13.9% 9.3%
Greater than 10 3.8% 29.5% 29.5% 24.4% 5.1% 7.7%
Panel A.II.
Expected 1y Stock Returns (%, Feb) Less than -20 Between -20 and -10 Between -10 and -5 Between -5 and 0 Between 0 and 5 Greater than 5
Less than 0 0.0% 6.1% 14.3% 6.1% 20.4% 53.1%
Between 0 and 5 8.0% 13.3% 8.0% 30.0% 27.3% 13.3%
Between 5 and 10 5.2% 12.0% 15.2% 37.3% 17.2% 13.1%
Greater than 10 8.5% 18.6% 17.8% 30.5% 11.0% 13.6%
Panel B.I.
Expected Probability of Crash (%, Feb) Less than -5 Between -5 and 0 Between 0 and 5 Between 5 and 10 Between 10 and 20 Greater than 20
Between 0 and 2.5 0.0% 4.9% 64.8% 14.8% 9.8% 5.7%
Between 2.5 and 5 0.0% 50.0% 21.4% 14.3% 14.3% 0.0%
Between 5 and 10 1.8% 23.6% 42.7% 19.1% 9.1% 3.6%
Greater than 10 35.9% 18.5% 18.5% 5.4% 14.1% 7.6%
Panel B.II.
Expected Probability of Crash (%, Feb) Less than -5 Between -5 and 0 Between 0 and 5 Between 5 and 10 Between 10 and 20 Greater than 20
Between 0 and 2.5 0.0% 6.3% 65.4% 13.2% 10.8% 4.2%
Between 2.5 and 5 0.0% 25.0% 39.3% 17.9% 10.7% 7.1%
Between 5 and 10 0.8% 25.4% 36.5% 22.2% 11.1% 4.0%
Greater than 10 39.4% 21.2% 16.7% 6.1% 10.6% 6.1%
Change in Expected 1y Stock Returns (Feb - Mar, ppt)
Change in Probability of Crash (Feb - Mar, ppt)
Change in Expected 1y Stock Returns (Feb - Apr, ppt)
Change in Probability of Crash (Feb - Apr, ppt)
Note: Panel A shows the transition density between the level of ex-ante expectations about 1-year stock market returns(rows) and ex-post changes in these expectations (columns). Panel A.I focuses on the transition between February2020 and March 2020; Panel A.II focuses on the transition between February 2020, and April 2020. Panel B shows ananalogous analysis for the perceived probability of the stock market return over the coming year being lower than -30%.The interior buckets in both rows and columns are closed on the left and open on the right.
1-year expected return and Panel B focuses on the probability of a stock market disaster. In PanelA, we group respondents into four buckets based on their beliefs about 1-year stock returns beforethe crash in the February wave; each row corresponds to a different group. Those investors that, inthe February wave, were most pessimistic are shown in the top row; this group expected negativereturns going forward. The bottom row, instead, includes the most optimistic investors, those thatin February expected 1-year stock returns above 10%. The columns report the change in beliefs(equally weighted) in percentage points between February and March in Panel A.I, and betweenFebruary and April in Panel A.II. Each entry reports the fraction of investors within each row thatexperienced a changed in belief in the range expressed in the corresponding column. For example,the first row shows that of those investors that expected negative returns in February, 3% loweredtheir expectations by 10-20 percentage points; 9% lowered their expectations by 5-10 percentagepoints; and 44% increased their expected stock returns by more than 5 percentage points.
Panel A of Table I shows a widespread transition toward more negative beliefs across mostinvestors.8 For example, 87% of the previously-most-optimistic group become more pessimistic in
8Despite this large time-series decline in expected returns, Fact 3 from Giglio et al. (2019) — that the panel variationin beliefs is best explained by individual fixed effects and not time fixed effects — continues to hold. Focusing on
7
March. One exception is the group that includes the most pessimistic respondents in February; forthis group, 63% of the respondents increase their expectations between February and March, and73% become more optimistic between February and April. One interpretation of these results isthat in February, after the spread of the Coronavirus had already started, a set of individuals (thepessimists) thought a stock market crash was likely to occur over the next year. As this scenarioactually unfolded, about half of these individuals thought that stock prices had fallen far enoughas to increase their expected returns going forward; the other half expected further stock marketdeclines. On the other hand, the vast majority of optimists revised their expectations downwardsin light of the market crash that they did not anticipate in February.
This view is also supported by Panel B of Table I, which presents an analogous analysis forthe perceived probability of a stock market disaster (in this panel, initial pessimists are in the lastrow). Those who ex-ante reported the highest probabilities of a large stock market decline are alsothose who decreased their perceived probability the most following the actual realization of sucha decline: just over half the pessimists become more optimistic.
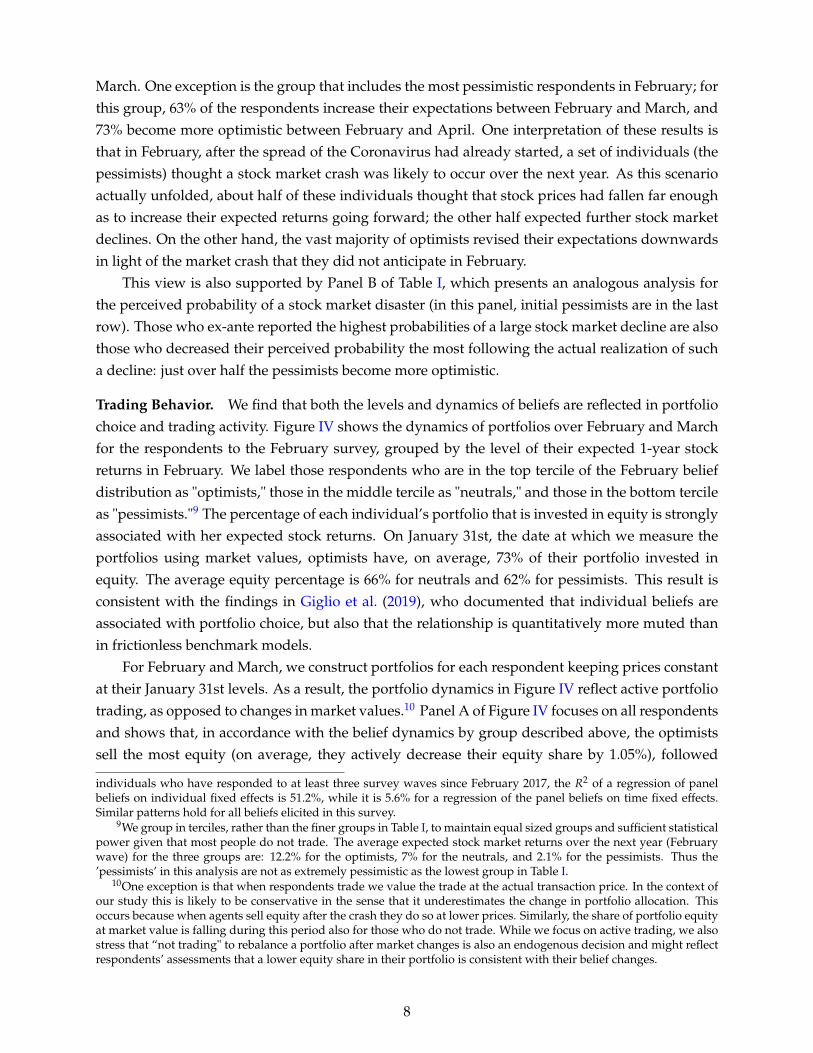
Trading Behavior. We find that both the levels and dynamics of beliefs are reflected in portfoliochoice and trading activity. Figure IV shows the dynamics of portfolios over February and Marchfor the respondents to the February survey, grouped by the level of their expected 1-year stockreturns in February. We label those respondents who are in the top tercile of the February beliefdistribution as "optimists," those in the middle tercile as "neutrals," and those in the bottom tercileas "pessimists."9 The percentage of each individual’s portfolio that is invested in equity is stronglyassociated with her expected stock returns. On January 31st, the date at which we measure theportfolios using market values, optimists have, on average, 73% of their portfolio invested inequity. The average equity percentage is 66% for neutrals and 62% for pessimists. This result isconsistent with the findings in Giglio et al. (2019), who documented that individual beliefs areassociated with portfolio choice, but also that the relationship is quantitatively more muted thanin frictionless benchmark models.
For February and March, we construct portfolios for each respondent keeping prices constantat their January 31st levels. As a result, the portfolio dynamics in Figure IV reflect active portfoliotrading, as opposed to changes in market values.10 Panel A of Figure IV focuses on all respondentsand shows that, in accordance with the belief dynamics by group described above, the optimistssell the most equity (on average, they actively decrease their equity share by 1.05%), followed
individuals who have responded to at least three survey waves since February 2017, the R2 of a regression of panelbeliefs on individual fixed effects is 51.2%, while it is 5.6% for a regression of the panel beliefs on time fixed effects.Similar patterns hold for all beliefs elicited in this survey.
9We group in terciles, rather than the finer groups in Table I, to maintain equal sized groups and sufficient statisticalpower given that most people do not trade. The average expected stock market returns over the next year (Februarywave) for the three groups are: 12.2% for the optimists, 7% for the neutrals, and 2.1% for the pessimists. Thus the’pessimists’ in this analysis are not as extremely pessimistic as the lowest group in Table I.
10One exception is that when respondents trade we value the trade at the actual transaction price. In the context ofour study this is likely to be conservative in the sense that it underestimates the change in portfolio allocation. Thisoccurs because when agents sell equity after the crash they do so at lower prices. Similarly, the share of portfolio equityat market value is falling during this period also for those who do not trade. While we focus on active trading, we alsostress that “not trading" to rebalance a portfolio after market changes is also an endogenous decision and might reflectrespondents’ assessments that a lower equity share in their portfolio is consistent with their belief changes.
8
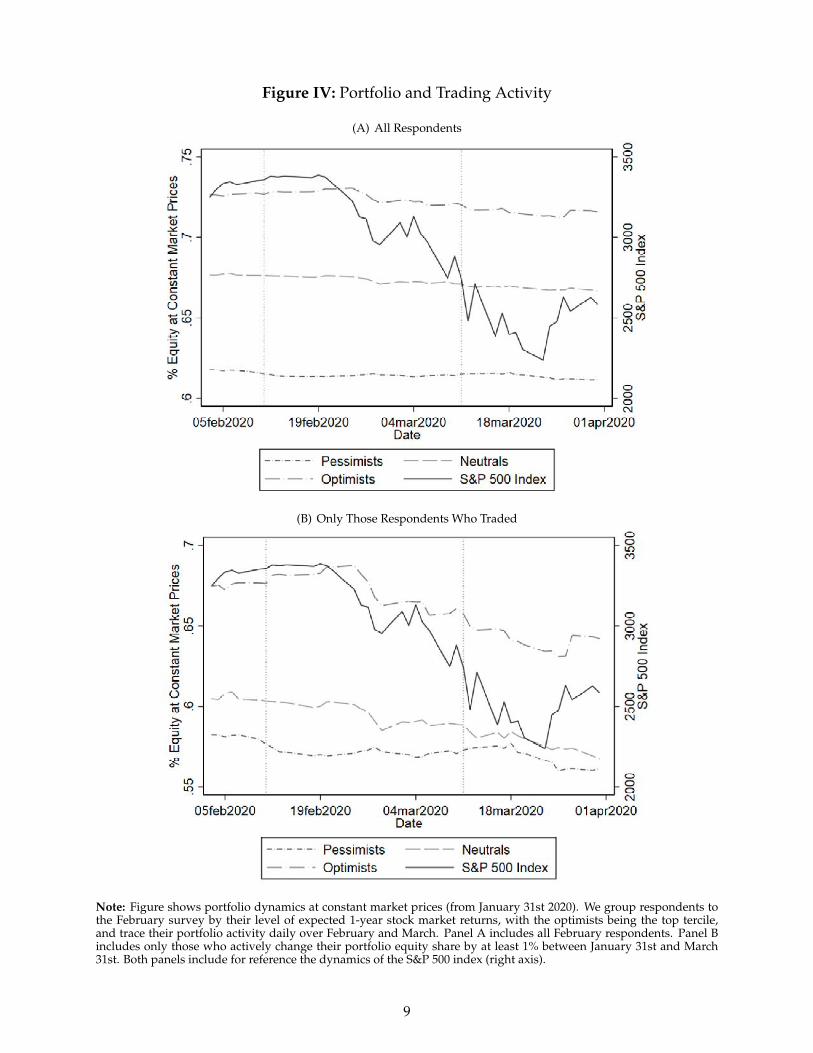
Figure IV: Portfolio and Trading Activity
(A) All Respondents
(B) Only Those Respondents Who Traded
Note: Figure shows portfolio dynamics at constant market prices (from January 31st 2020). We group respondents tothe February survey by their level of expected 1-year stock market returns, with the optimists being the top tercile,and trace their portfolio activity daily over February and March. Panel A includes all February respondents. Panel Bincludes only those who actively change their portfolio equity share by at least 1% between January 31st and March31st. Both panels include for reference the dynamics of the S&P 500 index (right axis).
9
by the neutrals (active decrease of 0.98%). Initial pessimists had the lowest active change in theequity share, with an active decrease of 0.63%. To inspect this mechanism further, Panel B focusesexclusively on those respondents who actively change their portfolios during the period.11 Similarpatterns appear, but they are now more pronounced, reflecting the fact that a substantial portionof respondents (67% of optimists, 73% of neutrals, and 70% of pessimists) did not change theirportfolio during this period. The optimists who trade move their equity percentage from a highof 68% to a low of 64% by the end of March; initial neutrals with active trading move their equityshare from 60% to 57%; and initial pessimists from 58% to 56%. There is also an interesting higher-frequency dynamic: the optimists sell their equity during the crash between end of February andearly March, and by end of March, after the market rebounds, they buy back part of that equity.
Correlations across belief changes. Our final analysis uses our panel data to investigate the jointdynamics of changes in expectations about economic growth and stock market returns acrossindividuals. Table II reports the correlation of individual-level changes in beliefs between theFebruary and March (Panel A) and February and April (Panel B) waves of the survey. For example,the table shows (row 6, column 3) that investors who increased their perceived probability of astock market disaster also increased the perceived probability of GDP growth disaster.
Table II: Correlation Across Belief Changes
Panel A: February - March (1) (2) (3) (4) (5) (6)
(1) Δ Expected 1Y Stock Return (%) 1
(2) Δ Expected 10Y Stock Return (% p.a.) 0.061 1
(3) Δ Prob 1Y Stock Return < -30% (%) -0.363 0.094 1
(4) Δ Expected 3Y GDP Growth (% p.a.) 0.155 0.140 -0.063 1
(5) Δ Expected 10Y GDP Growth (% p.a.) 0.010 0.276 -0.048 0.446 1
(6) Δ Prob 3Y GDP Growth < -3% p.a. (%) -0.188 0.004 0.230 -0.184 -0.037 1
Panel B: February - April (1) (2) (3) (4) (5) (6)
(1) Δ Expected 1Y Stock Return (%) 1
(2) Δ Expected 10Y Stock Return (% p.a.) 0.110 1
(3) Δ Prob 1Y Stock Return < -30% (%) -0.262 0.018 1
(4) Δ Expected 3Y GDP Growth (% p.a.) 0.213 0.125 -0.154 1
(5) Δ Expected 10Y GDP Growth (% p.a.) 0.052 0.262 -0.024 0.403 1
(6) Δ Prob 3Y GDP Growth < -3% p.a. (%) -0.145 0.035 0.367 -0.255 -0.010 1
Note: Table shows cross-sectional correlation of changes in individual beliefs between the February 2020 and March2020 waves of the GMSU-Vanguard survey (Panel A), and between the February 2020 and April 2020 waves (Panel B).
The first column also highlights that, on average, those investors who became more pessimisticabout average stock returns also became more pessimistic about the probability of a stock marketcrash and a GDP disaster (rows 3 and 6), as well as about the short-run outlook for GDP growth(row 4). However, changes in beliefs about long-run GDP growth and long-run stock marketreturns (rows 2 and 5) are essentially uncorrelated with changes in short-run expected returns.
11We include only those respondents to the February survey who actively change their portfolio equity share by atleast 1% between January 31st and March 31st.
10
Limitations. Before concluding, we point out a number of possible limitations of the currentstudy. First, like all survey-based studies, the presence of measurement error is a potential con-cern, especially for the quantitative interpretation of the results. Second, the population of in-vestors we survey is selected both in terms of being Vanguard clients and in terms of choosing toanswer the survey. Both of these concerns are extensively discussed in our previous work (Giglioet al., 2019) and here we limit ourselves to pointing out that (i) Vanguard is one of the world’slargest asset managers with assets of $6 trillion and over 30 million investors globally (our studydraws from the U.S. population of individual retail investors and retirement plan participants,approximately 10 million investors), thus making it an interesting population to study, and (ii)while measurement error and selection are present, we have found our surveys to reveal interest-ing beliefs that are actually reflected in investors trading decisions. A final concern, more specificto this paper, is that the COVID-19 crisis is a particular shock with a number of idiosyncratic com-ponents. It is therefore unclear how many of the patterns here might generalize to other large eco-nomic shocks. It suffices to say that shocks of this magnitude are so rare that some advancementin our understanding can be achieved by their study even after considering their idiosyncraticlimitations.
III TAKEAWAYS FOR ECONOMIC THEORY
Our purpose in this paper is to document novel patterns of belief dynamics and trading activityduring a substantial market crash. These patterns represent new data moments that can be usefulto calibrate and evaluate economic models. In this section, we briefly highlight the main qualita-tive implications for various models, while leaving a quantitative exploration that requires moretheoretical structure to future research.
Our data is perhaps most directly related to the rare-disaster model of macro-finance (Ri-etz, 1988; Barro, 2006). Our data supports an interesting feature of versions of this model withtime-varying disaster probabilities (Gabaix, 2012; Wachter, 2013): that the occurrence of a crashis associated with higher (perceived) probability of future disasters. This is exactly what we seein the data. However, these models also imply that, precisely because the probability of disas-ters increases, expected returns should also increase following a stock market crash.12 This latterprediction is not supported by our data. The prediction of higher expected returns following astock market crash is a shared feature of many rational-expectation asset pricing models, and inthis sense, the empirical failure is common across this class of models.13 Our paper offers a useful
12More precisely, risk premia should increase. In these models, like in the data, the risk-free rate decreases withthe crash. In our data expected returns decreased from 6.37% to 1.3%, while short-term rates (1 year treasury bills)decreased from 1.44% (February 11th) to 0.39% (March 11th). We conclude that expected excess returns (a form of riskpremium) decreased in the data with the crash.
13The literature’s focus on representative agent models makes the mapping with our data difficult in the absence ofan explicit aggregation theorem. Nonetheless, the literature that documented the negative correlation between expectedrational returns and those elicited via surveys routinely equates average survey-beliefs to those of representative agents(see Greenwood and Shleifer, 2014). On exception is Chen, Joslin and Tran (2012), who explicitly model heterogenousbeliefs about time-varying rare disasters. In that model, the optimists underestimate the probability of a disaster and,therefore, expect higher returns than the pessimists. When the probability of a disaster increases expected returns forboth types of agents increase. In the data, with the exception of a portion of the most pessimistic investors, all investorslower their expected returns after the crash.
11
testing ground for future evolutions of these theories.Our data also highlight mechanisms that are at the core of the theoretical literature on het-
erogenous beliefs and trading (Harrison and Kreps, 1978; Scheinkman and Xiong, 2003; Simsek,2013). Ex-ante optimists have more exposure to equity than ex-ante pessimists and, as a result,they lose more wealth when the crash occurs. In those models, changes of beliefs play a crucialrole in generating trading activity when investor beliefs "cross" each other. Consistent with suchmechanisms, we find that ex-ante optimists lower their beliefs the most after the crash, and cor-respondingly sell the most equity. In most of the literature, belief changes are idiosyncratic at theindividual level, but we show in Table I that even at the individual level there are substantial beliefchanges associated with heterogenous reactions to aggregate events. A full quantitative evalua-tion is outside the scope of this paper and would probably require enriching the existing modelswith additional channels, but our analysis suggests that this class of models can be a promisingdirection to explain the patterns of beliefs and trading that we document.
To conclude, our study provides a unique real-time look inside the mind of stock marketparticipants during the COVID-19 crisis, and the associated stock market crash. It shows that in-vestors turned more pessimistic and increased their perceived probabilities of catastrophic eventsin terms of real economic outcomes and further stock market declines. We also find that investorsreduced their equity exposures according to changes in their expectations. At the same time, wefind that investors also formed a nuanced view of long term prospects. Short-term pessimism wasmatched with unchanged or even improved long-run expectations. By documenting these dy-namics of beliefs and trading during a large market crash, and by characterizing their heterogene-ity across investors, we hope to bring useful additional moments that can help test ad calibratemacro-finance theories.
REFERENCESBarro, Robert J. 2006. “Rare disasters and asset markets in the twentieth century.” Quarterly Journal
of Economics, 121(3): 823–866.Chen, Hui, Scott Joslin, and Ngoc-Khanh Tran. 2012. “Rare disasters and risk sharing with het-
erogeneous beliefs.” The Review of Financial Studies, 25(7): 2189–2224.Gabaix, Xavier. 2012. “Variable rare disasters: An exactly solved framework for ten puzzles in
macro-finance.” Quarterly Journal of Economics, 127(2): 645–700.Giglio, Stefano, Matteo Maggiori, Johannes Stroebel, and Stephen Utkus. 2019. “Five Facts
About Beliefs and Portfolios.” Working Paper.Gormsen, Niels Joachim, and Ralph SJ Koijen. 2020. “Coronavirus: Impact on stock prices and
growth expectations.” University of Chicago, Becker Friedman Institute for Economics Working Paper,, (2020-22).
Greenwood, Robin, and Andrei Shleifer. 2014. “Expectations of returns and expected returns.”The Review of Financial Studies, 27(3): 714–746.
Harrison, J Michael, and David M Kreps. 1978. “Speculative investor behavior in a stock marketwith heterogeneous expectations.” The Quarterly Journal of Economics, 92(2): 323–336.
Landier, Augustin, and David Thesmar. 2020. “Earnings expectations in the covid crisis.” Avail-able at SSRN.
Rietz, Thomas A. 1988. “The equity risk premium a solution.” Journal of monetary Economics,22(1): 117–131.
12

Scheinkman, José A., and Wei Xiong. 2003. “Overconfidence and Speculative Bubbles.” Journal ofPolitical Economy, 111(6): 1183–1220.
Simsek, Alp. 2013. “Belief disagreements and collateral constraints.” Econometrica, 81(1): 1–53.Wachter, Jessica A. 2013. “Can time-varying risk of rare disasters explain aggregate stock market
volatility?” The Journal of Finance, 68(3): 987–1035.
13

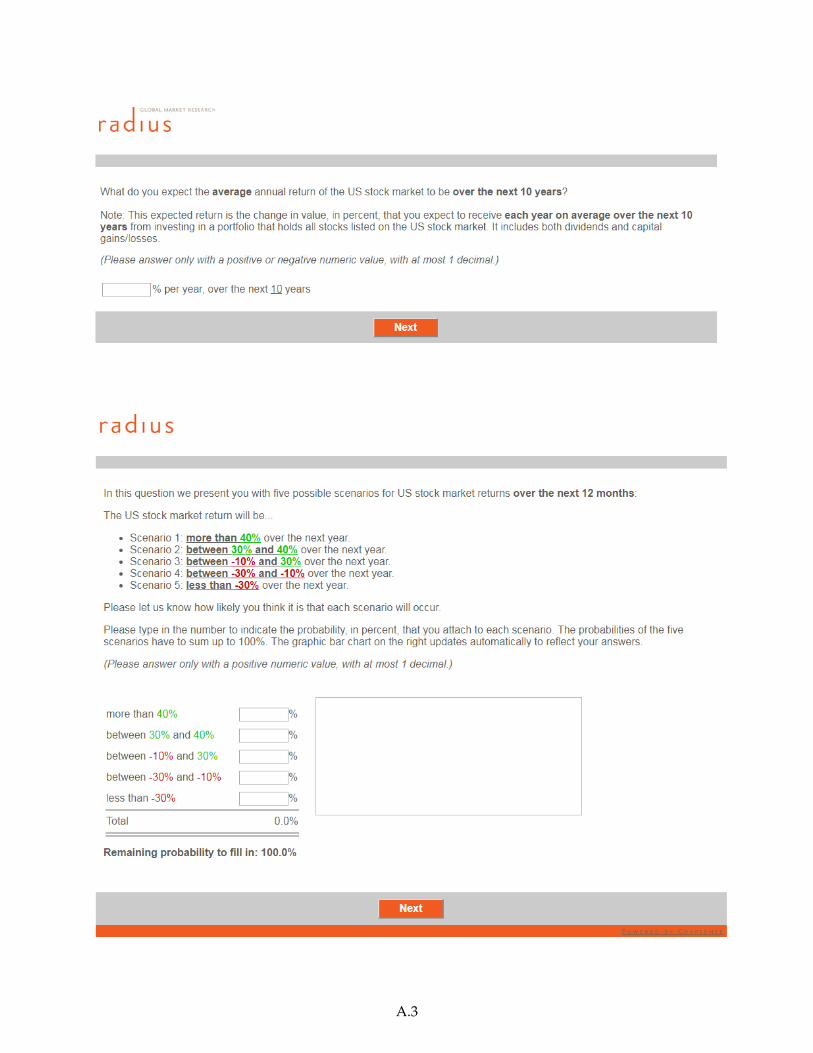
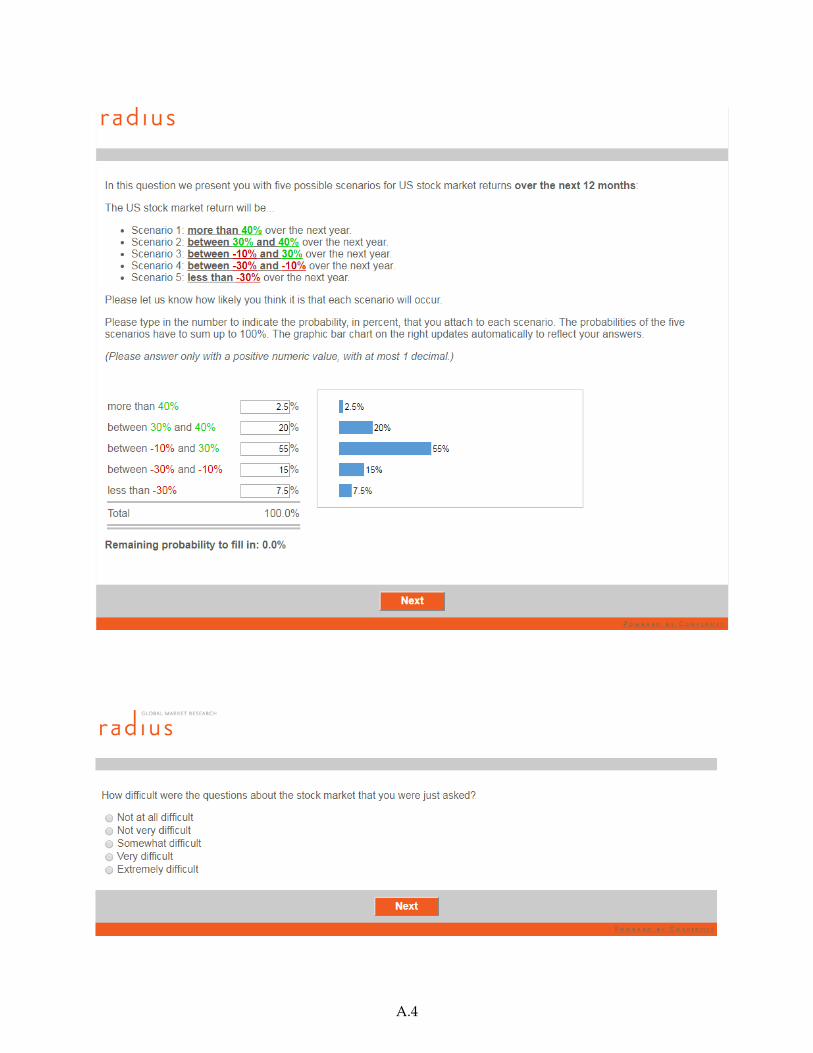
A.1 INVITATION EMAIL AND SURVEY FLOW
In this Appendix, we present screenshots of one complete survey flow. In this iteration of theflow, questions about expected stock returns were asked ahead of questions about expected GDPgrowth; the survey implementation randomizes across these two blocks of questions. We beginby reviewing the invitation email sent to individuals from Vanguard.
https://mg.mail.yahoo.com/neo/launch?.rand=81ld5n76u1qdc[2/13/2017 11:01:01 AM]
Print - Close Window
Subject: [TEST]We need your help, Jane Doe
From: Vanguard ([email protected])
To: [email protected];
Date: Monday, February 13, 2017 10:58 AM
Vanguard would like your input Dear Jane Doe:
Vanguard is conducting a study to understand how investors are thinking about the futureof the stock market, the economy and interest rates.
We are inviting you to provide us with your thoughts by completing a short survey. Thissurvey should take less than ten minutes to complete.
This survey is not a test of your knowledge. Rather, it asks only about your beliefs andexpectations. Importantly, it does not ask for any personal financial information.
The results of the survey will be used for research purposes only. This survey is notsales-related in any way. Your responses will be reported in aggregate with otherresponses. We plan to publish the results in an article or research report onvanguard.com.
To participate in the survey, please click here.
Take the survey
We'd also like to send you this survey up to six times in the coming year, to see if yourbeliefs are changing. If you want to be removed from this study, you have the option toclick the unsubscribe link below.
If you have any questions about this survey, please call 800-662-2739 and refer to thiscode: EXP.
Thank you for participating, and for sharing your thoughts with Vanguard.
Regards,
Stephen UtkusPrincipalVanguard
https://mg.mail.yahoo.com/neo/launch?.rand=81ld5n76u1qdc[2/13/2017 11:01:01 AM]
Legal noticesPlease click here to be removed from this study.
© 2017 The Vanguard Group, Inc. All rights reserved. Privacy policy
455 Devon Park Drive | Wayne, PA 19087-1815 | vanguard.comEXP
A.1

A.2
A.3
A.4

A.5

A.6

A.7

A.8