inside the structure of defined contribution/401(k) plan
TRANSCRIPT

Inside the Structure of Defined Contribution/401(k) Plan Fees, 2013: A study assessing the mechanics of the ‘all-in’ fee
Conducted by Deloitte Consulting LLP for the Investment Company Institute August 2014


Table of contents
I. Background ............................................................................................................................................... 2• Approach ...........................................................................................................................................................2• Report disclosure ................................................................................................................................................3
II. Executive summary ................................................................................................................................... 4• The Deloitte/ICI Defined Contribution/401(k) Fee Study ......................................................................................4• Many fee arrangements exist ..............................................................................................................................5• The ‘all-in’ fee .....................................................................................................................................................6• Apparent ‘all-in’ fee drivers .................................................................................................................................7• Comparing the 2011 and 2013 ‘all-in’ fee studies ..............................................................................................8• Summary ............................................................................................................................................................8
III. Survey respondents ................................................................................................................................. 10• Plan sponsor demographics ..............................................................................................................................10• Plans by asset size segment or number of participants ......................................................................................10• Sample of survey plans compared with the broader 401(k) plan universe ..........................................................10• Plans’ retirement service providers ....................................................................................................................11• Retirement service provider/plan sponsor relationships ......................................................................................12• Participant accounts .........................................................................................................................................13• Automatic plan design features ........................................................................................................................14• Investment features ..........................................................................................................................................15
IV. The mechanics of defined contribution plan fees .................................................................................... 16
V. The ‘all-in’ fee ......................................................................................................................................... 17• Composition of the ‘all-in’ fee...........................................................................................................................17• Payer of fees .....................................................................................................................................................17• Summary ‘all-in’ fee results ...............................................................................................................................17• Weighting survey responses to estimate the ‘all-in’ fee .....................................................................................18• ‘All-in’ fee results ..............................................................................................................................................18
VI. Fee drivers ............................................................................................................................................... 20• ‘All-in’ fee drivers ..............................................................................................................................................20• Factors not found to be significant ...................................................................................................................24
VII. Summary ................................................................................................................................................. 26• Range of fee arrangements ..............................................................................................................................26• The ‘all-in’ fee ...................................................................................................................................................26• Plan size and asset allocation appear to be drivers of the ‘all-in’ fee ..................................................................26
VIII. Appendix ................................................................................................................................................ 27• Data and regression analysis .............................................................................................................................27• Final specification of the regression results ........................................................................................................28• Additional sample information .........................................................................................................................28• Survey weights .................................................................................................................................................30
Glossary of terms ................................................................................................................................................ 32

2
At the end of 2013, employer-sponsored defined contribution plans held an estimated $5.9 trillion in assets,1 and for many American workers, these plans have become an important part of their retirement savings. As assets in defined contribution plans have grown, so too has the scrutiny around these plans, especially because individuals generally manage their own investment choices in these accounts. In addition, the fees charged for these plans have come under particular focus as the Department of Labor (DOL) aims to create greater transparency through regulatory disclosure requirements under sections 404(a) and 408(b)(2) of the Employee Retirement Income Security Act (ERISA). This study was designed to analyze and identify the drivers of defined contribution plan fees.
As part of an ongoing comprehensive research program, the Investment Company Institute (“ICI”) and Deloitte Consulting LLP (“Deloitte”) have prepared the third edition of the Defined Contribution/401(k) Fee Study that was first conducted and published in 2009 and again in 2011.2 Specifically, this report addresses and updates:• The mechanics of defined contribution plan fee
structures;• Components of plan fees; and• Factors that impact fees (“fee drivers”).
ApproachTo accomplish the objectives of the study, Deloitte and ICI supplemented their collective industry experience with a confidential, no-cost, web-based survey conducted by Deloitte from June through December of 2013. The purpose of the survey was to collect market data in order to shed light on how fees are structured within the defined contribution plan market.
• In total, 361 plans participated in the 2013 survey providing detailed information regarding plan characteristics, design, demographics, products, services and the associated fees.
• On average, over 200 data elements were gathered from each plan, covering plan design, investment options and plan, participant and investment fee information.
• Subsequent to the completion of the web-based survey, information was assessed for general completeness and accuracy by Deloitte.
• Deloitte conducted post-survey conversations with the majority of plan sponsors to clarify and confirm responses.
• Results of the survey were compared with other 401(k) industry studies to assess findings and interpret results.
I. Background
1 The largest component is 401(k) plans, with $4.2 trillion in assets, followed by 403(b) plans ($0.9 trillion), other private-sector defined contribution plans ($0.5 trillion) and finally 457 plans ($0.2 trillion). See Investment Company Institute, “The U.S. Retirement Market, First Quarter 2014” (June 2014); available at www.ici.org/info/ret_14_q1_data.xls.
2 See Deloitte Consulting and Investment Company Institute, Defined Contribution/401(k) Fee Study: Inside the Structure of Defined Contribution/401(k) Plan Fees: A Study Assessing the Mechanics of What Drives the ‘All-In’ Fee (June 2009); available at www.ici.org/pdf/rpt_09_dc_401k_fee_study.pdf and Deloitte Consulting and Investment Company Institute, Inside the Structure of Defined Contribution/401(k) Plan Fees: A Study Assessing the Mechanics of the ‘All-In’ Fee (November 2011); available at www.ici.org/pdf/rpt_11_dc_401k_fee_study.pdf.
As used in this document, “Deloitte” means Deloitte Consulting LLP, a subsidiary of Deloitte LLP. Please see www.deloitte.com/us/about for a detailed description of the legal structure of Deloitte LLP and its subsidiaries. Certain services may not be available to attest clients under the rules and regulations of public accounting.
The Investment Company Institute (ICI) is the national association of U.S. investment companies. Please see www.ici.org for more information on ICI.
Report disclosure

Defined Contribution/401(k) Fee Study 2013 3
3 See a complete discussion of the weighting method in the Appendix.
The survey results were prepared utilizing primary data obtained from sources deemed to be reliable, including individuals at the participating plan sponsor and provider organizations. The data collected represent a cross section of defined contribution plans covering a range of participant counts and asset sizes among plans with assets of $1 million or more. Because the distribution of plans within the sample differs from the distribution of all 401(k) plans, to estimate industry-wide fees, the survey responses were weighted with respect to plan size to align with the universe of 401(k) plans with $1 million or more in assets reported by the DOL. Specifically, when analyzing the ‘all-in’ fee in defined contribution plans, survey responses were weighted based on asset size and participant count.3
It is important to note that some plan sponsors did not respond to every question. Deloitte and ICI make no representation or warranty regarding the accuracy of the data provided.
In several instances, the report includes observations and interpretations of the survey results based on the collective research and marketplace experience of both Deloitte and ICI.
The survey report is designed to maintain plan sponsor confidentiality. Participating plan sponsor and provider data will not be disclosed or used in any way that identifies individual survey respondents.
The survey does not evaluate quality of services provided — which can impact fees. Quality of service varies with respect to the range of planning and guidance tools available to the plan sponsor and participants; educational materials; employee meetings; and other components of customer service. Qualitative differences in services may affect fees but are not easily quantified and are not addressed in this report.
No part of this report may be reproduced in any form or by any means without the written permission of Deloitte.
Report disclosure

4
II. Executive summary
The Deloitte/ICI Defined Contribution/401(k) Fee StudyIn 2013, Deloitte conducted a web-based survey of defined contribution plan sponsors, gathering detailed information on plan characteristics, design, products, services and their associated fees. This research report addresses: the mechanics of plan fee structures, components of plan fees and the factors that affect fees (“fee drivers”).
Due to the variety of fee and service structures in the defined contribution/401(k) market, this study created an analytical tool — the ‘all-in’ fee. The ‘all-in’ fee incorporates all administrative, recordkeeping and investment fees, whether assessed at the plan level, the participant-account level or as an asset-based fee, across all parties providing services to the plan — whether they are paid by the employer, the plan or the participants. The ‘all-in’ fee excludes fees that only apply to participants engaged in a particular activity (e.g., loan fees). In addition, the ‘all-in’ fee does not evaluate the quality of the products or services provided.
The 2013 Fee Study looked to identify what appeared to be the drivers of fees across all defined contribution plans. In order to identify those factors that help explain a plan sponsor’s ‘all-in’ fee, the variables listed in the figure below were included in a statistical analysis. This statistical analysis included assessing the impact and correlation of multiple independent variables on the dependent variable — the ‘all-in’ fee as a percentage of plan assets. The statistical analysis found that plan size is a significant fee driver: fees tend to decrease as the average participant account balance, number of participants and total plan assets increase. As can be seen in the chart below, the survey data show this pattern. For example, the median ‘all-in’ fee for plans with $1 million to less than $10 million in assets was 1.27%, compared with 0.37% for plans with $500 million or more in assets. In addition, the analysis found that plans with a higher percentage of plan assets invested in diversified equity holdings tended to have higher ‘all-in’ fees.
‘All-In’ Fee (% of Assets) by Plan Asset Size Segment (Participant Weighted)
Variables
Number of plan participants
Average participant account balance
Plan sponsor industry
Number of business locations
Participant contribution rate
Annual contribution cash flow
Investment allocation
Company stock
Years with current provider
Time since last competitive review
Provider industry type
Provider size
Provider relationship
Employer contribution
Number of investment options
Proprietary investments
Auto-enrollment
Auto-increase
Loan option
Plan
rel
ated
Serv
ice
prov
ider
re
late
d
Plan
de
sign
Potential drivers
Influ
ence
r of
fee
s
1.27%
0.89%
0.63%
0.41%
1.17%
0.82%
0.57%
0.37%
0.00%
0.20%
0.40%
0.60%
0.80%
1.00%
1.20%
1.40%
$1M
–<$1
0M
$10M
–<$1
00M
$100
M–<
$500
M
$500
M or
mor
e
Mean Median
Exhibit 17
Note: Sample includes 401(k) plans with plan assets of $1 million or more.
rela
ted

Defined Contribution/401(k) Fee Study 2013 5
4 The 2009 Fee Study sample had 117 employers representing 130 plans. See Deloitte Consulting and Investment Company Institute, Defined Contribution/401(k) Fee Study: Inside the Structure of Defined Contribution/401(k) Plan Fees: A Study Assessing the Mechanics of What Drives the ‘All-In’ Fee (June 2009); available at www.ici.org/pdf/rpt_09_dc_401k_fee_study.pdf. The 2011 Fee Study sample had 520 employers representing 525 plans. See Deloitte Consulting and Investment Company Institute, Inside the Structure of Defined Contribution/401(k) Plan Fees: A Study Assessing the Mechanics of the ‘All-In’ Fee (November 2011); available at www.ici.org/pdf/rpt_11_dc_401k_fee_study.pdf.
Defined contribution plans represent an important component of American workers’ retirement savings. Regulations intended to create greater transparency as to the cost of plans — for plan sponsors and participants — are drawing more attention to the various fees and fee structures in defined contribution plans. For example, starting on July 1, 2012, for plans covered by ERISA, the DOL’s 408b-2 regulation requires service providers to disclose certain information on compensation and services to plan sponsors or other plan fiduciaries. In addition, beginning August 30, 2012, the DOL’s 404a-5 regulation requires plan administrators of ERISA plans to provide certain investment-level and plan-level fee information to participants in participant-directed individual account plans. In light of this focus on fees, the Survey was designed to study and identify the drivers of fees in defined contribution plans across the industry.
As part of ongoing research programs, ICI and Deloitte combined efforts to update the Defined Contribution/401(k) Fee Study that was first published in 2009 (the “2009 Fee Study”) and updated in 2011 (the “2011 Fee Study”). The data and observations in this study are based on 361 survey responses received from 357 plan sponsors.4 Differences in sample size from 2011 to 2013 can be attributed to a decrease in responses from plans with less than $1 million in plan assets. This and other sample differences mean that results from the 2013 Fee Study cannot be directly compared to results from the 2009 or 2011 Fee Studies.
The 2013 survey was conducted from June through December of 2013. Key findings from the 2013 survey include:• Many fee structures and arrangements exist in the
defined contribution marketplace.• Plan size (in terms of number of participants) was found
to be a significant driver of a plan’s ‘all-in’ fee. Larger plans tend to have lower ‘all-in’ fees as a percentage of plan assets.
• A correlation also exists between the ‘all-in’ fee and the average participant account size in the defined contribution plan. Plans with larger average participant account balances tend to have lower ‘all-in’ fees as a percentage of plan assets.
• Plans with a higher percentage of plan assets invested in diversified equity holdings tend to have higher ‘all-in’ fees.
Many fee arrangements existConsistent with the 2009 and 2011 Fee Studies, plan sponsors and their retirement service providers continue to maintain a variety of fee arrangements to pay for plan services (Exhibit 1). There are three general groups of services that defined contribution plans typically procure. First, defined contribution plans generally require certain administrative services such as compliance (to make sure the plan is administered properly), legal, audit, Form 5500 and trustee services. Administrative services also include recordkeeping services, which maintain participants’ accounts and process participants’ transactions, and
Defined contribution plan total ‘all-in’ fees
Per participant administration
Per plan administration
Asset-based administration
Investment management Other
Investment providers
Investment consultant
Financial advice
Recordkeeping Plan and participant servicing
Compliance Legal Audit
Form 5500 Trustee
Company stock Communications
Education
Exhibit 1
Transactions and other items not included: Loan initiation and maintenance, QDROs, distributions, self-directed brokerage, managed accounts and other transactions driven by participant elections.

6
often also include educational services, materials and communications for participants and plan sponsors. Investment management services are a second category. Investment options are offered through a variety of investment arrangements such as through mutual funds, commingled trusts, separate accounts and insurance products. In some plans, investment services include the offering of company stock or a self-directed brokerage window as an investment option. A third set of services occurs in some instances when the plan sponsor seeks the professional services of an investment consultant or financial adviser and/or financial advice services for participants.
There are a variety of fee arrangements to pay for the wide array of services used by defined contribution plans. The administrative service fees, which cover plan and participant recordkeeping, education, compliance and other administrative functions of the plan, can be charged directly to the employer, the participant account or the plan itself. Furthermore, these fees can be assessed in a variety of ways including as per participant fees, per plan fees or as a percentage of total plan assets (Exhibit 1).
Some or all of these recordkeeping or administrative fees also can be paid through a portion of the asset-based investment expenses (e.g., in the form of 12b-1 fees, shareholder servicing fees or administrative servicing fees), which is often referred to as revenue-sharing.
Asset-based investment fees are those fees that are charged by the investment provider/manager and quoted as a percentage of assets (Exhibit 1). Participants, like all investors, typically pay these asset-based fees as an expense of the investment options in which they invest. These investment fees make up a significant portion of total plan expenses according to our sample — 82% of the ‘all-in’ fee (on a participant-weighted basis). As indicated above, some of these asset-based investment fees may be covering participant services in addition to investment management. Asset-based investment expenses generally include three basic components: (1) investment management fees, which are paid to the investment’s portfolio managers (often referred to as investment advisers); (2) distribution and/or service fees (in the case of mutual funds, these include 12b-1 fees); and (3) other fees of the investment option, including fees to cover custodial, legal, transfer agent
(in the case of mutual funds), recordkeeping and other operating expenses. Portions of the distribution and/or service fees and other fees may be used to compensate the financial professional (e.g., individual broker or plan recordkeeper) for the services provided to the plan and its participants and to offset recordkeeping and administration expenses.
All of the different services and associated fees can be combined together in a variety of different ways based on the needs of the plan sponsor. As plan sponsors negotiate with retirement service providers to obtain services for their plans, a range of scenarios or arrangements is generally considered (e.g., number and types of investment options and their fee structures, proprietary versus non-proprietary investment options, range of participant communications and educational services that will be provided). Plan sponsors generally are not presented a single fee quote, but rather a range of options from each retirement service provider competing for the plan sponsor’s business.
The ‘all-in’ feeBecause plan sponsors allocate the responsibility of these two major expense categories (investment versus administrative or recordkeeping) between participants, the employer and the plan, it is helpful to use a measure that can compare plans despite these different arrangements. Therefore, this study carries forward the concept of the ‘all-in’ fee introduced in the 2009 Fee Study and used again
0.83% 0.78%
0.28%
1.38%
0.73% 0.72%
0.21%
1.23%
0.73% 0.67%
0.29%
1.29%
0.00%
0.40%
0.80%
1.20%
1.60%
2.00%
Mean Median 10th Percentile 90th Percentile
2011 reported 2011 reweighted* 2013*
Exhibit 2: ‘All-In’ Fee: % of Assets (Participant Weighted)
*Sample includes 401(k) plans with plan assets of $1 million or more.

Defined Contribution/401(k) Fee Study 2013 7
5 As explained in the Appendix, these results have been weighted to better reflect the universe of 401(k) plan participants in plans with $1 million or more in assets and therefore the experience of the typical 401(k) plan participant.
6 A variable was determined to be an ‘all-in’ fee driver if it was significant at the 10% level in the regression analysis and robust to multiple specifications. For details of the regression analysis, see the Appendix.
7 This pattern also is seen in mutual fund expense ratios. See Gallagher, “Trends in the Expenses and Fees of Mutual Funds, 2013,” ICI Research Perspective 20, No. 2 (May 2014); available at www.ici.org/pdf/per20-02.pdf.
in the 2011 Fee Study to normalize fee structure variation. The ‘all-in’ fee includes all administrative or recordkeeping fees as well as investment fees (i.e., the investment option’s total expense ratio) whether they are assessed at the plan, employer or participant level.
The ‘all-in’ fee excludes those recordkeeping and administrative activity fees that only apply to particular participants who engage in the activity (e.g., self-directed brokerage, managed accounts, loans, QDROs and distributions). While these specific activity-related fees are an important consideration for participants engaging in the activity, they are not part of the core expense of administering a plan.
Totaling all administrative, recordkeeping and investment fees, the median participant-weighted ‘all-in’ fee for plans in the 2013 Survey was 0.67% (Exhibit 2) or approximately $267 per participant (Exhibit 16).5 The data suggest that the participant at the 10th percentile was in a plan with an ‘all-in’ fee of 0.29%, while the participant at the 90th percentile was in a plan with an ‘all-in’ fee of 1.29%.
Apparent ‘all-in’ fee driversAfter calculating the ‘all-in’ fee for each plan, a regression analysis was conducted to determine those variables that appear to explain a plan’s overall level of fees (measured by the ‘all-in’ fee as a percentage of assets). The drivers6 of a plan’s overall level of fees were: • Plan size as measured by number of participants;• Average participant account balance in the plan; and• The percentage of the plan’s assets in diversified
equity holdings.
The variables related to plan size were negatively correlated with the ‘all-in’ fee, while the percentage of assets in diversified equity holdings was positively correlated to the ‘all-in’ fee.
Within any defined contribution plan, there are fixed costs required to start up and run the plan. A large portion of these fixed costs is driven by legal and regulatory requirements. The survey responses suggest economies are gained as a plan grows in size because these fixed costs can be spread over more participants and/or a larger asset base.
The survey also showed that equity investment options have higher expense ratios than fixed income or money market asset classes.7 The regression analysis indicated that a 10 percentage point shift in plan assets into diversified equity holdings is associated with an added 4.1 basis points to the ‘all-in’ fee (Exhibit A2).
Exhibit 3: Predicted Fees as a Percent of Assets by Account Size and Number
Note: See Exhibit A2 in the Appendix.
of Plan Participants
0.0%
0.2%
0.4%
0.6%
0.8%
1.0%
1.2%
1.4%
1.6%
1.8%
$10,000 $30,000 $50,000 $70,000 $90,000 $110,000 $130,000 $150,000
Fees
as
a Pe
rcen
t of
Ass
ets
Average Account Balance
Number of Plan Participants 10 100 1,000 10,000 50,000

8
8 The 2011 Fee Study included 401(k) plans with plan assets under $1 million, the 2013 Fee Study does not. The Department of Labor’s Form 5500 data, which are used to weight both the 2011 and 2013 Fee Studies, are restricted to reflect 401(k) plans in 2011 with $1 million or more in plan assets.
9 The equity variable used varied across the studies. In the 2013 regression analysis, the diversified equity holdings variable is the percentage of plan assets invested in equity funds (including real estate funds) and the equity portion (average 60%) of balanced, target date and lifestyle funds. In the 2011 regression, the equity investment options variable is the percentage of the plan assets invested in equity funds (including real estate funds) and company stock. To the extent that equity funds (including real estate funds) represent a significant share of both variables, the two variables are similar concepts.
10 The S&P 500 total return index increased 53.6% between year-end 2011 and year-end 2013. The long-term corporate bond total return index increased 2.8% over the same time period. See Morningstar, Ibbotson® Stocks, Bonds, Bills, and Inflation® (SBBI®) 2014 Classic Yearbook: Market Results for Stocks, Bonds, Bills, and Inflation, Chicago, IL: Morningstar, Inc. (2014).
The results from a regression analysis showed a relatively high correlation with the ‘all-in’ fee (R2 of 0.5046) when treating the ‘all-in’ fee (measured as a percentage of assets) as the dependent variable. A predictive chart can be created that displays an ‘all-in’ fee by plan size that is consistent with the survey results. For example, Exhibit 3 highlights the negative correlation between the ‘all-in’ fee and the average account balance (follow a given line from left to right) and the number of participants in the plan (lines shift down as plan size increases).
Comparing the 2011 and 2013 ‘all-in’ fee studiesThe results reported in the 2011 Fee Study should not be compared directly to the results reported in the 2013 Fee Study. Three main issues arise when attempting to compare the 2011 and 2013 survey samples: (1) the availability of Form 5500 data; (2) the absence of plans with less than $1 million in assets in the 2013 sample; and (3) limited overlap between the two samples. Nevertheless, Exhibit 2 reports the top-line ‘all-in’ fee for both surveys. The first set of bars reports the 2011 Fee Study results as published. Those results include plans of all sizes and were weighted to the 2008 Form 5500 data (the latest available at the time of the analysis). The second set of bars reweights the 2011 sample to the 2011 Form 5500 data and restricts the analysis to plans with $1 million or more in plan assets. These new numbers indicate an average (mean) ‘all-in’ fee of 0.73% in 2011 and a median of 0.72%. The median participant ‘all-in’ fee of 0.67% of assets in the 2013 Fee Study is lower than the comparable 2011 reweighted ‘all-in’ fee, which is 0.72% of assets. There are a number of factors that may contribute to the decline in the median ‘all-in’ fee between the 2011 Fee Study and the study conducted in 2013. These factors include different samples of plan sponsors;8 different asset allocations (some driven by market
performance between the two years); changes in assets; and different fee structures within the industry.
Despite these differences, this study found the three main drivers from the 2011 survey continued to be important factors in explaining the variation in fees across plans within the 2013 survey sample. Specifically, this study showed that plan size as measured by number of participants, average participant account balance and percentage of plan assets invested in diversified equity holdings were drivers of a plan’s ‘all-in’ fee, which was also the case in the 2011 Fee Study.9
The lower median ‘all-in’ fee in the 2013 Fee Study versus the 2011 Fee Study may also be related to the relationship between asset-based fees and non-asset-based fees. Since 2011, financial markets have grown,10 and total plan assets have grown. As defined contribution plan assets grew, the non-asset based fees would have been spread out over a larger asset base causing them to fall as a percentage of assets.
SummaryThis report, which updates a similar analysis performed in 2009 and 2011, was developed to provide marketplace survey data that can help explain the mechanics, components and drivers of defined contribution/401(k) plan fees. This Study used an analytical bottom-line measure — the ‘all-in’ fee — to compare total plan fees across the varied pricing practices (per plan fees, per participant fees and asset-based fees) used in defined contribution/401(k) plans.
The results showed that the ‘all-in’ fee varies across plans of different plan size market segments. The Survey found that asset-based investment-related fees represent 82%

Defined Contribution/401(k) Fee Study 2013 9
of defined contribution/401(k) plan fees and expenses (on a participant-weighted basis). In many plans, a portion of these fees is used to pay for some or all of the administrative and recordkeeping services of the plans, in addition to investment management.
This study indicates that plan size — measured by number of participants in the plan and average participant account balance — and the percentage of plan assets invested in diversified equity holdings are drivers of fees. The ‘all-in’ fee as a percentage of assets tends to be lower in plans with a higher number of participants and higher average participant account balances. Defined contribution/401(k) plans have fixed administrative costs necessary to run a plan that tend to cause smaller plans to have higher relative fees as a percentage of assets. As a plan grows in size, economies are gained which spread the fixed costs over more participants and a larger asset base. The ‘all-in’ fee tends to be higher the larger the share of plan assets invested in diversified equity holdings, reflecting the higher expense ratios typically associated with equity investments.
A number of other variables were tested and appear not to be drivers of the ‘all-in’ fee. In the 2013 Fee Study, other plan related variables, which do not appear to drive fees, include participant contribution rates, the annual contribution cash flow and presence of company stock. The number of business locations, which might have increased the complexity in delivering participant education, also was not found to be a driver of fees, nor was the plan sponsor’s industry. None of the service provider related variables appear to drive plan fees. The type of service provider (mutual fund company, life insurance company, bank, third party administrator), size of service provider, length of time since the last competitive review of the retirement service provider by the plan sponsor, tenure with the service provider and presence of other service relationships (specifically, a defined benefit or non-qualified plan) were not found to be significant factors in a plan’s ‘all-in’ fee. Plan design related variables also do not appear
to drive plan fees. The percentage of assets invested in the investment products of the service provider (proprietary investments) did not appear to have a significant impact on the ‘all-in’ fee as a percentage of assets. In addition, the number of investment options, the use of automatic enrollment or automatic increase, the availability of a loan option and employer contribution rates do not appear to drive fees.
The remainder of this report discusses the construction and analysis of the total fees in defined contribution/401(k) plans and the factors that influence fees, referred to as “drivers.” Section III describes the characteristics of the plan sponsors that participated in the survey. Section IV explains the mechanics of how fees are charged and the services that the plans and their participants receive for the fees. Section V introduces the concept of the comprehensive bottom-line or ‘all-in’ fee, and how this measure facilitates comparisons across plans. Section VI identifies the drivers that explain fee differences among plans. Section VII summarizes the Study’s findings. Section VIII, the Appendix, provides the statistical regression analysis results, additional detail on the composition of the sample of plans, an explanation of the sample weighting and a glossary.

10
11 Statistics with regard to sample composition presented in this section are not weighted.
12 The latest year available is for 2011 plan year data. See U.S. Department of Labor, Employee Benefits Security Administration, Private Pension Plan Bulletin Abstract of 2011 Form 5500 Annual Reports (Version 1.0; June 2013); available at www.dol.gov/ebsa/pdf/2011pensionplanbulletin.pdf.
Plan sponsor demographicsThis section highlights the characteristics of the 361 defined contribution plans that participated in the survey including their demographics, provider relationships, size and plan design features.11 When assessing plan fees, these characteristics provide context as to the composition of survey participants. Where possible, the sample of plan sponsors is compared to a universe aggregate provided by the DOL Form 5500 benchmark for 401(k) plans or other survey samples.
Plans by asset size segment or number of participantsA total of 357 employers representing 361 defined contribution plans participated in the 2013 Deloitte/ICI Fee Study. Nearly all (more than 96%) plans in the survey are 401(k) plans. The demographic information reported in the following pages was used in the study to help clarify which specific characteristics, if any, appear to drive plan fees.
Whether measured by plan assets or number of plan participants, the 2013 sample covers a wide range of plan sizes across plans with $1 million or more in assets. Because
the distribution of plans across the sample differs from the universe of 401(k) plans, survey results related to the ‘all-in’ fee were weighted to represent the distribution of participants, plans or assets in the 401(k) universe of plans with $1 million or more in assets with respect to plan assets and number of participants.
Sample of survey plans compared with the broader 401(k) plan universeThe universe of defined contribution plans is diverse, consisting of plans of various asset sizes and numbers of participants. The 2013 Deloitte/ICI sample consisted of 361 plans each with $1 million or more in assets; collectively the sample covered 2.7 million participants and $240 billion in plan assets. In plan year 2011, DOL Form 5500 data covering all plan sizes indicate there were approximately 513,500 401(k) plans, with more than 60 million active participants and $3.1 trillion in assets.12 Limiting the Form 5500 data to correspond to the Deloitte/ICI sample indicates there were about 186,200 plans with $1 million or more in assets, covering more than 55 million active participants, holding $3.0 trillion in assets.
III. Survey respondents
Exhibit 4: Comparison of Survey Sample of Plans with DOL 401(k) Plan Universe by Plan Asset Size Segment
Plan Asset Size Segment Percent of Plans Percent of Assets Percent of Participants
DOL 401(k) Plan Universe Deloitte/ICI
DOL 401(k) Plan Universe Deloitte/ICI
DOL 401(k) Plan Universe Deloitte/ICI
<$1M 62.2 0.0 3.6 0.0 8.9 0.0
$1M–<$10M 33.2 19.9 14.5 0.1 19.6 0.4
$10M–<$50M 3.5 29.9 11.1 1.1 15.1 2.1
$50M–<$100M 0.5 9.7 5.2 1.0 6.8 2.0
$100M–<$250M 0.3 11.4 8.4 2.7 10.2 5.9
$250M–<$500M 0.1 9.7 7.4 5.3 7.0 7.0
$500M–$1B 0.1 6.4 8.2 6.7 7.2 7.7
>$1B 0.1 13.0 41.6 83.1 25.1 74.9
Note: Deloitte/ICI sample includes 401(k) plans with plan assets of $1 million or more. Percentages may not add to 100% because of rounding.
Defined Contribution/401(k) Fee Study 2013 11
13 See Figure A5 in the Appendix for the distribution of the sample by number of participants in the plans.
14 See the discussion of weighting in the Appendix, which explains the weighting methodology and provides additional summary results.
15 See additional discussion of regional and industry representation in the Appendix.
More than half of plans in the DOL 401(k) plan universe are small plans: 62.2% of 401(k) plans in the DOL universe have less than $1 million in plan assets and no plans in the 2013 Survey are that small (Exhibit 4). On the other hand, larger plans hold a sizable portion of plan assets. The largest plans (plans with more than $1 billion in assets) held 41.6% of all 401(k) plan assets in the DOL universe benchmark and 83.1% of the plan assets in the Deloitte/ICI survey sample.
Compared with these distributions of plans or plan assets, 401(k) plan participants tended to be distributed more evenly across the plan asset size segments (Exhibit 4). For example, the DOL 401(k) universe data show that 25.1% of 401(k) participants are in the largest plan asset size segment (plans with more than $1 billion in assets) and 8.9% are in the smallest size segment (plans with less than $1 million in assets). In the Deloitte/ICI survey sample, however, 74.9% of participants are in the largest plans and none are in the smallest plans.
Although a diverse cross section of defined contribution plans was included in the 2013 Survey, comparison of the Deloitte/ICI sample to the DOL benchmark universe reveals that the sample is more heavily concentrated in larger plans than the universe. The sample used in the 2013 Fee Study includes no plans with less than $1 million in assets. Thus, when reporting ‘all-in’ fee results in this report, the sample data have been weighted to the universe of 401(k) plans with $1 million or more in plan assets to better represent the actual distribution of plans, participants and assets in the comparable overall 401(k) universe. The plans included in the survey have been weighted to the comparable universe based on the plan’s size both in terms of number of participants13 and asset size segment.14
Plan sponsors surveyed represented all geographic regions in the United States. The 2013 sample of plan sponsor survey respondents also represented multiple industry groupings (Exhibit A6 in the Appendix).15
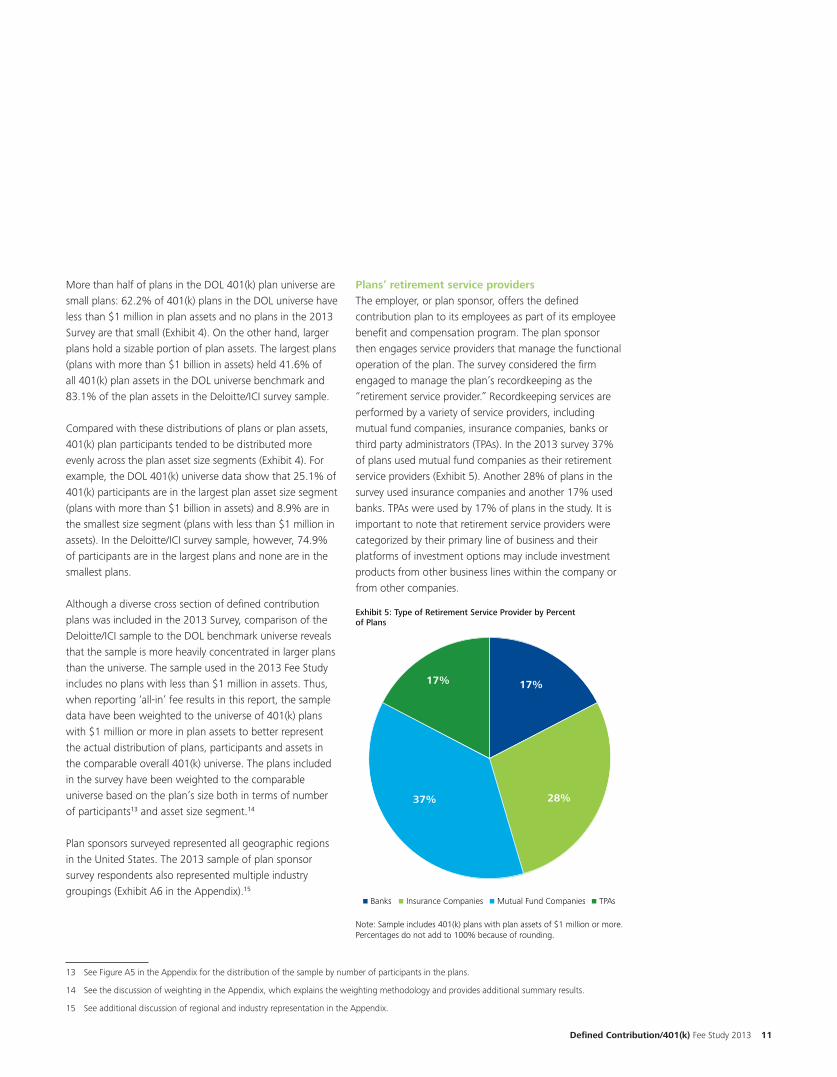
Plans’ retirement service providersThe employer, or plan sponsor, offers the defined contribution plan to its employees as part of its employee benefit and compensation program. The plan sponsor then engages service providers that manage the functional operation of the plan. The survey considered the firm engaged to manage the plan’s recordkeeping as the “retirement service provider.” Recordkeeping services are performed by a variety of service providers, including mutual fund companies, insurance companies, banks or third party administrators (TPAs). In the 2013 survey 37% of plans used mutual fund companies as their retirement service providers (Exhibit 5). Another 28% of plans in the survey used insurance companies and another 17% used banks. TPAs were used by 17% of plans in the study. It is important to note that retirement service providers were categorized by their primary line of business and their platforms of investment options may include investment products from other business lines within the company or from other companies.
17%
28% 37%
17%
Banks Insurance Companies Mutual Fund Companies TPAs
Exhibit 5: Type of Retirement Service Provider by Percent
Note: Sample includes 401(k) plans with plan assets of $1 million or more.Percentages do not add to 100% because of rounding.
of Plans
12
16 It should be noted that Exhibit A7 in the Appendix highlights the primary line of business of the retirement service provider and it is often the case that multiple investment product lines are offered on recordkeeping platforms in some cases representing multiple providers.
17 See “Special Report: DC Record Keepers,” Pensions & Investments, March 3, 2014.
Recordkeeping services include posting payroll contributions, plan payments, earnings and adjustments, plan and participant servicing and communications, compliance testing and other regulatory requirements and educational materials and services. With respect to some activities, plan sponsors may select varying degrees of recordkeeping service options.
Recordkeeping services for plans were delivered by 81 different retirement service providers (Exhibit A7 in the Appendix).16 The providers include 22 of the top 25 recordkeepers as measured by defined contribution plan participants according to Pensions & Investments.17 At least 17 different retirement service providers (and typically many more) were represented within each plan asset segment. These numbers do not represent the range of investment providers included in the survey because many recordkeeping platforms provide access to multiple investment providers.
Retirement service provider/plan sponsor relationshipsThe relationships plan sponsors have with their retirement service providers were examined to determine apparent impacts on overall defined contribution plan fees (e.g., ancillary business relationships, timing of the last competitive review and tenure of the plan with the retirement service provider).
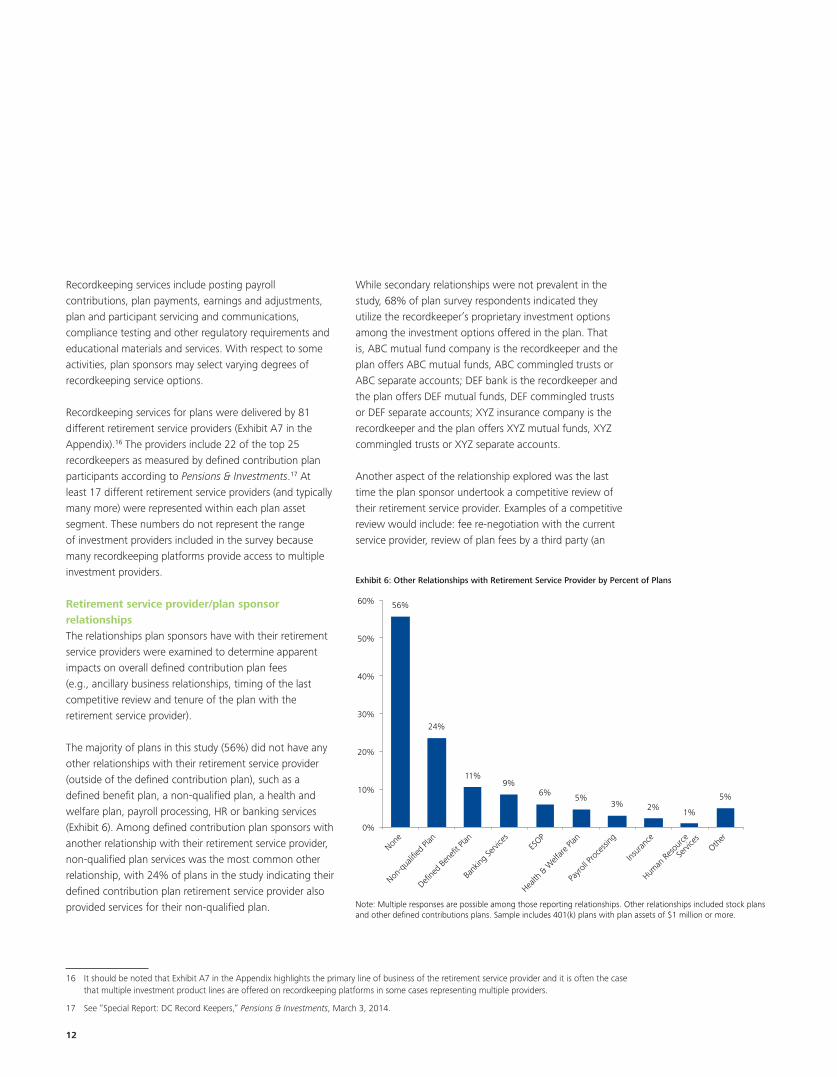
The majority of plans in this study (56%) did not have any other relationships with their retirement service provider (outside of the defined contribution plan), such as a defined benefit plan, a non-qualified plan, a health and welfare plan, payroll processing, HR or banking services (Exhibit 6). Among defined contribution plan sponsors with another relationship with their retirement service provider, non-qualified plan services was the most common other relationship, with 24% of plans in the study indicating their defined contribution plan retirement service provider also provided services for their non-qualified plan.
While secondary relationships were not prevalent in the study, 68% of plan survey respondents indicated they utilize the recordkeeper’s proprietary investment options among the investment options offered in the plan. That is, ABC mutual fund company is the recordkeeper and the plan offers ABC mutual funds, ABC commingled trusts or ABC separate accounts; DEF bank is the recordkeeper and the plan offers DEF mutual funds, DEF commingled trusts or DEF separate accounts; XYZ insurance company is the recordkeeper and the plan offers XYZ mutual funds, XYZ commingled trusts or XYZ separate accounts.
Another aspect of the relationship explored was the last time the plan sponsor undertook a competitive review of their retirement service provider. Examples of a competitive review would include: fee re-negotiation with the current service provider, review of plan fees by a third party (an
Exhibit 6: Other Relationships with Retirement Service Provider by Percent of Plans
Note: Multiple responses are possible among those reporting relationships. Other relationships included stock plans and other defined contributions plans. Sample includes 401(k) plans with plan assets of $1 million or more.
56%
24%
11% 9%
6% 5%
3% 2% 1%
5%
0%
10%
20%
30%
40%
50%
60%
None
Non-q
ualifi
ed Pl
an
Define
d Ben
efit P
lan
Bank
ing Se
rvice
s
ESOP
Health
& W
elfare
Plan
Payro
ll Pro
cessi
ng
Insur
ance
Human
Reso
urce
Servi
ces
Other

Defined Contribution/401(k) Fee Study 2013 13
investment or benefits consultant) or a complete vendor search with a request for proposal (RFP). Half of plans had undertaken a competitive review within the past two years; 24% of plans had undertaken a competitive review within the past three to five years; and the remaining 26% had not undertaken a review within the past five years (Exhibit 7).
In terms of plan sponsor tenure with the retirement service provider, 75% of plans had been with their retirement service providers for five years or more. Another 10% of plans had been with their retirement service providers for three to less than five years. The remaining 15% of plans had been with their retirement service providers for less than three years.
Participant accountsThe 2013 survey captured a wide range of average participant account balances, allowing insight into how variation in this key factor impacts the ‘all-in’ fee. The plan-level average participant account size in the 2013 Survey was $81,340 and the median plan had an average account size of $67,571 (Exhibit 8). The plan at the 90th percentile had an average account size which was more than 7
times the average account balance of the plan at the 10th percentile ($148,413 compared with $20,745).
Plan-level average participant account balances varied across plan asset segments. Plans in the larger asset segments tended to have higher average participant account balances compared with smaller plan asset size segments (Exhibit 8). Overall, the plan-level average account balance was $81,340 in the 2013 study and it ranged from $65,761 in the smallest plan asset segment ($1 million to less than $10 million) to $114,261 in the largest plan asset segment ($500 million or more).
Exhibit 7: Number of Years Since Last Competitive Review
Note: Sample includes 401(k) plans with plan assets of $1 million or more.
by Percent of Plans
28%
22% 24%
26%
Within the past year 1 to 2 years
3 to 5 years More than 5 years
Exhibit 8: Plan-Level Average Account Balances
81,340 65,761 74,419 78,798
114,261
Mean
67,57139,042
63,672 70,080
110,984
Median
20,745 15,048 21,814 20,73945,079
10th percentile
148,413 131,931 129,281 134,966
194,051
0
50,000
100,000
150,000
200,000
All plans ($1M or More)
$1M–<$10M $10M–<$100M $100M–<$500M $500M or more
0
50,000
100,000
150,000
200,000
All plans ($1M or More)
$1M–<$10M $10M–<$100M $100M–<$500M $500M or more
0
50,000
100,000
150,000
200,000
All plans ($1M or More)
$1M–<$10M $10M–<$100M $100M–<$500M $500M or more
0
50,000
100,000
150,000
200,000
All plans ($1M or More)
$1M–<$10M $10M–<$100M $100M–<$500M $500M or more
90th percentile
Note: Sample includes 401(k) plans with plan assets of $1 million or more.

14
18 Among plans with automatic enrollment, about three-quarters default to a target date investment option and the average default initial participant contribution rate is 3.6%.
19 See Deloitte, International Foundation of Employee Benefit Plans (IFEBP), and the International Society of Certified Employee Benefit Specialists (ISCEBS), Annual 401(k) Benchmarking Survey: Exploring new channels for engaging and educating employees on saving for retirement and improving overall retirement readiness 2012 Edition (2013); available at www.iscebs.org/Resources/Surveys/Documents/401kbenchmarkingsurvey2012.pdf; and Plan Sponsor Council of America (PSCA), 56th Annual Survey of Profit Sharing and 401(k) Plans: Reflecting 2012 Plan Experience, Chicago, IL: (2013). Like the 2013 Deloitte/ICI Fee Study sample, the Deloitte/IFEBP/ISCEBS Benchmarking Survey and the PSCA survey also are focused on larger plans where auto-enrollment is more common.
Plan sponsors provided the average participant contribution rate for their plan. The overall average participant contribution rate among all plans was 6.5% (Exhibit 9). More than one-third of plans (36%) reported average participant contribution rates of less than 6%, 37% of plans had average participant contribution rates of 6% to less than 8%, and the remaining 27% of plans had average participant contribution rates of 8% or more.
Automatic plan design featuresAutomatic plan design features — such as automatic enrollment and automatic increases in contributions (also called auto step-up or auto-escalation) — were surveyed again in the 2013 Fee Study.
In the 2013 sample, 52% of plans had automatic enrollment (Exhibit 10).18 This result is similar to the 2012 401(k) Benchmarking Survey conducted by Deloitte, IFEBP and ISCEBS, which found that 57% of plans used auto-enrollment, and to PSCA’s 2012 survey results, which found that 47% of plans had automatic enrollment.19
Automatic escalation or increase is a less utilized plan design feature than auto-enrollment. In the 2013 Study, 41% of participants were in plans with an automatic step-up feature (Exhibit 10).
Exhibit 10: Auto-Enrollment and Auto-Escalation by Percent of Plans
Auto-Enrollment
Yes No Total
Auto
-es
cala
tion Yes 33 8 41
No 19 40 59
Total 52 48 100
Note: Sample includes 401(k) plans with plan assets of $1 million or more.
Additional plan characteristics were analyzed to gain insight into the complexity of the plan, including the plan sponsor’s number of business locations. This information was used to determine if business complexity characteristics appeared to impact fees. In the 2013 sample, almost one-quarter of the plans (24%) indicated they had only one business location, 9% had two business locations, 8% had three business locations, and at the other extreme, 55% of the plans in the sample had six or more business locations.
Exhibit 9: Average Participant Contribution Rate Per Plan by Percent of Plans
3%
33%
37%
19%
8%
<3% 3%–<6% 6%–<8% 8%–<10% 10%+
Note: Sample includes 401(k) plans with plan assets of $1 million or more.
Median: 6.5%Average: 6.5%
Defined Contribution/401(k) Fee Study 2013 15
20 ICI estimates that 401(k) plans in aggregate had $4.2 trillion in assets at year-end 2013 and $2.7 trillion, or 63%, was invested in mutual funds. See Investment Company Institute, “The U.S. Retirement Market, First Quarter 2014” (June 2014); available at www.ici.org/info/ret_14_q1_data.xls.
21 A target date investment option pursues a long-term investment strategy, using a mix of asset classes, or asset allocation, that the investment manager adjusts to become less focused on growth and more focused on income over time as the investment option approaches and passes the target date, which is usually indicated in the investment option’s name. The target date generally is the date at which the typical investor for whom that investment is designed would reach retirement age and stop making new investments in the investment.
22 See Holden, VanDerhei, Alonso, and Bass, “401(k) Plan Asset Allocation, Account Balances, and Loan Activity in 2012,” ICI Perspective and EBRI Issue Brief (December 2013); available at www.ici.org/pdf/per19-12.pdf.
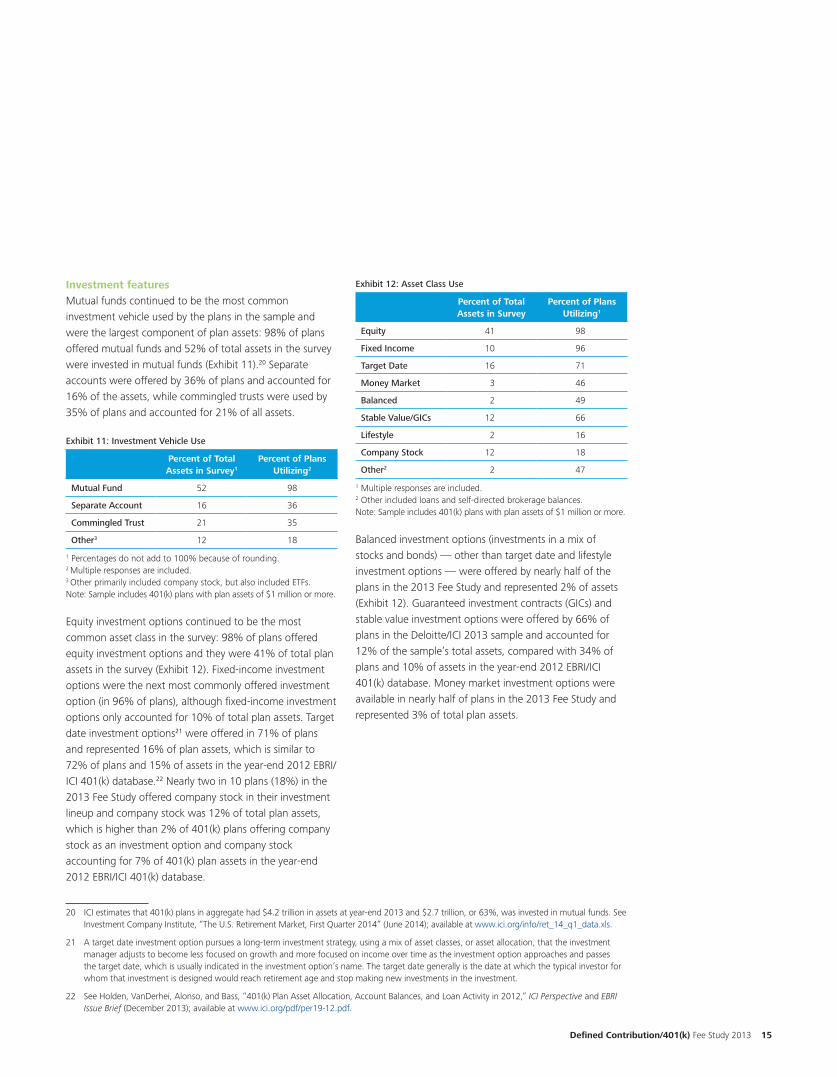
Investment featuresMutual funds continued to be the most common investment vehicle used by the plans in the sample and were the largest component of plan assets: 98% of plans offered mutual funds and 52% of total assets in the survey were invested in mutual funds (Exhibit 11).20 Separate accounts were offered by 36% of plans and accounted for 16% of the assets, while commingled trusts were used by 35% of plans and accounted for 21% of all assets.
Exhibit 11: Investment Vehicle Use
Percent of Total Assets in Survey1
Percent of Plans Utilizing2
Mutual Fund 52 98
Separate Account 16 36
Commingled Trust 21 35
Other3 12 18
1 Percentages do not add to 100% because of rounding.2 Multiple responses are included.3 Other primarily included company stock, but also included ETFs.Note: Sample includes 401(k) plans with plan assets of $1 million or more.
Equity investment options continued to be the most common asset class in the survey: 98% of plans offered equity investment options and they were 41% of total plan assets in the survey (Exhibit 12). Fixed-income investment options were the next most commonly offered investment option (in 96% of plans), although fixed-income investment options only accounted for 10% of total plan assets. Target date investment options21 were offered in 71% of plans and represented 16% of plan assets, which is similar to 72% of plans and 15% of assets in the year-end 2012 EBRI/ICI 401(k) database.22 Nearly two in 10 plans (18%) in the 2013 Fee Study offered company stock in their investment lineup and company stock was 12% of total plan assets, which is higher than 2% of 401(k) plans offering company stock as an investment option and company stock accounting for 7% of 401(k) plan assets in the year-end 2012 EBRI/ICI 401(k) database.
Exhibit 12: Asset Class Use
Percent of Total Assets in Survey
Percent of Plans Utilizing1
Equity 41 98
Fixed Income 10 96
Target Date 16 71
Money Market 3 46
Balanced 2 49
Stable Value/GICs 12 66
Lifestyle 2 16
Company Stock 12 18
Other2 2 47
1 Multiple responses are included.2 Other included loans and self-directed brokerage balances.Note: Sample includes 401(k) plans with plan assets of $1 million or more.
Balanced investment options (investments in a mix of stocks and bonds) — other than target date and lifestyle investment options — were offered by nearly half of the plans in the 2013 Fee Study and represented 2% of assets (Exhibit 12). Guaranteed investment contracts (GICs) and stable value investment options were offered by 66% of plans in the Deloitte/ICI 2013 sample and accounted for 12% of the sample’s total assets, compared with 34% of plans and 10% of assets in the year-end 2012 EBRI/ICI 401(k) database. Money market investment options were available in nearly half of plans in the 2013 Fee Study and represented 3% of total plan assets.

16
To understand the potential drivers of defined contribution/401(k) fees, an understanding of the various elements and how they interact is essential. The total defined contribution/401(k) fee can be split into two major categories: investment-related fees and administrative fees.
Defined contribution/401(k) plans are tax-advantaged savings vehicles in which individuals typically select the asset allocation for their accounts given the range of investment options offered by their plans. A key component of a 401(k) plan is the asset management services that the various investment managers provide. The investment managers charge a fee for these investment services, and these fees are reported as a percentage of the total assets invested in the particular investment vehicle (mutual fund, separate account, commingled trust or other investment product). These fees vary based on the amount of assets invested and the product in which they are invested.
Unlike a retail investment account, defined contribution/401(k) plans must comply with certain regulations (e.g., to comply with fiduciary rules and maintain the tax-qualified status of the plan) as well as provide additional services that may exceed the services a typical investment account requires. Some of these administrative services are provided to the employer or plan sponsor, such as plan audits, legal services and communication campaigns. Other administrative services are provided directly to the plan participant, such as education about the investment offerings and the provision of benefits statements.
Payment for these administrative services can be handled in a number of ways. The plan sponsor determines who pays each fee (employer, participant or from plan assets) and how that fee is assessed (Exhibit 13). (Certain start up and design costs must be paid by the plan sponsor under DOL rules.) Payment is generally handled through one or more of the following methods:
• Dollar per plan and/or dollar per participant fees that are paid by the employer, participant, plan or some combination;
• Asset-based fees (based on a percentage of plan or investment assets) that are paid for by the employer, participant, plan or some combination; and/or
• Specialized participant activity related fees, most often paid for by participants engaging in the activity (e.g., self-directed brokerage, managed accounts, loans, QDROs and distributions).
Additionally within defined contribution/401(k) plans, the manager of an investment option may agree to pay a portion of its investment fee to a service provider (in the case of 401(k) plans, generally the recordkeeper). This amount (often referred to as revenue sharing) is used to help offset the cost of the administrative services provided by the retirement service provider that would otherwise be charged directly to the plans, employers and/or participants.
These revenue-sharing fees present themselves in a variety of ways including 12b-1 fees, sub-transfer agency fees, administrative servicing fees and shareholder servicing fees. Whether the plan uses non-proprietary investment options or proprietary investment options — that is the investment provider is affiliated with the plan’s recordkeeper — some of those asset-based investment fees (in the form of shareholder or administrative servicing fees) can be used to cover administrative services.
IV. The mechanics of defined contribution plan fees
Exhibit 13
Defined contribution/401(k) plan fee mechanics
Employer/plan Recordkeeper/retirement
service provider
Participants Investment providers
Recordkeeping and administration; plan service and consulting;
legal, compliance and regulatory
Participant service, education, advice and communication
Asset management; investment products
Expense ratio (% of assets)
Direct fees: $ per participant; % asset based; transactional fees
Recordkeeping/administrative
payment (% of assets) Recordkeeping;
distribution
Direct fees: $ per participant; % asset based; transactional fees
Fee payment/form of fee payment
Services provided

Defined Contribution/401(k) Fee Study 2013 17
23 Other survey results suggest that this is generally achieved through forfeited employer contributions.
Consistent with the 2009 and 2011 Fee Studies, an ‘all-in’ fee was calculated, which allows for a more direct comparison of the overall fees being paid by the plans participating in the survey. Viewing fees from an ‘all-in’ fee perspective addresses the range of varying structures and arrangements for service payments due to: • Different service delivery mechanisms and associated
fees; and • Per plan, per participant and asset-based fee types.
By rolling all services and fee types into an ‘all-in’ fee, the data can be analyzed more consistently across plans and within segments to compare and discern different fee levels.
Composition of the ‘all-in’ feeFor the purpose of this study, the ‘all-in’ fee was based on three general service elements:1. Administration, recordkeeping, communication and
education;2. Investment management; and3. Plan sponsor investment consulting/financial advice or
financial advice to participants.
As mentioned in the previous section, fees for specialized participant activities such as self-directed brokerage, managed accounts, loans, QDROs and distributions are not included in the ‘all-in’ fee. While these specific activity-related fees are an important consideration for participants engaging in the activity, they are not part of the core expense of administering a plan.
The total fee elements were dominated by the fees and expenses of investments at 82% while recordkeeping, administrative and financial advice fees made up 18% of total fees. However, it is important to note that some recordkeeping and participant service expenses may be included in the investment fees. Additional highlights of the ‘all-in’ fee composition include:• Plan sponsor investment adviser fees — external to
the recordkeeper — were reported by 16% of plans covering 37% of participants.
• Separately charged plan fees for independent financial advice for participants existed in 5% of plans covering 7% of participants.
Payer of feesWith regard to plan fees, participants bear the majority of 401(k) expenses. Similar to any other employee benefit (e.g., health insurance), the employer determines whether the employee, employer or both will pay for the benefit. According to the Survey, on average, participants pay 87% of total plan fees while employers pay 9% and the plans cover 3%23 (Exhibit 14).
Summary ‘all-in’ fee resultsIn this study, the ‘all-in’ fee was analyzed and compared across four defined contribution plan asset size segments. The ‘all-in’ fee was primarily analyzed as a percentage of plan assets. To more accurately represent the ‘all-in’ fee paid by the typical defined contribution plan participant, survey responses were weighted to the DOL universe of 401(k) plans with $1 million or more in plan assets using standard statistical methods. This section explains the importance of weighting the sample’s responses (with additional detail on the weighting procedure in the Appendix) and then presents summary ‘all-in’ fee results.
V. The ‘all-in’ fee
Exhibit 14: Payer of ‘All-In’ Fees by Percent of Plans in Plan Asset Size Segment (Participant Weighted)
Note: Sample includes 401(k) plans with plan assets of $1 million or more. Percentages may not add to 100% because of rounding.
87%
77%
88% 90% 91%
9% 17%
9% 6% 6% 3% 6% 2% 4% 2% 0
10
20
30
40
50
60
70
80
90
100
All plans ($1M or More)
$1M–<$10M $10M–<$100M $100M–<$500M $500M or more
Participant Employer Plan

18
24 Exhibit 15 highlights the impact of plan, participant or asset weighting on the aggregate ‘all-in’ fee results across all plans. The remainder of the section analyzes ‘all-in’ fees within plan size segments on a participant-weighted basis. Within the plan size segments, the different weighting approaches do not materially change the ‘all-in’ fees calculated.
Weighting survey responses to estimate the ‘all-in’ feeWhen using any sample to draw conclusions in aggregate about the broader marketplace, it is important to weight the survey responses to adjust for differences in the sample composition as compared with the universe. In the case of the 2013 Fee Study, the share of large plans in the sample is higher than the share of large plans in the DOL universe of 401(k) plans with $1 million or more in plan assets. Thus, if the survey responses were not weighted, those large plan respondents would be given disproportionate importance in the aggregate ‘all-in’ fee calculation. Responses to the 2013 Fee Study were weighted based on plan size across two dimensions — plan assets and number of participants in the plan — to represent the distribution of 401(k) plans with $1 million or more in plan assets in the comparable DOL universe estimates.
In addition to the importance of weighting to make the aggregate results more representative of the universe, there is the question of whether to report results on a plan, participant or asset basis. The answer to this question depends on what the researcher wants to analyze. If considering plan experience, then plan weighting is appropriate. If considering questions related to asset allocation, then asset weighting is appropriate. But, if considering the broader question of what people in 401(k) plans typically experience, then participant weighting should be used. Wishing to focus on typical participant experience, the bulk of the analysis in this report is on a participant-weighted basis.24
‘All-in’ fee resultsThe ‘all-in’ fee includes the recordkeeping, administrative and investment fees in the defined contribution plan, whether paid for by the employer, the participant or the plan. For this Survey, the ‘all-in’ fee primarily was analyzed as a percentage of plan assets. Exhibit 15 presents the ‘all-in’ fee across all plans on a plan-weighted, participant-weighted and asset-weighted basis.
Exhibit 15: ‘All-In’ Fee: % of Assets (Plan, Participant and Asset Weighted)
0.98% 0.97%
0.32%
1.55%
0.73% 0.67%
0.29%
1.29%
0.58% 0.48%
0.24%
1.05%
0.00%
0.20%
0.40%
0.60%
0.80%
1.00%
1.20%
1.40%
1.60%
1.80%
Mean Median 10th Percentile 90th Percentile
Plan Weighted Participant Weighted Asset Weighted
Note: Sample includes 401(k) plans with plan assets of $1 million or more.
Exhibit 16: ’All-In’ Fee: Annual Plan-Level Dollar Per Participant (Participant Weighted)
$339
$267
$88
$681
$0
$100
$200
$300
$400
$500
$600
$700
$800
Mean Median 10th Percentile
90th Percentile
Note: Sample includes 401(k) plans with plan assets of $1 million or more.

Defined Contribution/401(k) Fee Study 2013 19
Focusing on the typical defined contribution plan participant’s experience, the median participant-weighted ‘all-in’ fee, across all plans in the 2013 Fee Study was:• Percentage of plan assets — 0.67% (Exhibit 15); or• Annual per participant dollar amount — $267
(Exhibit 16).
The 10th percentile participant is in a plan with an ‘all-in’ fee of 0.29% and the 90th percentile participant is in a plan with an ‘all-in’ fee of 1.29% (Exhibit 15).
The aggregate ‘all-in’ fee varies with the focus of the unit of analysis — plans, participants or assets. Because the majority of defined contribution plans are small (whether considering plan assets or number of participants in the plan), estimating the ‘all-in’ fee on a plan-weighted basis results in higher estimates of the ‘all-in’ fee. For example, the median plan in this study had an ‘all-in’ fee of 0.97% of assets; 10% of plans had ‘all-in’ fees of less than 0.32% and 10% of plans had ‘all-in’ fees above 1.55% (Exhibit 15). However, participants are more concentrated in larger plans, so measuring the ‘all-in’ fee that the typical defined contribution plan participant experiences highlights that the median participant is in a plan with an ‘all-in’ fee of 0.67%. Because assets are even more concentrated in larger plans, the asset-weighted ‘all-in’ fee measures are lower than the participant-weighted measures.
To focus on the typical defined contribution plan participant’s experience, the ‘all-in’ fee results typically are presented on a participant-weighted basis and within each plan size segment (whereas plan size is a key driver of the ‘all-in’ fee). Fees of 401(k) plans vary greatly due to unique plan characteristics; plan/investment design; and range, quantity and quality of services negotiated between the plan sponsor and retirement service providers. As such, there are a large number of variables that could influence the fees that plans and participants pay. The remaining sections of this report explore what appear to be possible drivers of this variation at a macro level (all plans with $1 million or more in plan assets) and within individual segments ($1M–<$10M, $10M–<$100M, $100M–<$500M and $500M or more size markets).

20
Plan sponsors provided data for a variety of plan-related, retirement service provider-related and plan-design variables (Exhibit 17). As with the 2009 and 2011 Fee Studies, the 2013 Fee Study looked to identify what appeared to be the drivers of fees across all defined contribution plans. In order to identify those factors that help explain a plan sponsor’s ‘all-in’ fee, these variables were included in a statistical analysis. This analysis included assessing the impact and correlation of multiple independent variables on the dependent variable — the ‘all-in’ fee as a percentage of plan assets.
‘All-in’ fee driversDrivers include the key variables impacting fees across plans in the survey. The results of the statistical regression analysis pointed to the size of the plan and the plan’s percentage of assets invested in diversified equity holdings as drivers.
More specifically, the number of participants and average participant account balance were significant and had independent effects. Plans with larger average participant account balances and larger numbers of participants tended to have lower fees as a percentage of assets. In addition, plans with a higher percentage of plan assets in
VI. Fee drivers
‘All-In’ Fee (% of Assets) by Plan Asset Size Segment (Participant Weighted)
Variables
Number of plan participants
Average participant account balance
Plan sponsor industry
Number of business locations
Participant contribution rate
Annual contribution cash flow
Investment allocation
Company stock
Years with current provider
Time since last competitive review
Provider industry type
Provider size
Provider relationship
Employer contribution
Number of investment options
Proprietary investments
Auto-enrollment
Auto-increase
Loan option
Plan
rel
ated
Serv
ice
prov
ider
re
late
d
Plan
de
sign
Potential drivers
Influ
ence
r of
fee
s
1.27%
0.89%
0.63%
0.41%
1.17%
0.82%
0.57%
0.37%
0.00%
0.20%
0.40%
0.60%
0.80%
1.00%
1.20%
1.40%
$1M
–<$1
0M
$10M
–<$1
00M
$100
M–<
$500
M
$500
M or
mor
e
Mean Median
Exhibit 17
Note: Sample includes 401(k) plans with plan assets of $1 million or more.
rela
ted

Defined Contribution/401(k) Fee Study 2013 21
25 In the 2013 regression analysis, the diversified equity holdings variable is the percentage of plan assets invested in equity funds (including real estate funds) and the equity portion (average 60%) of balanced, target date and lifestyle funds.
26 The equity variable used varied across the studies. In the 2013 regression analysis the diversified equity holdings variable is the percentage of plan assets invested in equity funds (including real estate funds) and the equity portion (average 60%) of balanced, target date and lifestyle funds. In the 2011 regression, the equity investment options variable is the percentage of the plan assets invested in equity funds (including real estate funds) and company stock. To the extent that equity funds (including real estate funds) represent a significant share of both variables, the two variables are similar concepts.
diversified equity holdings tended to have higher ‘all-in’ fees as a percentage of assets.25 The variables related to plan size were the same variables observed in the 2009 and 2011 Fee Studies, which supports the finding that these variables are drivers of fees. The 2011 and 2013 Fee Studies find that plans with a higher percentage of plan assets invested in diversified equity holdings tended to have higher ‘all-in’ fees as a percentage of assets.26
Plan asset sizeAcross all plans in the survey, the median participant-weighted ‘all-in’ fee was 0.67% of assets (Exhibit 15), the participant at the 10th percentile was in a plan with an ‘all-in’ fee of 0.29% and the participant at the 90th percentile was in a plan with an ‘all-in’ fee of 1.29% (Exhibit 18).
Plan asset size is again a driver in explaining the total plan ‘all-in’ fee as a percentage of assets. Plans with higher total assets tend to have lower ‘all-in’ fees. For example, the median participant-weighted ‘all-in’ fee in the smallest plans (with $1 million to less than $10 million in assets) was 1.27% of assets, while the median participant-weighted ‘all-in’ fee in the largest plans (with $500 million or more in assets) was 0.37% (Exhibit 17). There was variation within each plan asset size segment, but the range between the 10th percentile and 90th percentile of participants within each plan size segment also tended to trend down, the larger the plan (Exhibit 18). Plans with smaller total assets tend to have smaller average participant account balances compared to larger plans, which also contributes to the higher relative fees as a percentage of assets for smaller plans.
The statistical regression analysis found that the number of participants and average participant account balance were drivers of the ‘all-in’ fee, contributing significantly and independently to the fee levels. Plans with more participants tended to have lower ‘all-in’ fees as a percentage of plan assets compared with plans with fewer participants (Exhibit 19). And, the 10th and 90th percentile bands tended to fall for plans with more participants (Exhibit 20).
1.00%
0.95%
0.69%
0.55% 0.43%
Exhibit 18: ‘All-In’ Fee Range (% of Assets) — 10th and 90th Percentile of Participants by Plan Asset Size Segment (Participant Weighted)
0.29%
0.70% 0.59%
0.35% 0.24%
1.29%
1.65%
1.28%
0.90% 0.67%
0.00%
0.50%
1.00%
1.50%
2.00%
2.50%
3.00%
3.50%
All plans ($1M or More)
$1M–<$10M $10M–<$100M $100M–<$500M $500M or more
Plan assets
Note: Sample includes 401(k) plans with plan assets of $1 million or more.
Exhibit 19: ‘All-In’ Fee (% of Assets) by Plan Participant Size Segment (Participant Weighted)
1.12% 1.09%
0.70%
0.55%
0.39%
1.16% 1.21%
0.74%
0.59%
0.46%
0.00%
0.20%
0.40%
0.60%
0.80%
1.00%
1.20%
1.40%
<100* 100–499 500–999 1,000–4,999 5,000–9,999 10,000+
Median Mean
*This category is not reported due to small sample size.Note: Sample includes 401(k) plans with plan assets of $1 million or more.
Exhibit 20: ‘All-In’ Fee Range (% of Assets) — 10th and 90th Percentile of Participants by Plan Participant Size Segment (Participant Weighted)
0.29%
0.70% 0.61% 0.44% 0.35% 0.24%
1.00%
1.05% 0.69%
0.63% 0.61% 0.63%
1.29%
1.75%
1.30% 1.07% 0.96% 0.87%
0.00%
0.50%
1.00%
1.50%
2.00%
2.50%
3.00%
3.50%
4.00%
All plans ($1M or More)
<100* 100–499 500–999 1,000–4,999 5,000–9,999 10,000+
Number of plan participants
* This category is not reported due to small sample size.Note: Sample includes 401(k) plans with plan assets of $1 million or more.

22
Exhibit 21: Median ‘All-In’ Fee (% of Assets) by Average Account Balance Within Plan Asset Size Segment (Participant Weighted)
0.96%
1.29%
0.84%
0.70%
0.43%
0.64%
1.03%
0.77%
0.55%
0.39% 0.35%
0.96%
0.79%
0.59%
0.29%
0.00%
0.20%
0.40%
0.60%
0.80%
1.00%
1.20%
1.40%
All plans ($1M or More) $1M–<$10M $10M–<$100M $100M–<$500M $500M or more
<$25,000 $25,000–$100,000 >$100,000
Note: Sample includes 401(k) plans with plan assets of $1 million or more.
Exhibit 22: Median ’All-In’ Fee (% of Assets) by Average Account Balance Within Plan Participant Size Segment (Participant Weighted)
* This category is not reported due to small sample size.
0.96%
1.31% 1.27%
0.82%
0.68% 0.69% 0.64%
0.98% 0.93%
0.70%
0.50% 0.39%
0.35%
0.87%
0.58% 0.58% 0.60%
0.29%
0.00%
0.20%
0.40%
0.60%
0.80%
1.00%
1.20%
1.40%
All plans ($1M or More)
<100* 100–499 500–999 1,000–4,999 5,000–9,999 10,000+
<$25,000 $25,000–$100,000 >$100,000
Note: Sample includes 401(k) plans with plan assets of $1 million or more.

Defined Contribution/401(k) Fee Study 2013 23
The separate negative correlation between the average participant account balance and the ‘all-in’ fee can be seen whether looking across plan asset size segments (Exhibit 21) or plan participant size segments (Exhibit 22).
Variable vs. fixed costsThe pattern of typically declining ‘all-in’ fees as plan size increases likely results in part from the role of variable versus fixed costs impacting plan fees.
Costs within plans are either variable or fixed depending on the service provided and the fee arrangement with the company providing the service. Variable costs are costs that fluctuate based on number of participants, amount of assets or some other factor. Investment expenses and per participant charges are examples of variable costs. In contrast, fixed costs stay relatively constant regardless of fluctuations in plan or participant size. Examples of fixed costs could include plan audit fees, plan document services (e.g., Form 5500 filings) or investment consulting services. This is not to suggest that fixed costs never change but rather they typically will not move in a fixed ratio with some aspect of the plan.
The relationship between fixed and variable costs — and what percentage each makes up — fluctuates based on asset values and overall market movements The relationship between fixed and variable costs is also noteworthy when comparing large and small plans whether measured in terms of plan assets or number of plan participants. Larger plans with more assets and/or more participants have a much larger base over which to spread fixed costs.
Plan asset allocationThe percentage of a plan’s assets invested in diversified equity holdings was found to be a driver of the ‘all-in’ fee in the 2013 Fee Study. Plans with a higher percentage of plan assets in diversified equity holdings tended to have higher ‘all-in’ fees.
The ‘all-in’ fee as a percentage of assets reflects the asset composition of the defined contribution plan, which in turn reflects the asset allocations chosen by the plan participants. Participants select their investments based
on a range of key criteria including investment risk, performance (return), types of securities held and fees and expenses. According to the survey data (as well as general industry knowledge), diversified equity holdings generally have higher investment management expense ratios than non-equity or fixed-income investments.27 As noted earlier in this Study, a large portion (82% on a participant-weighted basis) of the total fees of defined contribution plans is related to the investment fees. When more of a plan’s assets are invested in diversified equity holdings, its ‘all-in’ fee typically will be higher.
Exhibit 23 highlights the asset-weighted expense ratios for the selection of investment options held in the plans in the 2013 Fee Study. For example, the asset-weighted average expense ratio on equity investment options held by the plans in the survey was 0.53% compared with an asset-weighted average expense ratio of 0.45% on the fixed-income investments held. The asset-weighted expense ratios for balanced investment options — target date (0.46%), balanced (0.62%) and lifestyle (0.58%) — varied in part reflecting the degree to which they invest in equities.
27 See note 7 on page 7.
Exhibit 23: Average Expense Ratio by Asset Class (Asset Weighted)
0.53%
0.45%
0.29%
0.49% 0.46%
0.62% 0.58%
0.07%
0.00%
0.10%
0.20%
0.30%
0.40%
0.50%
0.60%
0.70%
Equit
y
Fixed
Inco
me
Mon
ey M
arket
GICs a
nd O
ther
Stable
Value
Targ
et Date
Balan
ced
Lifes
tyle
Compa
ny St
ock
Note: Sample includes 401(k) plans with plan assets of $1 million or more.

24
Based on the statistical regression analysis performed, a 10 percentage point higher asset allocation to diversified equity holdings (e.g., assets in diversified equity holdings rise from 50% to 60% of plan assets) resulted in approximately a 4.1 basis point or 0.041 percentage point higher ‘all-in’ fee in the plan (Exhibit A2 in the Appendix). This pattern can be seen as the percentage of plan assets invested in diversified equity holdings rises from less than 25% of plan assets to higher percentages (Exhibit 24).
Factors not found to be significantA number of other variables were tested and not found to be drivers of the ‘all-in’ fee (Exhibit A1 in the Appendix).
Variables relating to plans While the number of plan participants, average participant account balance and share of plan assets in diversified equity holdings were found to be drivers of the ‘all-in’ fee, the other plan-related variables did not appear to be significant drivers of fees. The number of plan sponsor business locations, which might cause increased complexity in delivering participant education, was not found to be an apparent driver of fees, nor was the plan sponsor’s industry.
The average participant contribution rate (Exhibit 9), which may lead to fast growth in plan asset size, was not found to be a significant driver of ‘all-in’ fees. Also tested but found not to be significant was the total dollar inflow in contributions from both the employees and the employer.
The presence of company stock in the plan’s investments also was not found to be a fee driver, despite its low average expense ratio (Exhibit 23).
Variables relating to the retirement service providerThe retirement service provider type (i.e., mutual fund company, insurance company, bank or TPA; Exhibit 5) was not identified as an apparent driver of the ‘all-in’ fee based on the statistical and regression analysis results from the survey.
The size of the retirement service provider also was not an apparent driver of ‘all-in’ fees. When measured in terms of participants on the recordkeeping system, the survey data did not consistently find evidence of lower fees for the largest providers.
In the survey, plan sponsors were asked when was the last time that they had performed a competitive review of their plan’s retirement service provider (Exhibit 7). A competitive review was defined to include everything from a periodic fee negotiation to a complete vendor search with an RFP. An initial hypothesis was that if a plan had a competitive review more recently, its ‘all-in’ fee would be lower when compared with those plans that did not have recent competitive reviews. However, the statistical regression analysis did not find a significant relationship between the timing of the last competitive review and the ‘all-in’ fee as a percentage of plan assets.
Plans in the 2013 sample had a range of tenures with their current retirement service providers (see discussion on page 13). Tenure of the plan with the retirement service provider also did not appear to be a significant factor with respect to the ‘all-in’ fee as a percentage of plan assets. And, plan sponsors with multiple relationships (e.g., a defined benefit plan, a non-qualified plan or other services; Exhibit 6) with their retirement service provider were not found to have significantly different ‘all-in’ fees.
Exhibit 24: Median and Average 'All-In' Fee (% of Assets) by Percent of Plan Assets Invested in Diversified Equity Holdings (Participant Weighted)
0.50%
0.58%
0.67%
0.91%
0.42%
0.70% 0.73%
0.88%
0.00%
0.10%
0.20%
0.30%
0.40%
0.50%
0.60%
0.70%
0.80%
0.90%
1.00%
<25% 25% to <50% 50% to <75% 75% or more
Median Average
Note: Diversified equity holdings include equity funds, real estate funds and the equity portion (average 60%) of balanced, target date and lifestyle funds, but exclude investments in company stock. Sample includes 401(k) plans with plan assets of $1 million or more.

Defined Contribution/401(k) Fee Study 2013 25
Variables relating to plan designNone of the variables relating to plan design appeared to have a statistically significant impact on plan fees. A generous employer contribution might be expected to help the plan grow, but employer contribution rates did not appear to impact the ‘all-in’ fee. The number of investment options, which could be related to the number of specialized equity investments or could increase complexity, was not found to be a driver of ‘all-in’ fees. The percentage of assets invested in the investment products of the retirement service provider (proprietary investments) did not appear to have a significant impact on fees.
Auto-enrollment is designed to enroll workers automatically in the plan at a set contribution rate. Auto-enrollment can have a positive impact on increasing assets in the plans, so it might be expected to lower overall plan costs. At the same time, auto-enrollment can increase the number of participants with small balances, or increase turnover of participants, and therefore increase the administrative cost of running the plan. In the 2013 Fee Study, auto-enrollment was not found to be a significant driver of fees. Tested separately, automatic increase of participants’ contributions, which could improve plan growth, also did not appear to have an impact on plan fees.
Loan fees are not included in the ‘all-in’ fee because they only apply to the individuals engaged in the special activity, but the presence of a loan option might increase administrative complexity overall or reduce invested assets, which could drive up plan fees. It appears that this is not the case; the presence of a loan option did not appear to have an impact on the ‘all-in’ fee.

26
Range of fee arrangementsThere are three general groups of services — administrative, investment management and financial advice — that defined contribution plan sponsors arrange to deliver the plan to participants (Exhibit 1). Defined contribution/401(k) fees are charged in a variety of ways for the services provided. Typical fee structures include per participant administration, per plan administration, asset-based administration, investment management fees and plan advisory fees. As plan sponsors work with retirement service providers to set up or administer their plans, a range of scenarios or arrangements is generally considered. This report does not aim to assess those ranges, but to identify the factors that appear to be relevant in the determination of the plan fee. To compare fees across plans, this bottom-line or ‘all-in’ fee was calculated combining all administration, recordkeeping, investment fees and plan financial consultant fees. At the end of the day, whether a plan sponsor is adding up component fees or looking at a more comprehensive package, the ‘all-in’ fee allows for a more direct comparison across plans.
The ‘all-in’ feeThe ‘all-in’ fee, which includes recordkeeping, administration and investment management, was evaluated primarily as a percentage of total plan assets. Across all plans in the Survey:• The ‘all-in’ fee varied from 0.29% of assets (10th
percentile participant) to 1.29% of assets (90th percentile participant).
• The median participant was in a plan with an ‘all-in’ fee of 0.67% of plan assets.
Plan size and asset allocation appear to be drivers of the ‘all-in’ feeThe ‘all-in’ fee varied due to a number of plan-related variables. Statistical regression analysis found that plan size and percentage of a plan’s assets invested in diversified equity holdings appeared to be the most significant drivers of fees.
More specifically, further analysis showed that a more meaningful way to view plan asset size was through two independent factors:• Number of plan participants; and• Average participant account balance in the plan.
Plans with more participants and plans with higher average participant account balances tended to have lower ‘all-in’ fees (as a percentage of plan assets). This likely reflects economies gained as fixed costs are spread over more assets.
The higher a plan’s allocation to diversified equity holdings, the higher the ‘all-in’ fee tended to be. This reflects the higher investment expense ratios typically associated with equity investing.
The regression analysis found that the remaining variables appeared not to be direct (significant) drivers of the ‘all-in’ fee. Automatic enrollment, automatic increase, the presence of a loan option, participant contribution rates, employer contribution rates, contribution inflows (from both employees and the employer), the number of investment options, the portion of assets invested in proprietary investments and the presence of company stock as an investment option were not found to be drivers of fees. The number of business locations was not found to be an apparent driver of the ‘all-in’ fee, nor was plan sponsor industry. Several variables related to the retirement service provider also did not appear to be direct drivers of the ‘all-in’ fee. For example, the timing of the last competitive review, which might have been expected to explain lower ‘all-in’ fees, was not found to be an apparent driver of fees. The plan sponsor’s tenure (number of years) with the retirement service provider also was not found to be a significant factor. Neither the size nor the type of the retirement service provider was found to have a statistically significant relationship with the ‘all-in’ fee. Additional relationships — whether through other retirement services or proprietary investments — also were not direct drivers of the ‘all-in’ fee in the 2013 Fee Study.
VII. Summary

Defined Contribution/401(k) Fee Study 2013 27
Data and regression analysisFirst, the ‘all-in’ fee was defined, which included all recordkeeping, administration and investment related fees for each plan. The ‘all-in’ fee did not include participant activity-related fees that only apply to particular participants engaged in the activity (e.g., self-directed brokerage, managed accounts, loans, QDROs and distributions). The ‘all-in’ fee was calculated for each plan in the survey by summing all recordkeeping, administration and investment fees to arrive at a total dollar amount. This amount was then divided by the total plan assets to arrive at the ‘all-in’ fee as a percentage of plan assets (e.g., Exhibit 2). Also, each plan’s total dollar fee amount was divided by total participants in the plan to arrive at the ‘all-in’ fee as an annual plan-level dollar per participant amount (Exhibit 16).
Both cross-tabulation and regression analysis were used to identify apparent drivers of the ‘all-in’ fee. Cross-tabulations of plan-related, service-provider-related and plan-design variables with the ‘all-in’ fee were analyzed to determine which factors appeared to be correlated with the ‘all-in’ fee (Exhibit A1 for the variables considered). In addition, using ordinary least-squares regression, a selection of independent variables was included to estimate various models. Various models were estimated with different configurations to ensure that results are robust.
Exhibit A1: Variables Analyzed as Possible Fee Drivers
Variable name Type of variable
Plan related
Number of plan participants Continuous; LN(number)
Average participant account balance Continuous; LN(average)
Plan sponsor industry Dummy
Number of business locations Dummy
Participant contribution rate Continuous; average of participant’s contribution rates (as a percentage of earnings)
Annual contribution cash flow Continuous; sum of employee and employer contributions as a percentage of total plan assets
Investment allocation (percent in diversified equity holdings)
Continuous; percentage of plan assets invested in diversified equity holdings (including equity funds, real estate funds and the equity portion (average 60%) of balanced, target date, and lifestyle funds)
Company stock Dummy (whether offered or not)
Service provider related
Years with current provider Continuous; integer
Time since last competitive review Dummy
Provider industry type Dummy (mutual fund company, insurance company, bank, TPA)
Provider size Dummy (tiers based on number of participants on provider platform)
Provider relationship (DB or non-qualified plan)
Dummy; if had either defined benefit or non-qualified plan with retirement service provider, then = 1 (if not, = 0)
Plan design related
Employer contribution Continuous; employer effective match (match rate X match level) as a percentage of earnings
Number of investment options Continuous; integer
Proprietary investments Dummy
Auto-enrollment Dummy; if auto-enrollment, then = 1 (if not, = 0)
Auto-increase Dummy; if auto-increase, then = 1 (if not, = 0)
Loan option Dummy; if loans offered, then = 1 (if not, = 0)
Variable found significant and used in the final regression analysis (see Exhibit A2)
VIII. Appendix
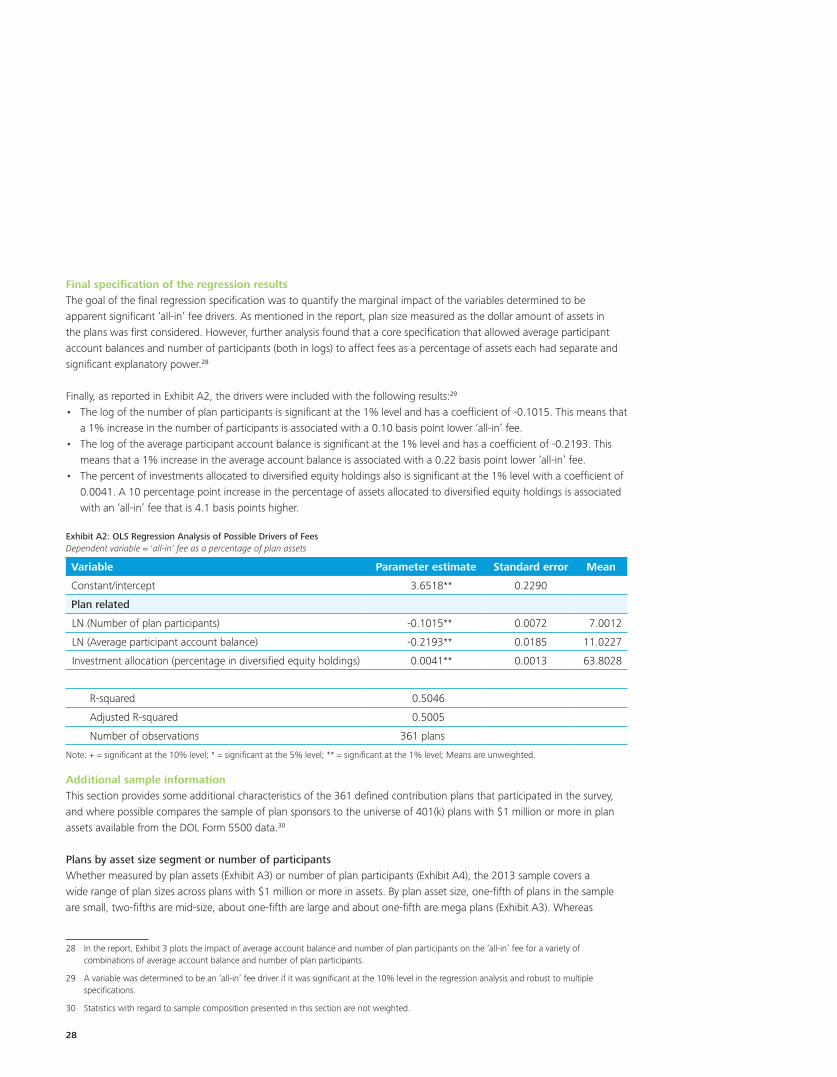
28
28 In the report, Exhibit 3 plots the impact of average account balance and number of plan participants on the ‘all-in’ fee for a variety of combinations of average account balance and number of plan participants.
29 A variable was determined to be an ‘all-in’ fee driver if it was significant at the 10% level in the regression analysis and robust to multiple specifications.
30 Statistics with regard to sample composition presented in this section are not weighted.
Final specification of the regression resultsThe goal of the final regression specification was to quantify the marginal impact of the variables determined to be apparent significant ‘all-in’ fee drivers. As mentioned in the report, plan size measured as the dollar amount of assets in the plans was first considered. However, further analysis found that a core specification that allowed average participant account balances and number of participants (both in logs) to affect fees as a percentage of assets each had separate and significant explanatory power.28
Finally, as reported in Exhibit A2, the drivers were included with the following results:29
• The log of the number of plan participants is significant at the 1% level and has a coefficient of -0.1015. This means that a 1% increase in the number of participants is associated with a 0.10 basis point lower ‘all-in’ fee.
• The log of the average participant account balance is significant at the 1% level and has a coefficient of -0.2193. This means that a 1% increase in the average account balance is associated with a 0.22 basis point lower ‘all-in’ fee.
• The percent of investments allocated to diversified equity holdings also is significant at the 1% level with a coefficient of 0.0041. A 10 percentage point increase in the percentage of assets allocated to diversified equity holdings is associated with an ‘all-in’ fee that is 4.1 basis points higher.
Exhibit A2: OLS Regression Analysis of Possible Drivers of Fees Dependent variable = 'all-in' fee as a percentage of plan assets
Variable Parameter estimate Standard error Mean
Constant/intercept 3.6518** 0.2290
Plan related
LN (Number of plan participants) -0.1015** 0.0072 7.0012
LN (Average participant account balance) -0.2193** 0.0185 11.0227
Investment allocation (percentage in diversified equity holdings) 0.0041** 0.0013 63.8028
R-squared 0.5046
Adjusted R-squared 0.5005
Number of observations 361 plans
Note: + = significant at the 10% level; * = significant at the 5% level; ** = significant at the 1% level; Means are unweighted.
Additional sample information This section provides some additional characteristics of the 361 defined contribution plans that participated in the survey, and where possible compares the sample of plan sponsors to the universe of 401(k) plans with $1 million or more in plan assets available from the DOL Form 5500 data.30
Plans by asset size segment or number of participantsWhether measured by plan assets (Exhibit A3) or number of plan participants (Exhibit A4), the 2013 sample covers a wide range of plan sizes across plans with $1 million or more in assets. By plan asset size, one-fifth of plans in the sample are small, two-fifths are mid-size, about one-fifth are large and about one-fifth are mega plans (Exhibit A3). Whereas

Defined Contribution/401(k) Fee Study 2013 29
the sample does not have defined contribution plans with less than $1 million in plan assets, the smallest size segment by number of plan participants is under-represented (Exhibit A4). Only 7% of plans in the sample have fewer than 100 participants. Nevertheless, the next size category (100 to 499 plan participants) is well represented, making up more than one-third of the sample of plans. Plans are well distributed over the remaining size categories, with 14% of plans having 10,000 or more participants. Because of the small sample size in the fewer than 100 participants category, ‘all-in’ fee results for that category are not reported separately (Exhibits 19, 20 and 22).
Exhibit A3: Plans by Asset Size Segment
Plans by Asset Size Segment # of Plans % of Plans
Small $1M–<$10M 72 20%
Mid $10M–<$100M 143 40%
Large $100M–<$500M 76 21%
Mega $500M or more 70 19%
Total 361 100%
Note: Sample includes 401(k) plans with plan assets of $1 million or more.
Exhibit A4: Plans by Participant Size Segment
Plans by Participant Size Segment # of Plans % of Plans*
<100 26 7%
100-499 124 34%
500-999 38 11%
1,000-4,999 82 23%
5,000-9,999 42 12%
10,000+ 49 14%
Total 361 100%
*Percentages do not add to 100% because of rounding. Note: Sample includes 401(k) plans with plan assets of $1 million or more.
Plans by number of plan participants Whether measured by plan assets (Exhibit 4) or number of plan participants (Exhibit A5), the 2013 sample covers a wide range of plan sizes across plans with $1 million or more in assets. In the DOL 401(k) universe, most (87.3%) 401(k) plans have fewer than 100 participants, while a large share of assets (45.5%) and participants (40.9%) is in plans with 10,000 participants or more. The Deloitte/ICI sample displays a similar pattern, although it includes proportionally more large plans. In the 2013 survey sample, 7.2% of plans had fewer than 100 participants, and 80.9% of assets and 78.5% of participants were in plans with 10,000 participants or more.
Exhibit A5: Comparison of Survey Sample of Plans with DOL 401(k) Plan Universe by Plan Participant Size Segment
Percent of Plans Percent of Assets Percent of Participants
Plan Participant Size Segment
DOL 401(k) Plan Universe
Deloitte/ICI
DOL 401(k) Plan Universe
Deloitte/ICI
DOL 401(k) Plan Universe
Deloitte/ICI
<100 87.3 7.2 14.5 (*) 13.4 (*)
100–499 9.7 34.3 10.4 0.9 13.4 1.2
500–999 1.4 10.5 5.0 0.7 6.4 1.1
1,000–4,999 1.2 22.7 15.9 7.3 17.3 7.6
5,000–9,999 0.2 11.6 8.7 10.1 8.6 11.6
10,000+ 0.2 13.6 45.5 80.9 40.9 78.5
(*) = less than 0.05 percent
Note: Deloitte/ICI sample includes 401(k) plans with plan assets of $1 million or more. Percentages may not add to 100% because of rounding.

30
Geographical location and industries of plan sponsorsPlan sponsors surveyed represented all geographic regions in the United States. Survey respondents were located in the Midwest (39%), the South (26%), the West (15%) and the Northeast (21%). Regional representation in the DOL Form 5500 data was roughly similar.
The 2013 sample of plan sponsor survey respondents represented multiple industry groupings (Exhibit A6). Industries include manufacturing (20% of plan sponsors), financial services (17%), services (13%), wholesale/retail (9%), technology (7%) and others.
Number of retirement service providers used by survey respondents Recordkeeping services for plans were delivered by 81 different retirement service providers (Exhibit A7). It should be noted that Exhibit A7 highlights the primary line of business of the retirement service provider and it is often the case that multiple investment product lines are offered on recordkeeping platforms in some cases representing multiple providers. At least 17 different retirement service providers (and typically many more) were represented within each plan asset segment. These numbers do not represent the range of investment providers included in the survey because many recordkeeping platforms provide access to multiple investment providers.
Survey weightsWhen a survey sample is drawn from a population, the proportions of segments within the sample may not match the distribution of those segments within the population. The sample’s distribution may be different due to sampling techniques, varying degrees of non-response from segments of the population or a survey design that was not able to cover the entire population. It is possible to improve the relation between the sample and the population from which it was drawn by applying weights to the sample that match the proportions present in the population.
Exhibit A6: Plan Sponsor Industry by Percent of Plans
13%
17%
6%
20%
9%
7%
5%
2% 1% 2% 2% 3%
1%
14%
0%
5%
10%
15%
20%
25%
Servi
ces
Finan
cial S
ervice
s
Health
care
Man
ufac
turin
g
Who
lesale
/Retai
l
Tech
nolog
y
Non-Pr
ofit
Utilitie
s
Educ
ation
Trans
porta
tion
Energ
y
Commun
icatio
ns
Govern
ment/P
ublic
Adm
inistr
ation
Other
Note: Sample includes 401(k) plans with plan assets of $1 million or more.Percentages do not add to 100% because of rounding.
Exhibit A7: Number of Retirement Service Providers Represented in Survey by Plan Asset Size Segment
Plan Asset Size Segment
Total Providers
Mutual Fund Companies
Insurance Companies Banks TPAs
$1M–<$10M 40 19 6 4 11
$10M–<$100M 48 18 11 6 13
$100M–<$500M 26 5 9 4 8
$500M or more 17 3 3 4 7
Total (Net) 81 19 18 6 38
Note: Sample includes 401(k) plans with plan assets of $1 million or more.

Defined Contribution/401(k) Fee Study 2013 31
This process is known as sample-balancing, or raking.31 In the case of a survey of 401(k) plan sponsors, it is possible to weight the responses to the universe of private-sector 401(k) plans for plan year 2011 (latest available) as reported by the Department of Labor.32 Because the sample included plans with $1 million or more in plan assets, results were weighted to the comparable DOL universe of 401(k) plans with $1 million or more in assets.
In the normal course of survey work, researchers determine the appropriate variables on which to weight their survey observations. To weight the 2013 Deloitte/ICI Defined Contribution/401(k) survey data, plans were placed into 28 cells based on plan asset-size and plan participant-size groups. The probability of appearing in each cell was computed for both the DOL Form 5500 data (the universe) and the Deloitte/ICI survey data (the sample). When analyzing plan experience the weight assigned to an individual plan is:
Probability of such a plan in the Form 5500 plan universeProbability of such a plan in the Deloitte/ICI plan sample
for the asset/participant cell that the plan falls in.
A similar procedure was used to develop participant-based weights. When determining the experience of the average 401(k) plan participant, the participant-weighted data were the relevant measure utilized. When considering investment options, asset-weighted data — developed using a similar procedure — were used.
Whether weighting the ‘all-in’ fee survey results by plans, participants or assets, there is little impact on the ‘all-in’ fee when reported by plan size segment (because the weights improve the representation across segments and less so within segments).
31 See Battaglia, Izrael, Hoaglin, and Frankel, “Tips and Tricks for Raking Survey Data (a.k.a. Sample Balancing),” American Association for Public Opinion Research (May 2004); available at www.amstat.org/sections/srms/proceedings/y2004/files/Jsm2004-000074.pdf.
32 See U.S. Department of Labor, Private Pension Plan Bulletin Abstract of 2011 Form 5500 Annual Reports (Version 1.0; June 2013), Washington, DC; available at www.dol.gov/ebsa/pdf/2011pensionplanbulletin.pdf.

32
Term Definition
Active Plan Participant An individual currently participating in an employer-sponsored retirement plan.
Auto-Enrollment The practice of enrolling eligible employees in a plan and initiating participant deferrals unless the employee opts out.
Auto-Increase/Escalate A provision found in some 401(k) plans in which an employee’s contribution rate is automatically increased at a pre-established point in time, unless the employee chooses otherwise.
Commingled Trust An investment vehicle where assets are combined from several sources (such as various retirement plans) and managed under a common strategy.
Communication/Education Services
Participant communication and education services relating to providing print, video, software and/or live instruction to educate employees about how the plan works, the plan investment options and asset allocation strategies.
Company Stock Services Services needed for the recordkeeping and administration of company stock (the stock of the employer) in the plan.
Compliance Testing Testing required by the IRS to ensure that participants in all income ranges attain the benefits of the plan.
Custom Services Additional or enhanced non-standard services (e.g., website, call center, branding, etc.) selected by the plan sponsor.
Educational Materials Materials provided to plan participants to help educate around the need for retirement saving, investment options, how to properly plan for retirement, how to calculate retirement savings, etc.
Eligible Plan Participant Any employee who is eligible to participate in and receive benefits from a plan.
Employee Meetings Meetings with employees to explain the benefits of participating in the plan, answer questions about saving in the plan and provide an understanding of the plan specifications.
Employer Contribution A contribution made by the company to the account of the participant (often in the form of a company match based on a ratio to contributions made by the participant).
Expense Ratio An investment option’s total annual operating expenses, including for investment management and administration of the investment, expressed as a percentage of assets. For mutual funds, this is calculated pursuant to SEC rules for fund prospectuses; other investment options may provide plans a similar number expressing the investment option’s fees.
Financial Advice/Guidance Advice or guidance provided to participants or the plan sponsor by a third party.
Form 5500 Reporting Annual plan financial reporting form required by IRS/DOL/PBGC.
Guaranteed Investment Contract (GICs)
Accounts with an insurance company that guarantee a fixed rate of interest over the length of the contract.
Investment Related Charges
Asset-based fees for investment management and other related services generally assessed as a percentage of assets invested. They are paid in the form of an indirect charge against the participant’s account or the plan because they are deducted directly from investment returns.
Legal Services Legal support services provided to the plan.
Glossary of terms

Defined Contribution/401(k) Fee Study 2013 33
Term Definition
Lifestyle Investment Option
An investment option that maintains a predetermined risk level and generally contains “conservative,” “moderate” or “aggressive” in the investment’s name. Also known as a target risk investment option.
Managed Account An account for which the holder gives a third party the authority to manage the investing of assets.
Nondiscrimination Testing Regulations may require this annual testing to assure that the amount of contributions made by and on behalf of non-highly compensated employees is proportional to contributions made by and on behalf of highly compensated employees.
Participant Contribution Rate
The amount (typically expressed as a percentage of the employee’s salary) that an employee contributes to the plan.
Plan Assets The total assets held among all participants within the plan.
Plan Audit An independent audit required by federal law for all plans with more than 100 participants.
Plan Document Services Development, maintenance and consulting related to the plan documents of a plan.
Plan Sponsor Investment Adviser
A third party consultant hired by the plan sponsor to assist with plan design, investment design, search and selection process and other plan advisory services.
Qualified Domestic Relations Order (QDRO)
A judgment, decree or order that creates or recognizes an alternate payee’s (such as former spouse, child, etc.) right to receive all or a portion of a participant’s retirement plan benefits.
Recordkeeper A recordkeeper maintains plan records; processes employee enrollment; processes participants’ investment elections, contributions and distributions; and issues account statements to participants.
Separate Account An investment vehicle where assets are managed for a single investor or entity and the single investor/entity directly owns the securities in the account.
Target Date Investment Option
An investment option that typically rebalances its portfolio to become less focused on growth and more focused on income as it approaches and passes the target date of the investment, which is usually included in the investment’s name. Also known as a lifecycle investment option.
Trustee Services Services typically provided by the bank or trust company having fiduciary responsibility for holding plan assets.

Copyright © 2014 Deloitte Development LLC. All rights reserved. Member of Deloitte Touche Tohmatsu Limited
About DeloitteDeloitte refers to one or more of Deloitte Touche Tohmatsu Limited, a UK private company limited by guarantee, and its network of member firms, each of which is a legally separate and independent entity. Please see www.deloitte.com/about for a detailed description of the legal structure of Deloitte Touche Tohmatsu Limited and its member firms. Please see www.deloitte.com/us/about for a detailed description of the legal structure of Deloitte LLP and its subsidiaries. Certain services may not be available to attest clients under the rules and regulations of public accounting.
This publication contains general information only and Deloitte is not, by means of this publication, rendering accounting, business, financial, investment, legal, tax, or other professional advice or services. This publication is not a substitute for such professional advice or services, nor should it be used as a basis for any decision or action that may affect your business. Before making any decision or taking any action that may affect your business, you should consult a qualified professional advisor. Deloitte shall not be responsible for any loss sustained by any person who relies on this publication.
For more information, please contact:Daniel E. RosshirtPrincipal Deloitte Consulting LLP Tel. +1 212 618 4586 Email: [email protected]
Scott A. ParkerPrincipal Deloitte Consulting LLP Tel. +1 612 397 4654 Email: [email protected]
David A. Pitts, FSASenior Manager Deloitte Consulting LLP Tel. +1 612 659 2656 Email: [email protected]
About the Investment Company InstituteThe Investment Company Institute is the national association of U.S. investment companies, including mutual funds, closed-end funds, exchange-traded funds (ETFs), and unit investment trusts (UITs). ICI seeks to encourage adherence to high ethical standards, promote public understanding, and otherwise advance the interests of funds, their shareholders, directors, and advisers. Members of ICI manage total assets of $17.3 trillion and serve more than 90 million shareholders. For additional information about ICI and its research, please see www.ici.org.