inside the war on poverty: the impact of food stamps...
TRANSCRIPT

Inside the War on Poverty: The Impact of Food Stamps on Birth Outcomes
Douglas Almond
Columbia University and NBER [email protected]
Hilary W. Hoynes
University of California, Davis and NBER [email protected]
and
Diane Whitmore Schanzenbach Harris School of Public Policy, University of Chicago and NBER
August 2009
Abstract This paper evaluates the health impact of a signature initiative of the War on Poverty: the roll out of the modern Food Stamp Program (FSP) during the 1960s and early 1970s. Using variation in the month the FSP began operating in each U.S. county, we find that pregnancies exposed to the FSP three months prior to birth yielded deliveries with increased birth weight, with the largest gains at the lowest birth weights. These impacts are evident with difference-in-difference models and event study analyses. Estimated impacts are robust to inclusion of county fixed effects, time fixed effects, measures of other federal transfer spending, state by year fixed effects, and county-specific linear time trends. We also find that the FSP rollout leads to small, but statistically insignificant, improvements in neonatal infant mortality. We conclude that the sizeable increase in income from Food Stamp benefits improved birth outcomes for both whites and African Americans, with larger impacts for births to African American mothers. We would like to thank Justin McCrary for providing the Chay-Greenstone-McCrary geography crosswalk and Karen Norberg for advice on cause of death codes. This work was supported by a USDA Food Assistance Research Grant (awarded by Joint Center for Poverty Research at Northwestern University and University of Chicago), the Population Research Center at the University of Chicago, and USDA FANRP Project 235 “Impact of Food Stamps and WIC on Health and Long Run Economic Outcomes.” We also thank Ken Chay, Janet Currie, Ted Joyce, Bob LaLonde, Doug Miller, Bob Whitaker and seminar participants at the Harris School, Dartmouth, MIT, LSE, the California Center of Population Research (UCLA), Duke, Cornell, UC Irvine, IIES (Stockholm University), the NBER Summer Institute, and the SF Fed Summer Institute for helpful comments. Alan Barreca, Rachel Henry Currans-Sheehan, Elizabeth Munnich, Ankur Patel and Charles Stoecker provided excellent research assistance, and Usha Patel entered the regionally-aggregated vital statistics data for 1960-75.

1
1. Introduction
In this paper, we evaluate the health consequences of a sizable improvement in the
resources available to America's poorest. In particular, we examine the impact of the Food Stamp
Program (FSP), which in 2007 provided $34 billion in payments to about 13 million households, on
infant health. Our paper makes two distinct contributions. First, while the goal of the FSP is to
increase the nutrition of the poor, few papers have examined its impact on health outcomes. Second,
building on work by Hoynes and Schanzenbach (2009), we argue that the FSP treatment represents
an exogenous increase in income for the poor. Our analysis, therefore, represents a causal estimate
of the impact of income on health, an important topic with little convincing evidence due to concerns
about endogeneity and reverse causality (Currie 2008).
We utilize the natural experiment afforded by the nationwide roll-out of the modern Food
Stamp Program during the 1960s and early 1970s. Our identification strategy uses the sharp timing
of the county-by-county rollout of the FSP, which was initially constrained by congressional funding
authorizations (and ultimately became available in all counties by 1975). Specifically, we utilize
information on the month the FSP began operating in each of the roughly 3,100 U.S. counties and
examine the impact of the FSP rollout on mean birth weight, low birth weight, gestation and neonatal
infant mortality.
Throughout the history of the FSP, the program parameters have been set by the Department
of Agriculture and are uniform across states. In the absence of the state-level variation often
leveraged by economists to evaluate transfer programs, previous FSP research has typically resorted
to strong assumptions as to the comparability of FSP participants and eligible non-participants
(Currie 2003). Not surprisingly, the literature is far from settled as to what casual impact (if any) the
FSP has on nutrition and health.
Hoynes and Schanzenbach (2009) use this county rollout to examine the impact of the FSP
on food consumption using the PSID. They found that the introduction of the FSP increased total

2
food spending and decreased out-of-pocket food spending. Importantly, consistent with the
predictions of canonical microeconomic theory, the magnitude of the increase in food expenditures
was similar to an equivalent-sized income transfer, implying that most recipient households were
inframarginal. As one of the largest anti-poverty programs in the U.S. – comparable in cost to the
EITC and substantially larger than TANF1 – understanding FSP effects is valuable both in its own
right and for what it reveals about the relationship between income and health.
We focus on birth outcomes for several reasons. First, families represent an important
subgroup of the food stamp caseload. Over 60 percent of food stamp households include children,
and one-third has at least one pre-school age child. Second, birth outcomes improved substantially
during the late 1960s and early 1970s. Third, to the extent that the FSP improved birth outcomes,
later-life health outcomes of these cohorts may have also benefitted (Barker 1992, Black et al. 2007,
Royer 2009, Oreopolous et al. 2006). Finally, the vital statistics data used in this project are ideally
suited for analyzing FSP roll-out —the birth (death) micro data contain the county of birth (death)
and the month of birth (death). This, combined with the large sample sizes (e.g., more than a million
birth records per year in the dataset) allows us to utilize the discrete nature of the FSP roll out with
significant statistical power.
We find that infant outcomes improve with FSP introduction. Changes in mean birth weight
are small, increasing roughly half a percent for blacks and whites who participated in the program
(effect of the treatment on the treated). Impacts were larger at the bottom of the birth weight
distribution, reducing the incidence of low birth weight among the treated by 7 percent for whites and
between 5 and 11 percent for blacks. Changes in this part of the birth weight distribution are
important as they are closely linked to other newborn health measures. While not all treatment
effects are statistically significant, they point consistently to improvements in birth weight following
the introduction of the FSP. We also find that the FSP introduction leads to a reduction in neonatal
1 The cost of the FSP was $33 billion in 2006 (compared to $24 billion for TANF, $33 billion for the EITC, and $5.4 billion for WIC).

3
infant mortality, although these results rarely reach statistical significance. We find very small (but
precisely estimated) impacts of the FSP on fertility, suggesting that the results are not biased by
endogenous sample selection. All results are robust to various sets of controls, such as county fixed
effects, state by year fixed effects, and county specific linear trends. Moreover, FSP impact
estimates are robust to and little changed by county-by-year controls for federal spending on other
social programs, suggesting our basic identification strategy is “clean.” Finally, we present an event
study analysis that further supports the validity of the identification strategy.
Food stamps are the fundamental safety net in the United States: unlike other means-tested
programs, there is no additional targeting to specific sub-populations. Current benefits average about
$200 per recipient household per month. Our analysis constitutes the first evidence that despite not
targeting pregnant mothers (or even women) introduction of the FSP improved newborn health.
2. Introduction of the Food Stamp Program
The modern Food Stamp Program began with President Kennedy's 1961 announcement of a
pilot food stamp program that was to be established in eight impoverished counties. The pilot
programs were later expanded to 43 counties in 1962 and 1963. The success with these pilot
programs led to the Food Stamp Act of 1964 (FSA), which gave local areas the authority to start up
the Food Stamp Program in their county. As with the current FSP, the program was federally funded
and benefits were redeemable at approved retail food stores. In the period following the passage of
the FSA, there was a steady stream of counties initiating Food Stamp Programs and Federal spending
on the FSP more than doubled between 1967 and 1969 (from $115 million to $250 million). Support
for requiring counties to participate in FSP grew due to a national spotlight on hunger (Berry 1984).
This interest culminated in passage of 1973 Amendments to the Food Stamp Act, which mandated
that all counties offer FSP by 1975.
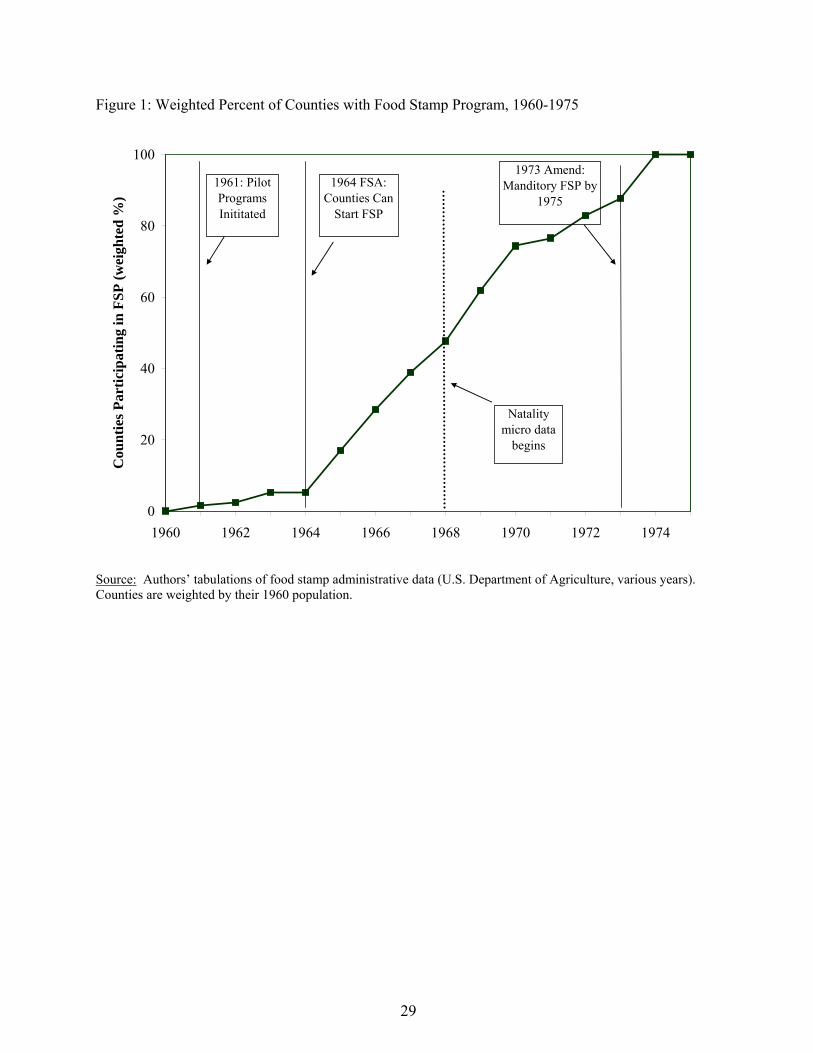
Figure 1 plots the percent of counties with a FSP from 1960 to 1975.2 During the pilot phase
2 Counties are weighted by their 1970 population. Note this is not the food stamp caseload, but represents the percent of the U.S. population that lived in a county with a FSP.

4
(1961-1964), FSP coverage increased slowly. Beginning in 1964, Program growth accelerated;
coverage expanded at a steady pace until all counties were covered in 1974. Furthermore, there was
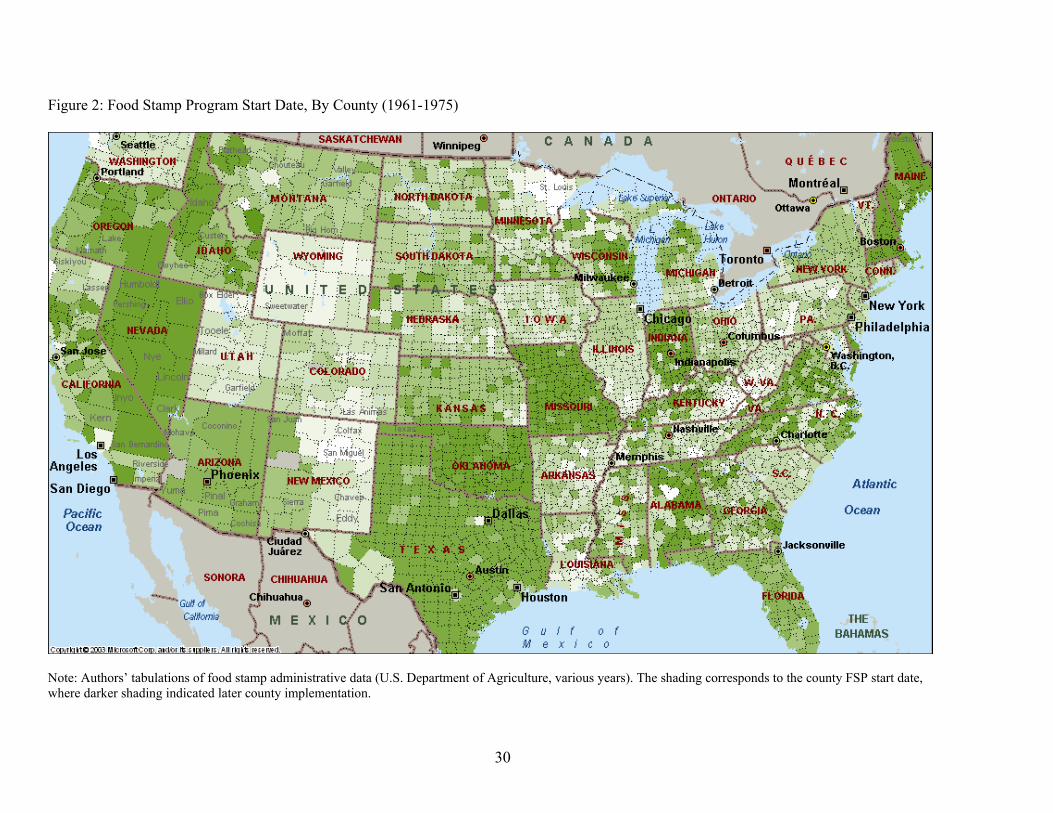
substantial heterogeneity in timing of adoption of the FSP, both within and across states. The map in
Figure 2 shades counties according to date of FSP adoption (darker shading denotes a later start up
date). Our basic identification strategy considers the month of FSP adoption for each county the FSP
“treatment.”3
For our identification strategy to yield causal estimates of the program, it is key to establish
that the timing of FSP adoption appears to be exogenous. Prior to the FSP, some counties provided
food aid through the commodity distribution program (CDP)—which took surplus food purchased by
the Federal government as part of an agricultural price support policy and distributed those goods to
the poor. The 1964 Food Stamp Act allowed for counties to voluntarily set up a FSP, but the Act also
stated that no county could run both the FSP and the CDP. Thus, for counties which previously ran a
CDP, adoption of the FSP implies termination of the CDP.4 The political accounts of the time
suggest that debates about adopting the FSP pitted powerful agricultural interests (who favored the
CDP) against advocates for the poor (who favored the FSP, see MacDonald 1977; Berry 1984).5 In
particular, counties with strong support for farming interests (e.g., southern or rural counties) may be
late adopters of the FSP. On the other hand, counties with strong support for the low income
population (e.g., northern, urban counties with large poor populations) may adopt FSP earlier in the
period. This systematic variation in food stamp adoption could lead to spurious estimates of the
program impact if those same county characteristics are associated with differential trends in the
3 This timing lines up exceptionally well with county-level FSP spending as measured in the REIS. See Appendix Table 3. 4 This transition in nutritional assistance would tend to bias downward FSP impact estimates, but we do not think this bias is substantial because of the limited scope of the CDP. The CDP was not available in all counties and recipients often had to travel long distances to pick up the items. Further, the commodities were distributed infrequently and inconsistently, and provided a very narrow set of commodities—the most frequently available were flour, cornmeal, rice, dried milk, peanut butter and rolled wheat (Citizens’ Board of Inquiry 1968). In contrast, Food Stamp benefits can be used to purchase all food items (except hot foods for immediate consumption, alcoholic beverages, and vitamins). 5 In fact, as described in Berry (1984) and Ripley (1969), passage of the 1964 Food Stamp Act was achieved through classic legislative logrolling. The farm interest coalition (Southern Democrats, Republicans) wanted to pass an

5
outcome variables.
In earlier work (Hoynes and Schanzenbach 2009), we documented that larger counties with a
greater fraction of the population that was urban, black, or low income indeed implemented the FSP
earlier (i.e. consistent with the historical accounts). Hoynes and Schanzenbach (2009) sought to
predict FSP adoption date with 1960 county characteristics (i.e. characteristics recorded immediately
prior to the pilot FSP phase). That analysis showed that larger counties and those with a higher share
black, elderly, young or low income implement earlier, and those where more of the land is used in
farming implement later.6 Nevertheless, the county characteristics explain very little of the variation
in adoption dates as illustrated in Appendix Figure 1. This is consistent with the characterization of
funding limits controlling the movement of counties off the waiting list to start up their FSP:
“The program was quite in demand, as congressmen wanted to reap the good will and publicity that accompanied the opening of a new project. At this time there was always a long waiting list of counties that wanted to join the program. Only funding controlled the growth of the program as it expanded” (Berry 1984, pp. 36-37). We view the weakness of this model fit as a strength when it comes to our identification
approach—in that much of the variation in the implementation of FSP appears to be idiosyncratic.
Nonetheless, in order to control for possible differences in trends across counties that are spuriously
correlated with the county treatment effect, all of our regressions include interactions of these
1960 pre-treatment county characteristics with time trends as in Acemoglu, Autor and Lyle (2004)
and Hoynes and Schanzenbach (2009).
This period of FSP introduction took place during a period of tremendous expansion in cash
and noncash transfer programs as the War on Poverty and Great Society programs were expanding.
To disentangle the FSP from these other programs, the county by month variation in FSP rollout is
key. Further, given that virtually all means tested programs, are administered at the state level our
controls for state by year fixed effects should absorb these program impacts. To be sure, however,
important cotton-wheat subsidy bill while advocates for the poor (Northern Democrats) wanted to pass the FSA. Neither had majorities, yet they made an arrangement, supported each others bills, and both bills passed. 6 For more detail, see Table 1 in Hoynes and Schanzenbach (2009).

6
our models include controls for per capita real county government (non food stamp) transfers. 7
3. Background Literature
The goal of the Food Stamp Program is to improve nutrition among the low income
population. As such, there have been many studies that examine the impact of the FSP on nutritional
availability and intake, food consumption, food expenditures and food insecurity (see Currie 2003
and Fraker 1990 for reviews of the literature).
Almost all existing studies of the impact of the FSP use research designs that rely on
comparisons of program participants to non-participants at the individual level. This approach is
subject to the usual criticisms regarding selection into the program. For example, a number of
researchers (Currie 2003; Currie & Moretti 2008; Fraker 1990) have pointed out that if food stamp
recipients are healthier, more motivated, or have better access to health care than other eligible
women, then comparisons between participants and non-participants could produce positive program
estimates even if the true effect is zero. Conversely, if food stamp participants are more
disadvantaged than other families, such comparisons may understate the program's impact. In fact, as
reported in Currie (2003), several studies, including Basiotis et al. (1998) and Butler & Raymond
(1996), actually find that food stamp participation leads to a reduction in nutritional intake. These
unexpected results are almost certainly driven by negative selection in participation.
Many researchers who evaluate the impact of other government programs avoid these
selection problems by comparing outcomes across individuals living in states with different levels of
benefit generosity or other program parameters. There is a long literature on the effects of cash
assistance programs, for example, which is based on this type of identification strategy
(Moffitt 1992; Blank 2002). Unfortunately, the FSP is a federal program for which there is very little
geographic variation – aside from the variation we utilize in this paper – or variation in eligibility
criteria or benefit levels, so prior researchers have had to employ alternative approaches.
7 The Special Supplemental Food Program for Women, Infants and Children (WIC)— available to low income pregnant women and children up to age 5 in families—was introduced in 1974..Given the timing of WIC
7
Identification issues aside, it is noteworthy that few FSP studies examine the impact on
health outcomes. We are aware of two studies. Currie and Cole (1991) examine the impact of the
FSP on birth weight using sibling comparisons and instrumental variable methods and find no
significant impacts of the FSP. Our work is closest to Currie & Moretti (2008), who use the county
roll out of FSP in California to analyze birth outcomes. They find that FSP introduction was
associated with a reduction in birth weight, which was driven particularly by first births among teens
and by changes for Los Angeles County. As discussed below, this negative effect is possible if the
FSP led to fertility changes or increases in the survival of low birth weight fetuses. The timing of
FSP assignment in Currie & Moretti (2008) differs from ours in that they consider FSP availability at
the beginning of pregnancy and its impact on birth weight, whereas we focus on availability towards
the end of pregnancy.8
The literature (see recent review in Currie 2008) provides few estimates of the causal impact
of income on birth weight. Cramer (1995) finds that mothers with more income have higher birth
weight babies, although income is identified cross-sectionally. Kehrer & Wolin (1979) find evidence
that the Gary Income Maintenance Experiment may have improved birth weight. However sample
sizes are small (N=404 births), and while positive effects were found for “high risk” mothers,
perverse effects were found for “low risk” mothers. Currie & Cole (1993), using IV and mother
fixed effects estimators, find that AFDC income leads to improvements in birth weight. Baker (2008)
uses the 1993 expansion in the EITC, which disproportionately benefitted families with two or more
children, finding a 7 gram increase in the birth weight of subsequent children. In general the
literature has been plagued by imprecise estimates due to small sample sizes as well as a lack of well-
identified sources of variation in income. As a result, we argue that our paper provides some of the
best evidence to date on the impact of income on birth outcomes.
4. Food Stamps and Infant Health
implementation relative to FSP, there is little concern that the introduction of WIC biases our estimates of the introduction of FSP, and results limited to pre-1974 are qualitatively similar. 8 Table 3 shows the sensitivity of our impact estimates to the timing of FSP assignment.

8
The FSP introduction represents an exogenous and sizable increase in income for the poor.
Canonical microeconomic theory predicts that in-kind transfers like food stamps will have the same
impact on spending as an equivalent cash transfer for consumers who are “infra-marginal” (that is,
who would spend more on the subsidized good than the face value of the in-kind transfer). Hoynes
and Schanzenbach (2009) use the same FSP roll out identification approach and data from the PSID
to examine the impacts of food stamps on food expenditures, and find that recipients of food stamps
behave as if the benefits were paid in cash. Therefore, not only can we think of the FSP introduction
as a large income transfer, but we can think of it as for the most part the equivalent of a cash income
transfer.
With this framing, an increase in income could lead to changes in infant health through many
channels. We would expect that spending on all normal goods would increase—therefore leading to
increases in food consumption regardless of whether the benefits are paid in cash or in kind. We
have little information on how particular sub-categories of food demand change with FSP
availability: Hoynes and Schanzenbach are able to measure impacts on total food expenditures, but
cannot provide information on the quantity or quality of food consumed (or other goods).
The medical literature on the determinants of birth weight provides a useful structure for
thinking about the possible channels for the health effects of the FSP. As suggested by Kramer
(1987a, 1987b), birth weight is usefully decomposed in to that related to the gestation length
(prematurity, or GL) and growth conditional on gestation length (intrauterine growth or IUG). Of the
two, GL is thought to be more difficult to manipulate, though empirically more important than IUG
in affecting birth weight in developed countries (Kramer 1987a,b). Maternal nutrition and cigarette
smoking are the two most important, potentially modifiable determinants of IUG (Kramer 1987a,b).
Finally, there is evidence that birth weight is generally most responsive to nutritional changes
affecting the third trimester of pregnancy.9
9 See the literature review of Rush et al. (1980). For example, the cohort exposed to the Dutch Famine in the third trimester had lower average birth weight than cohorts exposed earlier in pregnancy (Painter et al., 2005).
9
It is important to analyze additional health measures in addition to birth weight:
A final reminder concerns the need for future research to keep sight of the truly important outcomes of infant and child mortality, morbidity, and functional performance. After all, birth weight and gestational age are important only insofar as they affect these outcomes. Kramer (1987), p. 510
We examine impacts on neonatal mortality because it is commonly linked to the health environment
during pregnancy; it is therefore plausible that FSP transfers may have been a factor. Estimates from
Almond, Chay, and Lee (2005) indicate that a 1 pound increase in birth weight causes neonatal
mortality to fall by 7 deaths per 1,000 births, or 24%. Post-neonatal mortality, by contrast, is viewed
as being more determined by post-birth factors.10
This discussion suggests that we would expect FSP to affect birth weight and neonatal
mortality but not necessarily gestational length. One obvious channel for food stamp impacts is
through improvements in nutrition. The introduction of the FSP transfer increases total family
resources and is predicted to increase the quality and quantity of food consumed, thereby leading to
improvements in infant health. The increased transfer income could also encourage behaviors that
could harm infant health, such as smoking or drinking.11 Health improvements may work through
other channels as well, for instance reducing stress (e.g., financial stress) experienced by the mother
which itself has a direct impact on birth weight. We explore these issues by separately testing for
FSP impacts on length of gestation and birth weight, and by exploring the sensitivity of our impact
estimates to the timing of FSP assignment by pregnancy trimester.
Overall, we expect that access to the FSP should improve infant health. The same forces that
improve infant health, however, could also lead to a change in the composition of births. In
particular, if improvements in fetal health lead to fewer fetal deaths, there could be a negative
10 The initial health at birth is generally much better among infants who die in the post-neonatal period than among infants dying in the first month of life. For example, while 72 percent of all neonatal deaths had a low birth weight (below 2,500 grams), only 20 percent of all post-neonatal deaths were low birth weight infants (Starfield 1985). Post-neonatal deaths tend to be caused by negative events after birth, most often by infectious diseases and accidents (Grossman & Jacobowitz 1981). Further, post-neonatal deaths may be more responsive to hospital access than neonatal deaths, see Almond, Chay, and Greenstone (2007). 11 Even though recipients cannot purchase cigarettes directly with FSP benefits, the increase in resources to the household may increase cigarette consumption, which would work to reduce birth weight.

10
compositional effect on birth weight from improved survivability of “marginal” fetuses. This could
bias downward the estimated effects of the FSP on birth weight and infant mortality.12 In addition, if
FSP introduction leads to increases in fertility for disadvantaged women, this could also lead to
negative compositional effect and subsequent downward bias on the estimates.13 To evaluate such
channels, we test for impacts of the FSP on total births (finding no effect).
5. Data
The data for our analysis are combined from several sources. The key treatment or policy
variable is the month and year that each county implemented a food stamp program, which comes
from USDA annual reports on county food stamp caseloads (USDA, various years). These
administrative FSP data are combined with two micro datasets on births and deaths from the National
Center for Health Statistics. In some cases, we augment the core micro data with digitized print vital
statistics documents to extend analysis to the years preceding the beginning of the micro data. These
data are merged with other county level data from several sources.
Vital Statistics Natality Data. These data are coded from birth certificates and are available
beginning in 1968. Depending on the state-year these data are either a 100 percent or 50 percent
sample of births, and there are about 2 million observations per year. Reported birth outcomes
include birth weight, gender, plurality, and (in some state-years) gestational length. Data on the
month and county of birth permit linkage of natality outcomes to the month the FSP was introduced
in a given county. There are also (limited) demographic variables including: age and race of the
mother, and (in some state-years) education and marital status of the mother. Appendix Table 1
12 The estimates described below in Table 5 imply an imprecise 1 to 2 percent increase in the number of births among the treated. If we assume this increase is accounted for by reductions in early prenatal (embryonic) mortality, only to appear as deaths after birth during infancy, this would imply nearly a doubling of the infant mortality rate – which stood close to 2 percent nationally in 1970. Such an increase is not observed, and would obviously overwhelm any reductions in infant mortality among those who would have survived until birth absent the FSP. That said, our data clearly do not allow us to distinguish between births that reflect a prevented embryonic/fetal death versus induced conceptions. But the magnitudes involved suggest that postponement of intrauterine mortality to the first year of life could not have been the norm, or the infant mortality rate would have risen substantially. Thus, if we take the Table 5 point estimates at face value (despite the large standard errors), either mortality was postponed beyond infancy or the number of conceptions increased. 13 The existing literature suggests that the elasticity of fertility with respect to additional transfers from income support programs is very small (Moffitt 1998).

11
provides information on the availability of these variables over time.
We use the natality data and collapse the data to county-race-quarter cells covering the years
1968-1977. We use quarters (rather than months) to keep the sample size manageable. The results are
unchanged if we instead use county-race-month cells. We end the sample in 1977; this is two years
after all counties have implemented the FSP and before the program changes enacted in 1978 led to
increases in take-up.
Unfortunately, natality microdata are only available beginning in 1968. By 1968, half of the
population lived in counties with a FSP in place. In the interest of examining the full FSP rollout, we
obtained annual print vital statistics documents and digitized the available data. With these print
documents, we augment the microdata with counts of the total number of births by county-year (not
available by race) for 1959-1967 and counts of births by birth weight ranges by state-race-year (not
available by county) for 1959-1967.14
Vital Statistics Death Data. These data are coded from death certificates and are available
beginning in 1959. These data encompass the universe of death certificates (except in 1972 when
they are a 50 percent sample) and report the age and race of the decedent, the cause of death, and the
month and county of death. We collapse the data to county-race-quarter cells covering the years
1959-1977.
Our mortality measure is the neonatal mortality rate—defined as deaths in the first 28 days of
life per 1,000 live births. We focus on deaths from all causes, as it gives us the most power (further
cutting of the county-quarter-race cells by detailed cause of death leads to many very thin cells) and
is unaffected by changes in the coding of cause of death (conversion from ICD-7 to ICD-8) in 1968.
We have attempted to identify causes of death that could be affected by nutritional deficiencies and
we also present results for these deaths and other deaths.15 We consider nutritional causes both
because the FSP was targeted at those in nutritional risk and widespread concerns about nutritional
14 For historical vital statistics documents see http://www.cdc.gov/nchs/products/pubs/pubd/vsus/1963/1963.htm. 15 We thank Karen Norberg for helping identify the cause of death classifications. We are responsible for any classification errors.
12
status among the poor during this period. Appendix Table 2 lists the broad categories for cause of
death.
Our main neonatal results use the natality micro data to form the denominator (live births in
the same county-race-quarter). This limits the sample to years 1968-1977. In an extension we use the
digitized vital statistics documents and county-year counts of births to construct the denominator for
live births and therefore neonatal death rates (for all races) for 1959-1977.16
County Population Data. The SEERS population data are used to construct estimates of the
population of women ages 15-44 by county-race-year.17 These are used with the natality data to
construct fertility rates—defined as births per 1,000 women ages 15-44. Our main results use fertility
rates by county-race-quarter for 1968-1977. We also use the digitized annual counts of births by
county to construct fertility rates by county-year (not race, not quarter) for the full period 1959-1977.
County Control Variables. The 1960 City and County Data Book—which compiles data from
the 1960 Census of Population and Census of Agriculture—is used to measure economic,
demographic, and agricultural variables for the counties pre-treatment (before FSP is rolled out)
period. In particular, we use: the percent of the 1960 population that lives in an urban area, is black,
is less than 5, is 65 or over, has income less than $3,000 (1959$), the percent of land in the county
that is farmland, and log of the county population. The Bureau of Economic Analysis, Regional
Economic Information System (REIS) data is used to construct annual, county real per capita income
and government transfers to individuals, including cash public assistance benefits (Aid to Families
with Dependent Children AFDC, Supplemental Security Income SSI, and General Assistance),
medical spending (Medicare and Military health care), and cash retirement and disability
payments.18,19 These data are available electronically beginning in 1968. We extended the REIS data
16 We need quarterly births by race-county to match the quarterly deaths in the numerator. We use the distribution of births by quarter for each county in 1968 and assume that quarterly pattern holds for all years 1959-1967. In practice the “seasonality” of births across quarters is minimal. 17 See National Cancer Institute http://seer.cancer.gov/popdata/download.html. 18 Beginning in 1969, the REIS data permit more detailed categories for tabulating government transfers (including the ability to capture Medicaid spending). However, because the natality data begin in 1968 and the mortality data

13
to 1959 by hand entering data from microfiche for 1959, 1962, and 1965-1968.20
6. Methodology
We estimate the impact of the introduction of the FSP on county-level birth outcomes, infant
mortality, and fertility, separately by race. Specifically, we estimate the following model:
(1) 60 *ct ct c ct c t st ctY FSP CB t X
ctY (race suppressed) is a measure of infant health or fertility defined in county c at time t. In all
specifications we include unrestricted fixed effects for county c and time t . We examine the
sensitivity to including state by year fixed effects st or county specific linear time trends (not shown
in equation (1)).
ctFSP is the food stamp treatment variable equal to one if the county has a food stamp
program in place. The timing of the treatment dummy depends on the particular outcome variable
used. For the analysis of births, we assign FSP=1 if there is a FSP in place at the beginning of the
quarter prior to birth, to proxy for beginning of the third trimester.21 We assign the treatment at the
beginning of the third trimester following the evidence that this period is the most important for
determining birth weight. However, we explore the sensitivity to changing the timing of the FSP
treatment. Neonatal deaths are thought to be tied primarily to pre-natal conditions and we therefore
use the same FSP timing (we use the age at death and measure the FSP as of 3 months prior to birth,
to proxy for the beginning of the third trimester). We have less guidance for the correct timing for
begin in 1959, we have adopted these three categories. In analyses of the data limited to 1969+, the results are robust to adding more detailed categories. 19 The REIS data also measure food stamp transfer payments, but for obvious reasons we do not use this as a control in our model. We have, however, used the REIS data as a check on our USDA-measured county food stamp start dates. REIS-measured per capita spending on FSP sharply increases precisely at the USDA-measured implementation date. In the year prior to FSP introduction, 99 percent of counties report no spending on FSP; in the year of introduction this falls to 1.3 percent, and is less than 0.3 percent in subsequent years (Appendix Table 3). 20 We used linear interpolation to fill in the missing years. We thank Gary Kennedy of the Bureau of Economic Analysis for providing the REIS data microfiche. 21 To be precise, because we collapse the data to the county-quarter the FSP variable can sometimes equal something other than a 0 or 1. The natality data is available at the monthly level and we use that to assign FSP status as of 3 months prior to birth (proxy for beginning of the third trimester). When the data is collapsed to the county-quarter this policy variable is averaged among the 3-months of observations in that cell. Therefore the policy variable ranges from 0 to 1, with most values at 0 or 1.

14
FSP treatment for fertility—we explore FSP availability between 3 quarters prior to birth (to proxy
for conception) and 7 quarters prior to birth.
The vector ctX contains the annual county-level controls from the REIS including real per
capita transfers and the log of real annual county per capita income. 60cCB are the 1960 county
characteristics, which we interact with a linear time trend to control for differential trends in health
outcomes that might be correlated with the timing of FSP adoption.
We consider several outcome variables in our main specifications. First, using the natality
data we measure infant health at birth as continuous mean birth weight in grams, and fraction low
birth weight (less than 2,500 grams, or about 5.5 pounds). These measures are means within county-
race-quarter. Second, using the mortality data we examine impacts on neonatal mortality rates (per
1,000 live births) for all causes, and for those likely to be affected by nutritional deficiencies.
All estimates are weighted using the number of births in the county-race-quarter and the
standard errors are clustered by county. Further, to protect against estimation problems associated
with thinness in the data, for the natality (mortality) analysis we drop all county-race-quarter cells
where there are fewer than 25 (50) births.22 The results are not sensitive to this sample selection. We
also drop Alaska because of difficulties in matching FSP service areas with counties.
7. Results for Natality
Table 1 presents the main results for mean birth weight and the fraction of births that are low
birth weight (LBW) for 1968-1977. Results are presented separately for whites (panel A) and blacks
(panel B). For each outcome, we report estimates from four specifications with different controls.
Column (1) includes county and time (year x quarter) fixed effects, county per capita income, REIS
county-level per-capita transfers, and 1960 county characteristics interacted with linear time. The
remaining columns control for trends in three ways: column (2) with state specific linear time trends,
column (3) with unrestricted state by year fixed effects, and (4) with county specific linear time
22 Neonatal mortality rates average 12 (19) per 1,000 births for whites (blacks) during our sample period. We use a higher threshold for the mortality analysis because of the low incidence of infant mortality.

15
trends. In this and all subsequent tables, the number of observations refers to county-quarter cells.23
The first four columns in Panel A report the impact of having FSP in place in the third
trimester of pregnancy on mean birth weight for births to white women. These columns indicate a
small statistically significant increase in birth weight for whites caused by exposure to FSP during
the third trimester. The results are extremely robust across specifications, including controlling for
county specific linear time trends. When the estimated coefficient is divided by mean birth weight,
the resulting effect size is a 0.06 to 0.08 percent increase in birth weight (this is labeled in this and
subsequent tables as “% Impact (coef/mean)”). As shown in Panel B, the impact of FSP exposure on
birth weight is 50-150 percent larger for blacks than whites. That, combined with a smaller average
birth weight for blacks, implies an impact between 0.1 and 0.2 percent on blacks (about twice the
impact on whites).
Only a subset of women who give birth are likely to be affected by FSP. While the
coefficients reported above are valid estimates of the population impact of FSP, we also want to
know the impact among FSP recipients (treatment on the treated). To calculate the implied impact on
those who take up the FSP, we divide the parameters by an estimate of the FSP participation rate for
this sample.24 We can inflate the estimated effect by these participation rates for an estimate of
treatment on the treated. The results indicate that the impact of FSP on participants' birth weight
(labeled “Estimate, inflated”) is between 15 and 20 grams for whites and 13 to 42 grams for blacks.
The estimate expressed as a percent of mean birth weight (labeled “% Impact inflated”) is between
0.5 and 0.6 percent for whites and between 0.4 and 1.4 for blacks.
The results for birth weight (and the other outcomes described below) are very robust to
23 Note with 3142 counties and 40 quarters of data, the maximum number of observations would be about 125,000. As described above, we drop cells with fewer than 25 births. This reduces the sample of blacks much more than whites because blacks are more geographically concentrated. Despite dropping many counties, this sample represents 98% of white births and 94% of black births. 24 We do not have information about food stamp participation in the natality data, nor do we have sufficient data to impute eligibility (e.g. income). Instead, we use the 1980 Current Population Survey and calculate FSP participation rates for women with a child under 5. (Participation rates look very similar if we alternatively use presence of a child below age 1 or 3.) The estimated participation rate for women with young children (under age 5) is 0.13 for whites and 0.41 for blacks.

16
adding more controls to the model. We view the specification with state by year unrestricted fixed
effects as very encouraging—as we have controlled for a whole host of possibly contemporaneous
changes to labor markets, government programs and other things that vary at the state-year level.
While not shown here, the county level variables for government transfers and pre-treatment
variables do little to change the results. This provides further evidence that the food stamp rollout is
exogenous, thereby validating the research design. Finally, we also find the results robust to adding
county linear time trends (with some reduction for blacks). On the downside, the poor explanatory
power of our control variables in predicting the timing of FSP (described in Section 2) means that the
precision of our impact estimates is not noticeably improved by including these regression controls.
For the remainder of the tables, we adopt the specification with state by year fixed effects as our base
case specification. Results (not presented here) are the same if log of birth weight is used as the
dependent variable instead.
Columns (5) through (8) repeat the exercise, this time with the fraction low birth weight (less
than 2,500 grams) as the dependent variable. Exposure to FSP reduces LBW by a statistically
significant 1 percent for whites (7-8 percent when inflated by participation rate), and a less precisely
estimated 0.7 to 1.5 percent for blacks (5 to 12 percent when inflated by participation rate).
To further investigate the impact of the FSP on the distribution of birth weight, we estimated
a series of models relating FSP introduction to the probability that birth weight is below a given gram
threshold: 1500, 2000, 2500, 3000, 3250, 3500, 3750, 4000, 4500 (Duflo 2001). We use the
specification in column (3) with state by year fixed effects; the estimates and 95 percent confidence
intervals are presented in Figure 3 (we plot “% Impacts [coef/mean]” not inflated by program
participation). Figure 3A displays the results and confidence intervals for whites. We find that the
largest percent reduction in probability of birth weight below a certain threshold comes at very low
thresholds of 1500 and 2000 grams. The impacts become gradually smaller as the birth weight
threshold is increased to 2500 grams and above, until there is no difference for births below

17
3,750 grams. Results are larger for blacks (Figure 3B), showing a six percent decrease in the
probability of a birth less than 1,500 grams, and an impact that declines at higher birth weights.25
Appendix Table 4 presents estimates for three additional outcome variables: the fraction of
births that are less than 1,500 grams, that have gestation length less than 37 weeks (pre-term births),
and the fraction of births that are female. These results show that FSP leads to a small and
statistically insignificant decrease in pre-term births and the fraction of births that are female. While
small and statistically insignificant, this is consistent with recent work finding that prenatal
nutritional deprivation tips the sex ratio in favor of girls (Mathews et al. 2008).26
One limitation of these results is that micro-data on births by county is only available starting
in 1968 at which point, almost half of the population was already covered by the FSP. In Appendix
Table 5 we use data from 1959-1977 to examine the impact of the FSP rollout on low birth weight
and very low birth weight. To push the period back to 1959, we are limited to use of data at the state-
race-year level (see discussion in data section). Controls include state and year fixed effects, REIS
variables, and state-specific linear time trends; standard errors are clustered on state.27 We first
present results for 1968+; where the data are identical to that used in Table 1 but are collapsed to the
state level. The results show imprecise, but qualitatively similar, effects of FSP measured with this
noisier treatment variable. (For example, the county analysis in Table 1 shows a -1.0 percent impact
on LBW for whites and -1.5 percent for blacks compared to -0.4 percent for whites and -1.6 percent
for blacks for the state-year data in Appendix Table 5). We then show the results for the full period
25 In order to gauge the magnitude of these effects, it is useful to compare the estimated effects to those implied by the previous literature. Cramer (1995) finds that a 1 percent change in the income-to-poverty ratio leads to a 1.05 gram increase in mean birth weight. The Hoynes and Schanzenbach (2009) estimates of the magnitude of food stamp benefits are $1900 annually for participants (in 2005 dollars). Scaling those to match the units available in the literature (and treating FSP benefits as their face-value cash-equivalent) implies that food stamps increased the family income-to-poverty ratio of participants by 15 percent. The implied treatment-on-treated effect would therefore be approximately 16 grams, which is quite similar to the effects found in Table 1. 26 In results not shown here, we find that birth weight models are little changed by controlling for gestation (known as an IUG model). We also estimated models where the dependent variable is the fraction of births below a gestation-varying threshold (known as small-for-gestational-age models, Fenton 2003). These models yielded results very similar to the LBW regressions. 27 To construct state-level FSP treatment, we use the 1968 counts of number of births by county-month and calculate (for each state and year using the program variables) the percent of births in the state that were in counties with FSP in place 3 months prior to birth.

18
(1959-1977) and the post-pilot program period (1964-1977). Whenever estimating models for the full
FSP ramp up period, we look separately at the 1964+ period because the pilot counties were clearly
not exogeneously chosen. Using this earlier (but more aggregated) data, we get qualitatively similar
(and statistically indistinguishable) results across the different time periods, suggesting that missing
the pre-1968 period in our main results may not qualitatively affect our conclusions.
7.1. Impacts by Likelihood of Treatment
We next explore whether the impacts of the FSP are larger among subsets of the sample that
are more likely to be affected by the FSP. The natality data include education of the mother and
presence of the father but because of missing data (not all states collected this information in earlier
years) we lose a substantial fraction of the sample (see Appendix Table 1). Nonetheless we have
estimated models by age of mother, education of mother, and presence of the father (results not
shown). Overall, the results showed that the impacts are larger for older mothers (age 25 and over).
None of the education results are statistically significant. This analysis did reveal that black mothers
with no father present experience much larger impacts than all black women. This is consistent with
the high participation rates among this group (0.70 compared to 0.50 for all blacks).
In lieu of detailed demographic variables, in Table 2 we break counties into quartiles based
on 1970 poverty rates, where we expect larger impacts in high poverty counties. The results are quite
striking—the gains are concentrated in the highest poverty counties. Large statistically significant
effects are present in the highest quartile poverty counties, while smaller and insignificant effects are
presents in the lowest poverty counties. (Due to the relatively large standard errors, we can not reject
that they are equal.)
There is some suggestion in the historical accounts that the impact might be different across
geographic regions, or might differ by race across regions. In particular, participation in the program
in the early years (after the county's initial adoption of FSP) was probably higher in urban counties
and in the North. Barriers to accessing food stamps might have also differed between North and

19
South, and may have interacted with race (Citizen’s Board, 1968). Table 3 shows that the impact of
FSP is larger and more statistically significant for both blacks and whites in urban counties.
Interestingly, blacks appear to have larger effects outside the South, while whites appear to have
larger effects in the South. These differences parallel the regional trends– Blacks saw larger
reductions in low birth weight (and neonatal mortality) in the North, while Whites saw larger
declines in the South. The FSP impacts by South/Non-South, however, are less precisely estimated
than the results by urban/nonurban.28
7.2 Investigation of the Timing of Impacts
To explore the possible channels for the impacts of the FSP transfer, Table 4 re-estimates the
mean birth weight models varying the timing of the exposure to the FSP. The baseline
specification—reprinted from column (3) of Table 1—assigns the policy introduction as three
months prior to birth, to proxy for beginning of the third trimester. Columns (2) and (3) of Table 4
move assign FSP treatment to two and three quarters before birth, respectively. Moving the treatment
from third to second trimester reduces the impact of FSP substantially, though there is still a
statistically significant impact on birth weight for blacks. Furthermore, assigning treatment at
3 quarters before birth (proxy for conception) yields even smaller and statistically insignificant
impacts. The results in columns (4) and (5) show that conditional on third trimester exposure,
additional exposure earlier in the pregnancy has no additional benefits. Similar results are found for
fraction low and very-low birth weight. Recalling from section 4 that the medical literature suggests
that nutrition has its greatest impact on birth weight during the third trimester, we view these
estimates as suggestive that nutrition is playing an important channel for the FSP transfer’s benefits.
In addition, these results provide evidence that our model is not simply capturing a spurious
correlation between FSP introduction and trends in infant outcomes at the county level.29
28 We define the county as urban if more than 50 percent of the 1960 population in the county lives in an urban area. 29 Note that the reduction in the magnitude of the birth weight impact may explain the difference between our results and Currie & Moretti (2008). Their study of birth outcomes in California assigned the FSP treatment nine months prior to birth, and found comparatively limited impacts on birth weight. Another explanation for larger effects in the third trimester is if initial FSP participation is concentrated there (rather than earlier).

20
To further test for spurious trending in the county birth outcomes that might be loading on to
FSP, we include a one-year lead of the policy variable for each of the birth outcome variables in
Appendix Table 6. There is no impact of the policy lead and the results for the main policy variable
are qualitatively unchanged.
As described above, we use the month the county implemented the FSP to measure food
stamp availability during these pregnancies. If there was a lag in ramping up county food stamp
programs then our difference-in-difference estimates will underestimate the true (eventual) program
impacts. The administrative ramp-up was aided by the fact that the new FSP offices were often set up
in the same building as the county welfare office. To directly evaluate the ramp-up in FSP
operations, Figure 4 shows food stamp caseloads per capita by year relative to start year (the caseload
data is only available by year). The figure separately plots caseloads for counties beginning
operations in the first half versus second half of the caseload reporting year. This figure suggests that
rapid ramp-up was achieved and that the ramp up is only slightly faster in the counties with more
lead time (implementation earlier in the year). Further, note that over half of the “steady state”
caseload is achieved in the first year, even for counties that begin operation late in the reporting year.
7.3 Event Study
The pattern of estimates in Table 4 suggests that the FSP treatment effect is identified by the discrete
jump in FSP at implementation and its impact on birth weight. In particular, we showed in Table 4
that as the timing of the treatment is shifted earlier in pregnancy, the estimated FSP effect on birth
weight decreased substantially in magnitude. If instead identification were coming from some other
trends in county outcomes that are correlated with FSP start month, then we would expect less
sensitivity in the results to the trimester to which the FSP treatment is assigned. However, there
remains a concern that our results are driven by trends in county birth outcomes that are correlated
with FSP implementation in a way that county linear trends do not capture.

21
This proposition can be evaluated more directly in an event study analysis. Specifically, we
fit the following equation:
(2) 8
6
1( ) *ct i ct c t ct c cti
Y i X t
where ct denotes the event quarter, defined so that 0 for births that occur in the same quarter as
the FSP began operation in that county, 1 for births one quarter after the FSP began operation,
and so on. For 1 , pregnancies were untreated by a local program (births were before the
program started). The coefficients are measured relative to the omitted coefficient ( 2 ).30 Our
event study model includes unrestricted fixed effects for county and time, county REIS variables, and
county specific linear time trends.
In order to eliminate potential compositional effects, we restrict the sample to a balanced
panel of counties having births for all 15 event quarters: 6 quarters before implementation and 8
quarters after. As our natality data begins with January 1968, this means we exclude from the event
study analysis all counties with a FSP before July 1969.
Figure 5 plots the event-quarter coefficients from estimating equation (2) on the fraction low
birth weight births. The figure also reports the number of county-quarter observations in the balanced
sample and the difference-in-difference estimate on this sample.31 Panel A reports estimates for
Blacks and Panel B reports estimates for Whites. These figures show an absence of a strong pre-trend
and evidence of a trend break at the quarter the FSP is introduced, implying an improvement in infant
outcomes. That such a prompt increase in birth weight is observed with FSP inception indicates that
potential confounders would have to mimic the timing of FSP roll out extremely closely. Not shown
here, the event study results are nearly identical if we exclude the county controls, providing further
evidence of the exogeneity of the treatment. We view this as more evidence of the validity of our
30 Because of the discrete nature of the event study model, the τ’s are formed by aggregating months to a quarter. For example, if the FSP started (or birth occurred) in January, February or March of 1970, then the FSP started (or birth occurred) in 1970 quarter 1. Therefore when τ=0 (birth quarter = policy commencement quarter) then the pregnancy could actually have been treated for between 0 and 3 months.
22
identification strategy.32
7.4 Further Robustness Checks
The main results are robust to various additional specification checks. One potential concern
is that the FSP introduction is correlated with unobserved county health investments (such as the
expansion of access to hospitals in the South as in Almond et al. 2007) and our REIS controls fail to
pick this up. To test this, we use the natality data to estimate the impact of FSP implementation on
the fraction of births in a hospital and/or attended by a physician. These results indicate very small
and statistically insignificant improvements with FSP implementation (Appendix Table 7).
Finally, as discussed above, the same forces that improve infant health could also lead to
greater survival of low birth weight fetuses. In addition, the FSP may lead to increased fertility
among disadvantaged women (if children are a normal good). Both these factors, through
endogeneous sample selection, could bias downward the estimates. We consider this by evaluating
whether FSP introduction is associated with any change in live births. The dependent variable is
number of births in the race-county-quarter divided by the number of women aged 15-44, and the
regressions are weighted by the population of women in each cell. Table 5 presents several estimates,
which vary depending on the timing of the FSP treatment: between 3 quarters prior to birth (proxy
for conception) and 7 quarters prior to birth (1 year prior to conception). Across the table, we find
positive but very small and statistically insignificant effects of FSP on births. When these point
estimates are inflated by the FSP participation rate, the estimate of the treatment on the treated is
about 1 percent for whites and 2 percent for blacks. When we stratify the results by quartiles of
county poverty rates, we also find small and statistically insignificant impacts among those living in
the highest poverty counties (Appendix Table 8).
8. Mortality Results
Table 6 shows the main results for neonatal infant mortality rate for 1968 to 1977. We
31 The difference-in-difference estimate is comparable to the results presented in Table 1. We present them here because the samples used for the event study differ from the main results (due to balancing of the sample).
23
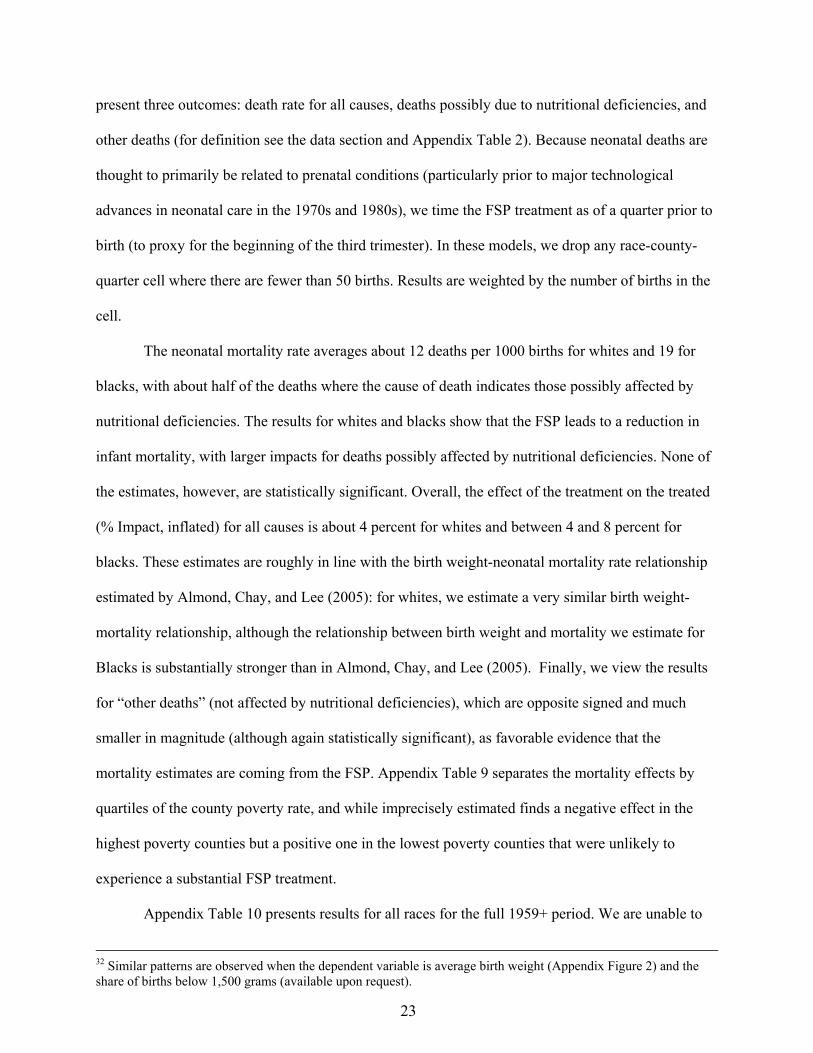
present three outcomes: death rate for all causes, deaths possibly due to nutritional deficiencies, and
other deaths (for definition see the data section and Appendix Table 2). Because neonatal deaths are
thought to primarily be related to prenatal conditions (particularly prior to major technological
advances in neonatal care in the 1970s and 1980s), we time the FSP treatment as of a quarter prior to
birth (to proxy for the beginning of the third trimester). In these models, we drop any race-county-
quarter cell where there are fewer than 50 births. Results are weighted by the number of births in the
cell.
The neonatal mortality rate averages about 12 deaths per 1000 births for whites and 19 for
blacks, with about half of the deaths where the cause of death indicates those possibly affected by
nutritional deficiencies. The results for whites and blacks show that the FSP leads to a reduction in
infant mortality, with larger impacts for deaths possibly affected by nutritional deficiencies. None of
the estimates, however, are statistically significant. Overall, the effect of the treatment on the treated
(% Impact, inflated) for all causes is about 4 percent for whites and between 4 and 8 percent for
blacks. These estimates are roughly in line with the birth weight-neonatal mortality rate relationship
estimated by Almond, Chay, and Lee (2005): for whites, we estimate a very similar birth weight-
mortality relationship, although the relationship between birth weight and mortality we estimate for
Blacks is substantially stronger than in Almond, Chay, and Lee (2005). Finally, we view the results
for “other deaths” (not affected by nutritional deficiencies), which are opposite signed and much
smaller in magnitude (although again statistically significant), as favorable evidence that the
mortality estimates are coming from the FSP. Appendix Table 9 separates the mortality effects by
quartiles of the county poverty rate, and while imprecisely estimated finds a negative effect in the
highest poverty counties but a positive one in the lowest poverty counties that were unlikely to
experience a substantial FSP treatment.
Appendix Table 10 presents results for all races for the full 1959+ period. We are unable to
32 Similar patterns are observed when the dependent variable is average birth weight (Appendix Figure 2) and the share of births below 1,500 grams (available upon request).

24
present results by race here because the denominator (live births by county-time) is not available by
race prior to 1968. The first three columns replicate the results in Table 6 for 1968-1977 for all races.
In the subsequent columns (for years 1959-1977 and 1964-1977) we find results very similar to those
for 1968-1977. Overall, FSP implementation leads to a reduction in neonatal infant mortality,
although not statistically significantly so.
9. Interpretation and Conclusion
The uniformity of the Food Stamp Program was designed to buffer the discretion States
exercised in setting rules and benefit levels of other anti-poverty programs. This uniformity was
deliberately preserved through the major reforms to welfare under the 1996 Personal Responsibility
and Work Opportunity Reconciliation Act (Currie, 2003). An unintended consequence of this
regularity has been to circumscribe the policy variation typically used by researchers to identify
program impacts. As a result, surprisingly little is known about FSP effects.
In contrast to other major U.S. anti-poverty programs, the Food Stamp Program was rolled
out county by county. This feature of FSP implementation allows us to separate the introduction of
food stamps from the other major policy changes of the late 1960s and early 1970s. Although FSP
benefits were (and are) paid in vouchers that themselves could only be used to purchase food,
because the voucher typically represented less than households spent on food (covering just the
“thrifty food plan”), recipients were inframarginal and benefits were essentially a cash transfer
(Hoynes & Schanzenbach 2009).
Across the board, our point estimates show that this near-cash transfer improved infant
outcomes. In particular, we find increases in mean birth weight for whites and blacks, with larger
impacts estimated at the bottom of the birth weight distribution (i.e. low birth weight and very low
birth weight). Consistent with expectations, we find larger birth weight effects for black mothers and
those living in high poverty areas – populations where FSP participation is more common. Consistent
with epidemiological studies, FSP availability in the third trimester had the largest birth weight

25
impact. We conclude that despite not targeting pregnant women, the introduction of the FSP
increased birth weight. This finding is all the more noteworthy given the mixed success randomized
interventions have had in raising birth weights (e.g. Rush et al., 1980; Lumley & Donohue, 2006).
While the point estimates for gestation length and neonatal mortality would also suggest
improved health at birth, estimated effects are imprecise, despite the large samples from vital
statistics data. One interpretation is that statistical power is lost when analyzing gestation length
(incomplete reporting by states) and mortality (rare). Leaving the imprecision issue aside, gestation
length and mortality appear less affected than the likelihood of low and very low birth weight.
At a minimum, our results indicate that the FSP had an immediate “first-stage” impact on
newborns. Furthermore, these estimated impacts (as reflected by birth weight) are much larger in
high poverty counties. Our findings reveal that an exogenous increase in income during a well-
defined period – pregnancy – can improve infant health. Future work should consider whether this
FSP-induced birth weight improvement is reflected in subsequent outcomes, and how poverty and
birth weight may mediate this relationship.
26
References
Acemouglu, Daron, David Autor, and David Lyle (2004). “Women War and Wages: The Impact of Female Labor Supply on the Wage Structure at Mid-Century,” Journal of Political Economy, 112(3): 497–551.
Almond, Douglas, Kenneth Y. Chay, and Michael Greenstone (2007). “Civil Rights, the War on Poverty, and Black-White Convergence in Infant Mortality in the Rural South and Mississippi,” working paper No. 07-04, MIT Department of Economics.
Almond, Douglas, Kenneth Y. Chay, and David S. Lee (2005). “The Costs of Low Birth Weight,” The Quarterly Journal of Economics, 120(3): 1031–1084.
Barker, D.J.P. (1992). Fetal and Infant Origins of Adult Disease (London: British Medical Journal 1992).
Baker, Kevin (2008). “Do Cash Transfer Programs Improve Infant Health: Evidence from the 1993 Expansion of the Earned Income Tax Credit,” manuscript, University of Notre Dame.
Bastiotis, P., C. S. Cramer-LeBlanc, and E. T. Kennedy (1998). “Maintaining Nutritional Security and Diet Quality: The Role of the Food Stamp Program and WIC,” Family Economics and Nutritional Review, 11, 4–16.
Berry, Jeffrey M., (1984). Feeding Hungry People: Rulemaking in the Food Stamp Program (New Brunswick, NJ: Rutgers University Press).
Black, Sandra E., Paul J. Devereux, and Kjell G. Salvanes (2007). “From the Cradle to the Labor Market? The Effect of Birth Weight on Adult Outcomes,” Quarterly Journal of Economics, 122(1): 409–439.
Blank, Rebecca (2002). “Evaluating Welfare Reform in the United States,” The Journal of Economic Literature, 40(4): 1105-1166.
Butler, J.S. and J.E. Raymond (1996). “The Effect of the Food Stamp Program on Nutrient Intake,” Economic Inquiry, 34(4): 781–98.
Citizens’ Board of Inquiry into Hunger and Malnutrition in the United States (1968). Hunger, U.S.A. Boston: Beacon Press.
Cleaveland, Frederick N. (1969). Congress and Urban Problems: A Casebook on the Legislative Process (Washington, DC: The Brookings Institution) 279–310.
Corman, Hope and Michael Grossman (1985).“Determinants of Neonatal Morality Rates in the U.S. A Reduced Form Model,” Journal of Health Economics, 4(3): 213–236.
Cramer, James (1995). “Racial and Ethnic Differences in Birth Weight: The Role of Income and Financial Assistance,” Demography 32(2): 231-247.
Currie, Janet (2003). “Food and Nutrition Programs” in Means-tested Transfer Programs in the U.S., Robert Moffitt, ed (Cambridge, MA: NBER).
Currie, Janet (2008). “Healthy, Wealthy and Wise: Socioeconomic Status, Poor Health in Childhood, and Human Capital Development.” NBER Working paper 13987.
Currie, Janet and Nancy Cole (1991). “Does Participation in Transfer Programs During Pregnancy

27
Improve Birth Weight?” NBER Working paper 3832.
Currie, Janet and Nancy Cole (1993). “Welfare and Child Health: The Link Between AFDC Participation and Birth Weight.” American Economic Review 83(4): 971-985.
Currie, Janet and Enrico Moretti (2008). “Did the Introduction of Food Stamps Affect Birth Outcomes in California?” in Making Americans Healthier: Social and Economic Policy as Health Policy, R. Schoeni, J. House, G. Kaplan, and H. Pollack, editors, Russell Sage Press.
Duflo, Esther (2001). “Schooling and Labor Market Consequences of School Construction in Indonesia: Evidence from an Unusual Policy Experiment.” American Economic Review 91(4):795-813.
Fenton, Tanis (2003). “A new growth chart for preterm babies: Babson and Benda's chart updated with recent data and a new format.” BMC Pediatrics.
Fraker, Thomas (1990). “Effects of Food Stamps on Food Consumption: A Review of the Literature,” report of Mathematica Policy Research. Washington, DC.
Grossman, Michael and Steven Jacobowitz (1981). “Variations in Infant Mortality Rates among Counties of the United States: The Roles of Public Policies and Programs,” Demography, 18(4): 695–713.
Hoynes, Hilary W. and Diane Whitmore Schanzenbach (2009). “Consumption Responses to In-Kind Transfers: Evidence from the Introduction of the Food Stamp Program,” American Economic Journal: Applied Economics 1(4):XXX-XXX.
Kehrer, Barbara H. and Charles M. Wolin (1979) “Impact of Income Maintenance on Low Birth Weight: Evidence from the Gary Experiment,” Journal of Human Resources 14(1):434-462.
Kraemer, Sebastian (2000). “The Fragile Male,” BMJ 321: 23–30 (December).
Kramer, Michael S. (1987a) “Intrauterine Growth and Gestational Determinants,” Pediatrics, 80:502–511.
Kramer, Michael S. (1987b) “Determinants of Low Birth Weight: Methodological Assessment and Meta-Analysis,” Bulletin of the World Health Organization 65(5):633-737.
Lumley, Judith and Lisa Donohue (2006) “Aiming To Increase Birth Weight: A Randomised Trial Of Pre-Pregnancy Information, Advice And Counseling In Inner-Urban Melbourne,” BMC Public Health, 6(1).
MacDonald, Maurice (1977). Food, Stamps, and Income Maintenance (Madison, WI: Institute for Poverty Research).
Mathews, Fiona, Paul J. Johnson and Andrew Neil (2008). “You Are What Your Mother Eats: Evidence For Maternal Preconception Diet Influencing Foetal Sex In Humans,” Proceedings of the Royal Society, 275(1643):1661-8.
Mays, Benjamin E. and Leslie W. Dunbar (1968). Hunger, USA (Washington, DC: The New Community Press), the Citizens’ Board of Inquiry into Hunger and Malnutrition in the United States.
Moffitt, Robert (1992). “Incentive Effects of the US Welfare System,” Journal of Economic Literature, 30(1): 1–61.

28
Moffitt, Robert (1998). “The Effect of Welfare on Marriage and Fertility”, in Robert Moffitt ed, Welfare, the Family, and Reproductive Behavior, National Research Council.
National Center for Health Statistics (various years). Health, United States, Hyattsville MD. Downloaded from: http://www.cdc.gov/nchs/products/pubs/pubd/hus/previous.htm#editions.
National Center for Health Statistics (1984). “Vital Statistics of the United States, 1984, Volume 2 Mortality, Part A.”
National Center for Health Statistics (2002). “National Vital Statistics Reports,” Volume 50, Number 15.
Oreopoulos, Phil, Mark Stabile, Randy Walld, and Leslie Roos (2006). “Short, Medium, and Long Term Consequences of Poor Infant Health: An Analysis using Siblings and Twins.” National Bureau of Economic Research Working Paper No. 11998.
Painter, Rebecca C., Tessa J. Rosebooma, and Otto P. Bleker (2005). “Prenatal exposure to the Dutch famine and disease in later life: An overview,” Reproductive Toxicology, 20(3): 345-352.
Ripley, Randall B. (1969). “Legislative Bargaining and the Food Stamp Act, 1964” in Congress and Urban Problems: A Casebook on the Legislative Process, Frederick N. Cleaveland, editor, The Brooking Institution.
Royer, Heather (2009). “Separated at Girth: U.S. Twin Estimates of the Effects of Birthweight” Forthcoming, American Economic Journal: Applied Economics.
Rush, David, Zena Stein, and Mervyn Susser (1980). Diet in Pregnancy: A Randomized Controlled Trial of Nutritional Supplements (New York: Alan R. Liss, Inc. 1980).
Schanzenbach, Diane Whitmore (2008) “What are Food Stamps Worth?” mimeo.
Starfield, Barbara (1985). “Postneonatal Mortality,” Annual Review of Public Health, 6: 21–40.
U.S. Congressional Budget Office (1977). “The Food Stamp Program: Income or Food Supplementation?” Washington, U.S. Government Printing Office.
U.S. Department of Agriculture (various years). “Food Stamp Program, Year-End Participation and Bonus Coupons Issues,” Technical report, Food and Nutrition Service.
U.S. Department of Health, Education and Welfare (various years). “Vital Statistics of the United States, Volume I.” (1959-1967).
29
Figure 1: Weighted Percent of Counties with Food Stamp Program, 1960-1975
0
20
40
60
80
100
1960 1962 1964 1966 1968 1970 1972 1974
Cou
nti
es P
arti
cip
atin
g in
FS
P (
wei
ghte
d %
)
1961: Pilot ProgramsInititated
1964 FSA:Counties Can
Start FSP
1973 Amend: Manditory FSP by
1975
Natality micro data
begins
Source: Authors’ tabulations of food stamp administrative data (U.S. Department of Agriculture, various years). Counties are weighted by their 1960 population.
30
Figure 2: Food Stamp Program Start Date, By County (1961-1975)
Note: Authors’ tabulations of food stamp administrative data (U.S. Department of Agriculture, various years). The shading corresponds to the county FSP start date, where darker shading indicated later county implementation.

31
Figure 3: Effects of FSP Implementation on Distribution of Birth Weight, Percent Impacts (Coef/Mean)
(a) Whites
(b) Blacks Notes: The graph shows estimates and 95 percent confidence intervals for the estimate of the impact of FSP implementation on the fraction of births in the county-quarter cell that is below each specified number of grams. The specification is given by column (3) in Table 1.
-14.0%
-12.0%
-10.0%
-8.0%
-6.0%
-4.0%
-2.0%
0.0%
2.0%
4.0%
6.0%
1,500 2,000 2,500 3,000 3,250 3,500 3,750 4,000 4,500
-14.0%
-12.0%
-10.0%
-8.0%
-6.0%
-4.0%
-2.0%
0.0%
2.0%
4.0%
6.0%
1,500 2,000 2,500 3,000 3,250 3,500 3,750 4,000 4,500

32
Figure 4: Percent of County Population on Food Stamps by Number of Years Since Program Start
Notes: Graph is an unweighted regression of county-year food stamp caseloads on a series of dummy variables tracking year relative to county FSP implementation year. County caseload is expressed as a share of the 1960 population. Source for caseload data is USDA (various years).
0.00
0.02
0.04
0.06
0.08
0.10
-5 -4 -3 -2 -1 0 1 2 3 4 5
event year
shar
e of
196
0 co
unty
pop
ulat
ion
all counties program starts july, august, sept. program starts april, may, june
Program starts at end of fiscal year
Program starts at beginning of fiscal year

33
Figure 5: Effects of FSP Implementation on Low Birth Weight Results for Event Study Analysis
(a) Blacks
(b) Whites Notes: Each figure plots coefficients from an event-study analysis. Coefficients are defined as quarters relative to the quarter the Food Stamp Program is implemented in the county. The sample is a balanced county sample, where a county is included only if there are 6 quarters of pre- and 8 quarters of post- implementation data. The specification includes controls for county, county * linear time, quarter, 1960 county controls interacted with time, county per capita transfers and county real per capita income. The “diff-in-diff treatment effect” is comparable to the results presented in Table 1. We present them here because the samples used for the event study differ from the main results.
-0.014
-0.012
-0.010
-0.008
-0.006
-0.004
-0.002
0.000
-6 -4 -2 0 2 4 6 8
event time in quarters
Diff-Diff treatment effect= -0.002Number of obs=11,873
-0.0025
-0.0020
-0.0015
-0.0010
-0.0005
0.0000
0.0005
0.0010
-6 -4 -2 0 2 4 6 8
event time in quarters
Diff-Diff treatment effect= -0.0004Number of obs=49,163

34
Table 1: Impacts of Food Stamp Introduction on Birth Outcomes, by Race
Birthweight (in grams) Fraction < 2,500 grams(1) (2) (3) (4) (5) (6) (7) (8)
A. WHITESAve FSP (0/1) 2.039 2.635 2.089 2.175 -0.0006 -0.0006 -0.0006 -0.0006
(0.947)* (0.896)** (1.039)* (0.975)** (0.0003)* (0.0003)* (0.0003)* (0.0004)% Impact (coef/mean) 0.06% 0.08% 0.06% 0.06% -1.02% -1.02% -0.97% -0.97%Estimate inflated 15.68 20.27 16.07 16.73 -0.0047 -0.0047 -0.0045 -0.0045% Impact inflated 0.47% 0.61% 0.48% 0.50% -7.82% -7.82% -7.44% -7.44%
Observations 97785 97785 97785 97785 97785 97785 97785 97785R-squared 0.54 0.55 0.55 0.56 0.17 0.17 0.18 0.19mean of dependent variable 3350 3350 3350 3350 0.06 0.06 0.06 0.06
B. BLACKSAve FSP (0/1) 3.454 4.120 5.466 1.665 -0.0015 -0.0016 -0.0019 -0.0009
(2.660) (2.317) (2.579)* (2.330) (0.0010) (0.0010) (0.0012) (0.0012)% Impact (coef/mean) 0.11% 0.13% 0.18% 0.05% -1.13% -1.22% -1.49% -0.68%Estimate inflated 26.57 31.69 42.05 12.80 -0.0113 -0.0122 -0.0149 -0.0068% Impact inflated 0.86% 1.02% 1.36% 0.41% -8.70% -9.41% -11.48% -5.21%
Observations 27374 27374 27374 27374 27374 27374 27374 27374R-squared 0.32 0.33 0.34 0.35 0.15 0.15 0.17 0.18mean of dependent variable 3097 3097 3097 3097 0.13 0.13 0.13 0.13
1960 CCDB * linear time x x x x x xREIS controls x x x x x x x xcty per cap real income x x x x x x x xyr x qtr fixed effects x x x x x x x xcounty fixed effects x x x x x x x xstate * linear time x xstate * year fixed effects x xcounty * linear time x x
Notes: Each parameter is from a separate regression of the outcome variable on the Food Stamp implementation dummy. The treatment is assigned as of 3 months prior to birth (proxy for beginning of the 3rd trimester). The estimation sample includes means by race-county-quarter for years including 1968-1977 where cells with less than 25 births are dropped. In addition to the fixed effects, controls include 1960 county variables (log of population, percent of land in farming, percent of population black, urban, age<5, age>65 and with income less than $3,000) each interacted with a linear time trend, per capita county transfer income (public assistance, medical care, and retirement and disability benefits), and county real per capita income. Estimates are weighted using the number of births in the cell and are clustered on county. Standard errors are in parentheses. Inflated impacts divide the parameter estimate by an estimate of the food stamp participation rate for the regression sample.

35
Table 2: Impact of FSP Introduction on Infant Outcomes, by Quartiles of 1970 Poverty Rates
Birth weight (1)
LBW(2)
Birth weight(3)
LBW(4)
POOLED WHITES & BLACKSAve FSP (0/1) 1.871 -0.001 3.409* -0.0012*
(2.013) (0.001) (1.750) (0.0006)% Impact (coef/mean) 0.06% -1.23% 0.10% -1.50%
Observations 8339 8339 56055 56055R-squared 0.78 0.38 0.56 0.26mean of dependant variable 3333 0.07 3303 0.08Subsample Population 0.23 0.23 0.26 0.26
1960 CCDB * linear time x x x xREIS controls x x x xcty per cap real income x x x xyr x qtr fixed effects x x x xcounty fixed effects x x x xstate * year fixed effects x x x x
Low Poverty Counties (lowest quartile)
High Poverty Counties (highest quartile)
Notes: Each parameter is from a separate regression of the outcome variable on the Food Stamp implementation dummy. The treatment is assigned as of 3 months prior to birth. The estimation sample includes means by county-quarter for years including 1968-1977 where cells with less than 25 births are dropped. Controls include county, year * quarter and state * year fixed effects, 1960 county variables (log of population, percent of land in farming, percent of population black, urban, age<5, age>65 and with income less than $3,000) each interacted with a linear time trend, per capita county transfer income (public assistance, medical care, and retirement and disability benefits), and county real per capita income. Estimates are weighted using the number of births in the cell and are clustered on county. Standard errors are in parentheses. Inflated impacts divide the parameter estimate by an estimate of the food stamp participation rate for the regression sample. Quartiles are assigned using 1970 county poverty rates (weighted using county population).

36
Table 3: Impacts of FSP Introduction on Birth Outcomes, by Geography
Birthweight LBW Birthweight LBW Birthweight LBW Birthweight LBW(1) (2) (3) (4) (5) (6) (7) (8)
A. WHITESAve FSP (0/1) 2.403 -0.0011 1.771 -0.0003 2.364 -0.0008 0.508 -0.0002
(1.612) (0.0005)** (1.322) (0.0004) (1.247)* (0.0004)** (1.615) (0.0006)% Impact (coef/mean) 0.07% -1.57% 0.05% -0.48% 0.07% -1.13% 0.02% -0.25%
Observations 44194 44194 53591 53591 32282 32282 65503 65503Subsample Population 0.29 0.29 0.69 0.69 0.73 0.73 0.25 0.25
B. BLACKSAve FSP (0/1) 3.527 -0.0023 7.003 -0.0009 8.371 -0.0034 -0.745 0.0023
(3.134) (0.0014)* (3.992)* (0.0022) (2.846)** (0.0013)** (5.219) (0.0023)% Impact (coef/mean) 0.11% -1.76% 0.23% -0.69% 0.27% -2.59% -0.02% 1.74%
Observations 20837 20837 6537 6537 13090 13090 14284 14284Subsample Population 0.49 0.49 0.45 0.45 0.77 0.77 0.17 0.17
1960 CCDB * linear time x x x x x x x xREIS controls x x x x x x x xcty per cap real income x x x x x x x xyr x qtr fixed effects x x x x x x x xcounty fixed effects x x x x x x x xstate * year fixed effects x x x x x x x x
SOUTH NONSOUTH URBAN COUNTIES NONURBAN COUNTIES
Notes: Each parameter is from a separate regression of the outcome variable on the Food Stamp implementation dummy. The treatment is assigned as of the 3 months prior to birth. The estimation sample includes means by county-quarter for years including 1968-1977 where cells with less than 25 births are dropped. Controls include county, year * quarter and state * year fixed effects, 1960 county variables (log of population, percent of land in farming, percent of population black, urban, age<5, age>65 and with income less than $3,000) each interacted with a linear time trend, per capita county transfer income (public assistance, medical care, and retirement and disability benefits), and county real per capita income. Estimates are weighted using the number of births in the cell and are clustered on county. Standard errors are in parentheses. Inflated impacts divide the parameter estimate by an estimate of the food stamp participation rate for the regression sample. Subsample population reports the percent of total births that are included in the regression. Urban counties are defined as those with greater than 50 percent of the 1960 population lives in an urban area.

37
Table 4: Sensitivity to Changing Timing of Policy Introduction
Birthweight (in grams)
MAIN POLICY EFFECT:FSP-beg of
3rd trimesterFSP-beg of
2nd trimesterFSP-beg of 1st trimester
FSP-beg of 3rd trimester
FSP-beg of 3rd trimester
SECOND POLICY EFFECT: -- -- --FSP-beg of 2nd
trimesterFSP-beg of 1st trimester
(1) (2) (3) (4) (5)
A. WHITES 2.085 1.696 1.288 2.556 2.434Ave FSP (0/1) (1.020)** (1.024)* (0.993) (1.640) (1.268)*
Ave FSP (0/1) -- -- -- -0.533 -0.454SECOND POLICY VAR (1.650) (1.232)
Observations 97785 97785 97785 97785 97785R-squared 0.55 0.55 0.55 0.55 0.55mean of dependent variable 3350 3350 3350 3350 3350
B. BLACKS 5.447 4.704 2.071 5.334 8.108Ave FSP (0/1) (2.532)** (2.464)* (2.396) (4.596) (3.444)**
Ave FSP (0/1) -- -- -- 0.130 -3.515SECOND POLICY VAR (4.450) (3.268)
Observations 27374 27374 27374 27374 27374R-squared 0.34 0.34 0.34 0.34 0.34mean of dependent variable 3097 3097 3097 3097 3097
1960 CCDB * linear time x x x x xREIS controls x x x x xcty per cap real income x x x x xyr x qtr fixed effects x x x x xcounty fixed effects x x x x xstate * year fixed effects x x x x x
Notes: Each parameter is from a separate regression of the outcome variable on the Food Stamp implementation dummy. The specifications vary by changing the timing of food stamp implementation. Base case is in column 1 where the timing is as of three months prior to the birth (to proxy for beginning of the 3rd trimester). The alternative specifications include timing as of 6 months (2nd trimester) or 9 months (1st trimester) prior to birth. In specifications (4) we estimate jointly the treatment effects at the 3rd and 2nd trimesters and in (5) we estimate jointly the impacts measured at the 3rd and 1st trimester. All of the other control variables and sample definitions are described in the notes to table 1.
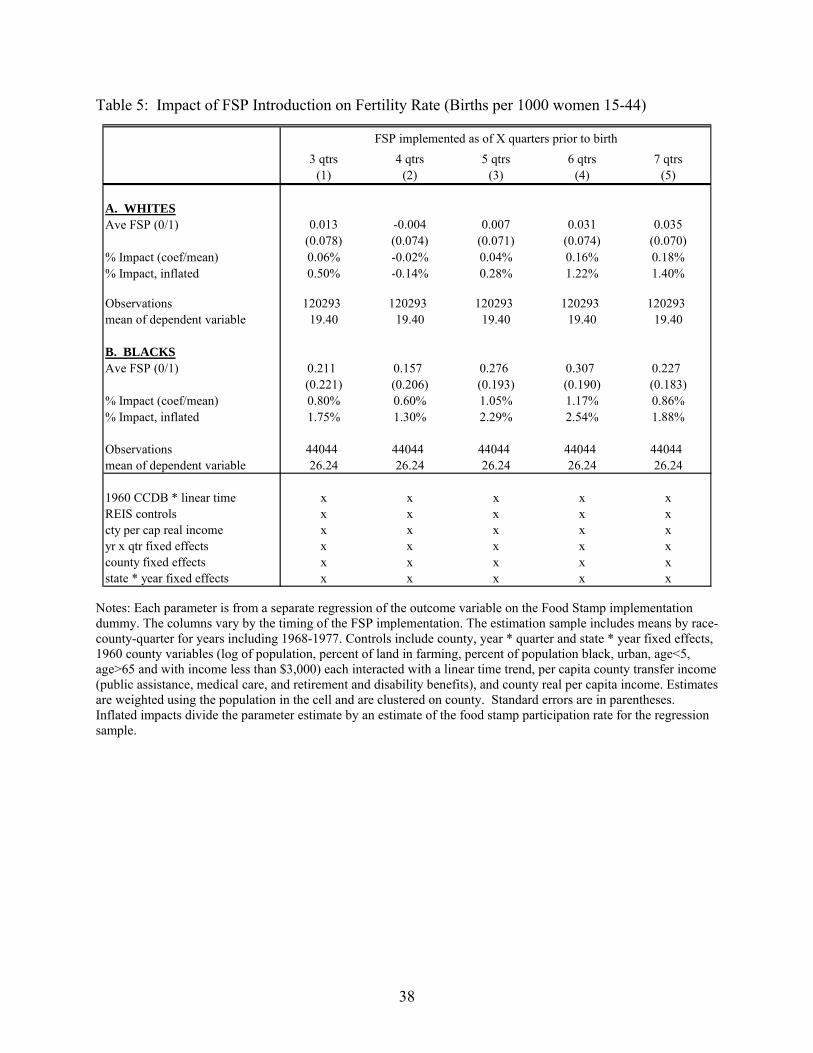
38
Table 5: Impact of FSP Introduction on Fertility Rate (Births per 1000 women 15-44)
3 qtrs 4 qtrs 5 qtrs 6 qtrs 7 qtrs(1) (2) (3) (4) (5)
A. WHITESAve FSP (0/1) 0.013 -0.004 0.007 0.031 0.035
(0.078) (0.074) (0.071) (0.074) (0.070)% Impact (coef/mean) 0.06% -0.02% 0.04% 0.16% 0.18%% Impact, inflated 0.50% -0.14% 0.28% 1.22% 1.40%
Observations 120293 120293 120293 120293 120293mean of dependent variable 19.40 19.40 19.40 19.40 19.40
B. BLACKSAve FSP (0/1) 0.211 0.157 0.276 0.307 0.227
(0.221) (0.206) (0.193) (0.190) (0.183)% Impact (coef/mean) 0.80% 0.60% 1.05% 1.17% 0.86%% Impact, inflated 1.75% 1.30% 2.29% 2.54% 1.88%
Observations 44044 44044 44044 44044 44044mean of dependent variable 26.24 26.24 26.24 26.24 26.24
1960 CCDB * linear time x x x x xREIS controls x x x x xcty per cap real income x x x x xyr x qtr fixed effects x x x x xcounty fixed effects x x x x xstate * year fixed effects x x x x x
FSP implemented as of X quarters prior to birth
Notes: Each parameter is from a separate regression of the outcome variable on the Food Stamp implementation dummy. The columns vary by the timing of the FSP implementation. The estimation sample includes means by race-county-quarter for years including 1968-1977. Controls include county, year * quarter and state * year fixed effects, 1960 county variables (log of population, percent of land in farming, percent of population black, urban, age<5, age>65 and with income less than $3,000) each interacted with a linear time trend, per capita county transfer income (public assistance, medical care, and retirement and disability benefits), and county real per capita income. Estimates are weighted using the population in the cell and are clustered on county. Standard errors are in parentheses. Inflated impacts divide the parameter estimate by an estimate of the food stamp participation rate for the regression sample.

39
Table 6: Impact of FSP on Neonatal Infant Mortality Rate (Deaths per 1000 live births)
(1) (2) (3) (4) (5) (6) (7) (8) (9)
A. WHITESAve FSP (0/1) -0.0625 -0.0158 -0.0806 -0.0492 -0.0784 -0.0376 -0.0133 0.0626 -0.0430
(0.1050) (0.1194) (0.1242) (0.0771) (0.0839) (0.0913) (0.0834) (0.0936) (0.0960)% Impact (coef / mean) -0.52% -0.13% -0.67% -0.79% -1.25% -0.60% -0.23% 1.09% -0.75%% Impact, inflated -4.01% -1.01% -5.17% -6.04% -9.63% -4.62% -1.79% 8.39% -5.76%
Observations 73,577 73,577 73,676 73,577 73,577 73,676 73,577 73,577 73,676R-squared 0.16 0.16 0.18 0.10 0.11 0.13 0.12 0.12 0.15mean of dependent variable 12.00 12.00 12.00 6.26 6.26 6.26 5.74 5.74 5.74
B. BLACKSAve FSP (0/1) -0.3898 -0.0067 -0.6551 -0.4128 -0.3098 -0.4233 0.0231 0.3032 -0.2317
(0.4095) (0.4610) (0.4793) (0.2865) (0.2953) (0.3334) (0.2729) (0.3348) (0.2977)% Impact (coef / mean) -2.06% -0.04% -3.46% -4.58% -3.43% -4.69% 0.23% 3.06% -2.34%% Impact, inflated -4.47% -0.08% -7.52% -9.95% -7.47% -10.20% 0.51% 6.65% -5.08%
Observations 17,655 17,655 17,695 17,655 17,655 17,695 17,655 17,655 17,695R-squared 0.42 0.44 0.43 0.34 0.36 0.36 0.26 0.29 0.28mean of dependent variable 18.94 18.94 18.94 9.02 9.02 9.02 9.91 9.91 9.91
1960 CCDB * linear time x x x x x xREIS controls x x x x x x x x xcty per cap real income x x x x x x x x xyr x qtr fixed effects x x x x x x x x xcounty fixed effects x x x x x x x x xstate * linear time x x xstate * year fixed effects x x xcounty * linear time x x x
All Deaths Deaths linked to nutrition Other Deaths
Notes: Each parameter is from a separate regression of the neonatal infant mortality rate (deaths in first 28 days per 1000 live births) on the FS implementation. The treatment is assigned as of 3 months prior to birth (proxy for beginning of the 3rd trimester). The sample includes means by race-county-quarter for years including 1968-1977 where cells with less than 50 births are dropped. In addition to the fixed effects, controls include 1960 county variables (log of population, percent of land in farming, percent of population black, urban, age<5, age>65 and with income less than $3,000) each interacted with a linear time trend, per capita county transfer income (public assistance, medical care, and retirement and disability benefits), and county real per capita income. Estimates are weighted using the number of births in the cell and are clustered on county. Standard errors are in parentheses. Inflated impacts divide the parameter estimate by an estimate of the food stamp participation rate for the regression sample.