insight through customer satisfaction surveys the difference of one more question walt pozgay, cgb
TRANSCRIPT
Insight Through Customer Satisfaction
Surveys
The Difference of One More Question
Walt Pozgay, CGB
Why Use Surveys?
Customer Satisfaction
Market Research
Continuous Improvement
Warranty Analysis
Curiosity
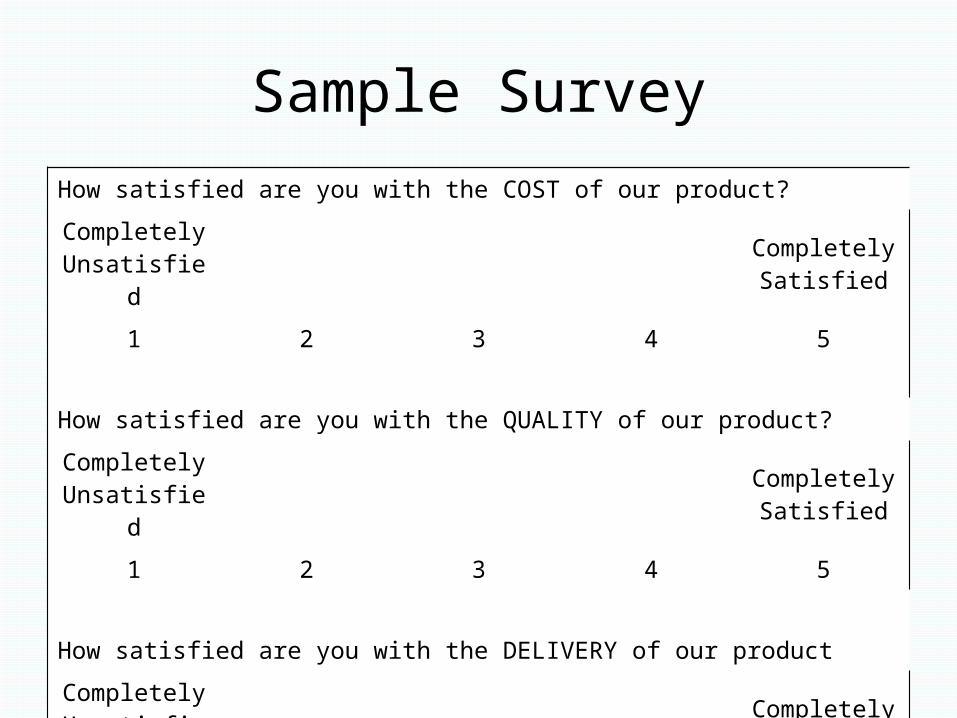
Sample Survey
How satisfied are you with the COST of our product?
Completely Unsatisfied
Completely Satisfied
1 2 3 4 5
How satisfied are you with the QUALITY of our product?
Completely Unsatisfied
Completely Satisfied
1 2 3 4 5
How satisfied are you with the DELIVERY of our product
Completely Unsatisfied
Completely Satisfied
1 2 3 4 5
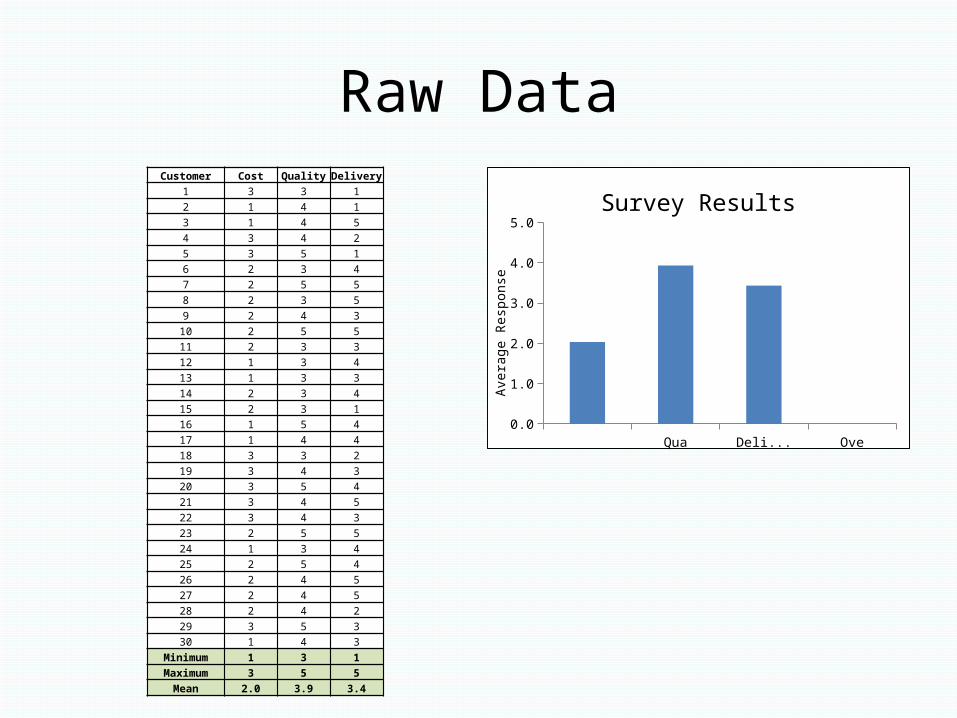
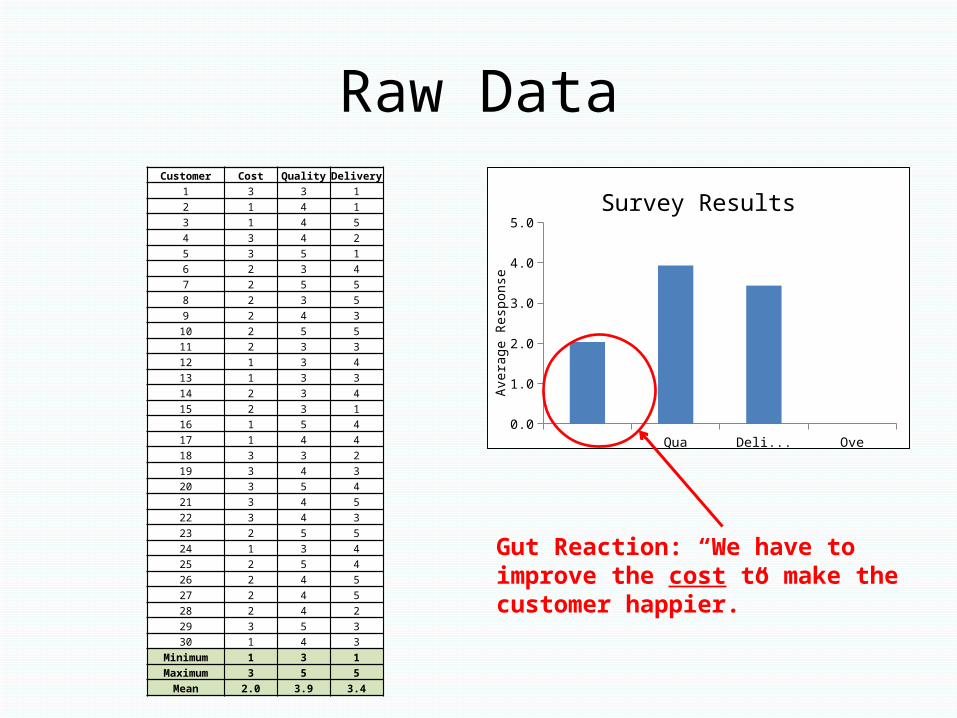
Raw DataCustomer Cost Quality Delivery
1 3 3 12 1 4 13 1 4 54 3 4 25 3 5 16 2 3 47 2 5 58 2 3 59 2 4 310 2 5 511 2 3 312 1 3 413 1 3 314 2 3 415 2 3 116 1 5 417 1 4 418 3 3 219 3 4 320 3 5 421 3 4 522 3 4 323 2 5 524 1 3 425 2 5 426 2 4 527 2 4 528 2 4 229 3 5 330 1 4 3
Minimum 1 3 1Maximum 3 5 5Mean 2.0 3.9 3.4
Cost Quality Delivery Overall0.0
1.0
2.0
3.0
4.0
5.0
Survey Results
Ave
rage
Res
pons
e
Gut Reaction: “We have to improve the cost to make the customer happier.”

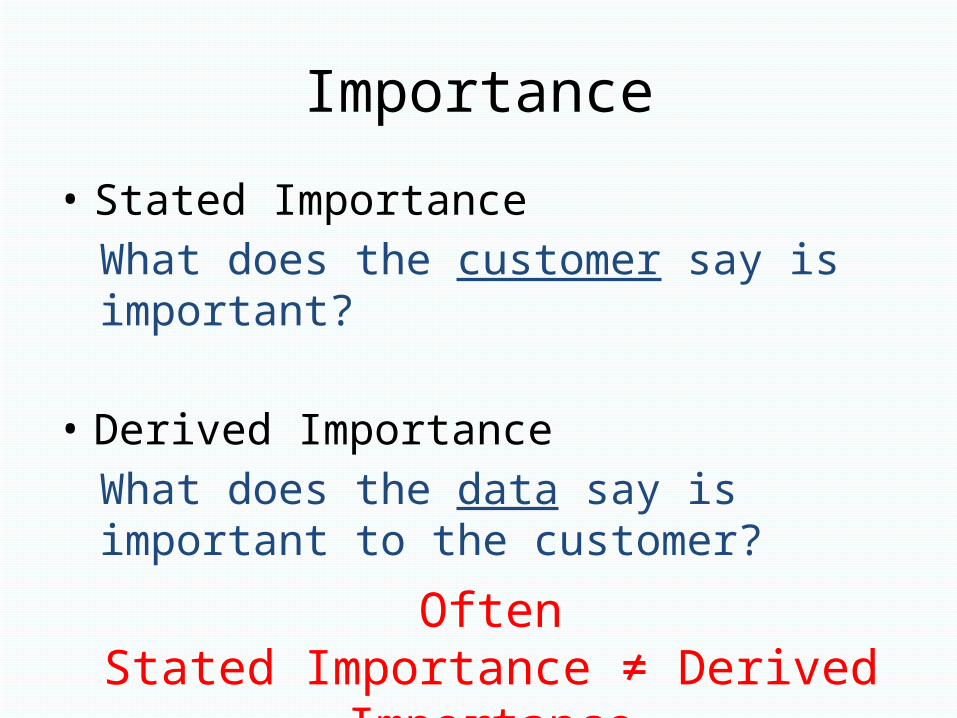
Importance
• Stated Importance
• Derived Importance

Importance
• Stated Importance
What does the customer say is important?
• Derived Importance

Importance
• Stated Importance
What does the customer say is important?
• Derived Importance
What does the data say is important to the customer?
Importance
• Stated Importance
What does the customer say is important?
• Derived Importance
What does the data say is important to the customer?
OftenStated Importance ≠ Derived Importance

Raw DataCustomer Cost Quality Delivery
1 3 3 12 1 4 13 1 4 54 3 4 25 3 5 16 2 3 47 2 5 58 2 3 59 2 4 310 2 5 511 2 3 312 1 3 413 1 3 314 2 3 415 2 3 116 1 5 417 1 4 418 3 3 219 3 4 320 3 5 421 3 4 522 3 4 323 2 5 524 1 3 425 2 5 426 2 4 527 2 4 528 2 4 229 3 5 330 1 4 3
Minimum 1 3 1Maximum 3 5 5Mean 2.0 3.9 3.4
Cost Quality Delivery Overall0.0
1.0
2.0
3.0
4.0
5.0
Survey Results
Ave
rage
Res
pons
e3 = Neutral. The farther we get from neutral, the greater the stated importance.
The data reinforces the Gut Reaction!

Deriving Importance
By asking one more question, we gain new insight into what matters
to the customer.
Deriving Importance
By asking one more question, we gain new insight into what matters
to the customer.
“Overall, how satisfied are you with our company’s performance.”

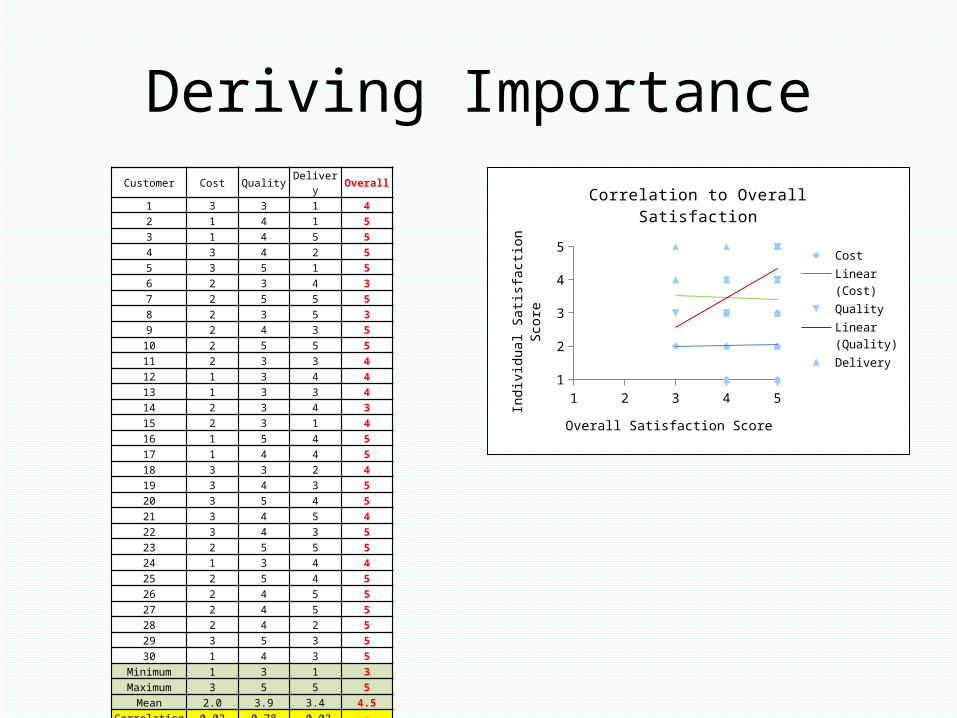
Deriving ImportanceCustomer Cost Quality Delivery Overall
1 3 3 1 42 1 4 1 53 1 4 5 54 3 4 2 55 3 5 1 56 2 3 4 37 2 5 5 58 2 3 5 39 2 4 3 510 2 5 5 511 2 3 3 412 1 3 4 413 1 3 3 414 2 3 4 315 2 3 1 416 1 5 4 517 1 4 4 518 3 3 2 419 3 4 3 520 3 5 4 521 3 4 5 422 3 4 3 523 2 5 5 524 1 3 4 425 2 5 4 526 2 4 5 527 2 4 5 528 2 4 2 529 3 5 3 530 1 4 3 5
Minimum 1 3 1 3Maximum 3 5 5 5
Mean 2.0 3.9 3.4 4.5
Cost Quality Delivery Overall0.0
1.0
2.0
3.0
4.0
5.0
Survey Results
Ave
rage
Res
pons
e

Deriving Importance
Cost Quality Delivery Overall0.0
1.0
2.0
3.0
4.0
5.0
Survey Results
Ave
rage
Res
pons
e
Customer Cost Quality Delivery Overall1 3 3 1 42 1 4 1 53 1 4 5 54 3 4 2 55 3 5 1 56 2 3 4 37 2 5 5 58 2 3 5 39 2 4 3 510 2 5 5 511 2 3 3 412 1 3 4 413 1 3 3 414 2 3 4 315 2 3 1 416 1 5 4 517 1 4 4 518 3 3 2 419 3 4 3 520 3 5 4 521 3 4 5 422 3 4 3 523 2 5 5 524 1 3 4 425 2 5 4 526 2 4 5 527 2 4 5 528 2 4 2 529 3 5 3 530 1 4 3 5
Minimum 1 3 1 3Maximum 3 5 5 5
Mean 2.0 3.9 3.4 4.5Correlation 0.03 0.78 -0.03 ̶'
Deriving ImportanceCustomer Cost Quality Delivery Overall
1 3 3 1 42 1 4 1 53 1 4 5 54 3 4 2 55 3 5 1 56 2 3 4 37 2 5 5 58 2 3 5 39 2 4 3 510 2 5 5 511 2 3 3 412 1 3 4 413 1 3 3 414 2 3 4 315 2 3 1 416 1 5 4 517 1 4 4 518 3 3 2 419 3 4 3 520 3 5 4 521 3 4 5 422 3 4 3 523 2 5 5 524 1 3 4 425 2 5 4 526 2 4 5 527 2 4 5 528 2 4 2 529 3 5 3 530 1 4 3 5
Minimum 1 3 1 3Maximum 3 5 5 5
Mean 2.0 3.9 3.4 4.5Correlation 0.03 0.78 -0.03 ̶'
1 2 3 4 51
2
3
4
5
Correlation to Overall Satisfaction
CostLinear (Cost)QualityLinear (Qual-ity)DeliveryLinear (De-livery)
Overall Satisfaction Score
Indi
vidu
al S
atis
fact
ion
Sco
re
Rules of Thumb
r-Value Correlation
|r| ≤ 0.2 Insignificant
0.2 < |r| ≤ 0.4 Weak
0.4 < |r |≤ 0.6 Moderate
0.6 < |r |≤ 0.8 Strong
0.8 < |r| ≤ 1.0 Very Strong

Deriving ImportanceCustomer Cost Quality Delivery Overall
1 3 3 1 42 1 4 1 53 1 4 5 54 3 4 2 55 3 5 1 56 2 3 4 37 2 5 5 58 2 3 5 39 2 4 3 510 2 5 5 511 2 3 3 412 1 3 4 413 1 3 3 414 2 3 4 315 2 3 1 416 1 5 4 517 1 4 4 518 3 3 2 419 3 4 3 520 3 5 4 521 3 4 5 422 3 4 3 523 2 5 5 524 1 3 4 425 2 5 4 526 2 4 5 527 2 4 5 528 2 4 2 529 3 5 3 530 1 4 3 5
Minimum 1 3 1 3Maximum 3 5 5 5
Mean 2.0 3.9 3.4 4.5Correlation 0.03 0.78 -0.03 ̶'
1 2 3 4 51
2
3
4
5
Correlation to Overall Satisfaction
CostLinear (Cost)QualityLinear (Qual-ity)DeliveryLinear (De-livery)
Overall Satisfaction Score
Indi
vidu
al S
atis
fact
ion
Sco
re
Rules of Thumb
r-Value Correlation Survey
|r| ≤ 0.2 Insignificant Cost, Delivery
0.2 < |r| ≤ 0.4 Weak
0.4 < |r |≤ 0.6 Moderate
0.6 < |r |≤ 0.8 Strong Quality
0.8 < |r| ≤ 1.0 Very Strong
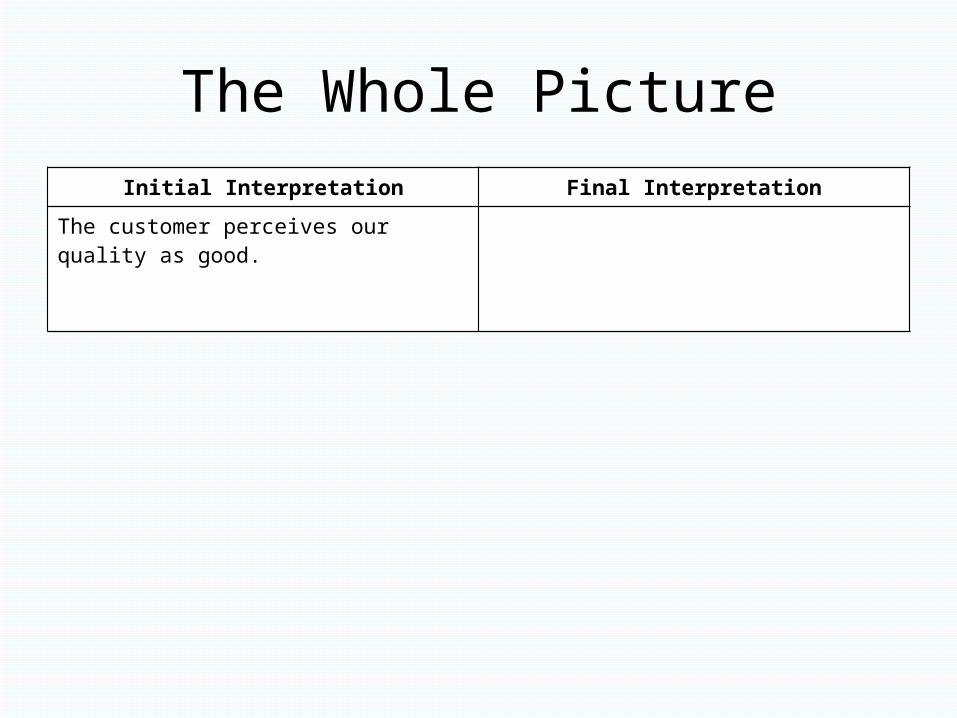
The Whole Picture
Initial Interpretation Final Interpretation
The customer perceives our quality as good.
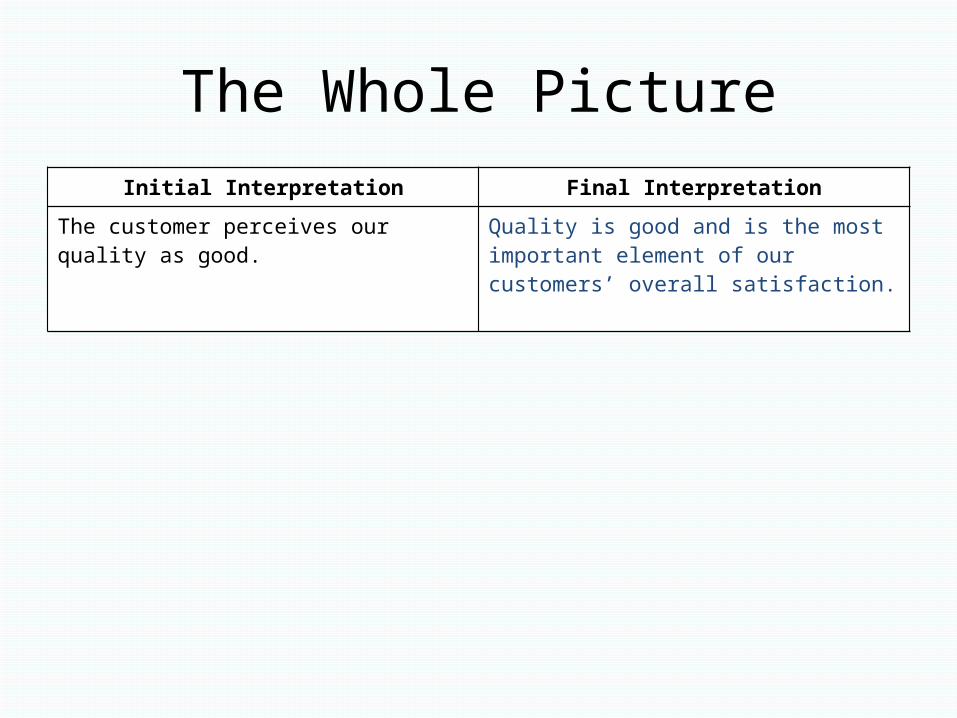
The Whole Picture
Initial Interpretation Final Interpretation
The customer perceives our quality as good.
Quality is good and is the most important element of our customers’ overall satisfaction.

The Whole Picture
Initial Interpretation Final Interpretation
The customer perceives our quality as good.
Quality is good and is the most important element of our customers’ overall satisfaction.
The customer perceives our delivery as OK.

The Whole Picture
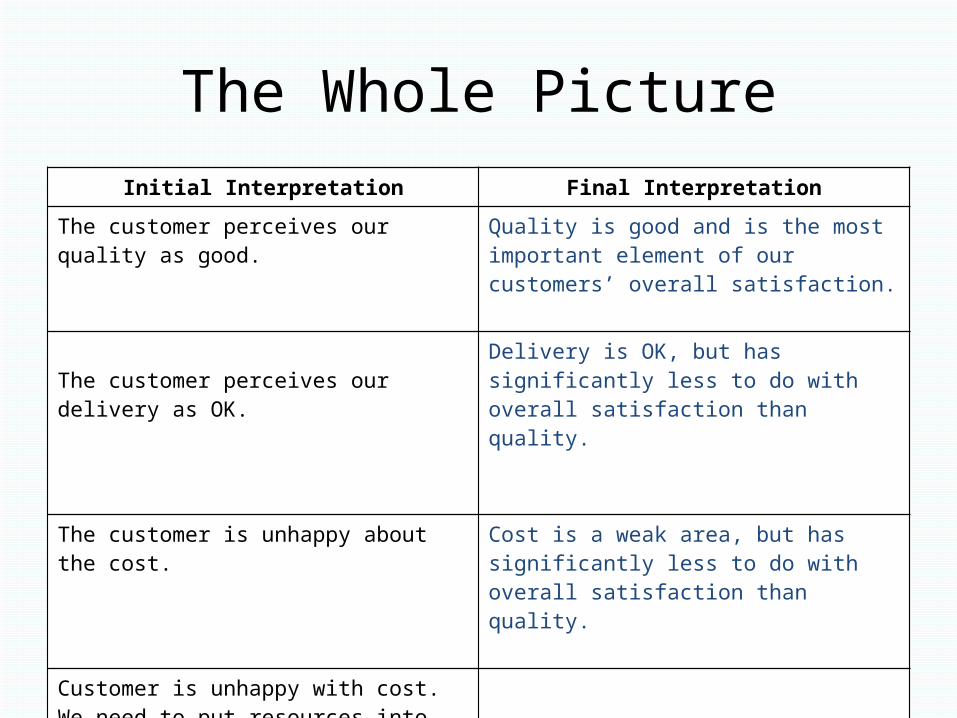
Initial Interpretation Final Interpretation
The customer perceives our quality as good.
Quality is good and is the most important element of our customers’ overall satisfaction.
The customer perceives our delivery as OK.
Delivery is OK, but has significantly less to do with overall satisfaction than quality.

The Whole Picture
Initial Interpretation Final Interpretation
The customer perceives our quality as good.
Quality is good and is the most important element of our customers’ overall satisfaction.
The customer perceives our delivery as OK.
Delivery is OK, but has significantly less to do with overall satisfaction than quality.
The customer is unhappy about the cost.

The Whole Picture
Initial Interpretation Final Interpretation
The customer perceives our quality as good.
Quality is good and is the most important element of our customers’ overall satisfaction.
The customer perceives our delivery as OK.
Delivery is OK, but has significantly less to do with overall satisfaction than quality.
The customer is unhappy about the cost. Cost is a weak area, but has significantly less to do with overall satisfaction than quality.
Customer is unhappy with cost.We need to put resources into improving cost to satisfy the customer.
Customer satisfaction is highly dependent on quality. Resources should be allocated to improving cost and delivery, but not at the expense of quality.
Conclusion
• Summarizing questions can be used to identify what is important within an element.

Conclusion
• Summarizing questions can be used to identify what is important within an element.
• Culminating questions can be used to identify which element is more important.

Conclusion
• Summarizing questions can be used to identify what is important within an element.
• Culminating questions can be used to identify which element is more important.
• Find out what really matters to maximize BOTH customer satisfaction and expenditure of precious resources.

Questions?