insights from inside the volcano: genesis and …
TRANSCRIPT

The Pennsylvania State University
The Graduate School
Department of Geosciences
INSIGHTS FROM INSIDE THE VOLCANO: GENESIS AND ERUPTION OF
THRÍHNÚKAGÍGUR VOLCANICS, REYKJANES PENINSULA, ICELAND
A Thesis in
Geosciences
by
Michael R. Hudak
2016 Michael R. Hudak
Submitted in Partial Fulfillment
of the Requirements
for the Degree of
Master of Science
May 2016

The thesis of Michael R. Hudak was reviewed and approved* by the following:
Maureen D. Feineman
Assistant Professor of Geosciences
Thesis Co-Advisor
Peter C. LaFemina
Professor of Geosciences
Thesis Co-Advisor
Tanya Furman
Professor of Geosciences
Associate Vice President and Associate Dean for Undergraduate Education
Michael Arthur
Professor of Geosciences
Interim Head of Graduate Programs of the Geosciences Department
*Signatures are on file in the Graduate School

iii
ABSTRACT
Thríhnúkagígur is the main cone of a small 3500 ka fissure eruption in the
Brennisteinsfjöll fissure swarm on the Reykjanes Peninsula. Beneath the summit of the main cone
is a 120 m deep cave exposing a large part of the uppermost magmatic plumbing system and a
buried tephra cone. The exposure of this structure offers a unique view into a non-unique eruptive
process. Basaltic fissure eruptions are common in many tectonic and volcanic settings. Direct
observations in the cave in addition to major element, trace element and Sr-Nd-Pb isotope
analyses allow a fissure eruption on the Reykjanes Peninsula to be investigated from melt
generation in the mantle to eruption. Field relationships between the main dike that fed the
eruption and the unconsolidated buried tephra suggest that the tephra was entrained by the
erupting magma. Assuming the cave represents the volume of tephra entrained and removed from
the system, estimates of the erupted volume of lava produce maximum estimates of ~29% tephra
content in the lavas. Furthermore, the location of the buried tephra directly beneath the main cone
of Thríhnúkagígur suggest that the buried tephra acted as a local asperity in the crust forming a
preferential pathway for the magma to ascend to the surface. The main vents were developed here
because flow was focused by the buried tephra. However, the vertical sheet-like structure of the
dike indicates that the far field stresses dictate the orientation of fissure despite the contrast in
competency between the buried tephra and overlying basaltic lava flow.
The Sr-Nd-Pb isotope systematics illustrate that Thríhnúkagígur lavas are consistent with
other relatively enriched compositions observed on the Reykjanes Peninsula, with radiogenic Pb
and Sr, and relatively unradiogenic Nd. These isotopes suggest that Thríhnúkagígur magmas are
derived from two main components – an enriched plume source and a depleted mantle source –
with possible minor contributions from an EM1-like mantle source. Anomalously high ratios of
Nb/U at Thríhnúkagígur suggest that despite isotopic similarities between the Reykjanes
Peninsula and the Eastern Volcanic Zone (EVZ), the enriched plume source at the Reykjanes is
unique from the EVZ in its enriched Nb. Decoupling of the Sr isotopes from Pb and Nd isotopes
suggests that the source of radiogenic Sr at Thríhnúkagígur may be assimilation of basaltic crust
that has been hydrothermally altered by seawater. The tephra entrainment hypothesis is tested
with immobile trace element mixing models. Models of La/Yb vs. Nb/Zr yield maximum
estimate 28-35% of the tephra component in the lavas, consistent with results from the
geophysical analysis. However, large uncertainty in the initial magma composition limits the
precision of this model and some samples may not contain any entrained tephra. Finally, the
variability in the major and trace element geochemistry and the Sr isotopes, particularly in the
uppermost magmatic plumbing system, suggest that the small volume of erupted magma was not
homogenized prior to eruption. In the absence of a central volcano at Brennisteinsfjöll, we invoke
a network of dikes and sills that are quasi-isolated until the eruption, allowing for variable
geochemical evolution. This model both preserves magma heterogeneity from the mantle and
facilitates the evolution of magmas with variable compositions, consistent with the variation in
geochemistry observed at multiple levels in this single eruption.

iv
TABLE OF CONTENTS
List of Figures .......................................................................................................................... vi
List of Tables ........................................................................................................................... viii
Acknowledgements .................................................................................................................. ix
Chapter 1 Geologic Overview ................................................................................................. 1
1.1 Introduction ................................................................................................................ 1 1.2 Regional tectonic setting ............................................................................................ 3
1.2.1 The Mid-Atlantic Ridge and the Icelandic plume ........................................... 3 1.2.2 Neovolcanic zones ........................................................................................... 4 1.2.3 Deglaciation and volcanism ............................................................................ 6
1.3 Regional geochemical overview ................................................................................ 7 1.4. The Reykjanes Peninsula and the Brennisteinsfjöll volcanic system ........................ 11
1.4.1 Reykjanes Peninsula tectonics and volcanism ................................................ 11 1.4.2 Reykjanes Peninsula lava chemistry ............................................................... 13
References ........................................................................................................................ 21
Chapter 2 Inside the Volcano: Rapid entrainment of unconsolidated crust during a
monogenetic fissure eruption ........................................................................................... 26
2.1 Introduction ................................................................................................................ 26 2.2 Field descriptions ....................................................................................................... 27
2.2.1 Surface geology ............................................................................................... 27 2.2.2 Subsurface Geology ........................................................................................ 29
2.3 Methods ...................................................................................................................... 34 2.3.1 Light Detection and Ranging (LiDAR) ........................................................... 34 2.3.2 Density Measurements .................................................................................... 35
2.4 Results ........................................................................................................................ 35 2.5 Discussion .................................................................................................................. 36
2.5.1 Cave formation ................................................................................................ 36 2.6 Conclusions ................................................................................................................ 39 References ........................................................................................................................ 58
Chapter 3 Magma genesis at Thríhnúkagígur, Reykjanes Peninsula, Iceland: Implications
for magmatic plumbing structure at monogenetic volcanic fields ................................... 60
3.1 Introduction ................................................................................................................ 60 3.2 Sample descriptions ................................................................................................... 61
3.2.1 Surface lavas ................................................................................................... 62 3.2.2 Dikes ............................................................................................................... 62 3.2.3 Plugged conduit ............................................................................................... 63 3.2.4 Buried tephras ................................................................................................. 63
3.3 Methods ...................................................................................................................... 64

v
3.3.1 Point counting ................................................................................................. 64 3.3.2 Major element analytical methods .................................................................. 65 3.3.3 Trace element analytical methods ................................................................... 65 3.3.4 Pb, Sr, and Nd isotope analytical methods ...................................................... 67
3.4 Results ........................................................................................................................ 68 3.4.1 Major elements ................................................................................................ 68 3.4.2 Trace elements................................................................................................. 69 3.4.3 Pb, Sr, and Nd isotopes ................................................................................... 71
3.5 Discussion .................................................................................................................. 72 3.5.1 Source geochemistry ....................................................................................... 72 3.4.2 Magmatic processes ........................................................................................ 82 3.5.3 Brennisteinsfjöll plumbing system .................................................................. 89
3.6 Conclusions ................................................................................................................ 92 References ........................................................................................................................ 123 Appendix: Isotope geochemistry procedures ................................................................... 128

vi
LIST OF FIGURES
Figure 1.1. Map of Iceland and its neovolcanic zones. These zone trace the plate
boundary between North America (NA) and Eurasia (EU). KR = Kolbeinsey Ridge;
TFZ = Tjörnes Fracture Zone; NVZ = Northern Volcanic Zone; EVZ = Eastern
Volcanic Zone; MIB = Mid-Iceland Belt; WVZ = Western Volcanic Zone; RP =
Reykjanes Peninsula; RR = Reykjanes Ridge. Volcanic zones are composed of many
individual volcanic systems (Einarsson and Sæmundsson, 1987). Contours mark the
approximate depth to the Moho as determined by Darbyshire et al. (2000) and the
map is modified from Brounce et al. (2012). ................................................................... 16
Figure 1.2. Variations along the Mid-Atlantic Ridge in La/Sm and Nb/Zr. Values are <1
for La/Sm on the South Reykjanes Ridge (SRR) and the Kolbeinsey Ridge (KR) and
<0.05 for Nb/Zr. These ratios are greater than 1.5 and 0.08 for mainland Iceland (I).
The North Reykjanes Ridge (NRR) is transitional between ambient MORB
compositions and those in lavas derived from the Icelandic plume. Data from
(Hanan et al., 2000).. ........................................................................................................ 17
Figure 1.3. Map of the Reykjanes Peninsula showing the four fissure systems (shaded
grey). From east to west they are the Reykjanes, Krísuvík, Brennisteinsfjöll, and
Hengill volcanic systems. Thríhnúkagígur is located in Brennisteinsfjöll. Reykjavík
and Thríhnúkagígur are shown in black stars. Outlines of the volcanic systems are
from Einarsson & Sæmundsson (1987). .......................................................................... 18
Figure 1.4. Enriched historic Reykjanes Peninsula lavas plotted on Nb/Zr vs. 87Sr/86Sr
(a) and Nb/Zr vs. 143Nd/144Nd. Data from Peate et al. (2009) fall into “more
enriched” and “less enriched” categories. More enriched sample correlate with lavas
from Brennisteinsfjöll, while less enriched data are from the eastern Reykjanes
Peninsula fissure swarms of Reykjanes and Krísuvík (b). ............................................... 19
Figure 1.5. Changes in lava chemistry on the Reykjanes Peninsula through time from Gee
et al. (1998b). Plots of lava age vs. Mg# (a), 87Sr/86Sr (b), Nb/Zr (c), and 143Nd/144Nd
(d). The period during and immediately following deglaciation (13-9 ka) produced
more primitive, depleted magmas with higher Mg# and 87Sr/86Sr and lower Nb/Zr
ratios and 143Nd/144Nd....................................................................................................... 20
Figure 2.1. Map of the Thríhnukar fissure system modified from Sæmundsson (2006).
Samples are shown in black stars. Subterranean samples are excluded from this map,
but are generally located underneath the Thríhnúkagígur spatter cone in red. ................ 43
Figure 2.2. Two vents comprise the main cone of Thríhnúkagígur. The northern vent
(left) became plugged towards the end of the eruption, while the southern vent
(right, with scaffolding) remained open, providing an entrance to the cave below.
Photo from P. LaFemina. ................................................................................................. 44
Figure 2.3. Succession of thin (2-5 cm) lava flows back into the vent at the summit of
Thríhnúkagígur. Photo from P. LaFemina. ...................................................................... 45

vii
Figure 2.4. LiDAR scan of the interior of the cave at Thríhnúkagígur. Green and blue
coloring represents different reflectivities of the rock. The dike, plugged conduit,
and the buried tephra appear in blue. The image on the left is a view parallel to the
orientation of the dike. The view on the right is perpendicular to the orientation of
the dike. ............................................................................................................................ 46
Figure 2.5. Magma flowback rivulets on a fallen block in the cave. Photo from P.
LaFemina. ........................................................................................................................ 47
Figure 2.6. Stalactites of lava that dripped back into the cave during and/or following the
eruption. Photo from P. LaFemina. .................................................................................. 48
Figure 2.7. The NNE cave wall. A photo mosaic by P. LaFemina is simplified in a
cartoon depicting the dike and tephra with sample locations. .......................................... 49
Figure 2.8. Representative buried tephra (right; TNG-14-15) is poorly consolidated
compared to the well-welded hyaloclastite (left) collected at the from the gentle
dipping hyaloclastite unit postulated by Sæmundsson (2006). ........................................ 50
Figure 2.9. A panorama of the dike at the north end of the cave. Here it cross-cuts the
tephra apron and to the left interfingering between the buried tephra and subsequent
lava flows can be seen. Photo from P. LaFemina. ........................................................... 51
Figure 2.10. Photograph of the interior of the cave. The plugged conduit is the roundish
purple feature on the left. The dike is the vertical purple-black feature on the right.
The buried tephra cone on the bottom left if black. ......................................................... 52
Figure 2.11. A ~0.5 m long gas pocket in the center of the dike. ............................................ 53
Figure 2.12. LiDAR scan of the Thríhnúkagígur cone and cave with the location of the
largest of the proto-conduits indicated (a). A LiDAR scan of the main proto-conduit
shows its geometry in greater detail (b). .......................................................................... 54
Figure 2.13. Stages of Thríhnúkagígur formation starting with the formation (a) and
burial of the tephra cone (b), followed by dike injection (c) and eruption along a
fissure (d). As the eruption continues, the magma both progressively entrains more
tephra from depth and narrows from a fissure into a couple of vents (e anf f). Part g
shows the present day outline of the cave. The left hand side of the diagram shows a
cross-section within the plane of the dike. The left shows a cross-section
perpendicular to the dike. ................................................................................................. 55
Figure 3.1. Photomicrographs of two phenocryst population, a more tabular euhedral one
(a) and a high aspect ratio one (b) in lava TNG-14-14m; the phenocryst-poor chilled
margin (c; TNG-14-27e) and flow banding with interstitial clinopyroxene in the
interior the same dike (d; TNG-14-27i); aphanitic, phenocryst-poor plugged conduit,
TNG-14-18 (e); and large olivine phenocrysts from the Miðhnúkar lava flow, TNG-
14-35 (f). .......................................................................................................................... 106

viii
Figure 3.2. Total alkali-silica plot (TAS). All Thríhnúkagígur samples analyzed are
subalkaline basalts. Buried tephra samples are represented by triangle; lava and dike
samples from the Holocene eruption are circles; the lava sample from Miðhnúkar is
a cross. TAS diagram from Le Bas and Le Maitre (1986). .............................................. 107
Figure 3.3. Fenner diagrams of MgO vs. the major oxides and chemical index of
alteration (CIA). Circles represent lavas and dikes. Triangles represent buried tephra
samples. The cross is the Miðhnúkar lava. Open symbols indicate samples with a
high CIA samples likely to be affected by secondary alteration. ..................................... 108
Figure 3.4. Plots of MgO vs. trace elements and CaO/Al2O3. Circles represent lavas and
dikes while triangles represent buried tephra samples. The cross is the lava from
Miðhnúkar. Open symbols indicate samples with a high CIA and likely to be
affected by secondary alteration. ...................................................................................... 109
Figure 3.5. Primitive mantle normalized multielement diagram for the main sample suites
and unique samples from Thríhnúkagígur. All samples are characterized by small
positive Ba and U, and relatively large Nb and Ta anomalies. All samples have
moderate to large negative Pb anomalies, except for the vent spatter (MC-612-03),
which is thought to be a result of contamination. Most other trace elements display
similar patterns across regardless of sample type, except for Sr which has a positive
anomaly in relatively more depleted plugged conduit (TNG-14-18) and chilled
margin of the dike (TNG-14-27e) and a negative anomaly in the more enriched
buried tephra. Primitive mantle normalization values are from Sun and McDonough
(1989). .............................................................................................................................. 110
Figure 3.6. Chondrite normalized rare earth element (REE) spider diagram by rock type.
All samples have a gently sloping negative trend with higher LREE values than
HREE values. The chilled margin of the dike (TNG-14-27e) has a weak positive Eu
anomaly. Chondrite normalization values are from Sun and McDonough (1989). ......... 111
Figure 3.7. Plots of 206Pb/204Pb vs. 208Pb/204Pb (a) and 207Pb/204Pb (b). Circles represent
lavas and dikes while triangles represent buried tephra samples. The cross is the lava
from Miðhnúkar. Open symbols indicate samples with a high CIA. Error bars
represent either the in run instrumental error or the standard reproducibility,
whichever source of error is larger.. ................................................................................. 112
Figure 3.8. Plot of 87Sr/86Sr vs. 143Nd/144Nd. The buried tephras have consistently lower 143Nd/144Nd ratios compared to the lavas and dikes across the same range of 87Sr/86Sr
ratios. Three dike samples have the least radiogenic Sr isotope ratios at the same
relative radiogenic Nd isotope ratio. Circles represent lavas and dikes while triangles
represent buried tephra samples. The cross is the lava from Miðhnúkar. Open
symbols indicate samples with a high CIA. Error bars represent either the in run
instrumental error or the standard reproducibility, whichever source of error is
larger. ............................................................................................................................... 113
Figure 3.9. (La/Yb)N vs. Nb/Zr. Reykjanes Peninsula and the Western Volcanic Zone
lavas in SW Iceland extend to similarly high Nb/Zr ratios as lavas in the Eastern
Volcanic Zone, but at much lower (La/Yb)N ratios. Thríhnúkagígur lavas and dikes

ix
are consistent other lavas from SW Iceland while the buried tephra record some of
the most enriched values in the region. Circles represent lavas and dikes while
triangles represent buried tephra samples. The cross is the lava from Miðhnúkar.
Open symbols indicate samples with a high CIA. Data for Vestmannaeyjar are from
Furman et al. (1991), Kokfelt et al. (2006), and Peate et al. (2010); EVZ data are
from Kokfelt et al. (2006), Peate et al. (2010), and Manning and Thirlwall (2014);
WVZ data are from Kokfelt et al. (2006) and Koornneef et al. (2012); and data from
the Reykjanes Peninsula are from Kokfelt et al. (2006), Peate et al. (2009), and
Koornneef et al. (2012). ................................................................................................... 114
Figure 3.10. Plots of Nb vs. Nb/U (a) and Ce vs. Ce/Pb (b). Global ocean island basalts
and mid-ocean ridge basalts yield Nb/U ratios of 47 ± 10 at all concentrations of Nb
and Ce/Pb ratios of 25 ± 5 at all Ce concentrations (Hofmann et al., 1986). Dashed
lines show these ranges. Lavas in SW Iceland on the Reykjanes Peninsula and in the
WVZ yield much higher Nb/U and Ce/Pb than observed elsewhere, not just in
Iceland, but globally. Circles represent lavas and dikes while triangles represent
buried tephra samples. The cross is the lava from Miðhnúkar. Open symbols indicate
samples with a high CIA. Data for Vestmannaeyjar are from Kokfelt et al. (2006)
and Peate et al. (2010); EVZ data are from Sigmarsson et al. (1992), Kokfelt et al.
(2006), Peate et al. (2010), and Manning and Thirlwall (2014); WVZ and RP data
are from Kokfelt et al. (2006) and Koornneef et al. (2012). ............................................ 115
Figure 3.11. Plots of 206Pb/204Pb vs. 208Pb/204Pb with proposed mantle end members from
Thirlwall et al. (2004) and Kitagawa et al. (2008). South Iceland lavas form an array
primarily between an enriched and a depleted end member on both plots.
Thríhnúkagígur samples are broadly consistent with composition observed on the
Reykjanes Peninsula and Brennisteinsfjöll. They are pulled slightly off the NHRL
(Hart, 1984) towards an EM1-like end member. Data for the southern Reykjanes
Ridge (SRR) are from Thirlwall et al., 2004; Reykjanes, Krísuvík, and
Brennisteinsfjöll data are from Thirlwall et al., 2004, Kokfelt et al., 2006, and Peate
et al., 2009; Hekla and Katla data are from Park, 1990 and Furman et al., 1995;
Vestmannaeyjar data are from Furman et al., 1991, Chauvel and Hémond, 2000,
Kokfelt et al., 2006, and Peate et al., 2010. ...................................................................... 116
Figure 3.12. Nb/U plotted against 206Pb/204Pb (a), 208Pb/204Pb (b). Solid black triangles
represent Thríhnúkagígur buried tephra. Solid black circles represent
Thríhnúkagígur lavas and dikes. Grey circles represent other Reykjanes Peninsula
lavas from Kokfelt et al. (2006). ...................................................................................... 117
Figure 3.13. A plot of 87Sr/86Sr vs. 143Nd/144Nd. Thríhnúkagígur samples are more
consistent with the Reykjanes fissure swarm and Vestmannaeyjar than
Brennisteinsfjöll and are influenced by an EM1-like component, or more likely,
HAC. Sr-Nd isotopes, data for the southern Reykjanes Ridge (SRR) are from
Thirlwall et al., 2004; Reykjanes, Krísuvík, and Brennisteinsfjöll data are from
Thirlwall et al., 2004, Kokfelt et al., 2006, and Peate et al., 2009; Hekla data are
from Park, 1990, Sigmarsson et al., 1992, and Furman et al., 1995; Katla data are
from Park, 1990 and Furman et al., 1995; Vestmannaeyjar data are from Furman et
al., 1991 and Kokfelt et al., 2006. .................................................................................... 118

x
Figure 3.14. A plot of 206Pb/204Pb vs. 87Sr/86Sr. Thríhnúkagígur samples are most
consistent with the lavas with highly radiogenic Sr isotopes from the Reykjanes
fissure swarm. Data for the southern Reykjanes Ridge (SRR) are from Thirlwall et
al., 2004; Reykjanes, Krísuvík, and Brennisteinsfjöll data are from Thirlwall et al.,
2004, Kokfelt et al., 2006, and Peate et al., 2009; Hekla data are from Park, 1990,
Sigmarsson et al., 1992, and Furman et al., 1995; Katla data are from Park, 1990 and
Furman et al., 1995; Vestmannaeyjar data are from Furman et al., 1991 and Kokfelt
et al., 2006. ....................................................................................................................... 120
Figure 3.15. Sr-Nd isotope mixing model for Thríhnúkagígur lavas and dikes. First, the
dike sample with the least radiogenic Sr isotope composition (TNG-14-24, purple
circle) is mixed with a strongly radiogenic hydrothermally altered crustal end
member from Gee et al., 1998 (blue cross). Then mixing occurs between various
points along the first curve and the least radiogenic buried tephra sample, marked
with a red triangle. ........................................................................................................... 121
Figure 3.16. Incompatible trace element ratio mixing curve, Nb/Zr vs. La/Yb. The
average buried tephra (red diamond) of the representative samples forms the
enriched end member. The geochemistry of the intrusive part of the system is
heterogeneous, so three possible end members are used (yellow diamonds): the
plugged conduit (TNG-14-18), the chilled margin of the dike (TNG-14-27e), and
isotopically most depleted dike sample (TNG-14-24) used as an end member in
Figure 3.13. For the latter two primitive end members, green crosses on the mixing
curves represent 20% buried tephra, blue crosses represent 10%, and red crosses
represent 5%. Dikes and lavas representing possible mixtures of the buried tephra
and original magma composition are blue and yellow circles. ........................................ 122
Figure 3.17. Cartoon of the magmatic plumbing system below Brennisteinsfjöll. The
depth to the base of the crust is to scale, but the volcanic features, dikes, and sills are
not to scale. Hydrothermally altered crust or hyaloclastite layers (HC) likely play a
role in slowing magma ascent. Orange stippled zones represent sills or sill-like
intrusions that have stalled at low density layers. ............................................................ 123

xi
LIST OF TABLES
Table 2.1. Estimates of Thríhnúkagígur lavas volumes and calculation of tephra contents. ... 42
Table 2.2. Densities of Thríhnúkagígur lava and buried tephras. ............................................ 42
Table 3.1. Mineral and groundmass modes in percent. Modes are normalized to 100%
after removing the vesicle mode, which is reported separately. ...................................... 96
Table 3.2. Major element chemical analyses in weight percent oxides. Data were
collected by a Perkin-Elmer Optima 5300DV ICP-AES for a representative sample
set for the units present at Thríhnúkagígur. Mg# and the chemical index of alteration
(CIA) are unitless numbers. Mg# is defined as 100 * Mg/(Mg + Fe) where Mg and
Fe are molar abundances. CIA is defined as 100 * Al2O3/(Al2O3 + CaO + Na2O +
K2O). For plotting major element compositions, all samples were normalized to
100% after removing LOI. *Duplicate analysis. Duplicates are averaged for all
figures............................................................................................................................... 97
Table 3.3. CIPW norms. Calculated from major element data and trace element
concentrations of Sr, Ba, Cr, Ni, and Zr. Samples TNG-14-22, TNG-14-28, and MC-
612-03 are excluded from this table because they have been altered to an extent that
makes their bulk chemistry fall outside the range of compositions for which norms
can be calculated. ............................................................................................................. 99
Table 3.4. Trace element chemical analyses. Data were collected by a Thermo X-Series II
Quadruple ICP-MS for samples from the Thríhnúkar fissure system. All
concentrations are in ppm. NR = not reported. *Duplicate analysis. ............................... 100
Table 3.5. Pb-Sr-Nd isotope ratios. Data were collected by Finnigan MAT 262 multi-
collector thermal ionization mass spectrometer (TIMS). Two standard deviations are
given in ten-thousandths for Pb ratios and one-millionths for 87Sr/86Sr and 143Nd/144Nd. ...................................................................................................................... 103
Table 3.6. Mixing end member compositions for Figures 3.14 and 3.15. HAC =
hydrothermally altered crust; from Gee et al. (1998a). .................................................... 105

xii
ACKNOWLEDGEMENTS
First of all, this thesis would not have been possible without generous funding from the
Department of Geosciences. Thank you to Hiroshi and Koya Ohmoto, the family of Charles E.
Knopf, and the Hess Corporation for graciously endowing the department thereby allowing
students like myself to conduct research in the field. And thanks to the NSF for funding my
isotopic analyses through an international collaboration grant.
I must also thank Björn Òlafsson and all of the folks at Inside the Volcano for granting
me access to the cave below Thríhnúkagígur. The title of this thesis is in honor of your assistance.
Thanks also to Jim Normandeau at UNAVCO for providing me with such an excellent
LiDAR data set.
To Halldór, your assistance in the field was invaluable. I also deeply appreciate your
input throughout this project and your willingness to share your experience with me.
Samuele, thanks for teaching me ion chromatography and TIMS methodology. I learned a
ton from you. Grazie mille also for being so hospitable. You were a fantastic host!
To my parents, Mark and Bonnie, you’re the greatest. Thanks for all your emotional (and
occasional financial) support of my endeavors. I cannot describe how much it means to me.
These last three years have been truly enjoyable largely because of the great people I
have been able to call my friends. It was not always a smooth ride, but your incredible support
helped me with the road bumps along the way. Thank you guys! Nick and Helen, I especially do
not know what I would have done without you.
Tanya, I appreciate the tough love. I really believe it has forced me to address some of
my weakness and helped me to become a better scientist. Thanks for being a skeptic and asking
me tough questions.
Pete, thanks for forcing me to step outside of my comfort zone. You have helped me to
become more comfortable incorporating geophysics into my research. Thanks also for allowing
me to take on this project! It was a great opportunity and an exciting for me.
And to Maureen, thanks for being so accessible and helpful. I am certain that I have tried
your patience during this process, so thanks for putting up with me! You’ve given me some great
opportunities and connections, for which I cannot express my appreciation enough. Thank you.

Chapter 1
Geologic Overview
1.1 Introduction
The goal of this project is to better understand the origin, evolution, and
ultimately the eruption of basalts on the Reykjanes Peninsula in Iceland in the absence of
central volcanoes or any large homogenizing magma chambers. Direct observations of
the shallow magmatic plumbing system in a cave below the main vent of the fissure
eruption at Thríhnúkagígur, together with surficial structures form the basis for
deciphering eruptive style and process. Whole rock chemical and isotopic compositions
of erupted lavas, their corresponding intrusive units, and some of the intruded country
rock provide insights into the mantle sources for Thríhnúkagígur magmas and the crustal
processes that drove their evolution.
Chapter 1 is an overview of the geodynamics and volcanism in Iceland that
provides context for the following chapters. With no eruptions on the Reykjanes
Peninsula since the 13th century, the best analogs for eruptive process are other fissure
eruptions in Iceland. Yet, these comparisons are imperfect because the Reykjanes
Peninsula lacks central volcanoes or large magma storage chambers. In addition, few
eroded cones or vents exist on the Reykjanes Peninsula because it has been largely
resurfaced by Holocene lava flows since the end of the last glaciation. Few places,
therefore, expose the shallow plumbing system of fissure eruptions that would reveal

2
information about eruptive processes and vent development. Thríhnúkagígur, the main
vent of a monogenetic fissure eruption in the Brennisteinsfjöll fissure swarm, is a unique
place to study eruptive process on the Reykjanes Peninsula. The uppermost ~120 meter
of the conduit remained evacuated following the eruption, revealing a cross-section
though the shallow magmatic plumbing system.
In Chapter 2, direct observations of the internal structure of the Thríhnúkagígur
magmatic plumbing system and surface geology forms the basis for describing the
eruption, the development of the vent, and the formation of the cave. While one goal of
this project is to understand what processes might be common for Reykjanes Peninsula
fissure eruptions, the lung-shaped cave below the main vent is highly unusual. This
structure warrants consideration of how the eruption at Thríhnúkagígur is also
uncharacteristic of monogenetic fissure eruptions in this setting. A buried tephra cone is
preserved at depth in the cave. The potential incorporation of this unconsolidated material
into the erupting magma is investigated in this chapter.
With constraints on eruptive process in the uppermost crust, geochemical and
isotopic analyses in Chapter 3 are used to evaluate the mantle sources of these magmas as
well as their storage and evolution in the crust between where melts were generated and
where they were erupted. Lavas from the Reykjanes Peninsula have been well-
characterized geochemically, but seldom have individual eruptions with both intrusive
and extrusive samples been studied in detail. A comprehensive whole rock major and
trace element and Sr-Nd-Pb isotope data set is herein presented. Competing views of
unadulterated mantle melts and significant contamination of these melts in crustal magma

3
chambers have been presented for Reykjanes Peninsula lavas in previous literature.
Chapter 3 evaluates these ideas by investigating a single small volume eruption in detail.
1.2 Regional tectonic setting
1.2.1 The Mid-Atlantic Ridge and the Icelandic plume
Iceland is a remarkably active volcanic province that straddles the Mid-Atlantic
Ridge (MAR). This substantially thickened, buoyant oceanic crust is the result of
increased melt production related to the concurrence of a mantle plume with the MAR.
Its location at a divergent plate boundary has caused the Icelandic hotspot track to trail
both east to the Faroe Islands on the Eurasian plate and west to Greenland on the North
American plate. These tracks suggest that the Icelandic hotspot is at least as old as the
opening of the North Atlantic around 56 Ma, as determined by magnetic anomalies
(Nunns et al., 1983) and the geochronology of flood basalts and picrites in eastern
Greenland (Larsen et al., 1992; Saunders et al., 1997).
Numerous geophysical studies, such as ICEMELT (Bjarnason et al., 1996; Wolfe
et al., 1997) and HOTSPOT (Foulger et al., 2000), have used comprehensive seismic
tomography surveys to image the plume beneath Iceland. These studies and others
converge on a vertical, cylindrical thermal anomaly of approximately 150° C above
ambient mantle temperature extending to at least 400 km depth in the mantle (Bjarnason
et al., 1996; Wolfe et al., 1997; Foulger et al., 2000; Bjarnason, 2008; Brandsdóttir and
Menke, 2008). The lack of an observable, deep-seated mantle plume extending to the 660
km discontinuity or D” beneath Iceland has led some authors to create alternative models

4
for enhanced melt production in Iceland. Foulger and Anderson (2005) argue that the
seismically observed structure can be explained by a complex tectonic model, whereby
subducted oceanic crust from the closure of the Iapetus Ocean is trapped in Laurasian
continental lithosphere, giving rise to an especially fertile mantle in a location where the
geotherm is already elevated due to the presence of the MAR. However, the vast majority
of data for Iceland have been interpreted within a hotspot framework since the advent of
the fixed mantle hotspot hypothesis by Wilson (1963) and Morgan (1971). The work
presented herein likewise assumes the existence of a mantle plume with geochemical
properties similar to those of an ocean island basalt (OIB) source when discussing mantle
sources.
The locus of the plume is assumed to be under the thickest crust, which reaches a
maximum of approximately 40 km thick beneath Europe’s largest ice cap, Vatnajökull,
slightly to the east of Iceland’s center (Figure 1.1). The average crustal thickness is 25-26
km (Darbyshire et al., 1998; Darbyshire et al., 2000; Björnsson et al., 2005; Bjarnason
and Schmeling, 2009), whereas the thinnest crust is 18-20 km thick (Figure 1.1) and may
be as thin as 14 km where the Reykjanes Peninsula goes offshore (Weir et al., 2001).
1.2.2 Neovolcanic zones
Much of the present day magmatism in Iceland exists within four main
neovolcanic zones. Three of these are rift zones that comprise the subaerial MAR: the
Western Volcanic Zone (WVZ), the Eastern Volcanic Zone (EVZ), and the Northern
Volcanic Zone (NVZ). The fourth major volcanic zone, the Reykjanes Peninsula (RP), is

5
a transtensional plate boundary that connects the southern tip of the WVZ to the
submarine Reykjanes Ridge (Figure 1.1).
The plate boundaries and volcanic zones shown in Figure 1.1 are herein described
from north to south. In the modern plate configuration, the submarine Kolbeinsey Ridge
north of Iceland connects to the NVZ by the Tjörnes Fracture Zone. The NVZ ends
beneath Vatnajökull and two rift zones continue to the southwest. The EVZ forms a
continuous boundary with the NVZ that extends south of Vatnajökull. The WVZ is offset
from the NVZ to the west by the E—W oriented Mid-Iceland Belt extending from
Vatnajökull to Langjökull. From there, the WVZ extends to the southwest where it
terminates at the eastern end of the transtensional Reykjanes Peninsula. The RP consists
of a series of NE-SW trending parallel volcanic systems aligned in an E—W lineament
connecting the subaerial expression of the MAR at the WVZ to the submarine Reykjanes
Ridge to the west. The EVZ and the WVZ are connected in the south by a young non-
transform fault system, the South Iceland Seismic Zone (SISZ). The SISZ extends east
from the Hengill volcanic system on the Reykjanes Peninsula and intersects the EVZ
between Hekla volcano and Torfajökull caldera (Geirsson et al., 2012). Additionally,
there are two off-rift volcanic centers, Öræfajökull in the east and Snæfellsnes in the
west.
Spreading of Iceland’s rift zones occurs at a rate of ~17-18 mm/yr total in the
MORVEL model (DeMets et al., 2010), making it an ultraslow spreading center.
LaFemina et al. (2005) used geodetic GPS measurements to characterize spreading rates
along axis of the WVZ and EVZ. They determined that rates in the EVZ decrease to the
south along the rift zone from the full North American-Eurasian spreading rate at the

6
juncture with the NVZ (19.0 ± 2.0 mm/yr) to 11.0 ± 0.8 mm/yr in the southern EVZ. This
decrease correlates with a spreading rate increase moving south along the WVZ (2.6 ±
0.9 mm/yr to 7.0 ± 0.4 mm/yr). The EVZ now accommodates two-thirds of the MAR
spreading rate in south Iceland (LaFemina et al., 2005), which has led some authors to
suggest that the WVZ is dying out as another ridge jump is made from the WVZ to the
EVZ (Hardarson et al., 1997). The North American-Eurasian plate boundary continues to
reconfigure to the southeast as the plates drift WNW over the stationary Icelandic plume
(Hardarson et al., 1997; Mittelstaedt et al., 2008; Walters et al., 2013). In this framework,
the GPS geodetic data of LaFemina et al. (2005) demonstrate that ridge reconfiguration is
a transitional process rather than an instantaneous one as the EVZ continues to propagate
to the south in the present day.
1.2.3 Deglaciation and volcanism
The Weichselian glaciation lasted from 113 ka to ~ 13-9 ka in Iceland (Fronval
and Jansen, 1997). When the glaciation began to wane and the ice retreated, there was a
large, rapid pulse of magmatism resulting from isostatic rebound and decompression
melting. Therefore, a decrease in melt production in the WVZ related to the ridge
relocation described in the previous section may not be observable in the postglacial
Holocene because the signal would be masked by the sudden, extreme increase in melt
production associated with deglaciation (Sinton et al., 2005). Immediately following the
rapid removal of ice following the last glacial maximum, a spike in decompression
melting spawned abundant and voluminous volcanism, which tapered off abruptly after

7
only one to two thousand years (Jull and McKenzie, 1996; Maclennan et al., 2002). This
phenomenon has been documented on the Reykjanes Peninsula (Guðmundsson, 1986),
the WVZ (Sinton et al., 2005) and in all the other volcanic zones with production rates up
to 30 times that of equilibrium melting (Maclennan et al., 2002). This phenomenon has
also given rise to markedly different compositions in lavas erupted in interglacial periods
and those erupted immediately following deglaciation (Gee et al., 1998b; Maclennan et
al., 2002; Sinton et al., 2005).
1.3 Regional geochemical overview
As an ocean island on a mid-ocean ridge, Iceland is dominantly (although by no
means entirely) basaltic in composition. Geochemical differences have been recognized
globally between mid-ocean ridge basalts (MORB) and ocean island basalts (OIB; Sun
and McDonough, 1989), but these differences were not initially understood to have
originated from separate mantle sources. Schilling (1973) invoked multiple mantle
sources to explain chemical variation in Iceland. He noted a gradual depletion in light
rare earth elements (REEs) moving southwest along the Reykjanes Ridge away from
Icelandic plume. Large ion lithophile elements (LILEs) (such as K, Rb, Cs, Ba, U, and
Th) and light to intermediate REE ratios (notably La/Sm) in Reykjanes Ridge basalts
followed a similar gradational trend (Figure 1.2). Not only did Schilling (1973) suggest a
more primordial source beneath Iceland, but he used this evidence to argue for a two
component mixing model between melts from both MORB and a plume (OIB) source in
the mantle.

8
Contemporaneously, Jakobsson (1972) recognized a geographic correlation
between variations in major element compositions across Iceland. He proposed three
igneous rock series and linked them to their proximity to the MAR rift zones. These
remain the defining rock series of Iceland today and are correlated to tectonic
environment (Sigmarsson and Steinthórsson, 2007; Jakobsson et al., 2008). Alkali and
transitional alkali basalts are confined to the off-rift volcanic zones and near the south tip
of the propagating EVZ rift. Tholeiites, the most common of the basaltic rock series, are
found along the neovolcanic rift zones. These rock series correlate with the melt fraction
and volume, with tholeiites representing greater melt fraction and alkali basalts indicating
small batches of more localized melt. These major element compositions are probably
controlled more by tectonic environment and melting regime rather than variable mantle
sources.
A great deal of research has gone into determining the number and compositions
of different mantle domains contributing to Icelandic magmas. Among trace elements,
niobium seems to be the most robust tracer of primordial mantle contributions because
Nb is depleted in both depleted MORB-source upper mantle and in the crust relative to
primitive mantle (McKenzie and O’Nions, 1991; Fitton et al., 1997). Elevated Nb/Zr
ratios (≥0.08) in Iceland and at other North Atlantic hotspots relative to MAR ridge
segments (≤0.05) is consistent with theoretical Nb systematics (Figure 1.2; Fitton et al.,
1997; Hanan et al., 2000).
Helium isotope ratios are also broadly considered to be a robust tracer of a
primitive mantle component. The primordial mantle theoretically has a higher 3He/4He
ratio than degassed upper mantle because 4He will be replenished in a degassed mantle by

9
alpha decay of radionuclides, whereas 3He will not, driving 3He/4He to lower values over
time. Ratios are typically expressed relative to the atmospheric ratio (R/Ra) and it has
long been recognized that Iceland has R/Ra, as much as three times greater (R/Ra = 24)
than MORB and that these values are typically higher close to the center of the plume in
east-central Iceland, although this distribution is non-uniform (Condomines et al., 1983;
Kurz et al., 1985).
Indeed, the increasing consensus in the literature favors the mixing of multiple (2-
4) source domains within the plume based on Sr-Nd-Pb-Hf isotope systematics. Some
propose the range of compositions of Icelandic lavas arises without contribution from a
MORB source and that the plume contains at least one depleted (unradiogenic Pb,
radiogenic Nd, and moderate to unradiogenic Sr) component (Chauvel and Hémond,
2000; Thirlwall et al., 2004; Kokfelt et al., 2006). Rather than have a mid-ocean ridge
contaminated by a plume source, they posit that the plume itself is responsible for
heterogeneity in Iceland and instead, it contaminates the surrounding MAR. Regardless
of whether there are contributions from a MORB source (Hanan and Schilling, 1997;
Hanan et al., 2000) or not, most recent studies converge on the involvement of ancient
recycled oceanic crust or lithosphere (Chauvel and Hémond, 2000; Thirlwall et al., 2004;
Kokfelt et al., 2006; Peate et al., 2010; Koornneef et al., 2012).
Two dominant models for the origins of Icelandic magmas are best summarized
by Manning and Thirlwall (2014). The first results from the melting of a zoned plume or
one that contains veins or blobs of fertile material within depleted lithologies (Chauvel
and Hémond, 2000; Kokfelt et al., 2006; Koornneef et al., 2012). Either fertile pyroxenite
is incorporated into ambient peridotite or the structure of recycled oceanic lithosphere is

10
preserved, giving rise to bilaterally zoned plume with melts from both fertile basaltic and
refractory gabbroic compositions. The second model advocates convective mixing
between numerous, isotopically distinct sources within the plume (Thirlwall et al., 2004;
Peate et al., 2009; Peate et al., 2010). Excluding Öræfajökull, which requires the melting
of minor amounts of pelagic sediment (Manning and Thirlwall, 2014), the Iceland array
in 87Sr/86Sr and 143Nd/144Nd supports a binary mixing model. Lead isotope work has
provided the most robust evidence for a third enriched mantle source (Sigmarsson &
Steinthórsson 2007, and references therein) although Koornneef et al. (2012) argue that
one dimensional polybaric melting models with mixing of melts from two sources at
different depths can give rise to the full range of isotope compositions.
Oxygen isotopes in Icelandic lavas are commonly up to 2‰ lighter than mantle
δ18O values. This observation has also been used as evidence for a recycled oceanic
crustal component interspersed in the mantle below Iceland (Kokfelt et al., 2006).
Sigmarsson & Steinthórsson (2007), on the other hand, argue that contributions from the
altered Icelandic crust to magmatic systems may limit the use of oxygen isotopes to
identify mantle sources. Assimilation of altered basalt or hyaloclastite may drive
Icelandic lavas to δ18O several ‰ lighter than mantle values based on observed extreme
negative δ18O (<-10‰) in hydrothermal systems (Muehlenbachs et al., 1974; Hattori and
Muehlenbachs, 1982) and more moderate depletions in δ18O in the ubiquitous
hyaloclastite formations in the EVZ (Bindeman et al., 2008).

11
1.4. The Reykjanes Peninsula and the Brennisteinsfjöll volcanic system
1.4.1 Reykjanes Peninsula tectonics and volcanism
The Reykjanes Peninsula, in southwest Iceland is a oblique transtensional plate
boundary that arcs onshore to Iceland from the Reykjanes Ridge. It connects the offshore
Reykjanes Ridge with the onshore Western Volcanic Zone (a ridge) and the South
Iceland Seismic Zone (a “transform”) at a triple junction at Hengill. It consists of 4 NE-
SW trending en echelon volcanic systems that form the plate boundary (Figure 1.3).
Pioneering microseismic observations showed that both strike-slip and normal faults are
present across the peninsula (Klein et al., 1973; Klein et al., 1977), which was supported
by geodetic data that indicated both left-lateral and extensional motion (Brander et al.,
1976). These studies demonstrated that the RP was not simply a transform plate boundary
connecting the Reykjanes Ridge to the WVZ, but rather an extensional transform zone or
what is sometimes referred to as a leaky transform (Taylor et al., 1994).
A variety of techniques have been implemented to understand the distribution of
faults, volcanic fissures, and fractures on the Reykjanes that partition strain. These
methods include the use of seismic data (Keiding et al., 2009), GPS geodesy (Hreinsdóttir
et al., 2001; Clifton et al., 2002; Árnadóttir et al., 2006; Keiding et al., 2008), InSAR
(Clifton et al., 2002), analog models (Clifton and Schlische, 2003), structural analysis
(Villemin and Bergerat, 2013), and high resolution DEM mapping of fissures (Clifton
and Kattenhorn, 2006).
Geodetic GPS work focuses on determining how NUVEL-1A spreading rates of
19-20 mm/yr between the North American and Eurasian plate are partitioned on the

12
oblique divergent Reykjanes Peninsula. From 1993-1998 GPS velocities, Hreinsdóttir et
al. (2001) observed 16.8 ± 0.9 mm/yr of left-lateral motion on the RP, but not the
expected extensional component. They postulate that extension is accommodated during
episodic rifting events that are thought to be cyclical with a ~1000 year periodicity
(Clifton and Kattenhorn, 2006; Keiding et al., 2008). The last eruption on the RP
occurred in the 13th century and the peninsula is presently in a quiescent period.
However, recent work by Árnadóttir et al. (2006) models 1992-2000 GPS velocities with
a best-fit locking depth of 8 km, and 19 mm/yr of left-lateral transcurrent motion, and ~9
mm/yr of extension at depth.
The motion and orientation of the plate boundary at depth gives rise to more
complex deformation in the brittle regime and expression of structures at the surface.
Clifton and Katterhorn (2006) use high resolution digital elevation maps (DEM) to map
the surface expression of faults, fissures, and fractures on the Reykjanes. They find that
the major strike-slip faults are oriented N-S, rotated 80-90° clockwise from the
orientation of plate motion, and are primarily to the SE of the volcanic systems. The
normal faults, on the other hand, are oriented NE-SW, parallel or sub-parallel to the trend
of eruptive fissures and rotated ~60-70° counterclockwise to the direction of plate
motion. North trending right-lateral strike-slip faults are en echelon and accommodate the
E-W sinistral shear across the plate boundary; this style of faulting is referred to as
bookshelf faulting and is most developed on the eastern Reykjanes. This style of faulting
is characteristic of the SISZ to the east of the triple junction at Hengill (Bergerat and
Angelier, 2003; Clifton and Einarsson, 2005; Clifton and Kattenhorn, 2006), however
there is no observed extension in the SISZ. The commonality between the well-developed
13
N-S oriented dextral faulting in the SISZ and the eastern RP suggests that the volcanic
systems of Brennisteinsfjöll and Hengill are governed by a tectonic regime intermediate
between that of the RP and the amagmatic SISZ.
1.4.2 Reykjanes Peninsula lava chemistry
Except for rare silicic rocks from the Hengill volcanic system, the Reykjanes
Peninsula is uniformly basaltic in composition. High MgO lavas on the RP fall broadly
into two geochemical groups: depleted and enriched basalts (Gee et al., 1998a; Thirlwall
et al., 2004; Peate et al., 2009). Depleted lavas have Nb/Zr < 0.08, 87Sr/86Sr < 0.70311,
and 143Nd/144Nd > 0.51307 (Gee et al., 1998a). Peate et al. (2009) sampled all of the
historic lavas on the Reykjanes (since the settlement of the island circa 871 C.E.). These
are uniformly enriched, but are subdivided into “less enriched” (Nb/Zr 0.10-0.13, La/YbN
1.3-2.0) and “more enriched” (Figure 1.4; Nb/Zr 0.13-0.14, La/YbN 2.2-2.6, 206Pb/204Pb
>18.8).
While many authors have focused on depleted picrites because they are the most
primitive compositions on the RP and therefore perhaps most accurately reflect primary
mantle melts, these are not representative and occur in rare, small volume flows
(Jakobsson et al., 1978; Peate et al., 2009). In fact, these lavas are constrained primarily
to 9-13 ka, during and immediately following deglaciation. The local stress state on
magma bodies is likely to have fluctuated during glacial unloading, which may have
caused eruptions to occur with increased frequency. Gee et al (1998b) argue that reduced
residence times immediately following deglaciation prevent RP lavas from acquiring

14
enriched trace element and isotope compositions from crustal contamination.
Additionally, they posit that shorter residence times in the crust of smaller volumes of
magma diminished the potential for magma mixing to occur, thereby preserving the
depleted melt.
While crustal assimilation has been demonstrated to be an important magmatic
process on the Reykjanes Peninsula (Gee et al., 1998a), the composition of these lavas
has been reinterpreted to reflect binary mixing of melts derived from depleted and
enriched components in the Icelandic plume. The enriched component dominates,
comprising 50-90% of the mix for majority of RP lavas (Thirlwall et al., 2004; Peate et
al., 2009) and the preservation of the depleted melts may be facilitated by the reduced
residence times and decreased probability of magma mixing (Gee et al., 1998b).
Nevertheless, there is a strong correlation between lava chemistry and age over the last
20 ka, with modern compositions at or approaching those before the deglaciation in
southwest Iceland (Figure 1.5).
Rifting seems to be confined to one part of the northern Reykjanes Ridge or the
RP at any given time and the estimated recurrence interval of these rifting episodes and
associated volcanism is ~1000 years (Clifton and Kattenhorn, 2006; Keiding et al., 2008).
The historic lavas from 940-1340 C.E. capture one of these intervals, within which
enrichment in lavas increases to the east (Peate et al., 2009). These authors explicitly
refrain from suggesting a causation for this correlation by stating that the full range of
enriched values has been expressed on the Reykjanes over the last 9 ka (Gee et al., 2000).
However, no other authors explore coincident rifting episodes across volcanic systems on
the Reykjanes, so this correlation cannot be yet be dismissed as chance. Crustal thickness,

15
subtle variations in tectonics and/or magmatic processes, and proximity to the plume
center in the EVZ among other factors cannot yet be ruled out.

16
Figure 1.1. Map of Iceland and its neovolcanic zones. These zone trace the plate boundary between North America (NA) and Eurasia (EU). KR =
Kolbeinsey Ridge; TFZ = Tjörnes Fracture Zone; NVZ = Northern Volcanic Zone; EVZ = Eastern Volcanic Zone; MIB = Mid-Iceland Belt; WVZ
= Western Volcanic Zone; RP = Reykjanes Peninsula; RR = Reykjanes Ridge; R = Reykjanes; K = Krísuvík; BSF = Brennisteinsfjöll; H = Hekla;
VME = Vestmannaeyjar. Volcanic zones are composed of many individual volcanic systems (Einarsson and Sæmundsson, 1987). Contours mark
the approximate depth to the Moho as determined by Darbyshire et al. (2000).

17
Figure 1.2. Variations along the Mid-Atlantic Ridge in La/Sm and Nb/Zr. Values are <1 for La/Sm on the
South Reykjanes Ridge (SRR) and the Kolbeinsey Ridge (KR) and <0.05 for Nb/Zr. These ratios are
greater than 1.5 and 0.08 for mainland Iceland (I). The North Reykjanes Ridge (NRR) is transitional
between ambient MORB compositions and those in lavas derived from the Icelandic plume. Data from
(Hanan et al., 2000).

18
Figure 1.3. Map of the Reykjanes Peninsula showing the four fissure systems (shaded grey). From east to west they are the Reykjanes, Krísuvík,
Brennisteinsfjöll, and Hengill volcanic systems. Thríhnúkagígur is located in Brennisteinsfjöll. Reykjavík and Thríhnúkagígur are shown in black
stars. Outlines of the volcanic systems are from Einarsson & Sæmundsson (1987).

19
Figure 1.4. Enriched historic Reykjanes Peninsula lavas plotted on Nb/Zr vs. 87Sr/86Sr (a) and Nb/Zr vs.
143Nd/144Nd. Data from Peate et al. (2009) fall into “more enriched” and “less enriched” categories.
More enriched sample correlate with lavas from Brennisteinsfjöll, while less enriched data are from the
eastern Reykjanes Peninsula fissure swarms of Reykjanes and Krísuvík (b).

20
Figure 1.5. Changes in lava chemistry on the Reykjanes Peninsula through time from Gee et al. (1998b).
Plots of lava age vs. Mg# (a), 87Sr/86Sr (b), Nb/Zr (c), and 143Nd/144Nd (d). The period during and
immediately following deglaciation (13-9 ka) produced more primitive, depleted magmas with higher
Mg# and 87Sr/86Sr and lower Nb/Zr ratios and 143Nd/144Nd.

21
References
Árnadóttir T., Jiang W., Feigl K. L., Geirsson H. and Sturkell E. (2006) Kinematic models of
plate boundary deformation in southwest Iceland derived from GPS observations. J.
Geophys. Res. 111, 1–16.
Bergerat F. and Angelier J. (2003) Mechanical behaviour of the Árnes and Hestfjall Faults of the
June 2000 earthquakes in Southern Iceland: Inferences from surface traces and tectonic
model. J. Struct. Geol. 25, 1507–1523.
Bindeman I., Gurenko A., Sigmarsson O. and Chaussidon M. (2008) Oxygen isotope
heterogeneity and disequilibria of olivine crystals in large volume Holocene basalts from
Iceland: Evidence for magmatic digestion and erosion of Pleistocene hyaloclastites.
Geochim. Cosmochim. Acta 72, 4397–4420.
Bjarnason I. T. (2008) An Iceland hotspot saga. Jökull, 3–16.
Bjarnason I. T. and Schmeling H. (2009) The lithosphere and asthenosphere of the Iceland
hotspot from surface waves. Geophys. J. Int. 178, 394–418.
Bjarnason I. T., Wolfe C. J. and Solomon S. C. (1996) Initial results from the ICEMELT
experiment : Body-wave delay times and shear-wave splitting across Iceland. Geophys. Res.
Lett. 23, 459–462.
Björnsson A., Eysteinsson H. and Beblo M. (2005) Crustal formation and magma genesis beneath
Iceland: Magnetotelluric constraints. Geol. Soc. Am. Spec. Pap. 388, 665–686.
Brander J. L., Mason R. G. and Calvert R. W. (1976) Precise distance measurements in Iceland.
Tectonophysics 31, 193–206.
Brandsdóttir B. and Menke W. H. (2008) The seismic structure of Iceland. Jökull 58, 17–34.
Brounce M., Feineman M., LaFemina P. C. and Gurenko A. (2012) Insights into crustal
assimilation by Icelandic basalts from boron isotopes in melt inclusions from the 1783-1784
Lakagígar eruption. Geochim. Cosmochim. Acta 94, 164–180.
Chauvel C. and Hémond C. (2000) Melting of a complete section of recycled oceanic crust: Trace
element and Pb isotopic evidence from Iceland. Geochemistry, Geophys. Geosystems 1, n/a–
n/a.
Clifton A. E. and Einarsson P. (2005) Styles of surface rupture accompanying the June 17 and 21,
2000 earthquakes in the South Iceland Seismic Zone. Tectonophysics 396, 141–159.
Clifton A. E. and Kattenhorn S. A. (2006) Structural architecture of a highly oblique divergent
plate boundary segment. Tectonophysics 419, 27–40.

22
Clifton A. E. and Schlische R. W. (2003) Fracture populations on the Reykjanes Peninsula,
Iceland: Comparison with experimental clay models of oblique rifting. J. Geophys. Res.
108.
Clifton A. E., Sigmundsson F., Feigl K. L., Gunnar Guðmundsson and Árnadóttir T. (2002)
Surface effects of faulting and deformation resulting from magma accumulation at the
Hengill triple junction, SW Iceland, 1994-1998. J. Volcanol. Geotherm. Res. 115, 233–255.
Condomines M., Muehlenbachs K., O’Nions R. K., Óskarsson N. and Oxburgh E. R. (1983)
Helium, oxygen, strontium and neodynium isotopic relationships in Icelandic volcanics.
Earth Planet. Sci. Lett. 66, 125–136.
Darbyshire F. A., Bjarnason I. T. and White R. S. (1998) Crustal structure above the Iceland
mantle plume imaged by the ICEMELT refraction profile. Geophys. J. Int. 135, 1131–1149.
Darbyshire F. A., White R. S. and Priestley K. F. (2000) Structure of the crust and uppermost
mantle of Iceland from a combined seismic and gravity study. Earth Planet. Sci. Lett. 181,
409–428.
DeMets C., Gordon R. G. and Argus D. F. (2010) Geologically current plate motions. Geophys. J.
Int. 181, 1–80.
Einarsson P. and Sæmundsson K. (1987) Earthquake epicenters 1982-1985 and volcnaic systems
in Iceland (map). In I hlutarins eðli: Festschrift for Thorbjorn Sigurgeirsson (ed. Þ.
Sigfússon).
Fitton J. G., Saunders A. D., Norry M. J., Hardarson B. S. and Taylor R. N. (1997) Thermal and
chemical structure of the Iceland plume. Earth Planet. Sci. Lett. 153, 197–208.
Foulger G. R. and Anderson D. L. (2005) A cool model for the Iceland hotspot. J. Volcanol.
Geotherm. Res. 141, 1–22.
Foulger G. R., Pritchard M. J., Julian B. R., Evans J. R., Allen R. M., Nolet G., Morgan W. J.,
Bergsson B. H., Erlendsson P., Jakobsdóttir S., Ragnarsson S., Stefansson R. and Vogfjo K.
(2000) The seismic anomaly beneath Iceland extends down to the mantle transition zone and
no deeper. Geophys. J. Int. 142, F1–F5.
Fronval T. and Jansen E. (1997) Eemian and Early Weichselian (140–60 ka) Paleoceanography
and paleoclimate in the Nordic Seas with comparisons to Holocene conditions.
Paleoceanography 12, 443.
Gee M. A. M., Taylor R. N., Thirlwall M. F. and Murton B. J. (2000) Axial magma reservoirs
located by variation in lava chemistry along Iceland’s mid-ocean ridge. Geology 28, 699–
702.
Gee M. A. M., Taylor R. N., Thirlwall M. F. and Murton B. J. (1998) Glacioisostacy controls
chemical and isotopic characteristics of tholeiites from the Reykjanes Peninsula, SW
Iceland. Earth Planet. Sci. Lett. 164, 1–5.
23
Gee M. A. M., Thirlwall M. F., Taylor R. N., Lowry D. and Murton B. J. (1998) Crustal
Processes: Major Controls on Reykjanes Peninsula Lava Chemistry, SW Iceland. J. Petrol.
39, 819–839.
Geirsson H., Bennett R. A., LaFemina P. C., Árnadóttir T., Sturkell E., Sigmundsson F., Travis
M., Schmidt P., Lund B. and Hreinsdóttir S. (2012) Volcano deformation at active plate
boundaries: Deep magma accumulation at Hekla volcano and plate boundary deformation in
south Iceland. J. Geophys. Res. 117, B11409.
Guðmundsson A. (1986) Mechanical Aspects of Postglacial Volcanism and Tectonics of the
Reykjanes Peninsula, Southwest Iceland. J. Geophys. Res. 91, 12711–12721.
Hanan B. B., Blichert-Toft J., Kingsley R. and Schilling J.-G. (2000) Depleted Iceland mantle
plume geochemical signature: Artifact of multicomponent mixing? Geochemistry, Geophys.
Geosystems 1.
Hanan B. B. and Schilling J.-G. (1997) The dynamic evolution of the Iceland mantle plume: the
lead isotope perspective. Earth Planet. Sci. Lett. 151, 43–60.
Hardarson B. S., Fitton J. G., Ellam R. M. and Pringle M. S. (1997) Rift relocation - a
geochemical and geochronological investigation of a palaeo-rift in northwest Iceland. Earth
Planet. Sci. Lett. 153, 181–196.
Hattori K. and Muehlenbachs K. (1982) Oxygen Isotope Ratios of the Icelandic Crust. J.
Geophys. Res. 87, 6559–6565.
Hreinsdóttir S., Einarsson P. and Sigmundsson F. (2001) Crustal deformation at the oblique
spreading Reykjanes Peninsula, SW Iceland: GPS measurements from 1993 to 1998. J.
Geodyn. 106, 13803–13816.
Jakobsson S. P. (1972) Chemistry and distribution pattern of Recent basaltic rocks in Iceland.
Lithos 5, 365–386.
Jakobsson S. P., Jónasson K. and Sigurdsson I. A. (2008) The three igneous rock series of
Iceland. Jökull 58, 117–138.
Jakobsson S. P., Jonsson J. and Shido F. (1978) Petrology of the Western Reykjanes, Peninsula.
J. Petrol. 19, 669–705.
Jull M. and Mckenzie D. (1996) The effect of deglaciation on mantle melting beneath Iceland. J.
Geophys. Res. 101, 21815–21828.
Keiding M., Árnadóttir T., Sturkell E., Geirsson H. and Lund B. (2008) Strain accumulation
along an oblique plate boundary: The Reykjanes Peninsula, southwest Iceland. Geophys. J.
Int. 172, 861–872.
Keiding M., Lund B. and Árnadóttir T. (2009) Earthquakes, stress, and strain along an obliquely
divergent plate boundary: Reykjanes Peninsula, southwest Iceland. J. Geophys. Res. Solid
Earth 114, 1–16.

24
Klein F. W., Einarsson P. and Wyss M. (1973) Microearthquakes on the Mid-Atlantic Plate
Boundary on the Reykjanes Peninsula in Iceland. J. Geophys. Res. 78, 5084.
Klein F. W., Einarsson P. and Wyss M. (1977) The Reykjanes Peninsula, Iceland, Earthquake
Swarm of September 1972 and Its Tectonic Significance. J. Geophys. Res. 82, 865–888.
Kokfelt T. F., Hoernle K., Hauff F., Fiebig J., Werner R. and Garbe-Schönberg D. (2006)
Combined Trace Element and Pb-Nd-Sr-O Isotope Evidence for Recycled Oceanic Crust
(Upper and Lower) in the Iceland Mantle Plume. J. Petrol. 47, 1705–1749.
Koornneef J. M., Stracke A., Bourdon B., Meier M. A., Jochum K. P., Stoll B. and Grönvold K.
(2012) Melting of a Two-component Source beneath Iceland. J. Petrol. 53, 127–157.
Kurz M. D., Meyer P. S. and Sigurdsson H. (1985) Helium isotopic systematics within the
neovolcanic zones of Iceland. Earth Planet. Sci. Lett. 74, 291–305.
LaFemina P. C., Dixon T. H., Malservisi R., Árnadóttir T., Sturkell E., Sigmundsson F. and
Einarsson P. (2005) Geodetic GPS measurements in south Iceland: Strain accumulation and
partitioning in a propagating ridge system. J. Geophys. Res. 110, B11405.
Larsen L. M., Pedersen A. K., Pedersen G. K. and Piasecki S. (1992) Timing and duration of
early Tertiary volcanism in the North Atlantic: new evidence from West Greenland.
Magmat. causes Cont. Break. 68, 321–333.
Maclennan J., Jull M., McKenzie D., Slater L. and Grönvold K. (2002) The link between
volcanism and deglaciation in Iceland. Geochemistry, Geophys. Geosystems 3, 1–25.
Manning C. J. and Thirlwall M. F. (2014) Isotopic evidence for interaction between Öræfajökull
mantle and the Eastern Rift Zone, Iceland. Contrib. to Mineral. Petrol. 167, 959.
McKenzie D. and O’Nions R. K. (1991) Partial Melt Distributions from Inversion of Rare Earth
Element Concentrations. J. Petrol. 32, 1021–1091.
Mittelstaedt E., Ito G. and Behn M. D. (2008) Mid-ocean ridge jumps associated with hotspot
magmatism. Earth Planet. Sci. Lett. 266, 256–270.
Morgan W. J. (1971) Convection Plumes in the Lower Mantle. Nature 230, 42–43.
Muehlenbachs K., Anderson A. T. and Sigvaldason G. E. (1974) Low-O18 basalts from Iceland.
Geochim. Cosmochim. Acta 38, 577–588.
Nunns A. G., Talwani M., Lorentzen G. R., Vogt P. R., Sigurgeirsson T., Kristjánsson L., Larsen
H. C. and Voppel D. (1983) Magnetic anamolies over Iceland and surrounding seas. In
Structure and Development of the Greenland-Scotland Ridge pp. 661–678.
Peate D. W., Baker J. A., Jakobsson S. P., Waight T. E., Kent A. J. R., Grassineau N. V. and
Skovgaard A. C. (2009) Historic magmatism on the Reykjanes Peninsula, Iceland: a snap-
shot of melt generation at a ridge segment. Contrib. to Mineral. Petrol. 157, 359–382.

25
Peate D. W., Breddam K., Baker J. A., Kurz M. D., Barker A. K., Prestvik T., Grassineau N. V.
and Skovgaard A. C. (2010) Compositional Characteristics and Spatial Distribution of
Enriched Icelandic Mantle Components. J. Petrol. 51, 1447–1475.
Saunders A. D., Fitton J. G., Kerr A. C., Norry M. J. and Kent R. W. (1997) The North Atlantic
Igneous Province. In Large Igneous Provinces: Continental, Oceanic, and Planetary Flood
Volcanism pp. 45–93.
Schilling J.-G. (1973) Iceland Mantle Plume: Geochemical Study of Reykjanes Ridge. Nature
242, 565–571.
Sigmarsson O. and Steinthórsson S. (2007) Origin of Icelandic basalts: A review of their
petrology and geochemistry. J. Geodyn. 43, 87–100.
Sinton J., Grönvold K. and Sæmundsson K. (2005) Postglacial eruptive history of the Western
Volcanic Zone, Iceland. Geochemistry, Geophys. Geosystems 6, n/a–n/a.
Sun S. -s. and McDonough W. F. (1989) Chemical and isotopic systematics of oceanic basalts:
implications for mantle composition and processes. Geol. Soc. London, Spec. Publ. 42, 313–
345.
Taylor B., Crook K. and Sinton J. (1994) Extensional transform zones and oblique spreading
centers. J. Geophys. Res. 99, 19707–19718.
Thirlwall M. F., Gee M. A. M., Taylor R. N. and Murton B. J. (2004) Mantle components in
Iceland and adjacent ridges investigated using double-spike Pb isotope ratios. Geochim.
Cosmochim. Acta 68, 361–386.
Villemin T. and Bergerat F. (2013) From surface fault traces to a fault growth model: The Vogar
Fissure Swarm of the Reykjanes Peninsula, Southwest Iceland. J. Struct. Geol. 51, 38–51.
Walters R. L., Jones S. M. and Maclennan J. (2013) Renewed melting at the abandoned Húnafloí
Rift, northern Iceland, caused by plume pulsing. Earth Planet. Sci. Lett. 377-378, 227–238.
Weir N. R. W., White R. S., Brandsdóttir B., Einarsson P., Shimamura H. and Shiobara H. (2001)
Crustal structure of the northern Reykjanes Ridge and Reykjanes Peninsula, southwest
Iceland. J. Geophys. Res. 106, 6347.
Wilson J. T. (1963) Continental Drift. Sci. Am. 208, 86–103.
Wolfe C. J., Bjarnason I. T., VanDecar J. C. and Solomon S. C. (1997) Seismic structure of the
Iceland mantle plume. Nature 385, 245–247.

26
Chapter 2
Inside the Volcano: Rapid entrainment of unconsolidated crust during a
monogenetic fissure eruption
2.1 Introduction
Small volume basaltic eruptions (<1 km3) produce tephra and scoria cones and/or
lava fields that are among the most abundant subaerial volcanic landforms on Earth
(Wood, 1980; Keating et al., 2007). As commonplace geologic features, it is important to
understand how their structure and development are controlled by the preexisting
structures relative to the far field stresses that typically control dike propagation and
orientation. These eruptions occur in a variety settings including monogenetic fields, at
the sites of fissure eruptions, and on the flanks of stratovolcanoes and shield volcanoes.
Recent rifting events have been well-observed and well-imaged geodetically (Wright et
al., 2006; Calais et al., 2008; Biggs et al., 2013; Sigmundsson et al., 2015), but are not
able to fully resolve the geometry and development of the uppermost eruptive conduit.
Data from older, eroded fissure systems have been described in detail (Németh and
White, 2003; Keating et al., 2007; Genareau et al., 2010; Valentine, 2012; Harp and
Valentine, 2015; Németh and Kereszturi, 2015). These suggest that decrease in the
vertical stress field in the very uppermost crust allows dikes to widen in the upper 50-150
m (Keating et al., 2007; Valentine, 2012). Yet, most observations of the internal structure
of monogenetic cones are limited to eroded systems at the surface of the Earth. Rarely is
the full length of the shallow magma plumbing observed in entirety.
Thríhnúkagígur is a monogenetic, small volume basaltic fissure eruption on the
Reykjanes Peninsula. It is unique in Iceland, and perhaps in the world, in that a large cave

27
directly below the main cone exposes a cross-section of the uppermost magma plumbing
system, as well as the regional stratigraphy. This vertically oriented lung-shaped cave
offers a unique a view into some non-unique magmatic and eruptive processes. First, the
uppermost ~150 m of architecture provides insights into the eruptive process and the
behavior of dikes in the shallow subsurface. Second, the remnants of a buried tephra cone
near the bottom of the cave provides insights to one way a crustal contaminant may be
added to mantle-derived magmas. The buried tephra cone is evaluated for both its role in
focusing the flux of magma to a single vent at the surface and as a crustal material that
could have been entrained by the erupting magma, thereby creating a vacancy below the
main cone.
2.2 Field descriptions
2.2.1 Surface geology
Thríhnúkar is a NNE-SSW trending fissure system in the Brennisteinsfjöll
volcanic system. Its name is derived from the three peaks, Vesturhnúkur, Miðhnúkur, and
Thríhnúkagígur that mark different eruptive episodes (Figure 2.1; Sæmundsson, 2006).
Vesturhnúkur, the oldest and westernmost of the peaks, sits on the edge of a plateau that
descends steeply to the northwest. It is associated temporally with the late Weichselian
glaciation (Sæmundsson et al., 2010) and consists primarily of basaltic hyaloclastite. Thin
dikes are pervasive on the western slope of the hyaloclastite and three dolerite plugs
occur at the summit, representing potential eruptive centers.

28
Miðhnúkur is a basaltic spatter cone between Vesturhnúkur and Thríhnúkagígur
that is estimated to be approximately 5 ka in age (Sæmundsson, 2006; and references
therein). Flows from Miðhnúkur (H-145; Figure 2.1) are the most extensive of the three
Thríhnúkar eruptions with some outcrops appearing up to 6.5 km away from the main
cone (Sæmundsson et al., 2010). Most of the flow extends off the plateau to the west and
northwest. Its full extent is unknown because it has been largely buried by subsequent
lava flows from other eruptive fissures. A 300 meter long depression formed east of the
Miðhnúkur cone during the event, and looks like a collapsed lava tube. It is elongate
parallel to the strike of the fissure and at least partially filled with lavas from the
Miðhnúkar eruption.
The eruption of Thríhnúkagígur is estimated to be 3.5 ka in age (Sæmundsson,
2006). Soil profiles overlying Thríhnúkagígur lavas included Katla tephras from >2500
bp (Sæmundsson, 2006; Sæmundsson, 2008).The easternmost of the Thríhnúkur peaks,
its main cone is an amalgamation of two vents from a fissure eruption. Smaller disparate
spatter cones associated with the fissure eruption occur up to 1.5 km from the main cone
(Figure 2.1). Thríhnúkagígur lavas can be distinguished in the field by the presence of
macroscopic plagioclase phenocrysts as opposed to olivine in the Miðhnúkar lavas. The
main flow from Thríhnúkagígur (H-146) covers roughly 0.34 km2 (Figure 2.1). Three
additional small lava fields are present along the fissure and were fed by small spatter
cones. One is immediately adjacent to the main cone to the SSW and the other two lava
fields are 1.5 km to the NNE on the flank of the plateau (Figure 2.1). These three flows
total to just under 0.1 km2 in area. The one proximal to the main cone is only ~0.015 km2
in area.

29
Lavas flows are relatively thin, about 15-30 cm in height. The flow tops are
vesicle-poor, but become increasing vesicular towards the base of the flow where
individual vesicles are up to several centimeters in diameter and become more
interconnected. Lavas from the main cone flowed primarily to the north and east, but also
filled the depression to its west that had formed originally during the Miðhnúkar eruption.
The depression filled to a height of about 1-1.5 m leaving behind a terrace (bathtub ring)
after it drained to the east by a lava tube.
The main spatter cone is relatively symmetrical, but elongate along the azimuth of
the fissure. The summit consists of a pair of similarly sized vents at the north and south
ends of the cone. The southern vent remained open, whereas the northern vent became
plugged towards the end of the eruption. The cone formed from the coalescence of the
fissure into a couple of main vents during a Strombolian eruption with low viscosity, gas-
rich lavas (Figure 2.2). Pele’s tears and oxidized scoriaceous vent spatter of various
colors around and at the top of the cone support this eruptive style. There are also several
tens of vesicle-poor 2-5 cm rheomorphic flows draining back into the vent (Figure 2.3).
These thin flows back into the vent contrast the surrounding highly vesicular H-146
flows. The vent itself is ~8 m in diameter at the surface, but narrows rapidly with
increasing depth, in places less than 3 by 2 meters, elongated along the fissure azimuth
reflecting the overall cone structure (Figure 2.2).
2.2.2 Subsurface Geology
The eruptive conduit provides the only entrance to the subsurface of
Thríhnúkagígur (Figure 2.4). The narrow cylindrical section of the conduit extends

30
vertically 60 m down from the summit. This section does not expose much of the
subsurface stratigraphy as it is coated by flowback of lava into the conduit. Flowback is
characterized by rivulet textures (Figure 2.5) and stalactites of lava (Figure 2.6) that are a
few centimeters to tens of cm in scale. Part way down the conduit there is a narrow,
continuous tunnel that diverts off and reconnects to the main conduit in the shape of a
teacup handle.
Further down the conduit from the surface, the cave broadens and flowback
features no longer coat the cave walls. As the cylindrical conduit opens up into the main,
lung-shaped hollow of the cave, it transitions from a focused oblong tube into a 2 m wide
planar dike exposed in the cave walls. The majority of the exposed rock consists of sub-
horizontal basalt flows that have been altered to a mustard yellow (Figure 2.7). These
flows are commonly a few tens of cm in thickness, and are generally not more than a
meter thick.
Underlying the succession of lava flows is a buried pile of tephra, which has
previously been interpreted as a laterally continuous, gently dipping layer of hyaloclastite
that breaks the surface at Vesturhnúkar (Sæmundsson, 2006). This unconsolidated
material observed in the cave beneath Thríhnúkagígur appears to be a separate geologic
unit from the hyaloclastite. Instead, it is interpreted herein as the remnant of a subaerially
erupted tephra cone rather than a hyaloclastite ridge. The photo in Figure 2.8 shows the
contrast in physical characteristics between these two units. Although these two units
may represent different stages the hyaloclastite succession, rare bomb sags in the buried
tephra suggest a subaerial eruption. The buried is only exposed in the NW wall of the
cave and not on the SE wall, until deeper down in the cave. The contact with the

31
overlying lavas dips toward the NE and SW in wall, which is consistent with a tephra
cone that would dip in all directions from its highest point. The buried tephra cone is seen
interfingering with the overlying lava pile in the NW wall of the cave, but the slope of the
tephra remains relatively constant until it grades into a >1.5 m thick tephra sheet exposed
at the northern end of the cave (Figures 2.9, 2.10). Bombs and bomb sags in the tephra
apron suggest that the eruption that formed the tephra cone was subaerial. The constant
slope of the buried tephra cone and lack of reworking, other than minor interfingering
with subsequent lava flow, also suggests rapid burial by lava since the tephra is
unconsolidated. Because this relatively unconsolidated material is preserved at all, its
eruption and burial under ~120 m of lava flows likely occurred within an interglacial
period. Otherwise glaciers would have likely modified or removed the tephra cone.
The buried tephra primarily consists of unconsolidated, 1-5 mm glass shards with
rare macroscopic plagioclase crystals. Locally within the tephra pile pieces of scoria are
common, but no larger than 10 centimeters and rarely greater than 5 cm. The buried
tephra displays no major internal structures, but it is locally heterogeneous in size, color
and composition. For example, there is a 20 cm layer within the tephra that is well
consolidated with a quasi-foliated clay matrix around larger scoria clasts up to ~5 cm,
which suggests this tephra was reworked in the presence of water. Separately, in the
massive portions of the unit that lack evidence of reworking, there are zones that exhibit
1-2 cm wide spots that have been partially palagonitized.
The age of the buried tephra cone is unknown, but may be constrained by the
periodicity of magmatism and rifting on the Reykjanes Peninsula, which is thought to be
on the order of 1000 years (Sæmundsson et al., 2010). Lava flows in the cave are rarely

32
greater than 1 m thick. By assuming a rate of 1 meter of burial per 1000 years, and
accounting for the thickness of the lavas overlying the tephra apron (~120 m), an
approximate age of 100 ka is calculated. This assumes eruptions occurred in this location
during each rifting cycle and produced a lava flow thicker than the average flows
observed in the cave, so this is a minimum age estimate. The Eemian interglacial ended
approximately 113 ka with the onset of the Weichselian glaciation in northern Europe
(Fronval and Jansen, 1997), further suggesting that 100 ka is a minimum age.
Within the lava flows that lie stratigraphically above the top of the tephra cone in
the western wall of the cave there is a 5 m wide black to purple oval-shaped plug of
crystalline basalt with a large gas cavity in the center (Figure 2.11). It has an oxidized red
contact aureole and is interpreted to be an intrusion associated with the ~3.5 Ka
Thríhnúkagígur eruption. Although it has no surface expression, it is close enough to the
surface that it is probable that it vented to the surface and then was subsequently buried
during the formation of the main cone of Thríhnúkagígur. The plug itself is too high in
the ceiling to collect samples directly. Large boulders of oxidized, purple basalt beneath
the plug are interpreted as having fallen from the plugged conduit rather than the dike for
two reasons. First, some boulders have greater dimensions that the width of the dike.
Second, these boulders are not below the dike and are higher up on debris pile (the cave
floor) than any locations directly below the dike.
From the floor of the cave, the larger structure of the dike that fed the 3500 bp
eruption can be observed. The dike arcs across the ceiling tracing a vertical plane through
the center of the cave. It trends NNE-SSW, which is consistent with the regional
extensional fissures and crater rows of the Brennisteinsfjöll fissure swarm. The dike is

33
similar to the plugged conduit in that it is oxidized from black to purple and the baked
margins of country rock adjacent to the dike are red to a reddish-purple. About half way
down from the narrowing of the conduit to the floor of the cave, the dike has an en
echelon structure (Figure 2.7). Towards the floor of the cave on the northeast side, the
dike decreases in width to 0.5-1 m and develops a more complex structure. Further down
towards the floor on the northeast end of the cave, decimeter wide splays are developed.
In other segments, it separates into two thinner dikes then recombines into a single larger
dike. At the lowest exposure, the dike can be seen cross-cutting the tephra apron (Figure
2.9).
At the southwest end of the cave, a narrow gap between the debris pile and the
ceiling of the cave extends down along the strike of the dike. In one segment of the dike
there is a nearly 0.5 m long, 5 cm wide gas pocket that pinches out at both its ends
(Figure 2.11). Roughly 20 m down into this gap becomes a series of crawl spaces
between boulders. Here the dike can be seen crosscutting the tephra pile, but the structure
of the dike is difficult to trace because of the dike splays into many smaller dikes at this
depth and the exposure is much more limited. The best exposures of the dike are where it
fed vertical cylindrical pipes, or proto-conduits, that extend up into the buried tephra
(Figure 2.12). These proto-conduits have flowback features along their walls, suggesting
that their formation was a result of magmatic scouring of the poorly consolidated tephra.
These cylindrical cavities are typically immediately adjacent to the dike and range in
diameter from 0.25 to 2 m. The largest is mapped (Stefánsson, 1992; Sæmundsson, 2006)
and penetrates more than 30 m up into the overlying tephra (Figure 2.12).

34
2.3 Methods
Measuring the volume of the cave can help constrain the amount of tephra that
once filled the cave if it formed by the removal of unconsolidated buried tephra by an
erupting magma. Measuring the volume of the Thríhnúkagígur spatter cone and
estimating the lava volumes and their density can constrain the dense rock equivalent
(DRE) of the erupted products, which can help to constrain the relative proportion of
tephra that could have been entrained and incorporated into the lavas.
2.3.1 Light Detection and Ranging (LiDAR)
The cave at Thríhnúkagígur was scanned to gain an understanding of its overall
shape and structure and to relate that to the dynamics of the fissure eruption to which it is
likely related. The scans also serve the purpose of giving robust constraints on the
volumes of the cave and the main cone. Twelve locations from inside the cave at
Thríhnúkagígur were used to collect high resolution Light Detection and Ranging
(LiDAR) data to create a digital elevation model of the cave in 2011. The exterior of the
cone was also scanned. Data was collected with a Leica C-10 scanner. The resulting
DEM from the interior and exterior scans is accurate to <4 cm, yielding an accurate and
precise volume estimate of the main chamber of the cave and the spatter cone at the
surface.

35
2.3.2 Density Measurements
In order to compare the mass of erupted lavas and the mass of the buried tephra
that may have once filled the volume of the cave, the dense rock equivalent (DRE)
volumes of the two units must be determined. Vesicles in the lava samples were
determined to have a modal percentage of 29% by point counting. Most vesicles were at
least 1 mm in diameter; therefore lava chips were crushed with a mortar and pestle into
fragments that were <3 mm in any dimension and hand selected to ensure that all vesicles
were open. A Mettler electronic balance was used to weigh ~4 g of lava rock chips. A
similar mass of the better consolidated, yet still representative tephra were also weighed.
These samples were then placed in 10 ml and 50 ml graduated cylinders partially filled
with water, respectively, to measure the volume. Because the error on the 50 ml cylinder
was greater, a larger duplicate sample of the same tephra sample was also weighed and its
volume measured.
2.4 Results
The LiDAR derived DEM allows us to estimate that the volume of the cave is
~40,000 m3 (Figures 2.4, 2.12). The surface area of the lavas extruded from the
Thríhnúkagígur eruption can be estimated at 350,000 m2 from the geologic map by
Sæmundsson (2006). With a minimum estimated thickness of the lava flows, and cone
height and radius, a minimum erupted volume can be estimated. For this calculation, a 30
m high cone with a radius of 50 m and a lava flow thickness 0.25 m thick are used (Table
2.1). These estimates yield an erupted volume of 1.67·105 m3. The proportion of

36
incorporated tephra by mass that may have been entrained in the erupted lava can then be
determined using the DRE of the buried tephra and erupted lavas (Table 2.2). This
eruptive volume and a density of 2150 kg/m3 yields a total eruptive mass of 3.57 x 10⁸ kg
of lava. The maximum possible mass fraction of tephra in the erupted Thríhnúkagígur
lavas is therefore 29%.
2.5 Discussion
A challenge for evaluating crustal assimilation in Iceland, and more generally at
ocean islands, is that these components have the same basaltic bulk compositions as the
magmas that intrude them. Without any knowledge of the physical and chemical
characteristics of potential crustal contaminants, it is nearly impossible to constrain their
contribution to mantle-derived magmas. The buried tephra could not have been identified
as a component in the Thríhnúkagígur lavas if only the lavas had been examined in
isolation. The unique exposure provided in the cave where the buried tephra is exposed
allows for it to be identified as a possible basaltic crustal contaminant. Direct field
observations and the physical properties of the crustal contaminant (fine-grained, poorly
consolidated, glassy, etc.) are critical to interpreting their role in magma production and
eruption dynamics.
2.5.1 Cave formation
Without a major edifice loading the crust at Thríhnúkar, and in the absence of a
central magma chamber, local asperities in the uppermost crust should be the secondary

37
control on the orientation of the dike after the regional stress field. Indeed, this is
observed in Thríhnúkagígur’s internal structure. The vertical sheet-like structure of the
dike along the length and height of the cave supports a dominant regional stress field
even in the uppermost crust, with the minimum stress in the north-northeast direction
(Clifton et al., 2002; Clifton and Kattenhorn, 2006; Keiding et al., 2008; Keiding et al.,
2009). The dike ruptured the surface up to 1.5 km away from Thríhnúkagígur to the
north-northeast where several smaller volume cones are mapped as part of the
Thríhnúkagígur event (Figure 2.1; Sæmundsson, 2006) demonstrating that it or a series of
en echelon dikes behaved uniformly over at least a couple of kilometers.
In addition to this primary control on dike orientation, the unconsolidated buried
tephra is much less competent than the overlying laterally continuous basalt flows, acting
as a less resistant pathway for magma to travel to the surface. This preexisting structure is
a local heterogeneity that likely guided and concentrated the magma during its final
ascent to the surface. Evidence of magmatic erosion or scouring of the tephra is preserved
in proto-conduits that penetrate into the buried tephra. These structures are seen in
contact with or immediately adjacent to the dike and are always seen intruding into the
tephra. The flowback-lined walls of proto-conduits in the deepest extent of the SW end of
the cave suggest that magma acted as an erosive fluid that entrained the fine-grained,
poorly consolidated buried tephra.
The location of the plugged conduit directly above the highest point in the
remnant buried tephra cone is consistent with the idea that at initial stages of eruption,
flow of magma could have been funneled by the tephra’s cone-like geometry to the
surface. Without a corresponding surface feature, the plugged conduit either did not

38
actually feed an eruption, or any cone that it may have constructed was subsequently
buried by the main cone of Thríhnúkagígur. Ultimately, the dike became more favorable
than the plugged conduit for erupting lavas at the surface. The location of the buried
tephra cone directly below the main cone may indicate that the tephra still acted to
concentrate the eruption at this location. This may also explain why the main cone of
three different monogenetic eruptions – the Thríhnúkar complex – all occur within a few
hundred meters of each other.
The eruption at Thríhnúkagígur was likely Hawaiian to mildly Strombolian in
style. Fire fountaining associated with the opening of the fissure would have focused into
the main cone over time. This would have also focused rising gas pockets, such as the 0.5
m long gas bubble observed in the dike deep at the SW end of the cave and may reflect a
shift to a more Strombolian eruption with punctuated explosions. Repeated, extremely
thin (2-5 cm) lava flows indicate flow back (Figure 2.3) into the vent and are consistent
with repeated bursts of lava erupting through the main conduit. Punctuated explosions
associated with slug flow would allow lava to drain back into the conduit repeatedly.
These observations point towards a low viscosity magma with intermediate to high gas
content, which is also consistent with the thin (~0.25 m), vesicle-rich lava flows and
Pele’s tears observed on the surface of the cone.
A plausible scenario to explain the formation and preservation of the cave beneath
Thríhnúkagígur is that unconsolidated or poorly consolidated material (the buried tephra)
was entrained by the erupting magma as the diking event progressed. Assuming that the
volume of the present day cave represents the maximum amount of tephra that could have
been incorporated into Thríhnúkagígur lavas, 10-29% of the lava could be derived from

39
the buried tephra cone. The buried tephra under Thríhnúkagígur, coupled with the
vacancy below the main cone, demonstrates that incorporation of poorly consolidated,
low-density material can occur rapidly, even during the course of an eruption if
conditions are favorable. Up to 29% by mass of tephra may be incorporated in this
manner.
The schematic diagram in Figure 2.13 illustrates a conceptual model for cave
formation in two views. The diagram on the left is a cross-section within the plane of the
dike that fed the eruption of Thríhnúkagígur. The right hand side is a diagram of a cross-
section perpendicular to the dike. The model begins with the eruption of a tephra cone
(Figure 2.13a) and then buried by subsequent lava flows (Figure 2.13b), which continue
to accumulate through time until 3500 BP. Figures 2.13c and 2.13d show the initial
stages of eruption where the dike cross-cuts the buried tephra cone and lava flows, and
then erupts at the surface. As the eruption progresses, tephra becomes entrained in the
ascending magma; and simultaneously the fissure transitions from erupting along its
entire length to focusing into a couple of vents (Figure 2.13e). At the final stage of
eruption, the dike has focused into a pair of adjacent vents that form the main spatter
cone (Figure 2.13f). Figure 2.13g shows the cave profile at present after cave-ins have
filled in part of the remnant buried tephra cone with debris.
2.6 Conclusions
Monogenetic fissure eruptions typically accommodate far field stresses, but the
orientation and propagation of dikes that intrude the crust or result in eruptions may also

40
be affected by a local stress field or preexisting crustal structures (Muirhead et al., 2015).
At Thríhnúkagígur, the orientation of the eruptive fissure was consistent with
accommodation of the far field stress regime, ascending to the surface as a vertical planar
dike. The preexisting buried tephra cone did not affect the geometry or orientation of the
dike as it propagated into the overlying lava flows to the surface; however, the location of
the main cone of Thríhnúkagígur probably resulted from the anisotropy produced by the
presence of a buried tephra cone at depth. The low density, fine-grained unconsolidated
tephra is less competent than the surrounding and lava flow that bury it, as demonstrated
by the numerous proto-conduits extending into it. The buried tephra very likely provided
a preferential pathway for the ascending magma thereby concentrating flow through
fissure at the main cone of Thríhnúkagígur. Here, evidence suggests that small-scale
structures in the shallow crust do not influence the orientation or geometries of fissure
eruption, but they may play a role in the location of the main vents that develop as the
eruption progresses.
Moreover, as the flow of magma was focused through the buried tephra, the
ascending magma scoured out, entrained, and erupted the unconsolidated buried tephra
with it. This the preferred model for the development of the subterranean cave below the
Thríhnúkagígur cone. Numerous proto-conduits fingers extend off the dike up into the
overlying tephra dike at depth in the cave, providing evidence for erosion of the buried
tephra by the ascending magma. A minimum estimate of the erupted volume of lava from
Thríhnúkagígur from field observations and a geologic map by Sæmundsson (2006) were
compared to the volume of the cave from LiDAR scans. The DRE of the buried tephra

41
and lava were then used to find that the maximum percent by mass of tephra that could be
in the lavas is 29%.
The rapid incorporation of the buried tephra into the erupting magma
demonstrates that magmas may be contaminated rapidly and to a significant extent by
shallow crustal components. If not for this unique exposure of the tephra in the cave, the
buried tephra could not have been identified as a component in the Thríhnúkagígur lavas
and this shallow crustal contamination would have been untraceable. The unconsolidated,
poorly crystalline, and fine-grained nature of the tephra facilitated its ingestion and
similar properties are advantageous for deeper crustal assimilation as well.

42
Table 2.1. Estimates of Thríhnúkagígur lavas volumes and calculation of tephra contents.
Cone
Height
(m)
Cone
Radius
(m)
Cone
Volume
(m3)
Flow
Area
(m2)
Flow
Thickness
(m)
Minimum
Erupted
Volume
(m3)
Dense
Rock
Equivalent
(kg/m3)
Minimum
Erupted
Mass (kg)
Cave
Volume
(m3)
Tephra
Density
(kg/m3)
Maximum
Tephra
Mass (kg)
% Tephra by
Mass
30 50 78,500 350,000 0.25 166,500 2150 3.57E+08 40,000 2550 1.02E+08 29%
Table 2.2. Densities of Thríhnúkagígur lava and buried tephras.
Sample ID Mass (g) Volume (mL) Density (kg/m3)
Lava TNG-14-33 4.268 1.5 2850
Buried tephra TNG-14-22 4.071 1.6 2540
Buried tephra TNG-14-32 13.801 5.4 2560

43
Figure 2.1. Map of the Thríhnukar fissure system modified from Sæmundsson (2006). Samples are shown in black stars. Subterranean samples are
excluded from this map, but are generally located underneath the Thríhnúkagígur spatter cone in red.

44
Figure 2.2. Two vents comprise the main cone of Thríhnúkagígur. The northern vent (left) became plugged towards the end of the eruption, while
the southern vent (right, with scaffolding) remained open, providing an entrance to the cave below. Photo from P. LaFemina.

45
Figure 2.3. Succession of thin (2-5 cm) lava flows back into the vent at the summit of Thríhnúkagígur. Photo from P. LaFemina.

46
Figure 2.4. LiDAR scan of the interior of the cave at Thríhnúkagígur. Green and blue coloring represents different reflectivities of the rock. The
dike, plugged conduit, and the buried tephra appear in blue. The image on the left is a view parallel to the orientation of the dike. The view on the
right is perpendicular to the orientation of the dike.

47
Figure 2.5. Magma flowback rivulets on a fallen block in the cave. Photo from P. LaFemina.

48
Figure 2.6. Stalactites of lava that dripped back into the cave during and/or following the eruption. Photo from P. LaFemina.

49
Figure 2.7. The NNE cave wall. A photo mosaic by P. LaFemina is simplified in a cartoon depicting the dike and tephra with sample locations.

50
Figure 2.8. Representative buried tephra (right; TNG-14-15) is poorly consolidated compared to the well-
welded hyaloclastite (left) collected at the from the gentle dipping hyaloclastite unit postulated by
Sæmundsson (2006).
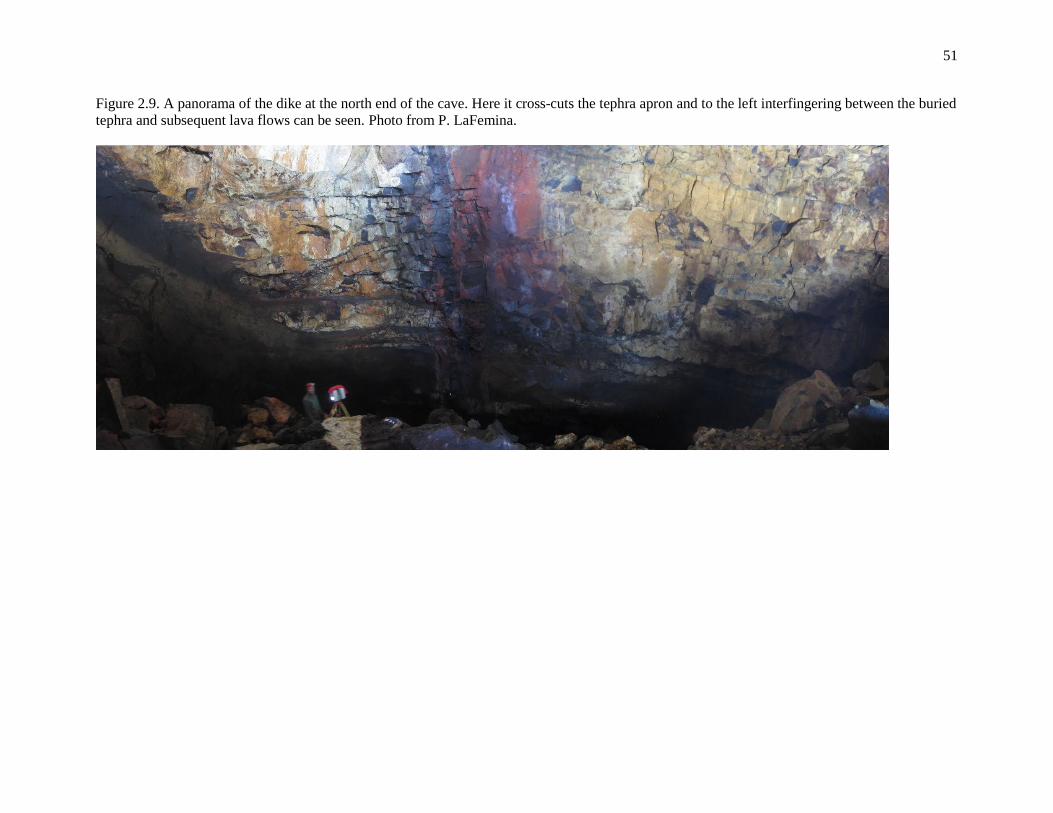
51
Figure 2.9. A panorama of the dike at the north end of the cave. Here it cross-cuts the tephra apron and to the left interfingering between the buried
tephra and subsequent lava flows can be seen. Photo from P. LaFemina.

52
Figure 2.10. Photograph of the interior of the cave. The plugged conduit is the roundish purple feature on the left. The dike is the vertical purple-
black feature on the right. The buried tephra cone on the bottom left if black.

53
Figure 2.11. A ~0.5 m long gas pocket in the center of the dike.

54
Figure 2.12. LiDAR scan of the Thríhnúkagígur cone and cave with the location of the largest of the proto-conduits indicated (a). A LiDAR scan
of the main proto-conduit shows its geometry in greater detail (b).

55
Figure 2.13. Stages of Thríhnúkagígur formation starting with the formation (a) and burial of the tephra
cone (b), followed by dike injection (c) and eruption along a fissure (d). As the eruption continues, the
magma both progressively entrains more tephra from depth and narrows from a fissure into a couple of
vents (e anf f). Part g shows the present day outline of the cave. The left hand side of the diagram shows a
cross-section within the plane of the dike. The left shows a cross-section perpendicular to the dike.

56
Figure 2.13 (d-f) continued.

Figure 2.13 (g) continued.

References
Biggs J., Chivers M. and Hutchinson M. C. (2013) Surface deformation and stress
interactions during the 2007-2010 sequence of earthquake, dyke intrusion and
eruption in northern Tanzania. Geophys. J. Int. 195, 16–26.
Calais E., D’Oreye N., Albaric J., Delvaux D., Déverchère J., Ebinger C., Ferdinand R.
W., Kervyn F., Macheyeki A. S., Oyen A., Perrot J., Saria E., Smets B., Stamps D.
S. and Wauthier C. (2008) Strain accommodation by slow slip and dyking in a
youthful continental rift, East Africa. Nature 456, 783–788.
Clifton A. E. and Kattenhorn S. A. (2006) Structural architecture of a highly oblique
divergent plate boundary segment. Tectonophysics 419, 27–40.
Clifton A. E., Sigmundsson F., Feigl K. L., Gunnar Guðmundsson and Árnadóttir T.
(2002) Surface effects of faulting and deformation resulting from magma
accumulation at the Hengill triple junction, SW Iceland, 1994-1998. J. Volcanol.
Geotherm. Res. 115, 233–255.
Fronval T. and Jansen E. (1997) Eemian and Early Weichselian (140–60 ka)
Paleoceanography and paleoclimate in the Nordic Seas with comparisons to
Holocene conditions. Paleoceanography 12, 443.
Genareau K., Valentine G. A., Moore G. M. and Hervig R. L. (2010) Mechanisms for
transition in eruptive style at a monogenetic scoria cone revealed by microtextural
analyses (Lathrop Wells volcano, Nevada, U.S.A.). Bull. Volcanol. 72, 593–607.
Harp A. G. and Valentine G. A. (2015) Shallow plumbing and eruptive processes of a
scoria cone built on steep terrain. J. Volcanol. Geotherm. Res. 294, 37–55.
Keating G. N., Valentine G. A., Krier D. J. and Perry F. V. (2007) Shallow plumbing
systems for small-volume basaltic volcanoes. Bull. Volcanol. 70, 563–582.
Keiding M., Árnadóttir T., Sturkell E., Geirsson H. and Lund B. (2008) Strain
accumulation along an oblique plate boundary: The Reykjanes Peninsula, southwest
Iceland. Geophys. J. Int. 172, 861–872.
Keiding M., Lund B. and Árnadóttir T. (2009) Earthquakes, stress, and strain along an
obliquely divergent plate boundary: Reykjanes Peninsula, southwest Iceland. J.
Geophys. Res. Solid Earth 114, 1–16.

59
Muirhead J. D., Kattenhorn S. A. and Le Corvec N. (2015) Varying styles of magmatic
strain accommodation across the East African Rift. Geochemistry Geophys.
Geosystems, 1541–1576.
Németh K. and Kereszturi G. (2015) Monogenetic volcanism : personal views and
discussion. Int. J. Earth Sci. 104, 2131–2146.
Németh K. and White J. D. L. (2003) Reconstructing eruption processes of a Miocene
monogenetic volcanic field from vent remnants: Waipiata Volcanic Field, South
Island, New Zealand. J. Volcanol. Geotherm. Res. 124, 1–21.
Sæmundsson K. (2008) Þríhnúkagígur Helstu niðurstöður kjarnaborana.
Sæmundsson K. (2006) Þríhnúkagígur Jarðfræðirannsóknir og tillögur.,
Sæmundsson K., Jóhannesson H., Hjartarson Á., Kristinsson S. G. and Sigurgeirsson M.
Á. (2010) Geological Map of Southwest Iceland, 1:100,000.
Sigmundsson F., Hooper A., Hreinsdóttir S., Vogfjörd K. S., Ófeigsson B. G., Heimisson
E. R., Dumont S., Parks M., Spaans K., Gudmundsson G. B., Drouin V., Árnadóttir
T., Jónsdóttir K., Gudmundsson M. T., Högnadóttir T., Fridriksdóttir H. M., Hensch
M., Einarsson P., Magnússon E., Samsonov S., Brandsdóttir B., White R. S.,
Ágústsdóttir T., Greenfield T., Green R. G., Hjartardóttir Á. R., Pedersen R.,
Bennett R. a, Geirsson H., La Femina P. C., Björnsson H., Pálsson F., Sturkell E.,
Bean C. J., Möllhoff M., Braiden A. K. and Eibl E. P. S. (2015) Segmented lateral
dyke growth in a rifting event at Bárðarbunga volcanic system, Iceland. Nature 517,
191–5.
Stefánsson Á. B. (1992) Þríhnúkagígur. Náttúrufræðingurinn 61, 229–242.
Valentine G. A. (2012) Shallow plumbing systems for small-volume basaltic volcanoes,
2: Evidence from crustal xenoliths at scoria cones and maars. J. Volcanol.
Geotherm. Res. 223-224, 47–63.
Wood C. A. (1980) Morphometric evolution of cinder cones. J. Volcanol. Geotherm. Res.
7, 387–413.
Wright T. J., Ebinger C., Biggs J., Ayele A., Yirgu G., Keir D. and Stork A. (2006)
Magma-maintained rift segmentation at continental rupture in the 2005 Afar dyking
episode. Nature 442, 291–294.

60
Chapter 3
Magma genesis at Thríhnúkagígur, Reykjanes Peninsula, Iceland:
Implications for magmatic plumbing structure at monogenetic volcanic fields
3.1 Introduction
The Reykjanes Peninsula, in the absence of central volcanoes and large
homogenizing magma chambers, is dominated by monogenetic basaltic fissure eruptions.
With a few exceptions (Gee et al., 1998a; Gee et al., 2000), the geochemistry of lavas on
the Reykjanes Peninsula has been interpreted to primarily reflect the mantle sources that
generated these melts. Recent unrest in the region (Clifton et al., 2002; Michalczewska et
al., 2012) reflects that magma is injected and stored in the crust, so it is necessary to
understand both the magmatic plumbing structure of these intrusions and the effect of
magma storage in has on the geochemical evolution of these magmas.
Radiogenic isotope analysis has traditionally formed the bulk of the mantle source
characterization for Reykjanes Peninsula lavas, and lavas across Iceland more generally
because of the plume-ridge interactions and intrinsic chemical heterogeneities within the
plume. However, some authors suggest that these isotopes, and Sr in particular, could be
affected by interaction with or assimilation of hydrothermally altered basalts during a
magma’s residence in the crust (Gee et al., 1998a; Gee et al., 2000). Because mantle
sources have been debated extensively with samples from a much greater geographic area
than the single location of Thríhnúkagígur (Condomines et al., 1983; Hanan and
Schilling, 1997; Chauvel and Hémond, 2000; Skovgaard et al., 2001; Stracke et al., 2003;

61
Kokfelt et al., 2006; Kitagawa et al., 2008; Peate et al., 2010; Koornneef et al., 2012;
Rudge et al., 2013; Shorttle et al., 2013; Manning and Thirlwall, 2014), source
geochemistry is not the main focus of this study. Rather, results of Sr-Nd-Pb isotope
ratios in lavas from Thríhnúkagígur are discussed primarily within the context of the
literature that has attempted to define specific mantle source compositions on the
Reykjanes Peninsula (Hanan and Schilling, 1997; Thirlwall et al., 2004; Kokfelt et al.,
2006; Kitagawa et al., 2008), to evaluate the potential to use Sr as a tracer of crustal
contamination of Thríhnúkagígur magmas.
Using a combined major and trace element and Sr-Nd-Pb isotope geochemical
approach this work seeks to understand, from source to surface, the evolution of magma
erupted at Thríhnúkagígur. The unique exposure offered by the cave below the main cone
of Thríhnúkagígur allows sampling of the intrusive part of the system and older buried
tephra in addition to the surficial lavas. Heterogeneity in the compositions from different
part of the system suggests a magmatic plumbing structure that does not homogenize
mantle-derived melts. Geophysical and geodetic observations of other intrusions and
fissure eruptions provide a context in which to invoke a magmatic plumbing system that
may preserve geochemical variations.
3.2 Sample descriptions
At the surface, one Miðhnúkur and four Thríhnúkagígur lava samples were
collected for analysis (Figure 2.1). A sample of vent spatter at the summit of
Thríhnúkagígur from a previous sampling campaign was also prepared for analysis.
Within the cave, 5 dike samples, one sample of the fallen intrusive plug, and 6 buried

62
tephra samples were collected for geochemical analysis. Photograph mosaics and
sketches provide sample locations within the main chamber of the cave (Figures 2.4, 2.5).
3.2.1 Surface lavas
Lavas from Thríhnúkagígur are highly vesicular (18-36.5% by volume) and
relatively glassy with <15% plagioclase phenocrysts (Table 3.1; Figure 3.1a, b). Samples
TNG-14-33 and TNG-14-34 were collected from some of the thicker flow tops (~20 cm)
in the area as outcrops with exposures of the interior of the H146 flow were not found.
TNG-14-37 was taken from the lip of a former lava lake. TNG-14-32 is from a small
flow from a flank vent on the main cone that traveled into the lava lake depression after
the lava had cooled and/or drained.
One sample, TNG-14-35, was collected from a laterally more extensive, older
Holocene flow from Miðhnúkar (H145). Miðhnúkar flows are easily distinguishable from
the Thríhnúkagígur lavas as they contain macroscopic olivine phenocrysts (Figure 3.1f)
rather than plagioclase.
3.2.2 Dikes
The dike is heterogeneous and samples were taken from a variety of different
outcrops. Samples were taken from the interior of the dike, a 6 cm thin dike that splays
off of the main dike, and a chilled margin of the dike. Samples from the interior of the
dike tend to be more vesicular, have larger plagioclase phenocrysts, and courser
groundmass compared to the margin of the dike. These changes are typically gradational,

63
but TNG-14-27e (exterior; Figure 3.1c) and TNG-14-27i (interior; Figure 3.1d) shared a
sharp contact. These two samples are the most contrasting dike samples as TNG-14-27i
has flow banding and interstitial clinopyroxene between the plagioclase phenocrysts,
while TNG-14-27e is devoid of phenocrysts and vesicles, and has a fine-grained
groundmass.
3.2.3 Plugged conduit
This is the only sample that was not collected in situ. TNG-14-18 was collected
immediately below an intrusive, partially hollow structure on the cave ceiling.
Weathering of the cave walls to a yellow color contrasted the reddish-purple altered
surfaces of this feature. It is notable for being aphanitic with very few phenocrysts.
3.2.4 Buried tephras
Tephra samples consist of primarily glassy, vesicular clasts (Figure 2.8); however,
the total crystallinity, gas content, grain size distribution, and degree of alteration of the
clasts is variable. Samples may contain clasts that are exclusively fresh and black or have
a mixture of black and brown glasses. Clasts that are larger than 5 mm are present in most
samples although they rarely exceed 2-3 cm. Grain mounts were made for 4 of the 6
tephra samples. The grain mounts excluded clasts larger than 5 mm. The two exceptions
for which no grain mounts were made are TNG-14-17, which is a fist sized scoria clast
and TNG-14-28, which was consolidated and contained some sedimentary structure.
Neither is representative of the bulk tephra pile. Free whole crystals of plagioclase and

64
olivine occur, while broken fragments of large plagioclase crystals are the most common
crystalline clast type. There are also rare plagioclase and plagioclase-olivine
glomerocrysts.
3.3 Methods
Samples were cut into centimeter thick slabs and the weathered edges were
trimmed off of the slabs with a ceramic tile saw and polished to remove saw marks. Thin
section billets were cut from the slabs and sent to Spectrum Petrographics to make
standard 30 μm microprobe polished thin sections. The remaining slabs for each sample
were chipped into millimeter sized pieces with a ceramic jaw crusher. Tephras were
rinsed in an ultrasonic bath of milliQ water for 1 hour and dried. Tephras and rock chips
were transferred into a tungsten carbide shatterbox and run for 20-30 seconds to create a
fine powder.
3.3.1 Point counting
Mineral modes were determined by point counting of thin sections under a
petrographic microscope. Grids of 10 by 20 were used to achieve 200 total counts per
thin section. For the grain mounts of the buried tephra, point counting continued until 150
spots on grains had been counted. For the other thin sections, vesicles were included in
the total of 200 counts.

65
3.3.2 Major element analytical methods
Bulk rock major and trace element compositions were determined at the
Laboratory for Isotopes and Metals in the Environment at The Pennsylvania State
University. Lithium metaborate fusions were made and prepared in nitric acid for major
element analysis. Splits of 100 mg sample powder were weighed and mixed with 1.000 g
of lithium metaborate in preweighed vials. After gently shaking the mixture, it was
transferred to graphite crucibles and placed in a furnace preheated to 900°C. The
crucibles were heated to 1000°C for 10 minutes, then cooled back to 900°C. The
resulting melts were added to 100 ml of 5% HNO3 solutions in Teflon vials with
magnetic stir bars. The solutions were stirred for at least 15 minutes before being
transferred to polyethylene containers for storage. These solutions were analyzed for
major element concentrations using a Perkin-Elmer Optima 5300DV Inductively Coupled
Plasma Atomic Emission Spectrometer (ICP-AES).
3.3.3 Trace element analytical methods
For trace element analysis, 100 mg of powder were weighed out for each sample.
Powders were subsequently digested in three steps; first with a combination of 6N HF
and 8N HNO3, then with 2N HCl, and finally with 4N HNO3. Samples were dried down
between each stage of digestion. Following the final dry down, samples were taken up in
HNO3 and diluted with milliQ water to 2000 times their original weight in a matrix of
~2% HNO3. High concentrations of Ba and Sr required a separate dilution to 5000 times
the original sample weight, also in a ~2% HNO3 solution in milli-Q water. This

66
procedure was also followed for a method blank and five rock standards: BHVO-1, BCR-
1, BR, BIR-1, and JA-1.
Trace elements were analyzed using a Thermo X-Series II Quadrupole
Inductively Coupled Plasma Mass Spectrometer (ICP-MS). The instrumental background
was determined using a 2% HNO3 solution in milli-Q water. Background was found to be
≤0.01 for all elements except Ni and Sc, which were less than 0.1 ppb, and Cu, Cr, and
Zn, which were less than 0.54 ppb. The experimental design started with a method blank
and the five rock standards. The method blank was run again before the samples were
analyzed as unknowns. Calibration lines with an R2 value of greater than or equal to
0.999 were used for determining concentrations of elements in the unknowns. One
standard data point was removed to produce curves for several transition metals and rare
earth elements. Two standard data points had to be removed from the Co, and Ho curves
to produce an R2 of 0.999. The true dilution factors for each sample were determined
based on the initial mass of the powdered sample and the mass of the final diluted sample
for analysis. The concentrations in solution were then multiplied by the dilution factor
(~2000 except for ~5000 for Ba and Sr) to determine the concentration of each analyte in
the bulk rock.
Samples were digested and analyzed in two separate batches. Samples TNG-14-
18 and TNG-14-27e were duplicated in the second analysis. For these replicate analyses,
reported values for most analytes are within 5.0%. The elements Sc, V, Co, Cu, Sr, Ce,
Lu, and U were all within 8.0%. Only Cs (39.0%) and Ta (18.3%) had larger errors.
These two elements occur in concentrations of < 0.5 ppm in these samples and are not
used to predicate any arguments presented herein.

67
3.3.4 Pb, Sr, and Nd isotope analytical methods
Acid digestion, ion exchange chromatography, and isotope ratio measurements of
Pb, Sr, and Nd were conducted at the Consiglio Nazionale delle Ricerche (CNR), Pisa,
Italy. Splits of 200 mg were weighed out for each sample and dissolved in a combined
concentrated HF and HNO3 solution, then HNO3, followed by 7N HCl, and finally with
0.7N HBr. Sample solutions were dried down between each step. Samples were
transferred to centrifuge tubes and centrifuged to remove any residuum before ion
exchange chromatography. Acid digestion and ion exchange chromatography procedures
are described in Appendix A.
Isotope ratios were measured on a Finnigan MAT 262 multi-collector thermal
ionization mass spectrometer (TIMS) running in static mode for Pb and dynamic mode
for Sr and Nd. For Pb isotopic analysis, mass discrimination corrections of 0.15 ± 0.01%
per mass unit relative to the NIST SRM 981 reference standard were applied to
experimental data (Todt et al., 1993). Following this correction, Pb isotope analyses have
2SD within 0.025% per mass unit. Laboratory Pb blanks are routinely between 0.2-0.4
ng, and no blank correction is made.
Ratios of 87Sr/86Sr are normalized to 86Sr/88Sr of 0.1194 and the mean 143Nd/144Nd
ratios are normalized to 146Nd/144Nd of 0.7219. The results of 19 analyses of Sr standard
NIST SRM 987 (SrCO3) gave an average of 0.710227 ± 20 (2SD). Measured values are
corrected to 87Sr/86Sr = 0.710250. Blanks for Sr are <0.3 ng and are negligible. Twenty-
seven analyses of the Nd standard is JNdi-1 yield 0.512104 ± 10 (2SD) and no correction
was made.

68
3.4 Results
3.4.1 Major elements
Lavas from the two eruptions in Thríhnúkagígur fissure system and the buried
tephras exposed at depth within the cave are basalts (Table 3.2; Figure 3.2; Le Bas and Le
Maitre, 1986) with 46.70 – 49.25 wt.% SiO2 and 6.03 – 9.58 wt.% MgO (Mg# 47 – 61).
This range is broadly consistent with tholeiitic Holocene lavas of the Reykjanes
Peninsula (Jakobsson et al., 1978; Gee et al., 1998a; Peate et al., 2009). The dike from the
most recent eruption has 47.23 – 49.25 wt.% SiO2 and 10.78 – 13.20 wt.% Fe2O3T at
relatively constant MgO content (7.54-8.04 wt.%). The buried tephra is the only rock unit
with samples that have a non-zero LOI (0.69 – 2.79 wt.%), suggestive of variable
alteration or weathering. These samples have 14.42 – 16.09 wt.% Al2O3 and 46.70 –
48.38 wt.% SiO2. By comparison, the lavas fed by the main dike are more homogeneous
(Al2O3 = 15.2-15.8 wt.%; SiO2 = 47.7-48.2 wt.%). All unaltered samples have CIPW
norms that are olivine normative (Table 3.3).
Plots of major elements versus MgO show a compositional gap between the
Holocene basalts (MgO ≥ 7.25 wt.%) and the older buried tephras (MgO ≤ 6.78 wt.%).
Thríhnúkagígur lavas and dikes have a steep, positive linear trend for Al2O3 vs MgO,
differing from the buried tephra, which have relatively constant Al2O3. For CaO, the lava
and dike samples show limited compositional range (12.00-13.38 wt.%), while the buried
tephras have lower concentrations (9.79-11.43) that give the whole suite a weakly
positive trend. TiO2 and Fe2O3 increase linearly with decreasing MgO, although several
samples depart from the overall trend (Figure 3.3). The chilled margin (TNG-14-27e) has

69
low TiO2 and Fe2O3 for its MgO while the plugged conduit (TNG-14-18) and Miðhnúkar
(TNG-14-35) have high TiO2 and Fe2O3 for their MgO contents. Concentrations of SiO2
increase with decreasing MgO, but this trend is not continuous across the entire sample
suite (Figure 3.3). Rather, the lava flows and dike samples form a separate trend that is
offset to higher silica for their MgO content relative to the buried tephra samples. One
dike sample from the chilled margin (TNG-14-27e) markedly departs from that slope
with ~1 wt.% more SiO2 than the other lava and dike samples. The alkalis form linear
negative trends with MgO.
The chemical index of alteration (CIA; Nesbitt and Young, 1982) was used to
evaluate the extent of alteration (Figure 3.3). The CIA is defined as 100*[Al2O3/(Al2O3 +
CaO + Na2O + K2O)]. Two visibly altered samples – a surface vent spatter sample (MC-
03-612) and a reworked, partially palagonitized tephra (TNG-14-28) – had a CIA of 58,
compared to CIAs of ≤53 in all other samples. These samples depart from otherwise
linear trends in several major elements when plotted against MgO (Figure 3.3). Values of
CIA for fresh basalts are typically 30-45 (Nesbitt and Young, 1982), so the samples in
this study may have all experienced mild alteration or may have incorporated altered
crust during their ascent through the crust.
3.4.2 Trace elements
Concentrations of the compatible trace elements Ni and Cr decrease with
decreasing MgO. Scandium varies by rock type; buried tephras show a positive trend
with MgO while the Holocene lavas and dikes show a negative correlation.

70
Concentrations of the incompatible elements Sr, Eu, and Pb are inversely correlated with
MgO (Figure 3.4; Table 3.4).
Primitive mantle normalized multi-element diagrams are characterized by strong
positive Nb and Ta anomalies, a positive Ba anomaly, and a large negative Pb anomaly
for all samples (Figure 3.5; Sun and McDonough, 1989). The vent spatter (MC-612-03
with CIA = 58) is the sole exception with a positive Pb anomaly, which is interpreted to
be the result of contamination. The average values for each of the rock units yield similar
patterns for most incompatible trace elements. The buried tephras are enriched relative to
the lava and dike suite, but form generally parallel trends. Strontium has a negative
anomaly in the buried tephras and a positive anomaly for the chilled margin (TNG-14-
27e) and the plugged conduit (TNG-14-18).
Chondrite normalized rare earth element (REE) diagrams display relatively
smooth patterns, decreasing steadily from the light REEs to the heavy REEs (Figure 3.6;
Sun and McDonough, 1989). The chilled margin (TNG-14-27e) and plugged conduit
(TNG-14-18) have the flattest REE patterns ([La/Yb]N = 1.92 and 1.68, respectively) in
samples from Thríhnúkagígur. The buried tephras are the most enriched in all REEs, but
are relatively more enriched in the LREEs, giving rise to a steeper pattern ([La/Yb]N >
2.75). The lavas and the dike samples are intermediate between the buried tephras and the
plugged conduit in terms of REE composition. There is a very subtle positive Eu anomaly
in the chilled margin of the dike (TNG-14-27e). However, no other samples from
Thríhnúkagígur have Eu anomalies, positive or negative.

71
3.4.3 Pb, Sr, and Nd isotopes
There is a positive relationship in the 206Pb/204Pb – 208Pb/204Pb data (Figure 3.7a).
The most radiogenic samples are the buried tephras, although one Holocene
Thríhnúkagígur sample has higher 208Pb/204Pb (Table 3.5). The least radiogenic sample is
the vent spatter (MC-612-03). This sample has exceptionally high Pb concentration (2.40
ppm) and a CIA of 58. It has a large positive Pb anomaly on the primitive mantle
normalized diagram, while all other samples have strong negative Pb anomalies (Figure
3.5). The vent spatter has very similar major and trace element abundances to other lavas
and dikes. This suggests that Pb contamination was added to the sample, so it will not be
considered as representative of any trend or end member. The most unradiogenic sample
considered to be primary is from the dike (TNG-14-24). In general, the Holocene lavas
and dikes have a greater range of 206Pb/204Pb and 208Pb/204Pb than the buried tephra,
especially to lower 206Pb/204Pb ratios.
Ten of eighteen samples plot in a relatively narrow range in 206Pb/204Pb and
207Pb/204Pb (Figure 3.7b). In these 10 samples, ratios of 206Pb/204Pb are between 18.79 and
18.95 and 207Pb/204Pb ratios range from 15.47 and 15.55 (Table 3.5). All but one of the
buried tephras fall within this range. Two additional dike samples fall within this range of
206Pb/204Pb, but with higher 207Pb/204Pb ratios. The remaining six samples form a negative
linear trend (Figure 3.7b).
Ratios of 143Nd/144Nd range from 0.512982 to 0.513066. Despite the narrow
range, the buried tephras are distinct from the lavas and dike samples. With the exception
of the most altered buried tephra sample (TNG-14-28 with CIA = 58), the buried tephras
do not exceed 0.513018 ± 0.000010. A single lava sample has a 143Nd/144Nd value within

72
the tephra range, while all other dike and lava samples have ratios greater than 0.513021.
There is some slight overlap between the buried tephra suite and the dike and lava
samples when error is considered (Table 3.5). The plugged conduit (TNG-14-18) has a
ratio of 0.513039 ± 0.000008, placing it at the high end of the measured 143Nd/144Nd
values.
Three dike samples define the lowest 87Sr/86Sr values of 0.703135 to 0.703143
(Figure 3.8). The other lavas and dikes span the same range of Sr isotope ratios as the
buried tephra. Aside from the buried tephra with the high CIA, only a single lava sample
falls within the reported values for the buried tephras in Nd ratios. The most depleted
(unradiogenic Sr and radiogenic Nd) sample is the same as the most depleted Pb sample,
dike sample TNG-14-24.
3.5 Discussion
3.5.1 Source geochemistry
3.5.1.1 Trace element characteristics
High field strength (HSFE) and rare earth element (REE) ratios illustrate
important differences between SW Iceland (RP and WVZ) and the Eastern Volcanic
Zone. The Reykjanes Peninsula and the Western Volcanic Zone comprise a steeper
positive trend separate from the EVZ on a plot of (La/Yb) N vs. Nb/Zr (Figure 3.9),
suggesting a uniquely Nb-enriched source component in the west. Thríhnúkagígur buried
tephras have the highest (La/Yb)N among the RP and some of the highest Nb/Zr in all of

73
Iceland. Their Nb/Zr ratios are comparable to those of the most enriched EVZ volcanics,
but at much lower (La/Yb)N. If similar mantle source geochemistry is assumed, then
incompatible trace element ratios differences may attributed to melting in the presence of
garnet. The thicker lithosphere in the EVZ should generate deeper mantle melts than on
the RP, so the difference in the SW Iceland and EVZ slopes on the (La/Yb) N vs. Nb/Zr
plot could possibly be attributed to the relative compatibility of Yb garnet in southern
EVZ source region. This is consistent with the slow spreading rates associated with
incipient rifting in the southern EVZ as it propagates to the south (LaFemina et al., 2005).
Ratios of Nb/U, like Nb/Zr, suggest that Nb is anomalously enriched in the RP
mantle relative to the rest of Iceland (Kokfelt et al., 2006; Koornneef et al., 2012),
pointing to different geochemical source domains across the southern Iceland mantle.
Globally, magmas produced at ocean islands and mid-ocean ridges have Nb/U ratios of
47 ± 10 irrespective of Nb bulk concentrations, yet lavas from SW Iceland depart
markedly from this range, with Nb/U as high as 100 (Figure 3.10a; Hofmann et al.,
1986).
A similar pattern is observed for Ce on the RP. Ratios of Ce/Pb remain
remarkably constant for OIBs (25 ± 5; Hofmann et al., 1986), but the Reykjanes
Peninsula and the WVZ are more enriched with values commonly up to 40 (Figure 3.10b;
Hofmann et al., 1986). Rare samples have even higher Ce/Pb ratios up to 51 in the
Western Volcanic Zone and on the RP (Koornneef et al., 2012), including two
Thríhnúkagígur samples.
Strong enrichments in Nb/U and Ce/Pb ratios cannot be attributed to the melting
process because both of these ratios use elements that are nearly equally incompatible.

74
Unlike Yb, which is preferentially compatible in garnet, the source mineralogy does not
exert a differentiating effect on Nb relative to U, or Ce relative to Pb. This suggests that
there is a mantle component unique to the RP that contributes strongly to Thríhnúkagígur
magmas, and the RP more broadly.
3.5.1.2 Sr-Nd-Pb isotope systematics: mantle sources
The melt fraction, melting depth, and source mineralogy can strongly affect trace
element ratios, but do not affect isotope ratios. Several studies have proposed Sr-Nd-Pb
isotopic compositions for mantle sources in Iceland (Hanan and Schilling, 1997;
Thirlwall et al., 2004; Kokfelt et al., 2006; Kitagawa et al., 2008). They converge on
three main sources – an enriched plume source, an EM1-like source, and a depleted
(MORB-like) source. The EM1-like source is specific to the Reykjanes Peninsula in
Holocene basalts (Thirlwall et al., 2004), but is recorded in Tertiary basalts in eastern
Iceland (Hanan and Schilling, 1997; Kitagawa et al., 2008).
Lavas from south Iceland plot primarily along an array between the enriched
plume source and the depleted source in Sr-Nd-Pb isotope space and are subparallel to
the Northern Hemisphere Reference Line on Pb-Pb plots (NHRL; Hart, 1984). The
Reykjanes, Krísuvík, and Brennisteinsfjöll fissure swarms, all part of the Reykjanes
Peninsula, define largely overlapping fields on the 206Pb/204Pb vs. 208Pb/204Pb plot (Figure
3.11; Thirlwall et al., 2004; Kokfelt et al., 2006; Peate et al., 2009). These three fissure
swarms are bracketed by the less radiogenic Pb composition of southern Reykjanes Ridge
(Thirlwall et al., 2004) and the more radiogenic Pb compositions of the volcanic systems
of Hekla (Park 1990; Furman et al., 1995) and Vestmannaeyjar (Furman et al., 1991;

75
Chauvel & Hémond, 2000; Kokfelt et al., 2006; Peate et al., 2010) in the southern EVZ.
Katla has the most radiogenic Pb isotope ratios in south Iceland (Park 1990; Furman et
al., 1995) and acts as the enriched regional end member for both Pb-Pb plots. However,
some Reykjanes Peninsula lavas with lower 206Pb/204Pb are pulled off the NHRL to
higher 208Pb/204Pb relative to 206Pb/204Pb, towards the EM1-like component.
Thríhnúkagígur lavas and dikes plot with other Reykjanes Peninsula lavas on the
206Pb/204Pb vs. 208Pb/204Pb plot (Figure 3.11). The buried tephras and the majority of
Thríhnúkagígur lavas and dikes fall on the binary mixing array defined by south Iceland
lavas between an enriched plume source and a depleted MORB-like source, although
several Thríhnúkagígur lava and dike samples (MC-612-03, TNG-14-24, TNG-14-34,
TNG-14-18, and TNG-14-17) extend slightly off of the array and off of the NHRL
towards the EM1-like source.
The lowest 206Pb/204Pb sample (MC-612-03) is vent spatter from the summit of
Thríhnúkagígur, however, it is not shown on figures in this section because it is
considered to be contaminated (see section 3.4.3). Thríhnúkagígur lavas and dikes define
a field at 206Pb/204Pb ratios consistent with previously reported Brennisteinsfjöll
compositions. Excluding the vent spatter, the field defined by this single eruption at
Thríhnúkagígur is as broad as the entire reported range of previously reported data from
Brennisteinsfjöll (n = 9). Contributions from the EM1-like component are consistent with
some the Thríhnúkagígur lavas and dikes and other Reykjanes Peninsula lavas being
pulled off the NHRL. The buried tephra on the other hand, does not require a contribution
from this source.

76
While only a single enriched plume sources is revealed by the Pb-Pb isotope plot,
an enriched, high-Nb component unique to SW Iceland was identified on the basis of
Nb/U ratios. Plotted against 206Pb/204Pb (Figure 3.12a) and 208Pb/204Pb (Figure 3.12b),
there is a positive correlation between Nb/U ratios and Pb isotope ratios on the
Reykjanes, suggesting that there is a second enriched plume source in south Iceland with
the same Pb isotope compositions but with enriched Nb.
As with the Pb-Pb plots, Figure 3.13 shows that 87Sr/86Sr vs. 143Nd/144Nd ratios
from south Iceland form an array that is bracketed by Katla (relatively radiogenic Sr and
unradiogenic Nd; Park, 1990; Furman et al., 1995) on one end and the southern
Reykjanes Ridge (unradiogenic Sr and radiogenic Nd; Thirlwall et al., 2004) on the other.
Again, the enriched plume source and depleted MORB-like source bound the array,
which includes the Reykjanes Peninsula fissure swarms. Aside from a single Krísuvík
sample that plots with the EM1-like source at higher 87Sr/86Sr, there is no systematic
trend towards this mantle component in the RP data.
Thríhnúkagígur lavas and dikes with the lowest 87Sr/86Sr ratios cluster closely
with previously reported compositions at Brennisteinsfjöll on a plot of 87Sr/86Sr vs.
143Nd/144Nd (Figure 3.13). Most of the other lava and dike samples fit more broadly with
other Reykjanes and Krísuvík lavas, but fall outside the previously defined range of
Brennisteinsfjöll Sr-Nd isotope compositions (Thirlwall et al., 2004; Kokfelt et al., 2006;
Peate et al., 2009). One lava and one buried tephra fall outside of the previously
recognized Reykjanes Peninsula fields, extending in the direction of the EM1-like
component.

77
The Thríhnúkagígur data overlap on Sr-Nd-Pb isotope plots not only with other
Reykjanes Peninsula fissure swarms, but also with lavas from Vestmannaeyjar. The
relatively enriched buried tephra field overlaps with the depleted end of the
Vestmannaeyjar field on the 206Pb/204Pb vs. 208Pb/204Pb plot (Figure 3.11), and the
Thríhnúkagígur lavas, dikes, and buried tephras all fall within the Vestmannaeyjar field
in Sr-Nd isotope space (Figure 3.13). This affinity with Vestmannaeyjar suggests that
similar mantle components may contribute to magma genesis across south Iceland.
Vestmannaeyjar may be the mostly likely location to express geochemical similarities to
the Reykjanes Peninsula because neither the RP nor Vestmannaeyjar have central
volcanoes or are thought to have large magma chambers (unlike Hekla or Katla).
Therefore, their magmas are likely to experience similar processes and evolve by similar
pathways. For example, injections of magma into the crust are have short residence times
in both locations, on the order of decades, and feed small volume (<1 km3) monogenetic
fissure eruptions (Sigmarsson, 1996; Higgins and Roberge, 2007; Koerberle et al., 2015).
Assuming similar isotopic sources, variations between these volcanic systems
may be ascribed to the relative proportions of the different mantle sources contributing to
melt generation, which may be affected by differences in melting depth and melt fraction.
(While this explains isotopic similarities, it still fails to reconcile the differences in Nb/U
between the RP and Vestmannaeyjar as expressed in Figure 3.9, requiring an additional
mantle source.) Additionally, continuous melt extraction at the neovolcanic zones like the
Reykjanes Peninsula could gradually deplete enriched mantle sources. As an enriched
mantle component is repeatedly melted and becomes increasingly less fertile, its
proportional contribution relative to the depleted component is also likely to decrease.

78
The buried tephra is conservatively estimated to be at least 100 ka in age and likely older
because it is believed to have formed during the previous interglacial, which ended at 113
ka (Fronval and Jansen, 1997). Therefore, one possible explanation for the subtle
difference in the Pb and Nd isotopes in the buried tephra and the Holocene lavas and
dikes may be their age difference and the depletion of the enriched plume source beneath
the Reykjanes Peninsula through time.
In addition to the enriched, depleted, and EM1-like mantle sources already
discussed, Thirlwall et al. (2004) propose a fourth mantle source that falls along the south
Iceland array of lava compositions on Pb-Pb and Sr-Nd isotope plots. The contributions
of this source are unclear. This component would have a more moderate 87Sr/86Sr ratio
(~0.7032) than the EM1-like component, and may explain the trend of Thríhnúkagígur
samples on a Sr-Pb isotope plot (Figure 3.14). As with previous isotope plots, the
southern Reykjanes ridge is the most depleted of the south Iceland volcanic systems and
Katla is the regionally enriched end member. The Thríhnúkagígur data fall within the
enriched end of the Reykjanes field, beyond the Brennisteinsfjöll field, with two samples
recording higher 87Sr/86Sr ratios than previously reported for the Reykjanes Peninsula at
206Pb/204Pb ≥ 18.4. While this proposed mantle end member appears promising in Sr-Pb
isotope space, it cannot explain the high 87Sr/86Sr ratios of the sample suite at more
radiogenic Nd ratios. This suggests that the previously defined fourth end member of
Thirlwall et al. (2004) is not the main source of the Sr isotope signature in
Thríhnúkagígur lavas, dikes, or buried tephra, but neither can it be ruled out as a potential
contributor. Another source is still necessary to explain the radiogenic Sr isotope
signature.

79
3.5.1.3 Sr isotopes: potential crustal contributions
The low 206Pb/204Pb lava and dike samples that may require an EM1-like
component are not the same samples that trend toward the EM1-like source in Sr-Nd
isotope space. Dike sample TNG-14-24 has lowest 206Pb/204Pb (excluding vent spatter,
which is interpreted to be contaminated) and lowest 87Sr/86Sr and highest 143Nd/144Nd of
the lava and dikes. If TNG-14-24 reflected a larger contributions from an EM1-like
source, it would be expected to have the highest or among the higher 87Sr/86Sr samples
measured. Likewise, the buried tephra extend more radiogenic Sr ratios (Figure 3.13), but
do not extend towards the EM1-like component on Pb-Pb plots (Figure 3.11). The
inconsistent behavior of individual samples and the buried tephra in regards to EM1-like
source contributions suggests that Sr isotopes may be decoupled from Pb and Nd isotopes
and that the EM1-like source is in fact relatively minor at Thríhnúkagígur.
The lack of a systematic trend in any of the RP fissure swarms towards the EM1-
like component on the 87Sr/86Sr vs. 143Nd/144Nd (Figure 3.13) or 206Pb/204Pb vs. 87Sr/86Sr
(Figure 3.14) plots lends support to the hypothesis that altered crust contributes to the
genesis of Reykjanes Peninsula magmas (Gee et al., 1998a). A crustal component
hydrothermally altered by seawater, as given by Gee et al. (1998a) plots near the EM1-
like component (Figure 3.13). The broad array defined by Icelandic lavas in the Sr-Nd
isotopes compared to the tight array in Pb-Pb isotopes is consistent with variable
contributions to mantle-derived magmas by a highly radiogenic 87Sr/86Sr hydrothermally
seawater-altered crustal component. With 87Sr/86Sr ratios in excess of 0.7042 in drill

80
cores from modern RP geothermal systems (Elderfield and Greaves, 1981), even small
amounts of contamination to these lavas could produce notable changes to the parental Sr
isotopic composition. Hydrothermally altered crust (HAC) is likely to have a much
stronger effect on Sr isotopes than Nd or Pb isotopes because it is both fluid mobile and
there is a large and highly radiogenic reservoir of Sr in the ocean. So although a single
point is plotted for HAC on Figure 3.23, small contributions from seawater-altered crust
may shift magma compositions towards more radiogenic 87Sr/86Sr values at invariant
143Nd/144Nd ratios.
3.5.1.4 Summary
The anomalous Nb/U and Ce/Pb ratios in lavas on the Reykjanes Peninsula may
not be adequately explained by the three major sources proposed for Iceland. The
isotopically enriched plume source is common to all of Iceland and contributes more to
lavas in the southern EVZ, such as Hekla and Katla, than on the RP. Therefore, Nb/U or
Ce/Pb ratios would be expected to be higher in the southern EVZ than on the RP if it
were a signature of the enriched plume component. Based on the Pb isotope vs. Nb/U
plots (Figure 3.12), high Nb does not seem to be a characteristic of the depleted
component, which is partially defined by its depletion in trace elements, particularly Nb
(Thirlwall et al., 2004). An additional source with Pb isotopic compositions similar to the
enriched mantle plume source must be present beneath the RP, characterized by
unusually high Nb/U and Ce/Pb that sets it apart from the enriched component beneath
the Eastern Volcanic Zone.

81
Of the Sr-Nd-Pb isotope systematics, only Pb hints at the EM1-like component’s
contribution to Thríhnúkagígur lavas and dikes with slightly higher 208Pb/204Pb in some
samples for their 206Pb/204Pb ratios. This component does not contribute to the buried
tephras on the 206Pb/204Pb vs. 208Pb/204Pb plot, contradicting the Sr-Nd isotope plot where
the high 87Sr/86Sr component contributed equally to the buried tephra as to the lavas and
dikes. It is therefore unlikely that the EM1-like source is responsible for the highly
radiogenic Sr isotope ratios. Similarly, the sample (TNG-14-24) with the seemingly
largest EM1-like signature on the Pb-Pb plot, has the least radiogenic Sr composition,
further demonstrating that the Sr isotopes are decoupled from Pb and Nd isotopes. The
highly radiogenic 87Sr/86Sr ratios observed at Thríhnúkagígur suggest a basaltic crustal
component that has been hydrothermally altered by seawater.
On the basis of radiogenic isotopes and Nb/U ratios, there may be up to 5 mantle
sources that contribute to Thríhnúkagígur magmas as well as a hydrothermally altered
crustal component. These are 1) the depleted source, 2) the EM1-like source, 3) the
enriched plume source with Nb/U ratios more typical of MORB and OIB lavas, 4) the
enriched plume source with enriched Nb, and 5) the source proposed by Thirlwall et al.
(2004) similar to the depleted source, but with 87Sr/86Sr ratios between the depleted and
the EM1-like source. It is more likely that there are 2 mantle source domains – the
depleted source common to all of southern Iceland and Nb-enriched plume source unique
to the Reykjanes Peninsula – that are significant in generating Thríhnúkagígur magmas,
possibly with minor contributions from an EM1-like source. A fourth component
characterized by high 87Sr/86Sr that is decoupled from Nd and Pb isotope values likely has
its origins in the crust.

82
3.4.2 Magmatic processes
3.5.2.1 Fractional crystallization
The samples from Thríhnúkagígur form a nearly horizontal trend on a plot of
CaO/Al2O3 vs. MgO (Figure 3.4), which indicates olivine-dominated fractional
crystallization and removal in this system. The slight decrease in CaO/Al2O3 with
decreasing MgO in the buried tephra is consistent with removal of clinopyroxene. Some
lava and dike samples show a range to higher Ca/Al2O3 over a limited range of MgO,
which suggests that plagioclase may have been removed from these samples.
Fractional crystallization is evident from the major and trace element variations
with MgO in Thríhnúkagígur lavas and dikes as well as in the buried tephra. Both Ni and
Cr show a positive correlation with MgO, indicating that olivine is the dominant mafic
phase during fractional crystallization (Figure 3.4), as these elements are all compatible
in olivine. Scandium, which is compatible in clinopyroxene, decreases with decreasing
MgO in the buried tephras (Figure 3.4). Conversely, there is a negative trend in Sc with
MgO in the Thríhnúkagígur lavas and dikes, which is consistent with an increase of
incompatible elements in the residual magma as olivine (but not clinopyroxene) is
partitioned out of the system.
Strontium and europium are generally incompatible in mafic phases, but are
compatible in anorthitic plagioclase. Strontium anomalies behave similarly to those in Eu
(Figure 3.5), but whereas the Eu anomalies were subtle if present, the negative Sr
anomaly in the buried tephra and the positive anomalies in the lavas and dikes are
obvious on multielement diagrams (Figure 3.5). Primitive mantle normalized Sr values

83
converge on a relatively narrow range of values (8.37-12.1) across sample suites
compared to other elements. Plagioclase accumulation or removal could possibly explain
the variations in the Sr and Eu data. Alternatively, these data could be interpreted as
being consistent with lithospheric buffering of magma before its injection into the crust.
If the melt was generated in or approached equilibrium with plagioclase-bearing
peridotite in the lithospheric mantle prior to intruding the crust (Gee et al., 1998a), a more
discrete range of Sr and Eu would be expected. Regardless of possible lithospheric
interaction, the Eu/Eu* values close to unity suggest that plagioclase fractionation plays a
relatively small role in the evolution of lavas, dike, and buried tephras.
3.5.2.2 Assimilation of hydrothermally altered basaltic crust
Hydrothermal alteration by seawater shifts basaltic compositions towards more
radiogenic 87Sr/86Sr ratios. Previous studies have used Sr isotope ratios to argue that
assimilation of crust altered by seawater contributes in excess of 20% to magmas in south
Iceland during their residence in the crust (e.g. Sigmarsson et al., 1991; Sigmarsson et al.,
1992; Gee et al., 1998a). Oxygen has also been used to investigate the assimilation of
altered crust (Bindeman et al., 2006; Bindeman et al., 2008), because the major element
oxygen is a more robust tracer than trace-level Sr. But even oxygen isotopes are not a
well-agreed upon proxy. Other authors alternatively interpret anomalously light oxygen
isotope ratios to be a reflection of a recycled oceanic crustal component in the mantle
plume beneath Iceland (Kokfelt et al., 2006).
Hydrothermally altered crust contains secondary and hydrated minerals that give
it a lower density than unaltered basalt, and perhaps a lower density than basaltic

84
magmas. This density contrast can cause the ascending magma to stall and form sill-like
bodies (Taisne et al., 2011). Mechanisms that may allow for continued ascent include
increasing the pressure in the magma body, magmatic etching of a pathway through the
altered crust, or the assimilation of altered crust until the density of the magma is lowered
enough to continue to ascend buoyantly. Given that the altered crust plays a role in
stalling magmas in the crust, perhaps it should be expected that there is some amount of
interaction with a crustal component that may contribute to Icelandic magmas.
Nevertheless, there are few geochemical tools available to unambiguously trace
the bulk assimilation of basaltic crust in basaltic magma. The preponderance of seawater-
dominated hydrothermal systems on the Reykjanes Peninsula allows for 87Sr/86Sr ratios to
be used to model contamination of magmas in this part of Iceland (Raffone et al., 2008;
Marks et al., 2015). This is because seawater has much more radiogenic Sr than Icelandic
basalts and it has been shown to impart ratios as high as 0.7042 on altered basalts in the
Reykjanes fissure system (Elderfield and Greaves, 1981). If the Thríhnúkagígur Sr
isotopes are assumed to be derived partially from a hydrothermally altered basaltic
component at depth, a maximum estimate of crustal contamination can be determined.
This model builds off of the work of previous studies that use a hydrothermally altered
crustal component to explain the range of 87Sr/86Sr and 18O in fresh basalts on the
Reykjanes Peninsula; they measure compositions extending to radiogenic values of
87Sr/86Sr = 0.703295, and very light values of δ18O = +3‰ on the Reykjanes Peninsula
(Gee et al., 1998a; Gee et al., 1998b; Peate et al., 2009).
In order to assess the possible contributions of hydrothermally altered crust,
potential mixing between Sr and Nd end members in the Thríhnúkagígur system are

85
modeled. The model in Figure 3.15 shows two binary mixing trends on a Sr-Nd isotope
plot. The first is a single, nearly horizontal mixing curve between dike sample TNG-14-
24 and a conservative hydrothermally altered crustal component proposed by Gee et al.
(1998a). The dike sample is chosen as a mixing end member because it has the least
radiogenic Sr isotopic composition (as well as the least radiogenic Pb and most
radiogenic Nd isotopes) of any of the lavas and dikes. The large range of 87Sr/86Sr ratios
reported in modern geothermal systems (Elderfield and Greaves, 1981) makes a ratio of
0.7036 a probable minimum estimate. The combination of the most depleted dike sample
and a minimum estimate for the crustal component will yield a maximum estimate for the
amount of assimilated hydrothermally altered crust in the suite of Thríhnúkagígur lavas
and dikes.
The mixing curve between the theoretical altered crustal composition and the dike
show that a maximum of 25% hydrothermally altered crust may explain the full range of
Thríhnúkagígur lavas and dike compositions in Sr-Nd isotope space. The majority of the
samples may be explained by less than 15% of the crustal component. It is important to
emphasize that these represent maximum estimates. True quantities of crustal
contamination could be much lower if the altered crust has a more radiogenic 87Sr/86Sr
value than 0.7036; which seems likely given the observed values in modern geothermal
systems (Elderfield and Greaves, 1981), or if there is a range of 87Sr/86Sr in the primary
mantle melts. Indeed, more extensive alteration by seawater could both drive the 87Sr/86Sr
to higher ratios and make it easier to assimilate by facilitating the growth of more
secondary and hydrous minerals. In this case small amounts of a hydrothermally altered

86
crustal component could explain the observed 87Sr/86Sr ratios at Thríhnúkagígur and on
the rest of the Reykjanes Peninsula.
3.5.2.3 Buried tephra as a component in Thríhnúkagígur lavas
Evidence from direct field relationships observed in the cave below
Thríhnúkagígur’s main cone suggests that the buried tephra was physically scoured out
and entrained by the magma that fed the eruption. One of the most convincing
observations is the presence of hollow, cylindrical proto-conduits that extend vertically
into the overlying tephra immediately adjacent to the cross-cutting dike. In order to
evaluate this direct observation of processes occurring within the upper magmatic
plumbing system, isotopic and trace element mixing models are used to evaluate the
tephra assimilation hypothesis geochemically.
The Sr-Nd isotope data in this study do not form a simple binary mixing trend
between the hydrothermally altered crust and the dike. In order to assess whether the
buried tephra could provide an additional crustal component distinct from the
hydrothermally altered crust, the buried tephra with the least radiogenic 87Sr/86Sr (TNG-
14-26) was chosen as a third component. Given the positioning of the buried tephra ~100
m below the surface, a two-step mixing process is assumed. First, variable mixing with
hydrothermally altered crust occurs at depths of a few kilometers. Then these variably
affected magmas pick up the buried tephra immediately prior to or during the eruption.
Thus, compositions reflecting variable mixtures between mantle-derived magma and
hydrothermally altered crust (the near-horizontal curve in Figure 3.15 described in the
previous section) are then mixed with the representative tephra component. All but a

87
single outlier require less than 30% of the buried tephra, which is consistent with the
maximum estimate of 29% obtained based on physical observations made in Chapter 2.
Immobile elements such as HFSEs and REEs can also be used to assess mixing
between mantle-derived magma and the buried tephra. Ratios of HSFEs (Nb/Zr) and
REEs (La/Yb) were chosen for two reasons. First, there is an observable contrast in these
ratios between the buried tephra and the Holocene lavas and dikes. Second, the use of
immobile trace elements helps to avoid the potential effects of low-temperature alteration
to the buried tephra since it became exposed at depth in the damp cave. Secondary
alteration could potentially overprint the systematics of fluid-mobile elements.
Three end members were chosen to represent possible original magma
compositions. The plugged conduit, TNG-14-18, is used because it has the highest Mg#
(61) of the sample suite. The chilled margin of the dike, TNG-14-27i, is used because of
its low immobile trace element ratios. Finally, the most isotopically depleted dike sample
used in the Sr-Nd modeling is implemented here for consistency. The average of five of
six buried tephra samples is used to represent the buried tephra end member. Sample
TNG-14-28 is excluded from this average because of its high CIA (58) and unique
sedimentary structures, which are found only in two 20 cm thick outcrops out of tens of
meters of exposed tephra in the cave. Therefore, it is not considered to be representative
of the average buried tephra. End member compositions are given in Table 3.6.
Refractory trace element ratios Nb/Zr and La/Yb (Figure 3.16) were used to
determine relative mixing proportions. Depending on the magmatic end member,
estimates of tephra addition vary considerably. The plugged conduit yields the highest
estimates of 28-35% tephra to explain lavas and dike compositions. The chilled margin

88
gives more moderate estimates of 12-18%; and the dike used as the end member in the
Sr-Nd modeling suggests 0-8% tephra addition to the erupting magma. The plugged
conduit (TNG-14-18) represents a slightly more primitive magma (MgO > 9%) than that
erupted during the majority of the eruption (MgO = 7.5-8%). It is not entirely consistent
with the major element systematics of the rest of the system (see for example MgO vs.
Al2O3 in Figure 3.3), and may result in an over-estimate of the inherited tephra
component. Thus the maximum estimate from immobile trace element modeling is
consistent with the maximum estimate of 29% buried tephra produced with volume
estimates of the cave from a LiDAR-derived DEM and the erupted products.
The variability of these three estimates, none of which overlap, does not lend
strong support to the hypothesis that the cave was formed by the erosion and entrainment
of buried tephra into the erupting magma. The dike (TNG-14-24) used in the Sr-Nd
isotope mixing model produces low estimate of tephra addition (0-8%). As this seems the
most reasonable primitive mixing end member based on its isotopes ratios (as well as its
wt% Al2O3 and Sc concentration; see Figures 3.2 and 3.3), the low estimate warrants
some consideration. It is possible given the unconsolidated nature of the buried tephra
that it may have been rapidly scoured, entrained, and erupted. The proximity of the
buried tephra cone to the surface would not necessarily allow much time for the magma
to have mixed entrained tephra homogeneously. Early lavas buried within the main cone
may contain the bulk of the buried tephra, while tephra-poor lavas and dikes formed later
in the eruption are the only ones currently available to sample.
The extent to which the buried tephra was entrained in the erupting magma is not
clear from geochemical mixing models. The Sr-Nd isotope mixing model benefits from

89
the addition of a tephra component. On the other hand, the immobile element mixing
model does not necessarily require a tephra component to explain the observed
compositions of the lavas and dikes. These lines of evidence, at best, weakly support the
hypothesized entrainment of tephra to form the cave. At worst, they are not inconsistent
with the hypothesis.
3.5.3 Brennisteinsfjöll plumbing system
Variations in lava geochemistry over the course of an eruption have been
documented elsewhere in Iceland in basaltic (Furman et al., 1991) and intermediate
systems (Sigmarsson et al., 2011). It is not unreasonable to suspect that a dike and sill
system propagating towards the surface might contain semi-isolated sill-like bodies at
different levels in the crust. These various pockets of magma may experience different
geochemical evolutionary histories. Further, different injections of melt to the shallow
crustal part of the system may be derived from different proportions of enriched and
deplete mantle components. The lack of a central homogenizing magma chamber at
Brennisteinsfjöll may facilitate production and/or preservation of a heterogeneous
magma, and by extension the smaller fissure swarm of Thríhnúkagígur.
The heterogeneous nature of the major and trace element and radiogenic isotope
geochemistry in the Thríhnúkagígur lavas and dikes reflects the lack of a large
homogenizing magma chamber in the magmatic plumbing system. Instead, a network of
interconnected sills and dikes could both preserve initial heterogeneity in mantle-derived
magmas and facilitate the development of additional heterogeneity by independent
evolution of small pockets of magma at multiple levels within the crust (Figure 3.17).

90
The absence of a central volcano in Brennisteinsfjöll is consistent with a conceptual
model of a network of small sill-like magma bodies as well as the intrusion and eruption
of magmas with variable geochemistry.
The top of the plumbing system exposed in the cave preserves moderate
variations in magma composition at different intervals in a single eruption. For example,
the plugged conduit is more than 1.5% higher in MgO than all other samples. The chilled
margin of the main dike sampled from the wall of the cave anomalously high silica
relative to the other unaltered Holocene samples (Table 3.2). These two samples also
have markedly different incompatible trace element ratios relative to other Holocene
lavas (e.g., lower Nb/Zr and La/Yb; Figure 3.16). It may be expected that these samples
would have the most depleted isotopic compositions as well, but this is not the case.
Their Sr-Nd-Pb isotopes are indistinguishable from the rest of the lava and dike samples.
Hydrothermally altered crust or hyaloclastites can be much less dense than
crystalline basaltic lavas and could stall ascending magmas at many intervals in the crust
(Taisne et al., 2011). The variable crustal assimilation estimates (0-25%) suggested by
the Sr isotopic ratios in the Thríhnúkagígur lavas are consistent with the co-eruption of
relatively unmixed magmas produced in separate sill-like intrusions. Different sills may
incorporate variable amounts of hydrothermally altered crust. Further, the altered material
itself likely has variable Sr isotopic compositions.
The independent evolution of many different pockets of magmas could allow for a
wide range of compositions in a single eruption. This model, in the absence of a central
homogenizing magma chamber at Brennisteinsfjöll, invokes an interconnected network
of sills and dikes that may facilitate the development of chemical heterogeneity in

91
different locations in the plumbing system. Once an eruption is triggered, these relatively
isolated pockets of magma are unable to become well-mixed and compositional
differences are preserve in the lavas and the shallow magmatic plumbing system.
This model is also consistent with observations made during and prior to the
eruption at Eyjafjallajökull. Although this stratovolcano is markedly different in nature
from the fissure swarms of the Reykjanes, the inflation or injection of a mafic sill-like
from a deep source is likely to be the dominant intrusive style on the RP, which lacks
large homogenizing magma chambers. The deformation at Eyjafjallajökull in 1994 and
1999 is modeled to have occurred at 3.5-6.5 km depth based on InSAR (Pedersen and
Sigmundsson, 2004; Pedersen and Sigmundsson, 2006; Sigmundsson et al., 2010), GPS
and tilt measurements (Sturkell and Sigmundsson, 2003), and seismic observations
(Tarasewicz et al., 2014). A small volume flank eruption presumably sourced from this
intrusion had a mafic composition. Interaction with a shallow more silicic chamber
sparked the summit eruption (Sigmundsson et al., 2010; Sigmarsson et al., 2011). As the
summit eruption progressed, the chemistry of the tephra changed composition hinting at
mixing of the mafic component with various more evolved components at different times
during ascent (Keiding and Sigmarsson, 2012). This observation is consistent with the
observed microseismic earthquake swarms concentrated at particular depths propagating
down from the middle crust to upper mantle with each renewal of eruptive explosivity
(Tarasewicz, Brandsdóttir, et al., 2012). Collectively, these observations have led
multiple authors to suggest a complex multi-sill magmatic plumbing system
(Sigmundsson et al., 2010; Keiding and Sigmarsson, 2012; Tarasewicz, White, et al.,
2012).

92
3.6 Conclusions
The lavas and dikes at Thríhnúkagígur have Sr-Nd-Pb isotopic ratios that fall
within the range of data previously reported for the Reykjanes Peninsula and at
Brennisteinsfjöll. These compositions can be explained by three component mixing of an
isotopically and Nb enriched plume component and a depleted component, with minor
contributions from an EM1-like component. The southern EVZ requires an isotopically
indistinguishable enriched plume component from the one contributing to the RP, but
without the unusually enriched Nb. Lavas and dikes at Thríhnúkagígur plot with more
enriched RP compositions with a minor EM1-like signature. Unlike the Holocene lavas
and dikes, the buried tephra does not have a discernable EM1-like contribution and
cluster at the extreme enriched end of previously defined RP compositions. Although the
buried tephra is more enriched than the Holocene lavas and dikes, the difference is small
compared to the full range of compositions expressed on the RP. Because the buried
tephra is ≥100 ka in age, this contrast may also reflect a gradual depletion or dilution of
the enriched component under Brennisteinsfjöll through time.
The 87Sr/86Sr ratios, like the Nd and Pb isotope ratios, are generally consistent
with Reykjanes Peninsula lavas, except that some samples have relatively high Sr isotope
ratios at low 206Pb/204Pb and 143Nd/144Nd ratios. An additional mantle source may be
invoked to explain this variation, but is only discernable on the 206Pb/204Pb vs. 87Sr/86Sr
plot. The necessity of this additional mantle end member is difficult to evaluate because
Sr isotopes seem to be decoupled from the Nd-Pb isotopes. The most EM1-like sample
on the 206Pb/204Pb vs. 208Pb/204Pb plot is the least EM1-like in Sr-Nd space. Therefore,
basaltic crust altered at depth in seawater-dominated hydrothermal systems is proposed as

93
an alternative source for radiogenic Sr. Seawater has highly radiogenic Sr, so even minor
contributions from the altered crust could affect 87Sr/86Sr ratios in erupted lavas.
The isotope, major, and trace element geochemistry of Thríhnúkagígur is similar
to other erupted compositions on the Reykjanes Peninsula. However, the unique cave
below the main vent of the 3500 BP eruption allows compositions from the shallow
plumbing system to be constrained in addition to the surface lavas. The intrusive samples
collected from dike exposures within the walls of the cave have a wider range in major
and trace element abundances than the lavas. This demonstrates magma heterogeneity
within the small volume of magma along its final ascent to the surface vent, which is not
apparent in the majority of surficial flows. It is possible that during the peak of
monogenetic fissure eruptions, the magma is well-mixed relative to the initial and final
stages, when flow rates are lower. We propose that even in relatively homogeneous
monogenetic eruptions, significant chemical variation may persist into the uppermost
plumbing system, essentially to the point of the eruption. The surface lavas that represent
this heterogeneity may be buried under subsequent lava flows or preserved only in very
localized deposits near the vent, or they may be mixed out during the eruptive event
itself.
The proposed magmatic plumbing system of interconnected dikes and sills stalled
at hydrothermally altered layers in the middle to upper crust below Brennisteinsfjöll
provides a mechanism that may both preserve variations in mantle derived magma
compositions and facilitate additional magma heterogeneity. This type of plumbing
system is consistent with geophysical observations at other volcanic systems in Iceland,
as are the crustal residence times. The time scales of mafic magma storage, in particular,

94
have implications for volcanic hazards. If deformation is identified, eruption could occur
tens of years later.
Observations made from within the cave at Thríhnúkagígur suggest that buried
tephra has been assimilated or simply excavated by the magma en route to the surface.
Immobile trace element and radiogenic isotopes mixing models are used to test the
conclusions of magmatic entrainment of the buried tephra presented in Chapter 2. These
models produce similar estimates for the maximum amount of tephra that could have
been entrained and erupted in the Thríhnúkagígur lavas. These models produce maximum
estimates of ~28% and ~35% respectively, and 0-8% at minimum. Variation in initial
magma compositions may partially explain the variation in the estimates from these
models. Another possible source of variability is the extent of buried tephra incorporation
as the eruption progresses. It is possible that during the initial phases of the eruption,
likely more explosive with fire fountaining along a fissure, the buried tephra may have
been blown out by the erupting magma. These lavas with a greater buried tephra
component are likely at the base of the main cone at Thríhnúkagígur. Accordingly, the
surficial lavas in this study may record less of a buried tephra component if the mass
balance approach based on geophysical evidence is considered to be robust.
The lack of consensus about how to identify uniquely crustal tracers of
contamination in Icelandic magmas remains a problem. Hydrated, palagonitized, or
vitreous basaltic material, akin to the buried tephra beneath Thríhnúkagígur, is likely to
have a lower melting temperature than holocrystalline basalt. Fine-grained, low-density,
poorly consolidated materials (e.g. hyaloclastites, tephras, tillites) are easily
disaggregated, increasing the probability of magma stalling, and have high surface area,
95
which may encourage rapid digestion or entrainment. Nonetheless, even at
Thríhnúkagígur, where there are reasonable physical constraints on the maximum mass of
basaltic crustal component assimilated and completely characterized geochemistry,
including the upper magmatic plumbing system in addition to surficial lava flow, mixing
models are unable to provide internally consistent estimates of assimilation. The ability
of magma compositions to preserve an unambiguous record of interaction with altered
basaltic crustal materials may be limited to systems involving extreme hydrothermal
alteration of the crust as recorded by stable isotopes and radiogenic seawater-derived
strontium.

96
Table 3.1. Mineral and groundmass modes in percent. Modes are normalized to 100% after removing the vesicle mode, which is reported
separately.
Sample ID Plagioclase Olivine Oxides* Groundmass/
Glass
Tephra/
Contaminant Clinopyroxene Vesicles
Dike
TNG-14-14m 10.9 4.4 13.5 70.4 0.8 19.2
TNG-14-24 18.5 2.9 78.6 13.5
TNG-14-25 40.5 7.0 10.1 0.0 42.4 21
TNG-14-27i 44.3 10.2 10.2 0.0 35.2 12
Lavas
TNG-14-32 18.3 4.9 59.8 17.1 18
TNG-14-33 17.8 5.6 10.5 61.4 4.0 0.6 24.5
TNG-14-34 15.4 6.3 74.8 3.6 36.5
TNG-14-37 15.8 6.1 70.1 7.2 0.7 27.5
Miðhnúkar
TNG-14-35 6.3 7.4 78.1 8.2 27.5
Vent Spatter
MC-612-03 11.7 1.3 87.0
Plugged Conduit
TNG-14-18 2.1 8.9 89.1 4
Tephra
TNG-14-15 5.8 2.9 91.3
TNG-14-17 10.0 2.9 87.1
TNG-14-19
TNG-14-22 10.7 1.3 88.0
TNG-14-26 10.2 2.6 87.2
TNG-14-28 3.6 96.4

97
Table 3.2. Major element chemical analyses in weight percent oxides. Data were collected by a Perkin-Elmer Optima 5300DV ICP-AES for a
representative sample set for the units present at Thríhnúkagígur. Mg# and the chemical index of alteration (CIA) are unitless numbers. Mg# is
defined as 100 * Mg/(Mg + Fe) where Mg and Fe are molar abundances. CIA is defined as 100 * Al2O3/(Al2O3 + CaO + Na2O + K2O). For plotting
major element compositions, all samples were normalized to 100% after removing LOI. *Duplicate analysis. Duplicates are averaged for all figures.
Sample ID TNG-14-
14m
TNG-14-
24
TNG-14-
25
TNG-14-
27e
TNG-14-
27e*
TNG-14-
27i
TNG-14-
18
TNG-14-
18*
TNG-14-
15
TNG-
14-17
TNG-14-
19
Sample Type Dike Dike Dike Dike Dike Dike Plugged
conduit
Plugged
conduit
Buried
tephra
Buried
tephra
Buried
tephra
Description Interior Interior Interior Chilled
margin
Chilled
margin Interior Rockfall Rockfall
Uncon-
solidated Bomb
Uncon-
solidated
Location Cave,
NNE end
Cave,
SSW end
Cave,
SSW end
Cave,
SSW end
Cave,
SSW end
Cave,
SSW end
Cave, N
end
Cave, N
end
cave,
N/NNE
cave, N
end
cave,
NNW end
SiO2 48.11 47.42 47.11 48.20 49.25 47.23 47.58 47.68 48.38 48.11 48.18
TiO2 1.77 1.58 1.54 1.19 1.23 1.55 1.41 1.43 2.37 2.33 2.26
Al2O3 14.69 15.71 15.91 14.88 15.06 15.64 15.22 15.34 14.63 14.56 14.93
Fe2O3T 13.20 12.25 12.15 10.78 11.12 12.08 12.30 12.45 14.06 13.85 13.55
MnO 0.20 0.19 0.19 0.18 0.18 0.19 0.19 0.19 0.21 0.21 0.20
MgO 7.55 7.63 7.98 7.86 7.87 7.89 9.58 9.54 6.60 6.51 6.55
CaO 12.03 12.04 11.84 13.38 13.31 12.14 12.00 11.95 11.36 11.43 11.50
Na2O 2.12 2.13 2.15 2.04 2.09 2.10 1.95 2.00 2.30 2.32 2.28
K2O 0.18 0.13 0.14 0.10 0.08 0.15 0.10 0.07 0.28 0.28 0.30
P2O5 0.18 0.15 0.18 0.09 0.11 0.16 0.14 0.14 0.29 0.30 0.29
LOI 0.00 0.00 0.00 0.00 0.00 0.00 0.00 0.00 0.00 0.00 0.69
Total 100.03 99.26 99.22 98.69 100.32 99.12 100.47 100.81 100.53 99.94 100.74
Mg# 53 55 57 59 58 56 61 60 48 48 49
CIA 51 52 53 49 49 52 52 52 51 51 51

98
Table 3.2 continued.
Sample ID TNG-14-22 TNG-14-26 TNG-14-28 TNG-14-32 TNG-14-33 TNG-14-34 TNG-14-37 MC-612-03 TNG-14-35
Sample Type Buried
tephra
Buried
tephra
Buried
tephra Lava Lava Lava Lava
Vent
spatter
Miðhnúkar
lava
Description Uncon-
solidated
Uncon-
solidated
Palagon-
itized
Flank vent
flow
Main vent
flow
Main vent
flow
Main vent
flow
Main vent
scoria Lava flow
Location cave, NW
end
cave
SW/SSW
cave
SW/WSW
N 63°
59.865'
W 21°
42.015'
N 63°
59.958'
W 21°
41.880'
N 63°
59.972'
W 21°
41.658'
N 63°
59.836'
W 21°
42.098'
top of main
vent
N 63°
59.981'
W 21°
41.455'
SiO2 (%) 47.95 47.81 46.70 48.11 47.26 47.33 47.70 49.22 46.34
TiO2 (%) 2.29 2.35 1.89 1.65 1.60 1.60 1.58 1.71 1.82
Al2O3 (%) 14.77 14.42 16.09 15.14 15.66 15.69 15.60 16.15 14.04
Fe2O3T (%) 14.09 13.84 13.45 12.73 12.29 12.28 12.20 13.04 13.55
MnO (%) 0.20 0.21 0.17 0.19 0.19 0.19 0.19 0.18 0.21
MgO (%) 6.20 6.76 6.03 7.66 7.66 7.67 7.74 7.21 8.62
CaO (%) 10.84 11.33 9.79 11.94 12.01 12.00 11.89 9.91 10.93
Na2O (%) 1.95 2.29 1.65 2.07 2.05 2.09 2.07 1.65 2.01
K2O (%) 0.31 0.29 0.20 0.14 0.15 0.16 0.15 0.11 0.19
P2O5 (%) 0.29 0.28 0.24 0.16 0.15 0.16 0.17 0.17 0.17
LOI(900C) 1.11 0.00 2.79 0.00 0.00 0.00 0.00 0.00 0.00
Total 99.99 99.62 99.00 99.82 99.03 99.17 99.29 99.37 98.34
Mg# 47 49 47 54 56 55 56 52 56
CIA 53 51 58 52 52 52 53 58 52

99
Table 3.3. CIPW norms. Calculated from major element data and trace element concentrations of Sr, Ba, Cr, Ni, and Zr. Samples TNG-14-22,
TNG-14-28, and MC-612-03 are excluded from this table because they have been altered to an extent that makes their bulk chemistry fall outside
the range of compositions for which norms can be calculated.
Sample ID TNG-
14-14m
TNG-
14-24
TNG-
14-25
TNG-
14-27e
TNG-
14-27i
TNG-
14-18
TNG-
14-15
TNG-
14-17
TNG-
14-19
TNG-
14-26
TNG-
14-32
TNG-
14-33
TNG-
14-34
TNG-
14-37
Sample Type Dike Dike Dike Dike Dike Plugged
conduit
Buried
tephra
Buried
tephra
Buried
tephra
Buried
tephra
Flank
vent
lava
Main
vent
lava
Main
vent
lava
Main
vent
lava
Plagioclase 48.49 51.83 52.52 49.48 51.62 49.46 48.58 48.76 49.46 48.33 49.79 51.43 51.62 51.24
Orthoclase 1.06 0.83 0.83 0.53 0.89 0.53 1.65 1.65 1.83 1.77 0.83 0.95 0.95 0.95
Diopside 23.65 21.55 20.25 28.34 22.07 21.24 21.43 22.01 21.39 21.94 22.07 21.35 21.30 20.93
Hyper-sthene 15.07 12.06 10.53 11.50 10.35 11.17 18.61 17.50 17.19 16.82 16.39 12.89 12.37 14.71
Olivine 4.98 7.60 9.80 5.14 9.05 11.87 1.43 1.48 2.15 2.88 4.56 7.20 7.57 6.03
Ilmenite 3.40 3.06 2.89 2.34 3.00 2.70 4.54 4.48 4.33 4.54 3.17 3.10 3.10 3.06
Magnetite 2.90 2.71 2.70 2.42 2.68 2.70 3.07 3.06 2.97 3.06 2.80 2.73 2.73 2.7
Apatite 0.42 0.37 0.42 0.23 0.37 0.32 0.67 0.70 0.67 0.65 0.39 0.37 0.39 0.39
Zircon 0.01 0.01 0.01 0.01 0.01 0.01 0.03 0.03 0.03 0.03 0.01 0.01 0.01 0.01
Chromite 0.06 0.07 0.07 0.07 0.07 0.09 0.03 0.03 0.03 0.03 0.07 0.06 0.06 0.06

100
Table 3.4. Trace element chemical analyses. Data were collected by a Thermo X-Series II Quadruple ICP-
MS for samples from the Thríhnúkar fissure system. All concentrations are in ppm. NR = not reported.
*Duplicate analysis.
Sample
ID
TNG-
14-14m
TNG-
14-24
TNG-
14-25
TNG-
14-27e
TNG-
14-27e
TNG-
14-27i*
TNG-
14-18
TNG-
14-18*
Sample
Type Dike Dike Dike Dike Dike Dike
Plugged
conduit
Plugged
conduit
Li NR 4.24 4.41 NR 3.91 NR NR 4.93
Sc 44.2 42.5 40.8 53.4 55.8 41.7 39.9 42.7
V 382 352 342 380 391 347 314 338
Cr 295 314 331 318 317 333 382 391
Co 74.4 75.3 95.9 63.1 67.7 67.6 73.2 79.5
Ni 93.3 113 123 74.8 75.6 117 187 191
Cu 116 167 96.6 79.9 85.0 119 92.5 98.8
Zn 102 97.3 96.2 72.2 74.8 93.6 92.4 95.3
Rb 3.71 3.17 3.14 1.94 1.90 3.26 1.89 1.88
Sr 189 208 208 183 189 203 166 187
Y 25.7 23.7 22.1 17.5 17.2 23.0 22.2 22.3
Zr 87.6 78.8 78.5 50.3 50.0 77.6 62.7 62.1
Nb 11.7 10.6 10.8 6.15 6.27 10.2 6.64 6.56
Cs 0.09 0.10 0.10 0.07 0.10 0.07 0.05 0.08
Ba 60.9 52.5 51.7 39.1 36.6 55.9 33.0 33.5
Hf 2.31 2.05 2.01 1.46 1.41 2.06 1.72 1.66
Ta 0.83 0.66 0.65 0.45 0.38 0.73 0.48 0.41
Pb 0.54 0.49 0.39 0.30 0.30 0.46 0.26 0.26
Th 0.48 0.42 0.41 0.25 0.24 0.43 0.25 0.25
U 0.15 0.13 0.13 0.08 0.07 0.13 0.08 0.08
La 7.77 6.97 6.81 4.41 4.29 7.01 4.87 4.88
Ce 18.8 17.0 16.4 10.9 10.6 17.0 12.7 12.6
Pr 2.77 2.37 2.25 1.65 1.51 2.48 1.95 1.84
Nd 12.7 11.6 10.8 7.80 7.57 11.3 9.24 9.42
Sm 3.57 3.25 2.99 2.34 2.21 3.18 2.77 2.76
Eu 1.29 1.19 1.11 0.94 0.90 1.17 1.04 1.03
Gd 4.19 3.78 3.48 2.84 2.71 3.75 3.37 3.32
Tb 0.71 0.64 0.60 0.49 0.47 0.64 0.59 0.58
Dy 4.50 4.01 3.77 3.05 2.93 4.00 3.79 3.72
Ho 0.92 0.85 0.79 0.63 0.61 0.83 0.78 0.78
Er 2.61 2.40 2.21 1.80 1.72 2.35 2.24 2.23
Tm 0.39 0.35 0.32 0.26 0.24 0.35 0.33 0.33
Yb 2.44 2.24 2.09 1.66 1.59 2.17 2.07 2.08
Lu 0.38 0.33 0.31 0.26 0.24 0.34 0.33 0.31

101
Table 3.4 continued.
Sample ID TNG-14-15 TNG-14-17 TNG-14-19 TNG-14-22 TNG-14-26 TNG-14-28
Sample Type Buried
tephra
Buried
tephra
Buried
tephra
Buried
tephra
Buried
tephra
Buried
tephra
Li 5.00 4.98 NR NR 5.19 NR
Sc 43.8 44.3 43.4 41.7 48.5 40.4
V 403 408 406 387 445 343
Cr 139 141 143 136 160 224
Co 66.6 107 59.4 51.9 69.2 62.2
Ni 75.9 73.5 77.9 67.4 80.8 136
Cu 317 187 180 265 190 271
Zn 116 117 114 113 128 98.4
Rb 6.33 6.34 6.67 8.16 6.99 4.07
Sr 248 256 241 236 280 185
Y 33.5 31.4 30.1 35.2 36.5 24.7
Zr 132 133 131 130 145 97.8
Nb 21.8 21.7 21.2 20.9 23.9 14.4
Cs 0.17 0.18 0.15 0.20 0.18 0.13
Ba 93.8 94.5 96.3 95.0 103 75.4
Hf 3.24 3.31 3.34 3.30 3.54 2.55
Ta 1.31 1.33 1.48 1.44 1.42 1.00
Pb 0.81 0.85 0.81 0.86 0.65 0.63
Th 0.84 0.86 0.85 0.85 0.91 0.65
U 0.25 0.26 0.27 0.27 0.26 0.18
La 13.5 12.9 12.9 13.2 14.5 9.11
Ce 33.4 31.2 31.0 32.0 34.4 21.9
Pr 4.58 4.24 4.41 4.55 4.56 3.13
Nd 22.0 19.9 19.6 20.0 21.3 14.1
Sm 5.56 5.05 5.00 5.18 5.47 3.78
Eu 1.86 1.73 1.73 1.78 1.87 1.32
Gd 6.18 5.46 5.47 5.82 5.90 4.22
Tb 1.00 0.90 0.90 0.96 0.97 0.71
Dy 5.97 5.39 5.41 5.85 5.79 4.40
Ho 1.24 1.10 1.08 1.19 1.18 0.90
Er 3.40 3.05 3.03 3.32 3.27 2.53
Tm 0.48 0.44 0.44 0.48 0.46 0.38
Yb 3.06 2.82 2.70 2.94 2.99 2.37
Lu 0.45 0.41 0.42 0.45 0.43 0.37

102
Table 3.4 continued.
Sample ID TNG-14-
32
TNG-14-
33
TNG-14-
34
TNG-14-
37
MC-612-
03
TNG-14-
35
Sample
Type Lava Lava Lava Lava
Vent
spatter Miðhnúkar
Li 5.31 NR NR NR 4.68 NR
Sc 46.7 41.7 42.0 40.1 45.9 41.6
V 387 354 354 342 385 382
Cr 326 297 294 287 315 319
Co 99.0 76.4 164 170 72.8 84.1
Ni 120 114 114 110 117 161
Cu 176 159 149 150 159 149
Zn 105 97.7 96.5 92.5 107 109
Rb 3.52 3.48 3.54 3.29 3.64 4.19
Sr 221 192 193 194 179 176
Y 25.3 24.3 24.0 23.2 23.4 27.4
Zr 87.3 82.4 82.5 77.7 92.7 97.9
Nb 11.9 11.0 11.0 10.4 12.5 12.5
Cs 0.11 0.08 0.08 0.08 0.13 0.11
Ba 57.3 56.2 56.0 56.2 55.6 61.0
Hf 2.23 2.18 2.18 2.07 2.33 2.57
Ta 0.71 0.78 0.78 0.74 0.76 0.88
Pb 0.55 0.61 0.91 0.50 2.40 1.38
Th 0.46 0.46 0.48 0.43 0.52 0.55
U 0.14 0.15 0.15 0.13 0.16 0.18
La 7.65 7.54 7.24 7.08 7.65 8.28
Ce 18.6 18.4 17.9 17.3 18.5 20.5
Pr 2.58 2.68 2.63 2.53 2.53 3.00
Nd 12.5 12.3 12.0 11.5 12.2 13.8
Sm 3.42 3.43 3.37 3.23 3.27 3.87
Eu 1.26 1.24 1.25 1.20 1.19 1.37
Gd 4.01 4.00 3.93 3.83 3.81 4.46
Tb 0.68 0.68 0.68 0.65 0.65 0.77
Dy 4.29 4.31 4.20 4.08 3.99 4.81
Ho 0.90 0.88 0.87 0.85 0.84 0.99
Er 2.53 2.50 2.46 2.38 2.34 2.80
Tm 0.37 0.37 0.37 0.35 0.34 0.42
Yb 2.36 2.34 2.33 2.21 2.17 2.64
Lu 0.35 0.36 0.36 0.35 0.33 0.41

103
Table 3.5. Pb-Sr-Nd isotope ratios. Data were collected by Finnigan MAT 262 multi-collector thermal ionization mass spectrometer (TIMS). Two
standard deviations are given in ten-thousandths for Pb ratios and one-millionths for 87Sr/86Sr and 143Nd/144Nd.
Sample ID TNG-14-
14m TNG-14-24 TNG-14-25
TNG-14-
27e TNG-14-27i TNG-14-18 TNG-14-15 TNG-14-17 TNG-14-19
Sample Type Dike Dike Dike Dike Dike Plugged
conduit
Buried
tephra
Buried
tephra
Buried
tephra
206Pb/204Pb 18.9042 18.5182 18.8017 18.7945 18.8128 18.6805 18.9241 18.6840 18.9437
2σ 228 112 224 55 36 82 77 28 69
207Pb/204Pb 15.5892 15.5525 15.6302 15.4768 15.5031 15.5237 15.5355 15.5346 15.5381
2σ 192 97 184 44 30 72 63 23 57
208Pb/204Pb 38.5980 38.2656 38.5401 38.3135 38.3958 38.3395 38.5259 38.3471 38.5224
2σ 463 235 456 108 74 167 154 57 139
87Sr/86Sr 0.703187 0.703135 0.703143 0.703203 0.703141 0.703088 0.703174 0.703186 0.703223
2σ 7 7 8 9 8 30 7 7 15
143Nd/144Nd 0.513031 0.513040 0.513036 0.513021 0.513029 0.513039 0.513012 0.513010 0.513010
2σ 8 15 6 10 20 8 8 8 6

104
Table 3.5 continued.
Sample ID TNG-14-22 TNG-14-26 TNG-14-28 TNG-14-32 TNG-14-33 TNG-14-34 TNG-14-37 MC-612-03 TNG-14-35
Sample Type Buried
tephra
Buried
tephra
Buried
tephra Flank lava
Main vent
lava
Main vent
lava
Main vent
lava Vent Spatter
Miðhnúkar
lava
206Pb/204Pb 18.9328 18.8634 18.8472 18.8418 18.8233 18.5738 18.8520 18.2889 18.4774
2σ 46 46 64 69 78 14 62 21 69
207Pb/204Pb 15.5411 15.4893 15.5191 15.5375 15.5338 15.5647 15.5352 15.5947 15.5628
2σ 37 38 52 56 62 11 54 18 58
208Pb/204Pb 38.5464 38.3865 38.4452 38.4790 38.4478 38.3561 38.4755 38.1947 38.2762
2σ 92 95 13 143 155 27 135 45 142
87Sr/86Sr 0.703305 0.703157 0.703191 0.703170 0.703213 0.703281 0.703178 0.703197 0.703184
2σ 8 8 10 7 9 8 8 6 7
143Nd/144Nd 0.513018 0.512991 0.513050 0.513000 0.513030 0.513044 0.513024 0.513022 0.513022
2σ 10 9 16 13 9 8 7 10 8

105
Table 3.6. Mixing end member compositions for Figures 3.14 and 3.15. HAC = hydrothermally altered crust; from Gee et al. (1998a).
End Member 87Sr/86Sr 143Nd/144Nd Sr (ppm) Nd (ppm) La/Yb Sm/Nd Nb/Zr
HAC 0.7036 0.51305 300 10.6
TNG-14-24 0.703135 0.513040 208 11.6 3.11 0.281 0.134
TNG-14-26 0.703157 0.512991 280 9.33 4.84 0.257 0.164
TNG-14-18 0.703188 0.513039 177 21.3 2.35 0.297 0.106
Avg. buried
tephra 4.26 0.256 0.163

106
Figure 3.1. Photomicrographs of two phenocryst population, a more tabular euhedral one (a) and a high
aspect ratio one (b) in lava TNG-14-14m; the phenocryst-poor chilled margin (c; TNG-14-27e) and flow
banding with interstitial clinopyroxene in the interior the same dike (d; TNG-14-27i); aphanitic,
phenocryst-poor plugged conduit, TNG-14-18 (e); and large olivine phenocrysts from the Miðhnúkar lava
flow, TNG-14-35 (f).

107
Figure 3.2. Total alkali-silica plot (TAS). All Thríhnúkagígur samples analyzed are subalkaline basalts.
Buried tephra samples are represented by triangle; lava and dike samples from the Holocene eruption are
circles; the lava sample from Miðhnúkar is a cross. TAS diagram from Le Bas and Le Maitre (1986).

108
Figure 3.3. Fenner diagrams of MgO vs. the major oxides and chemical index of alteration (CIA). Circles
represent lavas and dikes. Triangles represent buried tephra samples. The cross is the Miðhnúkar lava.
Open symbols indicate samples with a high CIA samples likely to be affected by secondary alteration.

109
Figure 3.4. Plots of MgO vs. trace elements and CaO/Al2O3. Circles represent lavas and dikes while
triangles represent buried tephra samples. The cross is the lava from Miðhnúkar. Open symbols indicate
samples with a high CIA and likely to be affected by secondary alteration.

110
Figure 3.5. Primitive mantle normalized multielement diagram for the main sample suites and unique
samples from Thríhnúkagígur. All samples are characterized by small positive Ba and U, and relatively
large Nb and Ta anomalies. All samples have moderate to large negative Pb anomalies, except for the
vent spatter (MC-612-03), which is thought to be a result of contamination. Most other trace elements
display similar patterns across regardless of sample type, except for Sr which has a positive anomaly in
relatively more depleted plugged conduit (TNG-14-18) and chilled margin of the dike (TNG-14-27e) and
a negative anomaly in the more enriched buried tephra. Primitive mantle normalization values are from
Sun and McDonough (1989).

111
Figure 3.6. Chondrite normalized rare earth element (REE) spider diagram by rock type. All samples have
a gently sloping negative trend with higher LREE values than HREE values. The chilled margin of the
dike (TNG-14-27e) has a weak positive Eu anomaly. Chondrite normalization values are from Sun and
McDonough (1989).

112
Figure 3.7. Plots of 206Pb/204Pb vs. 208Pb/204Pb (a) and 207Pb/204Pb (b). Circles represent lavas and dikes
while triangles represent buried tephra samples. The cross is the lava from Miðhnúkar. Open symbols
indicate samples with a high CIA. Error bars represent either the in run instrumental error or the standard
reproducibility, whichever source of error is larger.

113
Figure 3.8. Plot of 87Sr/86Sr vs. 143Nd/144Nd. The buried tephras have consistently lower 143Nd/144Nd ratios
compared to the lavas and dikes across the same range of 87Sr/86Sr ratios. Three dike samples have the
least radiogenic Sr isotope ratios at the same relative radiogenic Nd isotope ratio. Circles represent lavas
and dikes while triangles represent buried tephra samples. The cross is the lava from Miðhnúkar. Open
symbols indicate samples with a high CIA. Error bars represent either the in run instrumental error or the
standard reproducibility, whichever source of error is larger.

114
Figure 3.9. (La/Yb)N vs. Nb/Zr. Reykjanes Peninsula and the Western Volcanic Zone lavas in SW Iceland
extend to similarly high Nb/Zr ratios as lavas in the Eastern Volcanic Zone, but at much lower (La/Yb)N
ratios. Thríhnúkagígur lavas and dikes are consistent other lavas from SW Iceland while the buried tephra
record some of the most enriched values in the region. Circles represent lavas and dikes while triangles
represent buried tephra samples. The cross is the lava from Miðhnúkar. Open symbols indicate samples
with a high CIA. Data for Vestmannaeyjar are from Furman et al. (1991), Kokfelt et al. (2006), and Peate
et al. (2010); EVZ data are from Kokfelt et al. (2006), Peate et al. (2010), and Manning and Thirlwall
(2014); WVZ data are from Kokfelt et al. (2006) and Koornneef et al. (2012); and data from the
Reykjanes Peninsula are from Kokfelt et al. (2006), Peate et al. (2009), and Koornneef et al. (2012).

115
Figure 3.10. Plots of Nb vs. Nb/U (a) and Ce vs. Ce/Pb (b). Global ocean island basalts and mid-ocean
ridge basalts yield Nb/U ratios of 47 ± 10 at all concentrations of Nb and Ce/Pb ratios of 25 ± 5 at all Ce
concentrations (Hofmann et al., 1986). Dashed lines show these ranges. Lavas in SW Iceland on the
Reykjanes Peninsula and in the WVZ yield much higher Nb/U and Ce/Pb than observed elsewhere, not
just in Iceland, but globally. Circles represent lavas and dikes while triangles represent buried tephra
samples. The cross is the lava from Miðhnúkar. Open symbols indicate samples with a high CIA. Data for
Vestmannaeyjar are from Kokfelt et al. (2006) and Peate et al. (2010); EVZ data are from Sigmarsson et
al. (1992), Kokfelt et al. (2006), Peate et al. (2010), and Manning and Thirlwall (2014); WVZ and RP
data are from Kokfelt et al. (2006) and Koornneef et al. (2012).

116
Figure 3.11. Plots of 206Pb/204Pb vs. 208Pb/204Pb with proposed mantle end members from Thirlwall et al.
(2004) and Kitagawa et al. (2008). South Iceland lavas form an array primarily between an enriched and a
depleted end member on both plots. Thríhnúkagígur samples are broadly consistent with composition
observed on the Reykjanes Peninsula and Brennisteinsfjöll. They are pulled slightly off the NHRL (Hart,
1984) towards an EM1-like end member. Data for the southern Reykjanes Ridge (SRR) are from
Thirlwall et al., 2004; Reykjanes, Krísuvík, and Brennisteinsfjöll data are from Thirlwall et al., 2004,
Kokfelt et al., 2006, and Peate et al., 2009; Hekla and Katla data are from Park, 1990 and Furman et al.,
1995; Vestmannaeyjar data are from Furman et al., 1991, Chauvel and Hémond, 2000, Kokfelt et al.,
2006, and Peate et al., 2010.

117
Figure 3.12. Nb/U plotted against 206Pb/204Pb (a), 208Pb/204Pb (b). Solid black triangles represent
Thríhnúkagígur buried tephra. Solid black circles represent Thríhnúkagígur lavas and dikes. Grey circles
represent other Reykjanes Peninsula lavas from Kokfelt et al. (2006).

118
Figure 3.13. A plot of 87Sr/86Sr vs. 143Nd/144Nd. Thríhnúkagígur samples are more consistent with the
Reykjanes fissure swarm and Vestmannaeyjar than Brennisteinsfjöll and are influenced by an EM1-like
component, or more likely, HAC. Sr-Nd isotopes, data for the southern Reykjanes Ridge (SRR) are from
Thirlwall et al., 2004; Reykjanes, Krísuvík, and Brennisteinsfjöll data are from Thirlwall et al., 2004,
Kokfelt et al., 2006, and Peate et al., 2009; Hekla data are from Park, 1990, Sigmarsson et al., 1992, and
Furman et al., 1995; Katla data are from Park, 1990 and Furman et al., 1995; Vestmannaeyjar data are
from Furman et al., 1991 and Kokfelt et al., 2006.

119
Figure 3.14. A plot of 206Pb/204Pb vs. 87Sr/86Sr. Thríhnúkagígur samples are most consistent with the lavas
with highly radiogenic Sr isotopes from the Reykjanes fissure swarm. Data for the southern Reykjanes
Ridge (SRR) are from Thirlwall et al., 2004; Reykjanes, Krísuvík, and Brennisteinsfjöll data are from
Thirlwall et al., 2004, Kokfelt et al., 2006, and Peate et al., 2009; Hekla data are from Park, 1990,
Sigmarsson et al., 1992, and Furman et al., 1995; Katla data are from Park, 1990 and Furman et al., 1995;
Vestmannaeyjar data are from Furman et al., 1991 and Kokfelt et al., 2006.

120
Figure 3.15. Sr-Nd isotope mixing model for Thríhnúkagígur lavas and dikes. First, the dike sample with
the least radiogenic Sr isotope composition (TNG-14-24, purple circle) is mixed with a strongly
radiogenic hydrothermally altered crustal end member from Gee et al., 1998 (blue cross). Then mixing
occurs between various points along the first curve and the least radiogenic buried tephra sample, marked
with a red triangle.

121
Figure 3.16. Incompatible trace element ratio mixing curve, Nb/Zr vs. La/Yb. The average buried tephra
(red diamond) of the representative samples forms the enriched end member. The geochemistry of the
intrusive part of the system is heterogeneous, so three possible end members are used (yellow diamonds):
the plugged conduit (TNG-14-18), the chilled margin of the dike (TNG-14-27e), and isotopically most
depleted dike sample (TNG-14-24) used as an end member in Figure 3.13. For the latter two primitive
end members, green crosses on the mixing curves represent 20% buried tephra, blue crosses represent
10%, and red crosses represent 5%. Dikes and lavas representing possible mixtures of the buried tephra
and original magma composition are blue and yellow circles.

Figure 3.17. Cartoon of the magmatic plumbing system below Brennisteinsfjöll. The depth to the base of
the crust is to scale, but the volcanic features, dikes, and sills are not to scale. Hydrothermally altered
crust or hyaloclastite layers (HC) likely play a role in slowing magma ascent. Orange stippled zones
represent sills or sill-like intrusions that have stalled at low density layers.

References
Bindeman I., Gurenko A., Sigmarsson O. and Chaussidon M. (2008) Oxygen isotope
heterogeneity and disequilibria of olivine crystals in large volume Holocene basalts
from Iceland: Evidence for magmatic digestion and erosion of Pleistocene
hyaloclastites. Geochim. Cosmochim. Acta 72, 4397–4420.
Bindeman I., Sigmarsson O. and Eiler J. M. (2006) Time constraints on the origin of
large volume basalts derived from O-isotope and trace element mineral zoning and
U-series disequilibria in the Laki and Grímsvötn volcanic system. Earth Planet. Sci.
Lett. 245, 245–259.
Chauvel C. and Hémond C. (2000) Melting of a complete section of recycled oceanic
crust: Trace element and Pb isotopic evidence from Iceland. Geochemistry,
Geophys. Geosystems 1, n/a–n/a.
Clifton A. E., Sigmundsson F., Feigl K. L., Gunnar Guðmundsson and Árnadóttir T.
(2002) Surface effects of faulting and deformation resulting from magma
accumulation at the Hengill triple junction, SW Iceland, 1994-1998. J. Volcanol.
Geotherm. Res. 115, 233–255.
Condomines M., Muehlenbachs K., O’Nions R. K., Óskarsson N. and Oxburgh E. R.
(1983) Helium, oxygen, strontium and neodynium isotopic relationships in Icelandic
volcanics. Earth Planet. Sci. Lett. 66, 125–136.
Elderfield H. and Greaves M. J. (1981) Strontium isotope geochemistry of Icelandic
geothermal systems and implications for sea water chemistry. Geochim. Cosmochim.
Acta 45, 2201–2212.
Fronval T. and Jansen E. (1997) Eemian and Early Weichselian (140–60 ka)
Paleoceanography and paleoclimate in the Nordic Seas with comparisons to
Holocene conditions. Paleoceanography 12, 443.
Furman T., Frey F. a. and Park K.-H. (1991) Chemical constraints on the petrogenesis of
mildly alkaline lavas from Vestmannaeyjar, Iceland: the Eldfell (1973) and Surtsey
(1963?1967) eruptions. Contrib. to Mineral. Petrol. 109, 19–37.
Furman T., Frey F. A. and Park K.-H. (1995) The scale of source heterogeneity beneath
the Eastern neovolcanic zone, Iceland. J. Geol. Soc. London. 152, 997–1002.
Gee M. A. M., Taylor R. N., Thirlwall M. F. and Murton B. J. (2000) Axial magma
reservoirs located by variation in lava chemistry along Iceland’s mid-ocean ridge.
Geology 28, 699–702.

124
Gee M. A. M., Taylor R. N., Thirlwall M. F. and Murton B. J. (1998) Glacioisostacy
controls chemical and isotopic characteristics of tholeiites from the Reykjanes
Peninsula, SW Iceland. Earth Planet. Sci. Lett. 164, 1–5.
Gee M. A. M., Thirlwall M. F., Taylor R. N., Lowry D. and Murton B. J. (1998) Crustal
Processes: Major Controls on Reykjanes Peninsula Lava Chemistry, SW Iceland. J.
Petrol. 39, 819–839.
Hanan B. B. and Schilling J.-G. (1997) The dynamic evolution of the Iceland mantle
plume: the lead isotope perspective. Earth Planet. Sci. Lett. 151, 43–60.
Hart S. R. (1984) A large-scale isotope anomaly in the Southern Hemisphere mantle.
Nature 309, 753–757.
Higgins M. D. and Roberge J. (2007) Three magmatic components in the 1973 eruption
of Eldfell volcano, Iceland: Evidence from plagioclase crystal size distribution
(CSD) and geochemistry. J. Volcanol. Geotherm. Res. 161, 247–260.
Hofmann A. W., Jochum K. P., Seufert M. and White W. M. (1986) Nb and Pb in
oceanic basalts: new constraints on mantle evolution. Earth Planet. Sci. Lett. 79, 33–
45.
Jakobsson S. P., Jonsson J. and Shido F. (1978) Petrology of the Western Reykjanes,
Peninsula. J. Petrol. 19, 669–705.
Keiding J. K. and Sigmarsson O. (2012) Geothermobarometry of the 2010
Eyjafjallajökull eruption: New constraints on Icelandic magma plumbing systems. J.
Geophys. Res. 117, 1–15.
Kitagawa H., Kobayashi K., Makishima A. and Nakamura E. (2008) Multiple pulses of
the mantle plume: Evidence from tertiary icelandic lavas. J. Petrol. 49, 1365–1396.
Koerberle R., Hudak M. and Furman T. (2015) Crystal size distribution and textural
analysis at Thríhnúkagígur volcano, Iceland. In Geological Society of America
Annual Meeting p. 179.
Kokfelt T. F., Hoernle K., Hauff F., Fiebig J., Werner R. and Garbe-Schönberg D. (2006)
Combined Trace Element and Pb-Nd-Sr-O Isotope Evidence for Recycled Oceanic
Crust (Upper and Lower) in the Iceland Mantle Plume. J. Petrol. 47, 1705–1749.
Koornneef J. M., Stracke A., Bourdon B., Meier M. A., Jochum K. P., Stoll B. and
Grönvold K. (2012) Melting of a Two-component Source beneath Iceland. J. Petrol.
53, 127–157.

125
Le Bas M. J. and Le Maitre R. W. (1986) A chemical classification of volcanic rocks
based on the total alkali-silica diagram. J. Petrol. 27, 745–750.
LaFemina P. C., Dixon T. H., Malservisi R., Árnadóttir T., Sturkell E., Sigmundsson F.
and Einarsson P. (2005) Geodetic GPS measurements in south Iceland: Strain
accumulation and partitioning in a propagating ridge system. J. Geophys. Res. 110,
B11405.
Manning C. J. and Thirlwall M. F. (2014) Isotopic evidence for interaction between
Öræfajökull mantle and the Eastern Rift Zone, Iceland. Contrib. to Mineral. Petrol.
167, 959.
Marks N., Zierenberg R. A. and Schiffman P. (2015) Strontium and oxygen isotopic
profiles through 3 km of hydrothermally altered oceanic crust in the Reykjanes
Geothermal System, Iceland. Chem. Geol. 412, 34–47.
Michalczewska K., Hreinsdóttir S., Árnadóttir T., Hjartardóttir Á. R., Ágústsdóttir T.,
Gudmundsson M. T., Geirsson H., Sigmundsson F. and Gudmundsson G. B. (2012)
Inflation and deflation episdoes in the Krísuvík volcanic system. In American
Geophysical Union Fall Meeting
Nesbitt H. W. and Young G. M. (1982) Early Proterozoic climates and plate motion
inferred from major element chemistry of lutites. Nature 299, 715–717.
Park K.-H. (1990) Sr, Nd, and Pb isotope studies of ocean island basalts: constraints on
their origin and evolution. Columbia University.
Peate D. W., Baker J. A., Jakobsson S. P., Waight T. E., Kent A. J. R., Grassineau N. V.
and Skovgaard A. C. (2009) Historic magmatism on the Reykjanes Peninsula,
Iceland: a snap-shot of melt generation at a ridge segment. Contrib. to Mineral.
Petrol. 157, 359–382.
Peate D. W., Breddam K., Baker J. A., Kurz M. D., Barker A. K., Prestvik T., Grassineau
N. V. and Skovgaard A. C. (2010) Compositional Characteristics and Spatial
Distribution of Enriched Icelandic Mantle Components. J. Petrol. 51, 1447–1475.
Pedersen R. and Sigmundsson F. (2004) InSAR based sill model links spatially offset
areas of deformation and seismicity for the 1994 unrest episode at Eyjafjallajökull
volcano, Iceland. 31, 5–9.
Pedersen R. and Sigmundsson F. (2006) Temporal development of the 1999 intrusive
episode in the Eyjafjallajökull volcano, Iceland, derived from InSAR images. Bull.
Volcanol. 68, 377–393.

126
Raffone N., Ottolini L., Tonarini S., Gianelli G. and Fridleifsson G. Ó. (2008) A SIMS
study of lithium, boron and chlorine in basalts from Reykjanes (southwestern
Iceland). Microchim. Acta 161, 307–312.
Rudge J. F., Maclennan J. and Stracke A. (2013) The geochemical consequences of
mixing melts from a heterogeneous mantle. Geochim. Cosmochim. Acta 114, 112–
143.
Shorttle O., Maclennan J. and Piotrowski A. M. (2013) Geochemical provincialism in the
Iceland plume. Geochim. Cosmochim. Acta 122, 363–397.
Sigmarsson O. (1996) Short magma chamber residence time at an Icelandic volcano
inferred from U-series disequilibria. Nature 382, 440–442.
Sigmarsson O., Condomines M. and Fourcade S. (1992) A detailed Th, Sr and O isotope
study of Hekla: differentiation processes in an Icelandic volcano. Contrib. to
Mineral. Petrol. 112, 20–34.
Sigmarsson O., Condomines M., Grönvold K. and Thordarson T. (1991) Extreme magma
homogeneity in the 1783-1784 Lakagigar eruption: Origin of a large volume of
evolved basalt in Iceland. Geophys. Res. Lett. 18, 2229–2232.
Sigmarsson O., Vlastelic I., Andreasen R., Bindeman I., Devidal J.-L., Moune S.,
Keiding J. K., Larsen G., Höskuldsson A. and Thordarson T. (2011) Remobilization
of silicic intrusion by mafic magmas during the 2010 Eyjafjallajökull eruption. Solid
Earth 2, 271–281.
Sigmundsson F., Hreinsdóttir S., Hooper A., Árnadóttir T., Pedersen R., Roberts M. J.,
Óskarsson N., Auriac A., Decriem J., Einarsson P., Geirsson H., Hensch M.,
Ofeigsson B. G., Sturkell E., Sveinbjörnsson H. and Feigl K. L. (2010) Intrusion
triggering of the 2010 Eyjafjallajökull explosive eruption. Nature 468, 426–30.
Skovgaard A. C., Storey M., Baker J. A., Blusztajn J. and Hart S. R. (2001) Osmium-
oxygen isotopic evidence for a recycled and strongly depleted component in the
Iceland mantle plume. Earth Planet. Sci. Lett. 194, 259–275.
Stracke A., Zindler A., Salters V. J. M., McKenzie D., Blichert-Toft J., Albarède F. and
Grönvold K. (2003) Theistareykir revisited. Geochemistry, Geophys. Geosystems 4.
Sturkell E. and Sigmundsson F. (2003) Recent unrest and magma movements at
Eyjafjallajökull and Katla volcanoes, Iceland. J. Geophys. Res. 108.
Sun S. -s. and McDonough W. F. (1989) Chemical and isotopic systematics of oceanic
basalts: implications for mantle composition and processes. Geol. Soc. London,
Spec. Publ. 42, 313–345.

127
Taisne B., Tait S. and Jaupart C. (2011) Conditions for the arrest of a vertical propagating
dyke. Bull. Volcanol. 73, 191–204.
Tarasewicz J., Brandsdóttir B., White R. S. and Hensch M. (2012) Using
microearthquakes to track repeated magma intrusions beneath the Eyjafjallajökull
stratovolcano, Iceland. J. Geophys. Res. 117.
Tarasewicz J., White R. S., Brandsd B. and Schoonman C. M. (2014) Seismogenic
magma intrusion before the 2010 eruption of Eyjafjallajökull volcano, Iceland.
Geophys. J. Int. 198, 906–921.
Tarasewicz J., White R. S., Woods A. W., Brandsdóttir B. and Gudmundsson M. T.
(2012) Magma mobilization by downward-propagating decompression of the
Eyjafjallajökull volcanic plumbing system. Geophys. J. Int. 39.
Thirlwall M. F., Gee M. A. M., Taylor R. N. and Murton B. J. (2004) Mantle components
in Iceland and adjacent ridges investigated using double-spike Pb isotope ratios.
Geochim. Cosmochim. Acta 68, 361–386.
Todt W., Cliff R. A., Hanser A. and Hofmann A. W. (1993) Recalibration of NBS lead
standards using a 202Pb-205Pb double spike. Terra Abstr. 5, 396.

Appendix
Isotope geochemistry procedures
A.1 Acid digestion
Approximately 200 mg of each sample were weighed and placed in Teflon vials.
After adding 1 ml of HNO3 and 2 ml of HF, the samples were capped and left on a
hotplate for 5 days. Samples were dried down and 1 ml of HNO3 was added to each vial
and dried once more to remove any traces of HF. Between 2-4 ml of HCl were added to
the samples, capped to facilitate dissolution, and once again dried down on the hotplate.
Samples were dissolved in 1 ml of 0.7N HBr, then loaded into 2 ml centrifuge tubes. The
solutions were run for 3 minutes at a rate of 8400 rpm in the centrifuge.
A.1.1 Pb separation
To prepare the Pb columns, fresh DOWEX 200-400 mesh resin was added to each
columns and rinsed twice with 1 ml of 7N HCl to clean the resin. This was followed by
two 1 ml rinses of triple distilled water (referred to as “3 sub” as the third distillation is
under sub-boiling conditions). Another 1 ml of 7N HCl was added to the columns.
Subsequently, a final 1 ml of 3 sub water was added. After cleaning, the columns were
conditioned with 1 ml of 0.7N HBr was added to them. The acid collected from column
washing was disposed and the sample vials were loaded beneath the columns.
Samples were loaded carefully so as to avoid loading any of the residuum in the
centrifuge tubes. The columns were eluted with 1 ml of 0.7N HBr three times and once

129
more with 0.75 ml. Following a 0.3 ml elution of 3N HCl, the eluate was collected for Sr
and Nd and moved to a hot plate to dry down.
New sample vials were placed below the columns for Pb collection. Two 0.75 ml
elutions of 7N HCl were collected and these were placed on the hot plate to dry.
A.1.2 Sr and REE separation
The Sr columns with [NAME] resin were cleaned and conditioned with 2 sets of
2.5 ml of 2.5N HCl. Samples dissolved in 2.5N HCl were loaded in the columns and
subsequently rinsed three times with approximately 1/3 ml of 2.5N HCl. Either 12 or 16
ml of 2.5N HCl were added to the columns, depending on the amount of resin in the
column. The waste was disposed and Sr collection vials were placed below the columns.
Samples were eluted with 5 ml of 2.5N HCl and the eluate was collected Sr.
Either 2 or 3 ml of 6.6N HCl were added to each column based on the volume of
resin. The eluate was disposed. Rare earth element vials were placed below the columns.
Columns were eluted with 6 ml of 6.6N HCl for REEs and Nd separation. Both the Sr
and REE eluates were placed on the hot plate to dry.
A.1.3 Nd separation
Acid in the pre-conditioned columns was drained. Meanwhile, 1 ml of 0.26N HCl
was added to the dried REE sample. The bottom of the vial was gentle scratched and
stirred and with a pipette tip to facilitate dissolution. The samples were added to the
columns and subsequently rinsed with 1 ml of 0.26N HCl. Depending on the volume of
resin, 10-12 ml of 0.26N HCl was eluted and disposed. The Nd vials were placed under
the columns and 5 ml of 0.26N HCl were eluted and collected for Nd. Samples were
placed on the hot plate to dry.

130
A.2 Filament preparation
For Pb, a 99.999% Re ribbon was used for the filaments while 99.98% Re was
used for Sr and Nd. A single ribbon is welded onto a two-pronged sample holder for Pb
and Sr. For Nd analysis, two ribbons are welded onto a four-pronged sample holder. One
ribbon is used to host the sample while the other is oriented perpendicular and acts as
another ionization source behind the sample. Once welded to the sample holders, the Re
filaments were degassed and surface contamination was removed by running a 4.0 A
current through the filament.
A.2.1 Pb loading and analysis
Samples for Pb analysis were dissolved in 1 μl of H3PO4 and loaded onto the
filament between two layers of 1 μl tetraethyl orthosilicate (TEOS). During loading,
filaments had currents of 0.8-0.9 A. Once the filaments were dry, the current was
increased very briefly, 1-2 seconds, to 2.2 A. This procedure was also followed for the Pb
standards (NIST SRM 981). This standard was always analyzed at the beginning of a
batch of analyses and after every 3-4 samples. Samples were gradually heated to 1500
mA or ~900°C from 1000 mA at a rate of 100 mA/min. The current was thereafter
increased 30 mA/min towards a target of 1300°C. Ten blocks of 10 cycles were measured
for each sample once a stable signal was achieved.