insights from the ‘best on the...
TRANSCRIPT

Six Morningstar analysts were named among the “Best on the Street” as part of The Wall Street Journal’s 2012 survey. Theses exceptional stock-pickers were chosen based on their performance — FactSet Research Systems collected and calculated scores based on the estimated total return from their buy, sell, and hold recommendations.
These Morningstar analysts were chosen within their respective industries from an eligible field of more than 2,000 professionals at nearly 200 firms (click on their names to see Premium reports on all of the companies that they cover): 3Basili Alukos (Airlines) 3 Matthew Coffina (Food & Drug) 3 Avi Feinberg (Oil Equipment, Services & Distribution) 3 Joung Park (Mining & Metals) 3 David Whiston (Specialty Retailers & Services) 3 Drew Woodbury (Insurance: Life)
We’re proud to offer this special report, which includes insights on top-rated stocks, exclusively to Morningstar Premium members.
Top Picks (listed by analyst)
Basili Alukos Joung Park Southwest Airlines Co (LUV) 2 Yamana Gold Inc (AUY) 51 Eldorado Gold Corp (EGO) 59Matthew CoffinaWellPoint Inc (WLP) 11 David WhistonExpress Scripts (ESRX) 21 General Motors Co (GM) 69 Ford Motor Co (F) 86Avi Feinberg Gentex Corp (GNTX) 101DCP Midstream Partners LP (DPM) 33 TC Pipelines LP (TCP) 42 Drew Woodbury Aflac Inc (AFL) 111 Allstate Corp (ALL) 123
Compliments of Morningstar
Insights From the ‘Best on the Street’

2
?
Southwest Airlines Co LUV [NYSE] | QQQQTM
Last Price Fair Value Consider Buy Consider Sell Uncertainty Economic Moat Stewardship Morningstar Credit Rating Industry8.26 USD 12.00 USD 6.00 USD 21.00 USD Very High None . Airlines BBB-
Currency amounts expressed with "$"are in U.S. dollars (USD) unlessotherwise denoted.
We expect Southwest will generate nearly $500 million insynergies from its AirTran acquisition.
by Basili Alukos, CPA, CFAStock AnalystAnalysts covering this company do notown its stock.
Pricing data through May 07, 2012.Rating updated as ofMay 07, 2012.
08 09 10 11 12
5.0
6.0
7.0
8.0
9.0
14.0
Stock Price
Thesis May 04, 2012 Despite being the lone stalwart in an industry with poorstructural characteristics, we believe Southwest Airlinesis transforming into a legacy carrier.� The U.S. domestic airline industry has seen a plethora ofnew startups over the past 41 years. While deregulationwas the primary catalyst, we believe the absence of anysignificant barriers to entry allowed swift entrance for anystartup, including Southwest. Southwest entered theairline industry predicated on stimulating leisurepassenger demand by offering cheap fares. By flying onetype of aircraft on direct point-to-point routes, Southwestis able to minimize both flight delays and inventory.Furthermore, Southwest minimizes costs by flying intosecond-tier airports such as Chicago Midway, which havelower landing fees. As a result, Southwest’s low-coststructure has allowed it to deliver operating profits for 39consecutive years, making it the envy of an airline industrythat has seen more than 180 bankruptcies since 1978.� Despite its low-cost focus, Southwest’s success hedgingits fuel costs (its largest expense) overshadows any of itsother cost-containment measures, in our opinion.Management has historically used hedging conservativelyto minimize jet fuel prices. However, Southwest’s currenthedges are not a significant cost advantage today.Moreover, the company will also face salary pressuresfrom its unionized workforce (roughly 82% of allemployees) as more contracts become amendable. Sincewe expect expenses to rise, Southwest must increase itsrevenue by possibly raising fares. However, leisuretravelers are sensitive to price increases, and we suspecta tepid return to flying as these passengers cope with therecovering economy.�� In this regard, we think the AirTran acquisition makessense. Southwest will gain access to 37 new markets(including both small and large-scale airports), but we
believe the crown jewel is Atlanta Hartsfield. This is theworld’s busiest airport by passenger traffic and servesaround 90 million passengers annually. With strongerfinancial backing, we expect Southwest will expand theAirTran footprint and believe Southwest can garner asubstantial portion of its stated $400 million in revenuesynergies from the acquisition. In fact, we believe thetotal run rate could achieve $500 million, due toSouthwest’s lower offerings in this and other big marketsAirTran serves.� Even so, any merger comes with integration risks, but webelieve the AirTran purchase may signal the end to theSouthwest to which most passengers are accustomed toflying. For one, Southwest is acquiring a�different�type ofaircraft--the Boeing�717--which we think ends theadvantage Southwest had by flying a single-aircraft fleet.In addition, Southwest is now expanding its presence inthe large airports New York (LaGuardia) and Boston(Logan). This should improve growth prospects, but thesemore-congested airports will slow Southwest’s aircraftturnover.�� Moreover, Southwest is acquiring larger aircraft with theidea it will commence service to Hawaii in 2012, and itappears international flying is next on the radar. Whileinternational flights are more profitable, we suspect thenew Southwest will more closely resemble a legacycarrier than its traditional operating model, and we thinkits future returns will suffer as a result. Valuation, Growth and Profitability Our fair value estimate for Southwest is $12 pershare.�We expect that Southwest will delivermid-single-digit growth in 2012 due to modestly higherticket prices, as the reduction in industry capacity shouldbolster yields.�We suspect Southwest’s decision toabstain from charging the first and second checked bagfees should enable the company to fly fuller planes. In thelonger term, however, we suspect increased competitionwill cause growth to slow, although we project thatSouthwest should generate roughly $500 million in

3
Southwest Airlines Co LUV [NYSE] | QQQQTM
Last Price Fair Value Consider Buy Consider Sell Uncertainty Economic Moat Stewardship Morningstar Credit Rating Industry8.26 USD 12.00 USD 6.00 USD 21.00 USD Very High None . Airlines BBB-
Close Competitors Currency(Mil) Market Cap TTM Sales Oper Income Net Income
Southwest Airlines Co
JetBlue Airways Corporation
USD
USD
6,341 16,546 601 271
1,377 4,695 366 113
Morningstar data as of May 07, 2012.
revenue synergies over the long run. All told, thistranslates into 5% revenue growth for the combinedcompany over the next five years, which is down from theaverage 10% increase delivered historically.�� Both the stronger growth and better airplane utilizationshould bolster profitability because of the high amount ofoperating leverage innate in an airline. As such, we expectSouthwest to deliver 6% average annual�operatingmargins during our forecast period. Although impressivefor an airline, our operating margin expectations arebelow the company’s long-term 9% yearly average. Weexpect Southwest will pare expansion plans to cope withthe current economic environment and predict capitalspending will average 5% per year over our forecastperiod, which is well below historical averages. Risk Integrating AirTran will pose the biggest hurdle forSouthwest, as the company must, among other things,combine the two workforces and�earn its single operatingcertificate in relatively short order. Merger aside,�risingfuel costs most threaten Southwest’s success, in ouropinion. Despite its successful hedges, fuel costs areextremely volatile and represent roughly 30% of the firm’stotal operating costs. Labor costs also represent asignificant risk to Southwest’s profitability because unionrepresentation covers�nearly 75% of the combined-entity’sworkers. Losing its investment-grade credit rating couldalso be detrimental for Southwest, as a lower rating willcause Southwest to post more cash collateral and could
impair its future hedging abilities. Bulls Say
Preying on weaker competitors, Southwest has usedthe downturn to expand service offerings toMinneapolis-St. Paul, New York LaGuardia, and BostonLogan airports. If successful, these new markets willprovide ample growth opportunities going forward. Southwest and AirTran have very little route overlap,and the combined entity gains access to 37 newmarkets, which will provide instant growth potentialand reduces any cannibalization traditionally associatedwith an airline merger. In attempt to increase growth, Southwest is introducingthe Boeing 737-800 into its fleet beginning in 2012.These planes are more fuel efficient--we estimateSouthwest can replace three 737-300 flights with two737-800s--and these planes enable Southwest to flylong-haul routes including to and from Hawaii.
Bears Say
Airlines for America estimates that the tax percentageon airfare has tripled to roughly 20% of the price of aticket today, up from 7% in 1972. We don’t expect theamount of taxation to decrease going forward,especially as the government contemplates ways to payfor increased security measures, so Southwest and theindustry likely will receive a smaller share of futureticket proceeds. Southwest is solely a domestic carrier and has roughly40% of its capacity concentrated in the Western U.S.,leaving it more susceptible to a U.S. geographicslowdown than many of its competitors. Southwest has encountered regulatory problems overthe past two years in regard to maintenance procedureson some of its older aircraft. Southwest could face finesor customers may select another airline if these
© 2012 Morningstar. All Rights Reserved. Unless otherwise provided in a separate agreement, you may use this report only in the country in which its original distributor is based. Data as originally reported.The information contained herein is not represented or warranted to be accurate, correct, complete, or timely. This report is for information purposes only, and should not be considered a solicitation to buy or sell any security.Redistribution is prohibited without written permission. To order reprints, call +1 312-696-6100. To license the research, call +1 312-696-6869.
ß ®

4
Southwest Airlines Co LUV [NYSE] | QQQQTM
Last Price Fair Value Consider Buy Consider Sell Uncertainty Economic Moat Stewardship Morningstar Credit Rating Industry8.26 USD 12.00 USD 6.00 USD 21.00 USD Very High None . Airlines BBB-
problems persist, both of which could hurt growth andprofitability.
Financial Overview Financial Health: Southwest is in decent financial shape.The company holds $3.8 billion in cash and short-terminvestments, in addition to an $800 million undrawnrevolver. The firm should be able to meet its principalcommitments over the next five years, although higherfuel prices could pose a problem. Company Overview Profile: Texas-based Southwest Airlines is the largestcarrier in the United States as measured by the number oforiginating passengers boarded. Combined with its recentacquisition of AirTran, Southwest operates a fleet ofnearly 700 aircraft comprising an all Boeing fleet. Theairline specializes in short-haul routes using apoint-to-point network and offers frequent flights toaround 110 markets cities. The combined firm employsalmost 46,000 workers and generates�approximately $17billion in annual revenue on a consolidated basis. Management: We think Southwest has historically done adecent job allocating shareholder capital in light ofoperating in the horrendous airline industry. Until fuelprices soared during most of the last decade, Southwestexploited its low-cost advantage to produce ROICs inexcess of its cost of capital. However, the company’saging workforce and elevated fuel prices�eroded�its moat,and we expect the poor fundamentals of the airlineindustry will dictate Southwest’s returns rather than poorcapital-allocation decisions.�� Southwest is run by CEO Gary Kelly, who began workingfor the carrier in 1986 as the firm’s controller beforeearning his current title in 2004. Kelly has done an
admirable job managing the airline through the 2008recession. Along with CFO Laura Wright, also a firmveteran, we believe that the management team has whatit takes to lead the Southwest-AirTran integration�andready the company to expand its international operations.
© 2012 Morningstar. All Rights Reserved. Unless otherwise provided in a separate agreement, you may use this report only in the country in which its original distributor is based. Data as originally reported.The information contained herein is not represented or warranted to be accurate, correct, complete, or timely. This report is for information purposes only, and should not be considered a solicitation to buy or sell any security.Redistribution is prohibited without written permission. To order reprints, call +1 312-696-6100. To license the research, call +1 312-696-6869.
ß ®

5
Southwest Airlines Co LUV [NYSE] | QQQQTM
Last Price Fair Value Consider Buy Consider Sell Uncertainty Economic Moat Stewardship Morningstar Credit Rating Industry8.26 USD 12.00 USD 6.00 USD 21.00 USD Very High None . Airlines BBB-
Analyst Notes
Apr. 20, 2012 US Airways’ Labor Agreement Further Suggests it is Readying a Bid for Bankrupt AMR
US Airways issued a news release on April 20, saying thecompany reached agreements for collective bargainingagreements that would govern the American Airlinesemployees represented by the Transport Workers Union,Association of Professional Flight Attendants, and AlliedPilots Association. The release states that theseagreements are contingent upon a merger between USAirways and AMR, although there is no agreement at thistime.� �During its fourth-quarter earnings call, US Airwaysannounced that it retained financial advisors to exploreoptions for AMR. At the time, we concluded that USAirways would bid on AMR, and these agreements suggestUS Airways is far along in the process of launching a bid.�� �
As we said in late January, US Airways deserves credit forrightsizing its business and emerging as a strongercompetitor today. However, we believe US Airways needsto bulk up its network to compete in the industry, especiallyas closest competitor Southwest is readying forinternational flying by 2014. � �We expect to hear more from US Airways when it reportsnext week, but we wouldn’t be surprised if the companylaunches a bid within the next two quarters, especially ifAMR plans to exit bankruptcy by the end of this year.��
Apr. 19, 2012 Southwest Reports First-Quarter Earnings
Southwest Airlines reported first-quarter earnings onThursday that were mostly consistent with our projections,and we are maintaining our fair value estimate. Pro formarevenue increased 6% from the year-ago period, drivenentirely by higher ticket prices. Despite the growth, profitswere pressured by a 17% increase in fuel costs. As a result,operating margins contracted 170 basis points to 0.6%.However, Southwest’s meager profit was due to $170million benefit mostly related to fuel hedges. Without theeffect of hedges, the firm would have reported an $18million loss. � �We believe Southwest will remain in a state of flux until itcompletes its AirTran integration in 2014. Until then, thecompany will operate as two separate airlines, whereAirTran will maintain its business class and baggage fee,while Southwest sustains its no checked baggage fees.
Further, we expect Southwest will face the higher fuel priceenvironment with minimal hedge exposure, and believe thecompany will struggle to increase ticket prices further givenits large base of leisure travelers, who are more sensitiveto ticket prices. � �Despite these�headwinds, we think Southwest’s futurelooks better beyond 2014. The company announced itselected Amadeus, a reservations technology company, toprovide international capability to its domestic-only ticketsystems. This will become more important once therepealed Wright Amendment expires in 2014, which willallow Southwest to operate direct flights from Love Field(Dallas) to international markets. Coupled with the deliveryof larger 737-800 aircraft, we expect the company willbenefit immensely from international markets, and willlikely steal share from rivals.��
Jan. 19, 2012 Southwest Reports 4Q Earnings
Southwest Airlines reported fourth-quarter earnings on Thursday that were mostly consistent with our projections.��
© 2012 Morningstar. All Rights Reserved. Unless otherwise provided in a separate agreement, you may use this report only in the country in which its original distributor is based. Data as originally reported.The information contained herein is not represented or warranted to be accurate, correct, complete, or timely. This report is for information purposes only, and should not be considered a solicitation to buy or sell any security.Redistribution is prohibited without written permission. To order reprints, call +1 312-696-6100. To license the research, call +1 312-696-6869.
ß ®

6
Southwest Airlines Co LUV [NYSE] | QQQQTM
Last Price Fair Value Consider Buy Consider Sell Uncertainty Economic Moat Stewardship Morningstar Credit Rating Industry8.26 USD 12.00 USD 6.00 USD 21.00 USD Very High None . Airlines BBB-
Analyst Notes (continued)
�Pro forma revenue increased 9% from the year-ago period,driven by a 9% increase in ticket prices and 2% greatervolume. Southwest did a commendable job of controllingmanageable expenses, as its costs per available seat mile,excluding integration items and fuel, budged only 0.5%higher versus the prior year. However, Southwest paid 34%more per gallon for fuel, which caused fuel expenses tosurge 30% higher than last year. As a result, operatingmargins contracted 240 basis points to 3.6%. �
�The AirTran integration is progressing well. Southwestnoted it is already producing more than $200 million in netannualized pre-tax synergies. We believe Southwest willexceed its $400 million synergy goal because the companynow has access to Atlanta-Hartsfield, the world’s busiestairport by annual number of passengers. Still, therealization of these savings depends on a successfulintegration.��
Nov. 29, 2011 As We Expected, AMR Succumbs to Bankruptcy
AMR Corporation , the parent of American Airlines,announced Tuesday that it is voluntarily filing for Chapter11 reorganization. On Oct. 21, we published our belief thatAMR would succumb to bankruptcy and that its commonequity would be worthless. We lowered our credit rating onAMR to CC on Monday, as we thought financial distresswas imminent. We are maintaining our current $0 fair valueestimate, but will lower our credit rating to D as a result ofthe filing.� �We believe that a bankruptcy filing, while difficult, is thecorrect move for AMR to cleanse its debt-laden balancesheet and bloated cost structure.�As of the third quarter,AMR held about $12 billion in debt and $7 billion in pensionliabilities compared with $4.3 billion in unrestricted cash($4.1 billion as of the bankruptcy filing date). We hadexpected the company’s cash balance to dwindle to $1.2billion at the end of 2012, which we opined was insufficientto operate an airline and repay 2013 debt commitments.� �We calculate that the pretax labor cost differentialbetween AMR and other legacy carriers over the past fewyears was $1.2 billion-$1.5 billion, nearly double AMR’sestimate of $800 million. Further, we calculate the cost ofoperating an antiquated fleet of aircraft cost AMR about
$115 million annually in additional costs for repair andmaintenance alone, versus the legacy carriers. This numberdoesn’t include the additional cost burn due to operatingfuel-inefficient aircraft or the opportunity cost of flyingapproximately one hour per day fewer�over AMR’s entirefleet.�Collectively, we believe these cost disadvantagescaused AMR to file for bankruptcy, and we believe thecosts were sufficiently burdensome that even if thecompany had signed a new labor deal with its pilots, itwould not have averted bankruptcy.� �There has been speculation of an AMR-US Airways mergerafter AMR’s bankruptcy. We believe this merger wouldmake sense, as US Airways employs a lower-cost structureand would be profitable on the domestic front, while AMR,given its strong international presence, would operate theinternational routes. However, we acknowledge thatcomplications exist, specifically pilot integration, that couldderail a merger.� �Even if a merger doesn’t occur, we expect that the AMRbankruptcy will benefit the industry. We think AMR wasextremely aggressive on pricing as it struggled to survive;now that the company will emerge with a leaner coststructure, we expect ticket prices will trend higher over the
© 2012 Morningstar. All Rights Reserved. Unless otherwise provided in a separate agreement, you may use this report only in the country in which its original distributor is based. Data as originally reported.The information contained herein is not represented or warranted to be accurate, correct, complete, or timely. This report is for information purposes only, and should not be considered a solicitation to buy or sell any security.Redistribution is prohibited without written permission. To order reprints, call +1 312-696-6100. To license the research, call +1 312-696-6869.
ß ®

7
Southwest Airlines Co LUV [NYSE] | QQQQTM
Last Price Fair Value Consider Buy Consider Sell Uncertainty Economic Moat Stewardship Morningstar Credit Rating Industry8.26 USD 12.00 USD 6.00 USD 21.00 USD Very High None . Airlines BBB-
Analyst Notes (continued)
long term.�
© 2012 Morningstar. All Rights Reserved. Unless otherwise provided in a separate agreement, you may use this report only in the country in which its original distributor is based. Data as originally reported.The information contained herein is not represented or warranted to be accurate, correct, complete, or timely. This report is for information purposes only, and should not be considered a solicitation to buy or sell any security.Redistribution is prohibited without written permission. To order reprints, call +1 312-696-6100. To license the research, call +1 312-696-6869.
ß ®
Disclaimers & DisclosuresNo Morningstar employees are officers or directors of this company. Morningstar Inc. does not own more than 1% of the shares of this company. Analystscovering this company do not own its stock. The information contained herein is not represented or warranted to be accurate, correct, complete, or timely.This report is for information purposes only, and should not be considered a solicitation to buy or sell any security.

8
Morningstar Stock Data Sheet Pricing data thru May 07, 2012 Rating updated as of May 07, 2012Pricing data thru May 07, 2012 Rating updated as of May 07, 2012 Fiscal year-end: December
Southwest Airlines Co LUV Sales USD Mil Mkt Cap USD Mil Industry Sector16,546 6,341 Airlines
Industrials
TMMorningstar Rating Last Price Fair Value Uncertainty Economic Moat Stewardship GradeQQQQ 8.26 12.00 Very High None .
per share prices in USD
2002 2003 2004 2005 2006 2007 2008 2009 2010 2011 YTD
1.0
3.0
6.0
14.0
4.0
8.0
22.0011.11
19.6911.72
17.0612.88
16.9513.05
18.2014.61
16.9612.12
16.777.05
11.784.95
14.3210.42
13.597.15
10.057.76
Annual Price HighLowRecent Splits
Price VolatilityMonthly High/LowRel Strength to S&P 500
52 week High/Low12.44 - 7.15
10 Year High/Low22.00 - 4.95
Bear-Market Rank5 (10=worst)
Trading Volume Million
Stock Performance
Texas-based Southwest Airlines is the largest carrier in theUnited States as measured by the number of originatingpassengers boarded. Combined with its recent acquisition ofAirTran, Southwest operates a fleet of nearly 700 aircraftcomprising an all Boeing fleet. The airline specializes inshort-haul routes using a point-to-point network and offersfrequent flights to around 110 markets cities. The combinedfirm employs almost 46,000 workers andgenerates�approximately $17 billion in annual revenue on aconsolidated basis.
P.O. Box 36611 Dallas, TX 75235-1611Phone: 1 214 792-4000Website: http://www.southwest.com
Growth Rates Compound AnnualGrade: B 1 Yr 3 Yr 5 Yr 10 Yr
Revenue % 29.4 12.4 11.5 10.9Operating Income % -29.9 15.6 -5.8 0.9Earnings/Share % -62.3 -1.4 -17.7 -9.6Dividends % 0.0 0.0 0.0 0.0Book Value/Share % 6.7 10.0 1.8 5.5Stock Total Return % -31.6 4.8 -10.8 -7.5+/- Industry -23.3 -13.7 -4.6 -8.7+/- Market -33.2 -9.9 -8.9 -10.1
Profitability AnalysisGrade: D Current 5 Yr Avg Ind Mkt
Return on Equity % 4.0 5.0 14.2 22.2Return on Assets % 1.5 2.0 1.8 9.3Fixed Asset Turns 1.5 1.1 1.7 7.5Inventory Turns 19.0 20.1 30.7 16.8Revenue/Employee USD K 357.9 329.9 . 1035.3
Gross Margin % 56.8 58.3 52.6 40.1Operating Margin % 3.6 5.4 6.4 18.9Net Margin % 1.6 2.8 2.0 11.3Free Cash Flow/Rev % 3.7 . 3.7 0.1R&D/Rev % . . . 9.4
*
*3Yr Avg data is displayed in place of 5Yr Avg
Financial PositionGrade: C 12-11 USD Mil 03-12 USD Mil
Cash 829 1558Inventories 401 432Receivables 299 367
Current Assets 4345 5120
Fixed Assets 12127 12095Intangibles 970 1117
Total Assets 18068 18826
Payables 1057 1208Short-Term Debt 644 259
Current Liabilities 4533 5047Long-Term Debt 3107 3048
Total Liabilities 11191 11729
Total Equity 6877 7097
2002 2003 2004 2005 2006 2007 2008 2009 2010 2011 TTM FinancialsRevenue USD Mil5522 5937 6530 7584 9086 9861 11023 10350 12104 15658 16546Gross Margin %51.1 52.9 52.5 52.6 49.5 46.2 59.8 63.6 63.9 57.9 56.8Oper Income USD Mil417 483 554 820 934 791 449 262 988 693 601Operating Margin %7.6 8.1 8.5 10.8 10.3 8.0 4.1 2.5 8.2 4.4 3.6
Net Income USD Mil241 442 313 548 499 645 178 99 459 178 271
Earnings Per Share USD0.30 0.54 0.38 0.67 0.61 0.84 0.24 0.13 0.61 0.23 0.35Dividends USD0.02 0.02 0.02 0.02 0.02 0.02 0.02 0.02 0.02 0.02 0.02Shares Mil803 819 824 818 818 768 742 741 747 775 781Book Value Per Share USD5.69 6.40 7.09 8.42 8.14 9.46 6.70 7.34 8.34 8.83 9.24
Oper Cash Flow USD Mil520 1336 1157 2229 1406 2845 -1521 985 1561 1385 1645Cap Spending USD Mil-603 -1238 -1775 -1210 -1399 -1331 -923 -585 -493 -968 -1038Free Cash Flow USD Mil-83 98 -618 1019 7 1514 -2444 400 1068 417 607
Valuation AnalysisCurrent 5 Yr Avg Ind Mkt
Price/Earnings 23.8 39.3 14.8 15.1Forward P/E 8.2 . . 13.8Price/Cash Flow 3.9 . 4.6 7.9Price/Free Cash Flow 10.6 . 13.7 17.7Dividend Yield % 0.2 . 0.3 2.0Price/Book 0.9 1.3 2.3 2.2Price/Sales 0.4 0.7 0.4 1.3PEG Ratio 0.4 . . 1.8
Total Return %-24.7 16.2 1.0 1.0 -6.7 -20.3 -29.2 32.8 13.7 -33.9 -3.5+/- Market-1.3 -10.2 -8.0 -2.0 -20.3 -23.8 9.3 9.4 0.9 -33.9 -12.4+/- Industry-3.8 -15.4 -3.0 -25.1 -26.7 -9.0 14.4 7.5 -15.0 -8.6 -20.1
Dividend Yield %0.1 0.1 0.1 0.1 0.1 0.1 0.2 0.2 0.1 0.2 0.2Market Cap USD Mil10796 12741 12692 13024 12131 8955 6376 8490 9702 6664 6341
2002 2003 2004 2005 2006 2007 2008 2009 2010 2011 TTM ProfitabilityReturn on Assets %2.7 4.7 3.0 4.3 3.6 4.3 1.1 0.7 3.1 1.1 1.5Return on Equity %5.7 9.3 5.9 9.0 7.6 9.6 3.0 1.9 7.8 2.7 4.0
Net Margin %4.4 7.4 4.8 7.2 5.5 6.5 1.6 1.0 3.8 1.1 1.6Asset Turnover0.62 0.63 0.62 0.59 0.66 0.65 0.71 0.72 0.81 0.93 0.94Financial Leverage2.0 2.0 2.0 2.1 2.1 2.4 2.9 2.6 2.5 2.6 2.6
2002 2003 2004 2005 2006 2007 2008 2009 2010 2011 03-12 Financial HealthWorking Capital USD Mil798 590 30 -228 -286 -395 87 682 974 -188 73Long-Term Debt USD Mil1553 1332 1700 1394 1567 2050 3498 3325 2875 3107 3048Total Equity USD Mil4422 5052 5524 6675 6449 6941 4953 5466 6237 6877 7097Debt/Equity0.35 0.26 0.31 0.21 0.24 0.30 0.71 0.61 0.46 0.45 0.43
2002 2003 2004 2005 2006 2007 2008 2009 2010 2011 TTM ValuationPrice/Earnings46.3 29.9 42.9 24.5 25.1 14.5 36.0 87.7 21.3 37.2 23.8P/E vs. Market. . . . . . . . . 2.1 1.6Price/Sales2.0 2.2 2.0 1.8 1.4 0.9 0.6 0.8 0.8 0.4 0.4Price/Book2.4 2.5 2.3 2.0 1.9 1.3 1.3 1.6 1.6 1.0 0.9Price/Cash Flow21.5 9.9 11.6 6.0 9.1 3.3 . 8.6 6.2 4.8 3.9
Quarterly ResultsRevenue
Rev Growth
Earnings Per Share
USD Mil Jun 11 Sep 11 Dec 11 Mar 12
% Jun 11 Sep 11 Dec 11 Mar 12
USD Jun 11 Sep 11 Dec 11 Mar 12
Most Recent Period 4136.0 4311.0 4108.0 3991.0Prior Year Period 3168.0 3192.0 3114.0 3103.0
Most Recent Period 30.6 35.1 31.9 28.6Prior Year Period 21.1 19.7 14.8 18.0
Most Recent Period 0.21 -0.18 0.20 0.13Prior Year Period 0.15 0.27 0.17 0.01
Industry Peers by Market Cap
Major Fund Holders
Mkt Cap USD Mil Rev USD Mil P/E ROE%
% of shares
Southwest Airlines C 6341 16546 23.8 4.0JetBlue Airways Corp 1377 4695 15.6 6.5
.
.
.
TTM data based on rolling quarterly data if available; otherwise most recent annual data shown.
© 2012 Morningstar. All Rights Reserved. Unless otherwise provided in a separate agreement, you may use this report only in the country in which its original distributor is based. Data as originally reported. The information contained herein is not represented or warranted to be accurate, correct, complete, or timely. This report is for information purposes only, and should not be considered a solicitation to buy or sell any security. Redistribution is prohibited without written permission. To order reprints, call +1 312-696-6100. To license the research, call +1 312-696-6869. ß
®

9
Morningstar’s Approach to Rating Stocks
Our Key Investing ConceptsEconomic Moat Rating��Discounted Cash Flow��Discount Rate��Fair Value��Uncertainty��Margin of Safety��Consider Buying/Consider Selling��Stewardship Grades��
TMAt Morningstar, we evaluate stocks as pieces of abusiness, not as pieces of paper. We think that purchasingshares of superior businesses at discounts to theirintrinsic value and allowing them to compound their valueover long periods of time is the surest way to createwealth in the stock market. We rate stocks 1 through 5 stars, with 5 the best and 1the worst. Our star rating is based on our analyst’sestimate of how much a company’s business is worth pershare. Our analysts arrive at this "fair value estimate" byforecasting how much excess cash--or "free cashflow"--the firm will generate in the future, and thenadjusting the total for timing and risk. Cash generatednext year is worth more than cash generated several yearsdown the road, and cash from a stable and consistentlyprofitable business is worth more than cash from acyclical or unsteady business. Stocks trading at meaningful discounts to our fair valueestimates will receive high star ratings. For high-qualitybusinesses, we require a smaller discount than formediocre ones, for a simple reason: We have moreconfidence in our cash-flow forecasts for strongcompanies, and thus in our value estimates. If a stock’smarket price is significantly above our fair value estimate,it will receive a low star rating, no matter how wonderfulwe think the business is. Even the best company is a baddeal if an investor overpays for its shares. Our fair value estimates don’t change very often, butmarket prices do. So, a stock may gain or lose stars based
just on movement in the share price. If we think a stock’sfair value is $50, and the shares decline to $40 withoutmuch change in the value of the business, the star ratingwill go up. Our estimate of what the business is worthhasn’t changed, but the shares are more attractive as aninvestment at $40 than they were at $50. Because we focus on the long-term value of businesses,rather than short-term movements in stock prices, at timeswe may appear out of step with the overall stock market.When stocks are high, relatively few will receive ourhighest rating of 5 stars. But when the market tumbles,many more will likely garner 5 stars. Although you mightexpect to see more 5-star stocks as the market rises, wefind assets more attractive when they’re cheap. We calculate our star ratings nightly after the marketsclose, and issue them the following business day, which iswhy the rating date on our reports will always be theprevious business day. We update the text of our reportsas new information becomes available, usually about onceor twice per quarter. That is why you’ll see two dates onevery Morningstar stock report. Of course, we monitormarket events and all of our stocks every business day, soour ratings always reflect our analyst’s current opinion. Economic Moat Rating The Economic Moat Rating is our assessment of a firm’sability to earn returns consistently above its cost of capitalin the future, usually by virtue of some competitiveadvantage. Competition tends to drive down such
TM
TM
Morningstar ResearchMethodology for ValuingCompanies QQQQQCompetitive Economic Company Fair Value Uncertainty
Analysis Moat Rating Valuation Estimate AssessmentTM
Analyst conducts The depth of the Analyst considers DCF model leads to An uncertaintycompany and industry firm’s competitive company financial the firm’s Fair Value assessmentresearch: advantage is rated: statements and Estimate, which establishes the� � competitive position anchors the rating margin ofManagement None to forecast future framework. safety required forinterviews Narrow cash flows. the stock rating.Conference calls Wide �Trade-show visits Assumptions areCompetitor, supplier, input into a dis-distributor, and counted cash-flowcustomer interviews model.
The current stockprice relative to fairvalue, adjustedfor uncertainty,determines therating.
QQQQQQQQQQQQQQQ
© 2012 Morningstar. All Rights Reserved. Unless otherwise provided in a separate agreement, you may use this report only in the country in which its original distributor is based. Data as originally reported.The information contained herein is not represented or warranted to be accurate, correct, complete, or timely. This report is for information purposes only, and should not be considered a solicitation to buy or sell any security.Redistribution is prohibited without written permission. To order reprints, call +1 312-696-6100. To license the research, call +1 312-696-6869.
ß ®

10
Morningstar’s Approach to Rating Stocks (continued)
economic profits, but companies that can earn them for anextended time by creating a competitive advantagepossess an Economic Moat. We see these companies assuperior investments. Discounted Cash Flow This is a method for valuing companies that involvesprojecting the amount of cash a business will generate inthe future, subtracting the amount of cash that thecompany will need to reinvest in its business, and usingthe result to calculate the worth of the firm. We use thistechnique to value nearly all of the companies we cover. Discount Rate We use this number to adjust the value of our forecastedcash flows for the risk that they may not materialize. For aprofitable company in a steady line of business, we’ll usea lower discount rate, also known as "cost of capital,"than for a firm in a cyclical business with fiercecompetition, since there’s less risk clouding the firm’sfuture. Fair Value This is the output of our discounted cash-flow valuationmodels, and is our per-share estimate of a company’sintrinsic worth. We adjust our fair values for off-balancesheet liabilities or assets that a firm might have--forexample, we deduct from a company’s fair value if it hasissued a lot of stock options or has an under-fundedpension plan. Our fair value estimate differs from a "targetprice" in two ways. First, it’s an estimate of what thebusiness is worth, whereas a price target typically reflectswhat other investors may pay for the stock. Second, it’s along-term estimate, whereas price targets generally focuson the next two to 12 months. Uncertainty To generate the Morningstar Uncertainty Rating, analystsconsider factors such as sales predictability, operatingleverage, and financial leverage. Analysts then classifytheir ability to bound the fair value estimate for the stockinto one of several uncertainty levels: Low, Medium, High,
Very High, or Extreme. The greater the level of uncertainty,the greater the discount to fair value required before astock can earn 5 stars, and the greater the premium to fairvalue before a stock earns a 1-star rating. Margin of Safety This is the discount to fair value we would require beforerecommending a stock. We think it’s always prudent tobuy stocks for less than they’re worth.The margin of safetyis like an insurance policy that protects investors from badnews or overly optimistic fair value estimates. We requirelarger margins of safety for less predictable stocks, andsmaller margins of safety for more predictable stocks. Consider Buying/Consider Selling The consider buying price is the price at which a stockwould be rated 5 stars, and thus the point at which wewould consider the stock an extremely attractivepurchase. Conversely, consider selling is the price atwhich a stock would have a 1 star rating, at which pointwe’d consider the stock overvalued, with low expectedreturns relative to its risk. Stewardship Grades Our corporate Stewardship Rating represents ourassessment of management’s stewardship of shareholdercapital, with particular emphasis on capital allocationdecisions. Analysts consider companies’ investmentstrategy and valuation, financial leverage, dividend andshare buyback policies, execution, compensation, relatedparty transactions, and accounting practices. Corporategovernance practices are only considered if they’ve had ademonstrated impact on shareholder value. Analystsassign one of three ratings: "Exemplary," "Standard," and"Poor." Analysts judge stewardship from an equity holder’sperspective. Ratings are determined on an absolute basis.Most companies will receive a Standard rating, and this isthe default rating in the absence of evidence thatmanagers have made exceptionally strong or poor capitalallocation decisions.
© 2012 Morningstar. All Rights Reserved. Unless otherwise provided in a separate agreement, you may use this report only in the country in which its original distributor is based. Data as originally reported.The information contained herein is not represented or warranted to be accurate, correct, complete, or timely. This report is for information purposes only, and should not be considered a solicitation to buy or sell any security.Redistribution is prohibited without written permission. To order reprints, call +1 312-696-6100. To license the research, call +1 312-696-6869.
ß ®

11
?
WellPoint Inc WLP [NYSE] | QQQQQTM
Last Price Fair Value Consider Buy Consider Sell Uncertainty Economic Moat Stewardship Morningstar Credit Rating Industry66.60 USD 105.00 USD 73.50 USD 141.75 USD Medium Narrow . Health Care Plans A-
Currency amounts expressed with "$"are in U.S. dollars (USD) unlessotherwise denoted.
WellPoint 1Q Consistent With Our Expectations, butManagement Execution Remains a Weakness
by Matthew Coffina, CFASenior Stock AnalystAnalysts covering this company do notown its stock.
Pricing data through May 07, 2012.Rating updated as ofMay 07, 2012.
08 09 10 11 12
33.0
43.0
53.0
63.0
73.0Stock Price
Analyst Note Apr. 25, 2012 Our full-year estimates for WellPoint appear within reach,following the release of first-quarter results, and we aremaintaining our $105 fair value estimate. We continue toview WellPoint as meaningfully undervalued. Excluding investment gains, WellPoint’s first-quarterearnings per share declined by 1 cent to $2.34. A 10.6%decline in the share count was not enough to make up fora slightly larger decline in operating income. Operatingrevenue increased 3.4%, with more than half of thisgrowth attributable to the CareMore acquisition and therest the result of premium increases. Both the medical cost ratio (medical costs as a percentageof premium revenue) and the operating cost ratio (selling,general, and administrative expense as a percentage ofoperating revenue) deteriorated in the first quarter. Themedical cost ratio was up 120 basis points to 83.3%. Thefirst quarter is a seasonally strong quarter, and our modelincorporates an 85.3% rate for the full year with furtherdeterioration in subsequent years. The operating cost ratiowas worse than we expected, up 10 basis points to14.3%. We are counting on improvements in this metric tohelp offset medical cost pressures. We are discouraged by WellPoint’s membership results.The company shed 3% of local group and national accountmembers since the end of last year. Managementattributed this loss to disciplined pricing and competitivepressure. While trading off membership for margins isusually a good idea for managed-care organizations,WellPoint is experiencing both deteriorating membershipand margins. This is exactly the opposite of what wewould expect, as WellPoint’s scale should give it a costadvantage that enables it to grow membership withoutsacrificing margins. Management execution appears to belacking, particularly relative to peer UnitedHealth.
Thesis Feb. 27, 2012 WellPoint faces several risks, including�heightenedregulatory scrutiny of premium rate increases and thepossibility that health insurance exchanges will increasecompetition and erode the company’s economic moat. Onthe other hand, WellPoint enjoys a meaningful costadvantage from its unmatched combination of regionaland national scale. We believe recent share prices wellbelow our fair value estimate offer investors a reasonablemargin of safety.� Scale is critical in managed care for two reasons: it allowsmanaged-care organizations (MCOs) to spread fixedadministrative costs over more members, and it helpsthem to negotiate the best discounts with health-careproviders. WellPoint is one of the nation’s largest MCOsby medical membership, and the regional concentration ofits 14 Blue Cross and Blue Shield plans gives it aparticularly strong bargaining position with providers.� Health-care spending growth has consistently outpacednominal gross domestic product growth during the last 50years. Because health-care costs increase so rapidly andconsistently, it is essential for MCOs to raise premiums atleast in line with medical costs to prevent margincontraction. WellPoint underestimated its medical costtrends in 2008, leading to significant deterioration in itsmedical cost ratio (medical costs as a percentage ofpremium revenue). However, the company recognized itsproblem earlier than any of its peers and quickly raisedprices, leading to an almost immediate improvement inresults. We think this was a clear demonstration of thecompany’s pricing power and its dedication to rationalpricing.� While short-term fluctuations in medical cost trends arenearly impossible to predict, over the long run we expectmost MCOs to�try to�raise prices in line with average costgrowth. The sector is relatively consolidated, marginshave a much greater effect on the bottom line thanmembership levels, and customer relationships tend to besticky, so it generally isn’t worthwhile for an MCO toundercut its competitors on price.�

12
Morningstar’s Approach to Rating Stocks (continued)
economic profits, but companies that can earn them for anextended time by creating a competitive advantagepossess an Economic Moat. We see these companies assuperior investments. Discounted Cash Flow This is a method for valuing companies that involvesprojecting the amount of cash a business will generate inthe future, subtracting the amount of cash that thecompany will need to reinvest in its business, and usingthe result to calculate the worth of the firm. We use thistechnique to value nearly all of the companies we cover. Discount Rate We use this number to adjust the value of our forecastedcash flows for the risk that they may not materialize. For aprofitable company in a steady line of business, we’ll usea lower discount rate, also known as "cost of capital,"than for a firm in a cyclical business with fiercecompetition, since there’s less risk clouding the firm’sfuture. Fair Value This is the output of our discounted cash-flow valuationmodels, and is our per-share estimate of a company’sintrinsic worth. We adjust our fair values for off-balancesheet liabilities or assets that a firm might have--forexample, we deduct from a company’s fair value if it hasissued a lot of stock options or has an under-fundedpension plan. Our fair value estimate differs from a "targetprice" in two ways. First, it’s an estimate of what thebusiness is worth, whereas a price target typically reflectswhat other investors may pay for the stock. Second, it’s along-term estimate, whereas price targets generally focuson the next two to 12 months. Uncertainty To generate the Morningstar Uncertainty Rating, analystsconsider factors such as sales predictability, operatingleverage, and financial leverage. Analysts then classifytheir ability to bound the fair value estimate for the stockinto one of several uncertainty levels: Low, Medium, High,
Very High, or Extreme. The greater the level of uncertainty,the greater the discount to fair value required before astock can earn 5 stars, and the greater the premium to fairvalue before a stock earns a 1-star rating. Margin of Safety This is the discount to fair value we would require beforerecommending a stock. We think it’s always prudent tobuy stocks for less than they’re worth.The margin of safetyis like an insurance policy that protects investors from badnews or overly optimistic fair value estimates. We requirelarger margins of safety for less predictable stocks, andsmaller margins of safety for more predictable stocks. Consider Buying/Consider Selling The consider buying price is the price at which a stockwould be rated 5 stars, and thus the point at which wewould consider the stock an extremely attractivepurchase. Conversely, consider selling is the price atwhich a stock would have a 1 star rating, at which pointwe’d consider the stock overvalued, with low expectedreturns relative to its risk. Stewardship Grades Our corporate Stewardship Rating represents ourassessment of management’s stewardship of shareholdercapital, with particular emphasis on capital allocationdecisions. Analysts consider companies’ investmentstrategy and valuation, financial leverage, dividend andshare buyback policies, execution, compensation, relatedparty transactions, and accounting practices. Corporategovernance practices are only considered if they’ve had ademonstrated impact on shareholder value. Analystsassign one of three ratings: "Exemplary," "Standard," and"Poor." Analysts judge stewardship from an equity holder’sperspective. Ratings are determined on an absolute basis.Most companies will receive a Standard rating, and this isthe default rating in the absence of evidence thatmanagers have made exceptionally strong or poor capitalallocation decisions.
© 2012 Morningstar. All Rights Reserved. Unless otherwise provided in a separate agreement, you may use this report only in the country in which its original distributor is based. Data as originally reported.The information contained herein is not represented or warranted to be accurate, correct, complete, or timely. This report is for information purposes only, and should not be considered a solicitation to buy or sell any security.Redistribution is prohibited without written permission. To order reprints, call +1 312-696-6100. To license the research, call +1 312-696-6869.
ß ®

13
WellPoint Inc WLP [NYSE] | QQQQQTM
Last Price Fair Value Consider Buy Consider Sell Uncertainty Economic Moat Stewardship Morningstar Credit Rating Industry66.60 USD 105.00 USD 73.50 USD 141.75 USD Medium Narrow . Health Care Plans A-
Close Competitors Currency(Mil) Market Cap TTM Sales Oper Income Net Income
WellPoint Inc
UnitedHealth Group Inc
Aetna Inc
Humana
USD
USD
USD
USD
22,033 61,232 3,841 2,577
57,319 103,712 8,560 5,184
14,931 34,308 2,968 1,911
13,253 37,860 2,128 1,352
Morningstar data as of May 07, 2012. On the other hand, regulators are becoming increasinglyactive in reviewing and preventing premium hikes that aredeemed excessive. While it is generally understood thatunderlying medical costs are the real driver of premiumgrowth, health insurance premiums are a far easier targetfor crusading regulators. If raising premiums becomes toodifficult, MCOs will�need to�find a way to hold downreimbursements to health-care providers, or else suffermargin contraction. On the plus side, WellPoint’s regionalscale still leaves it relatively well positioned to passpricing pressure through to providers.� We are also growing increasingly concerned aboutanother long-term risk: The emergence of health-insuranceexchanges may decentralize health insurance purchasingdecisions. In particular, there are early signs that healthinsurance benefits may be moving from a "defined benefit"model to a "defined contribution" model, similar to theshift that has occurred in retirement benefits. Employersvalue broad provider access at reasonable cost, whichWellPoint is ideally positioned to deliver. If individualsbecome the primary purchasers of insurance, they may bewilling to forgo broad provider access in exchange forlower costs at the providers they use the most. This couldopen the door to increased competition fromlimited-network regional plans and even�verticallyintegrated health�plans offered directly by large hospitalsystems. We will be watching this risk closely in thecoming years. Valuation, Growth and Profitability
We’re raising our fair value estimate for WellPoint to $105from $100 to account for cash earned since our lastupdate.�In our base case, we�project 4.9% compoundannual operating revenue growth during the next fiveyears. We expect the medical cost ratio to deterioratefrom 85.1% in 2011 to 86.5% over the long run. Weexpect selling, general, and administrative costs to declinefrom 14.1% of operating revenue in 2011 to 13.2% by2016. Overall, we expect operating income excludinginterest income to increase around 2% per year during thenext five years. Including share repurchases, we expectadjusted earnings per share to grow at a more robust10.6% per year. Using more optimistic assumptions, wethink operating income could grow 10.7% annually duringthe next five years, in which case our fair value estimatewould be $145 per share. Using more pessimisticassumptions, we think operating income could shrink9.3% annually during the next five years, resulting in a fairvalue estimate of $67 per share. We estimate WellPoint’scost of equity at 10.5%. Risk Regulatory changes could have sudden and unpredictableeffects� on WellPoint’s business. WellPoint’s results couldbe hurt by� regulation that limits the premiums the firm cancharge or mandates� the benefits it must provide, bydecreased funding of the Medicare� or Medicaid programs,or by new government programs that compete� with itsexisting business lines. Managed care is a highly�competitive industry, and battles over market share couldlead to� deteriorating underwriting standards that cut intoWellPoint’s� margins. Bulls Say
WellPoint has one of the largest medical membershipsamong health insurers, giving it significant bargainingpower with health-care providers and leveraging its
© 2012 Morningstar. All Rights Reserved. Unless otherwise provided in a separate agreement, you may use this report only in the country in which its original distributor is based. Data as originally reported.The information contained herein is not represented or warranted to be accurate, correct, complete, or timely. This report is for information purposes only, and should not be considered a solicitation to buy or sell any security.Redistribution is prohibited without written permission. To order reprints, call +1 312-696-6100. To license the research, call +1 312-696-6869.
ß ®

14
WellPoint Inc WLP [NYSE] | QQQQQTM
Last Price Fair Value Consider Buy Consider Sell Uncertainty Economic Moat Stewardship Morningstar Credit Rating Industry66.60 USD 105.00 USD 73.50 USD 141.75 USD Medium Narrow . Health Care Plans A-
largely fixed cost structure. We think the market has overreacted to the threatposed by reform legislation. Some aspects of thelegislation are positive for WellPoint, such as the newfederal insurance subsidies and expansions to theMedicaid program. WellPoint also benefits from itsminimal exposure to Medicare Advantage. As the exclusive licensee of the Blue Cross and/or BlueShield brands in 14 states, WellPoint enjoys thebest-known and most-trusted brand name in thebusiness. This could be a particularly valuablecompetitive advantage in the health-insuranceexchanges. Unlike its peers in other states, WellPoint generallydoesn’t have to compete with nonprofit Blue Cross andBlue Shield plans, which can be a source of irrationalpricing and cyclicality. Because it is less geographically diverse than somepeers, WellPoint may face fewer local regulatoryhurdles as future opportunities for industryconsolidation arise. High regional market share alsoenhances bargaining power with providers.
Bears Say
The PPACA’s commercial medical cost ratio floorsdepressed margins in 2011. There is a risk that thefloors could be raised in the future, creating an ongoingmargin headwind. It is essential for WellPoint to stay ahead of shiftingmedical cost trends. Given WellPoint’s slim margins, asudden acceleration of cost trends can have a drasticeffect on earnings, as occurred in 2008. The PPACA included provisions that will enhanceregulatory oversight of premium increases. WellPointmay find it harder in the future to pass cost increasesthrough to customers. Rising unemployment results in a smaller market foremployer-based insurance, and fewer members can
result in deleveraging of WellPoint’s fixed costs.WellPoint faces an additional revenue headwind asemployers increasingly migrate to fee-based productsrather than risk-based products. As a Blue Cross and Blue Shield licensee, WellPoint hasto keep an unusually large amount of capital in reserve.The company’s $20 billion investment portfolio couldlose value if financial markets decline.
Financial Overview Financial Health: WellPoint’s financial health is solid. Wethink the company can generate normalized free cashflows of at least $2.5 billion annually, and balance sheetleverage is appropriate with a 30% debt/capital ratio. Company Overview Profile: WellPoint is one of the largest U.S. health insurersby medical membership, serving 34 million people. It holdsthe exclusive license to the Blue Cross and/or Blue Shieldnames in 14 states, including California, Georgia, NewYork, and Ohio. WellPoint’s business mix is weightedtoward the commercial market, with a particular focus onsmall-group coverage. Approximately 40% of members arein traditional risk-based products, with the remaining 60%in fee-based products. Management: We give WellPoint a fair stewardshipgrade. We were impressed by the speed with whichmanagement recognized and reacted to acceleratingmedical cost trends in 2008. On the other hand, ahigh-profile actuarial mistake in California in 2010resulted in a long delay in implementing a rate increaseand soured relationships with regulators across thecountry. WellPoint also did not�handle the health-reformdebate as proactively and positively as some peers.�In thelast couple of years, WellPoint has been slow to reduceadministrative costs in light of declining operating
© 2012 Morningstar. All Rights Reserved. Unless otherwise provided in a separate agreement, you may use this report only in the country in which its original distributor is based. Data as originally reported.The information contained herein is not represented or warranted to be accurate, correct, complete, or timely. This report is for information purposes only, and should not be considered a solicitation to buy or sell any security.Redistribution is prohibited without written permission. To order reprints, call +1 312-696-6100. To license the research, call +1 312-696-6869.
ß ®

15
WellPoint Inc WLP [NYSE] | QQQQQTM
Last Price Fair Value Consider Buy Consider Sell Uncertainty Economic Moat Stewardship Morningstar Credit Rating Industry66.60 USD 105.00 USD 73.50 USD 141.75 USD Medium Narrow . Health Care Plans A-
revenue, though more recently management appears tohave gotten a better handle on costs. The long-overdue�ITsystems integration project could provide additionalsavings. We are encouraged by WellPoint’s dedication toreturning capital to shareholders through sharerepurchases, and we believe the repurchases madethrough the past few years’ tumultuous market createdsignificant value for long-term shareholders. WellPointhas been led by CEO Angela Braly since 2007. Braly wastrained as a lawyer and previously served as an executivevice president and general counsel. She spent two yearsas the CEO of Anthem Blue Cross and Blue Shield ofMissouri. Braly was also appointed chair of the board inearly 2010, though we would prefer that the CEO and chairpositions be separated. Braly’s 2010 total compensation of$13 million does not appear unreasonable for the industry,given WellPoint’s size.
© 2012 Morningstar. All Rights Reserved. Unless otherwise provided in a separate agreement, you may use this report only in the country in which its original distributor is based. Data as originally reported.The information contained herein is not represented or warranted to be accurate, correct, complete, or timely. This report is for information purposes only, and should not be considered a solicitation to buy or sell any security.Redistribution is prohibited without written permission. To order reprints, call +1 312-696-6100. To license the research, call +1 312-696-6869.
ß ®

16
WellPoint Inc WLP [NYSE] | QQQQQTM
Last Price Fair Value Consider Buy Consider Sell Uncertainty Economic Moat Stewardship Morningstar Credit Rating Industry66.60 USD 105.00 USD 73.50 USD 141.75 USD Medium Narrow . Health Care Plans A-
Analyst Notes
Apr. 25, 2012 WellPoint 1Q Consistent With Our Expectations, but Management Execution Remains a Weakness
Our full-year estimates for WellPoint appear within reach,following the release of first-quarter results, and we aremaintaining our $105 fair value estimate. We continue toview WellPoint as meaningfully undervalued.� �Excluding investment gains, WellPoint’s first-quarterearnings per share declined by 1 cent to $2.34. A 10.6%decline in the share count was not enough to make up for aslightly larger decline in operating income. Operatingrevenue increased 3.4%, with more than half of this growthattributable to the CareMore acquisition and the rest theresult of premium increases. � �Both the medical cost ratio (medical costs as a percentageof premium revenue) and the operating cost ratio (selling,general, and administrative expense as a percentage ofoperating revenue) deteriorated in the first quarter. Themedical cost ratio was up 120 basis points to 83.3%. Thefirst quarter is a seasonally strong quarter, and our modelincorporates an 85.3% rate for the full year with furtherdeterioration in subsequent years. The operating cost ratiowas worse than we expected, up 10 basis points to 14.3%.
We are counting on improvements in this metric to helpoffset medical cost pressures.� �We are discouraged by WellPoint’s membership results.The company shed 3% of local group and national accountmembers since the end of last year. Managementattributed this loss to disciplined pricing and competitivepressure. While trading off membership for margins isusually a good idea for managed-care organizations,WellPoint is experiencing both deteriorating membershipand margins. This is exactly the opposite of what we wouldexpect, as WellPoint’s scale should give it a cost advantagethat enables it to grow membership without sacrificingmargins. Management execution appears to be lacking,particularly relative to peer UnitedHealth.�
Mar. 20, 2012 Supreme Court to Decide on the Constitutionality of the Affordable Care Act
From March 26-28, the U.S. Supreme Court will hear oralarguments on the constitutionality of the Patient Protectionand Affordable Care Act, or PPACA. The most importantprovisions of the health reform law will be implemented in2014, fundamentally transforming the country’s healthinsurance marketplace. Overturning the law throughlegislative means would be almost impossible in the nearterm, as that would likely require a filibuster-proof, 60-voteRepublican majority in the Senate (compared with 47Republican seats currently) and Republican control of thepresidency. The Supreme Court is therefore the last majorhurdle the legislation must pass before it becomesinextricably ingrained in our health-care system. A decision
is expected sometime in the summer.� �The court must decide four key questions. Mostimportantly, does Congress have the constitutionalauthority to require individuals to purchase healthinsurance, or else pay a penalty? This is by far the mostcontroversial provision in the law, as it marks the first timeCongress would compel individuals to purchase acommercial product. Opponents of the individual mandateargue that it amounts to regulating "inactivity" and fallsoutside of Congress’ powers under the Constitution’scommerce clause. Supporters of the provision argue thatnot carrying health insurance is a form of activity because
© 2012 Morningstar. All Rights Reserved. Unless otherwise provided in a separate agreement, you may use this report only in the country in which its original distributor is based. Data as originally reported.The information contained herein is not represented or warranted to be accurate, correct, complete, or timely. This report is for information purposes only, and should not be considered a solicitation to buy or sell any security.Redistribution is prohibited without written permission. To order reprints, call +1 312-696-6100. To license the research, call +1 312-696-6869.
ß ®

17
WellPoint Inc WLP [NYSE] | QQQQQTM
Last Price Fair Value Consider Buy Consider Sell Uncertainty Economic Moat Stewardship Morningstar Credit Rating Industry66.60 USD 105.00 USD 73.50 USD 141.75 USD Medium Narrow . Health Care Plans A-
Analyst Notes (continued)
almost everyone will require health care at some point intheir lives, and without insurance the costs of that care willlikely fall to others.� �The individual mandate is viewed as a central componentof the PPACA, even though penalties for not carryinginsurance are modest (compared with the cost of healthbenefits) and the provision lacks enforcement. In 2014, thepenalty for not carrying insurance is the greater of $95 perindividual or 1% of taxable income. The penalty ramps upto $695 per individual or 2.5% of taxable income by 2016.There are various exemptions and caps to these standards.The penalty will be assessed through income tax returns,but failure to pay does not result in any criminal penalties.The primary enforcement mechanism will be withholdingtax refunds.� �If the individual mandate is ruled unconstitutional, the courtmust then decide what parts of the law, if any, can standwithout the individual mandate. In our view, insurancemarket regulations such as guaranteed issue (forcinginsurers to offer policies to all applicants) and modifiedcommunity rating (only allowing premiums to vary withintight bands based on characteristics such as age and familysize, while forbidding medical underwriting) would almostcertainly have to be eliminated from the law in this case.Otherwise, people would wait until they became ill topurchase insurance, destroying the market for individualinsurance nationwide. It is less clear whether other majorprovisions of the law, including the Medicaid expansionand insurance subsidies, could be allowed to stand withoutthe individual mandate.� �The other two questions are a bit of a sideshow to the mainact of the individual mandate. The court could conclude thatit cannot rule on the individual mandate yet because taxesto enforce it have yet to be collected. This would be adisappointing outcome, as it would prolong the currentstate of uncertainty for years and create a tremendous
mess if the law were later struck down after being fullyimplemented. The last question is whether the PPACA’sMedicaid expansion is overly coercive to the states. Wefind this to be the least compelling argument, as the federalgovernment will assume responsibility for the vast majorityof the incremental cost and states have the ability to optout of the Medicaid program altogether.� �We did not make any changes to our fair value estimatesfor managed-care organizations when the PPACA passedinitially. Modest negatives in the legislation such as limitson underwriting margins, increased regulatory scrutiny ofpremium rates, and Medicare Advantage reimbursementcuts were partly offset by positives like subsidies forindividual insurance and expansions to the Medicaidprogram. Managed-care organizations have also benefitedfrom mild utilization growth and disciplined pricing, whichhas offset any reform-related concerns. As a result, our fairvalue estimates for managed-care organizations havegenerally increased--in some cases significantly--in the twoyears since reform’s passage.� � Regardless of the Supreme Court’s decision, it is unlikelythat we would make any material changes to our fair valueestimates now. However, we think the most favorableoutcome for managed-care organizations at this pointwould be for the law to be upheld. Some aspects of reformare likely to persist even if the PPACA were struck down.For example, state-run insurance exchanges have gainedacceptance as a better way to organize the individual andsmall-group health insurance markets, and would likely bepursued by many states even in the absence of incentivesfrom the federal government. Enhanced state scrutiny ofpremium increases is also probably here to stay.Accountable care organizations have established a footholdas the care delivery systems of the future, and providerconsolidation is likely an irreversible trend. These aspectsof the health reform law are relatively negative for MCOs.� �
© 2012 Morningstar. All Rights Reserved. Unless otherwise provided in a separate agreement, you may use this report only in the country in which its original distributor is based. Data as originally reported.The information contained herein is not represented or warranted to be accurate, correct, complete, or timely. This report is for information purposes only, and should not be considered a solicitation to buy or sell any security.Redistribution is prohibited without written permission. To order reprints, call +1 312-696-6100. To license the research, call +1 312-696-6869.
ß ®

18
WellPoint Inc WLP [NYSE] | QQQQQTM
Last Price Fair Value Consider Buy Consider Sell Uncertainty Economic Moat Stewardship Morningstar Credit Rating Industry66.60 USD 105.00 USD 73.50 USD 141.75 USD Medium Narrow . Health Care Plans A-
Analyst Notes (continued)
On the other hand, if the entire reform law were thrownout, provisions such as the expansion to Medicaid andindividual insurance subsidies are unlikely to be resurrectedin the current political climate, where concern about budgetdeficits has taken precedence over health-care access.These provisions were mostly good for MCOs and provided
an offset to some of the negative aspects described above.With the wheels of reform now set in motion, we thinkMCOs will be better off going forward if the entire law isupheld.�
Jan. 25, 2012 WellPoint 2012 Outlook Ahead of our Expectations, Shares Remain Undervalued
Investors were clearly disappointed by higher medical costsin WellPoint’s fourth quarter and a 2012 outlook that wasbelow Wall Street consensus. Shares plunged 6 percentearly Wednesday, further testing investors’ patience asWellPoint’s stock has consistently underperformed peersdespite being our top industry pick. However, both 2011results and the 2012 outlook were better than theestimates incorporated in our model, as we anticipatedsteadily deteriorating medical cost ratios. We aremaintaining our $100 fair value estimate and continue toview WellPoint as significantly undervalued.� �WellPoint’s 2011 earnings per share of $7.25 comparedwith $7.14 in our model. The 2012 outlook for "at least"$7.60 in earnings compares with our own estimate of$7.46. We were below consensus estimates on bothcounts, which explains why WellPoint can exceed ourexpectations while disappointing the market. Excludinginvestment gains and other unusual items, earningsincreased nearly 4% in 2011 and are projected to grow atleast 8.5% in 2012. We consider this a respectabletrajectory in light of regulatory headwinds.� �Thanks to heightened regulatory scrutiny of premium rates,we expect medical cost pressure to be a recurring themeduring the next five years. WellPoint’s fourth-quartermedical cost ratio (medical costs as a percentage ofpremium revenue) deteriorated 310 basis points to 87.6%.
Once again, management blamed much of the deteriorationon adverse selection in the Medicare Advantage business,particularly in California. The company hopes to correct thiswith plan design changes in 2012. However, this highlightsthe perils of WellPoint’s focus on Medicare expansion, asthis business is arguably outside of the company’s circle ofcompetence.� �For the full year, WellPoint’s consolidated medical costratio deteriorated 190 basis points to 85.1%. This was onlypartly offset by a 100 basis point improvement inadministrative costs as a percentage of operating revenue,as WellPoint’s aggressive cost control efforts resulted in a4.3% decline in administrative expenses. Full-year netincome was down more than 8%, but this was more thanoffset by a lower share count.� �Cash flow remains WellPoint’s greatest strength, with 2011free cash flow around $2.9 billion. With few internal cashneeds, most of this cash flow is available to be returned toshareholders. WellPoint repurchased 11.8% of itsoutstanding shares during 2011 for $3 billion. Sharerepurchases are likely to remain a priority for capitaldeployment as long as WellPoint’s stock remains soundervalued. The board also authorized a 15% increase tothe company’s dividend. However, with a payout ratio ofjust 15%, we continue to see room for significant dividendgrowth.�
© 2012 Morningstar. All Rights Reserved. Unless otherwise provided in a separate agreement, you may use this report only in the country in which its original distributor is based. Data as originally reported.The information contained herein is not represented or warranted to be accurate, correct, complete, or timely. This report is for information purposes only, and should not be considered a solicitation to buy or sell any security.Redistribution is prohibited without written permission. To order reprints, call +1 312-696-6100. To license the research, call +1 312-696-6869.
ß ®
Disclaimers & DisclosuresNo Morningstar employees are officers or directors of this company. Morningstar Inc. does not own more than 1% of the shares of this company. Analystscovering this company do not own its stock. The information contained herein is not represented or warranted to be accurate, correct, complete, or timely.This report is for information purposes only, and should not be considered a solicitation to buy or sell any security.

19
Morningstar Stock Data Sheet Pricing data thru May 07, 2012 Rating updated as of May 07, 2012Pricing data thru May 07, 2012 Rating updated as of May 07, 2012 Fiscal year-end: December
WellPoint Inc WLP Sales USD Mil Mkt Cap USD Mil Industry Sector61,232 22,033 Health
Care Plans Healthcare
TMMorningstar Rating Last Price Fair Value Uncertainty Economic Moat Stewardship GradeQQQQQ 66.60 105.00 Medium Narrow .
per share prices in USD
2002 2003 2004 2005 2006 2007 2008 2009 2010 2011 YTD
3.0
7.0
19.0
39.0
79.0
3.0 6.0
37.7523.20
41.4526.50
58.8836.10
80.4055.50
80.3765.50
89.9572.90
90.0027.50
60.8929.32
70.0046.52
81.9256.61
74.7363.34
Annual Price HighLowRecent Splits
Price VolatilityMonthly High/LowRel Strength to S&P 500
52 week High/Low81.92 - 56.61
10 Year High/Low90.00 - 23.20
Bear-Market Rank5 (10=worst)
Trading Volume Million
Stock Performance
2:1 2:1
WellPoint is one of the largest U.S. health insurers bymedical membership, serving 34 million people. It holds theexclusive license to the Blue Cross and/or Blue Shield namesin 14 states, including California, Georgia, New York, andOhio. WellPoint’s business mix is weighted toward thecommercial market, with a particular focus on small-groupcoverage. Approximately 40% of members are in traditionalrisk-based products, with the remaining 60% in fee-basedproducts.
120 Monument Circle Indianapolis, IN 46204Phone: 1 317 488-6000Website: http://www.wellpoint.com
Growth Rates Compound AnnualGrade: B 1 Yr 3 Yr 5 Yr 10 Yr
Revenue % 3.3 -0.3 1.3 19.2Operating Income % -9.1 8.2 -5.7 21.1Earnings/Share % 4.5 15.1 8.5 15.9Dividends % . . . .
Book Value/Share % 8.8 17.7 11.6 21.3Stock Total Return % -13.2 12.7 -3.7 7.3+/- Industry -15.8 -9.0 -6.0 -4.0+/- Market -14.8 -2.0 -1.8 4.7
Profitability AnalysisGrade: C Current 5 Yr Avg Ind Mkt
Return on Equity % 10.9 13.8 16.4 22.2Return on Assets % 5.0 6.3 5.8 9.3Fixed Asset Turns 46.4 56.2 46.5 7.5Inventory Turns . . 129.5 16.8Revenue/Employee USD K1624.2 1594.7 . 1035.3
Gross Margin % . . 13.6 40.1Operating Margin % 6.3 8.0 7.0 18.9Net Margin % 4.2 5.2 4.3 11.3Free Cash Flow/Rev % . . 4.7 0.1R&D/Rev % . . . 9.4
*
*3Yr Avg data is displayed in place of 5Yr Avg
Financial PositionGrade: B 12-11 USD Mil 03-12 USD Mil
Cash 2202 2279Inventories . .Receivables 4453 4665
Current Assets . .
Fixed Assets 1418 1455Intangibles 21790 21737
Total Assets 52019 52497
Payables 924 3938Short-Term Debt 1375 1011
Current Liabilities . .Long-Term Debt 8421 8463
Total Liabilities 28731 28968
Total Equity 23288 23528
2002 2003 2004 2005 2006 2007 2008 2009 2010 2011 TTM FinancialsRevenue USD Mil13282 16771 20815 45136 56953 61134 61251 65028 58802 60711 61232Gross Margin %. . . . . . . . . . .Oper Income USD Mil906 1350 1586 4117 5318 5706 3122 7403 4354 3958 3841Operating Margin %6.8 8.1 7.6 9.1 9.3 9.3 5.1 11.4 7.4 6.5 6.3
Net Income USD Mil549 774 960 2464 3095 3345 2491 4746 2887 2647 2577
Earnings Per Share USD2.26 2.73 3.05 3.94 4.82 5.56 4.76 9.88 6.94 7.25 7.26Dividends USD. . . . . . . . . 1.00 1.04Shares Mil244 284 315 625 642 602 523 480 416 365 355Book Value Per Share USD18.96 21.69 70.10 40.56 39.64 42.42 42.10 55.28 63.04 66.95 71.12
Oper Cash Flow USD Mil991 1143 1303 3257 4044 4345 2535 3039 1417 3374 3483Cap Spending USD Mil-123 -111 -137 -162 -194 -322 -346 -378 -451 -520 -541Free Cash Flow USD Mil. . . . . . . . . . .
Valuation AnalysisCurrent 5 Yr Avg Ind Mkt
Price/Earnings 9.2 9.6 11.3 15.1Forward P/E 7.8 . . 13.8Price/Cash Flow 6.8 10.8 6.7 7.9Price/Free Cash Flow . . 8.6 17.7Dividend Yield % 1.6 . 0.8 2.0Price/Book 0.9 1.2 1.8 2.2Price/Sales 0.4 0.5 0.5 1.3PEG Ratio 0.7 . . 1.8
Total Return %27.1 19.2 55.3 37.5 -1.7 11.5 -52.0 38.4 -2.5 18.3 1.0+/- Market50.5 -7.2 46.3 34.5 -15.3 8.0 -13.5 15.0 -15.3 18.3 -7.9+/- Industry26.0 -29.0 9.1 -6.5 3.7 -11.6 -3.9 2.8 -12.4 -1.3 -7.3
Dividend Yield %. . . . . . . . . 1.5 1.6Market Cap USD Mil8897 10371 16162 49327 48789 47544 21446 26218 21478 23046 22033
2002 2003 2004 2005 2006 2007 2008 2009 2010 2011 TTM ProfitabilityReturn on Assets %5.9 6.0 3.6 5.4 6.0 6.4 5.0 9.4 5.6 5.2 5.0Return on Equity %14.8 13.6 7.5 11.1 12.5 14.1 11.2 20.5 11.9 11.2 10.9
Net Margin %4.1 4.6 4.6 5.5 5.4 5.5 4.1 7.3 4.9 4.4 4.2Asset Turnover1.43 1.30 0.78 0.99 1.10 1.18 1.22 1.29 1.15 1.19 1.18Financial Leverage2.3 2.2 2.0 2.1 2.1 2.3 2.3 2.1 2.1 2.2 2.2
2002 2003 2004 2005 2006 2007 2008 2009 2010 2011 03-12 Financial HealthWorking Capital USD Mil3428 4094 7787 11088 -3517 -1356 . . . . .Long-Term Debt USD Mil1659 1663 4277 6325 6493 9024 7834 8338 8148 8421 8463Total Equity USD Mil5362 6000 19459 24993 24576 22990 21432 24863 23813 23288 23528Debt/Equity0.31 0.28 0.22 0.25 0.26 0.39 0.37 0.34 0.34 0.36 0.36
2002 2003 2004 2005 2006 2007 2008 2009 2010 2011 TTM ValuationPrice/Earnings13.9 13.8 19.1 20.3 16.3 15.8 8.8 5.9 8.2 9.1 9.2P/E vs. Market. . . . . . . . . 0.5 0.6Price/Sales0.6 0.6 0.9 1.0 0.9 0.9 0.4 0.4 0.4 0.4 0.4Price/Book1.7 1.7 0.8 2.0 2.0 2.1 1.0 1.1 0.9 1.0 0.9Price/Cash Flow7.7 9.3 14.1 14.0 12.5 12.2 8.7 9.2 16.7 7.4 6.8
Quarterly ResultsRevenue
Rev Growth
Earnings Per Share
USD Mil Jun 11 Sep 11 Dec 11 Mar 12
% Jun 11 Sep 11 Dec 11 Mar 12
USD Jun 11 Sep 11 Dec 11 Mar 12
Most Recent Period 15100.7 15398.0 15317.7 15415.2Prior Year Period 14457.2 14598.2 14647.9 14894.3
Most Recent Period 4.5 5.5 4.6 3.5Prior Year Period -6.2 -5.4 -23.1 -1.4
Most Recent Period 1.89 1.90 0.96 2.53Prior Year Period 1.71 1.84 1.40 2.44
Industry Peers by Market Cap
Major Fund Holders
Mkt Cap USD Mil Rev USD Mil P/E ROE%
% of shares
WellPoint Inc 22033 61232 9.2 10.9UnitedHealth Group I 57319 103712 11.5 18.7Aetna Inc 14931 34308 8.4 18.6
.
.
.
TTM data based on rolling quarterly data if available; otherwise most recent annual data shown.
© 2012 Morningstar. All Rights Reserved. Unless otherwise provided in a separate agreement, you may use this report only in the country in which its original distributor is based. Data as originally reported. The information contained herein is not represented or warranted to be accurate, correct, complete, or timely. This report is for information purposes only, and should not be considered a solicitation to buy or sell any security. Redistribution is prohibited without written permission. To order reprints, call +1 312-696-6100. To license the research, call +1 312-696-6869. ß
®

20
Morningstar’s Approach to Rating Stocks
Our Key Investing ConceptsEconomic Moat Rating��Discounted Cash Flow��Discount Rate��Fair Value��Uncertainty��Margin of Safety��Consider Buying/Consider Selling��Stewardship Grades��
TMAt Morningstar, we evaluate stocks as pieces of abusiness, not as pieces of paper. We think that purchasingshares of superior businesses at discounts to theirintrinsic value and allowing them to compound their valueover long periods of time is the surest way to createwealth in the stock market. We rate stocks 1 through 5 stars, with 5 the best and 1the worst. Our star rating is based on our analyst’sestimate of how much a company’s business is worth pershare. Our analysts arrive at this "fair value estimate" byforecasting how much excess cash--or "free cashflow"--the firm will generate in the future, and thenadjusting the total for timing and risk. Cash generatednext year is worth more than cash generated several yearsdown the road, and cash from a stable and consistentlyprofitable business is worth more than cash from acyclical or unsteady business. Stocks trading at meaningful discounts to our fair valueestimates will receive high star ratings. For high-qualitybusinesses, we require a smaller discount than formediocre ones, for a simple reason: We have moreconfidence in our cash-flow forecasts for strongcompanies, and thus in our value estimates. If a stock’smarket price is significantly above our fair value estimate,it will receive a low star rating, no matter how wonderfulwe think the business is. Even the best company is a baddeal if an investor overpays for its shares. Our fair value estimates don’t change very often, butmarket prices do. So, a stock may gain or lose stars based
just on movement in the share price. If we think a stock’sfair value is $50, and the shares decline to $40 withoutmuch change in the value of the business, the star ratingwill go up. Our estimate of what the business is worthhasn’t changed, but the shares are more attractive as aninvestment at $40 than they were at $50. Because we focus on the long-term value of businesses,rather than short-term movements in stock prices, at timeswe may appear out of step with the overall stock market.When stocks are high, relatively few will receive ourhighest rating of 5 stars. But when the market tumbles,many more will likely garner 5 stars. Although you mightexpect to see more 5-star stocks as the market rises, wefind assets more attractive when they’re cheap. We calculate our star ratings nightly after the marketsclose, and issue them the following business day, which iswhy the rating date on our reports will always be theprevious business day. We update the text of our reportsas new information becomes available, usually about onceor twice per quarter. That is why you’ll see two dates onevery Morningstar stock report. Of course, we monitormarket events and all of our stocks every business day, soour ratings always reflect our analyst’s current opinion. Economic Moat Rating The Economic Moat Rating is our assessment of a firm’sability to earn returns consistently above its cost of capitalin the future, usually by virtue of some competitiveadvantage. Competition tends to drive down such
TM
TM
Morningstar ResearchMethodology for ValuingCompanies QQQQQCompetitive Economic Company Fair Value Uncertainty
Analysis Moat Rating Valuation Estimate AssessmentTM
Analyst conducts The depth of the Analyst considers DCF model leads to An uncertaintycompany and industry firm’s competitive company financial the firm’s Fair Value assessmentresearch: advantage is rated: statements and Estimate, which establishes the� � competitive position anchors the rating margin ofManagement None to forecast future framework. safety required forinterviews Narrow cash flows. the stock rating.Conference calls Wide �Trade-show visits Assumptions areCompetitor, supplier, input into a dis-distributor, and counted cash-flowcustomer interviews model.
The current stockprice relative to fairvalue, adjustedfor uncertainty,determines therating.
QQQQQQQQQQQQQQQ
© 2012 Morningstar. All Rights Reserved. Unless otherwise provided in a separate agreement, you may use this report only in the country in which its original distributor is based. Data as originally reported.The information contained herein is not represented or warranted to be accurate, correct, complete, or timely. This report is for information purposes only, and should not be considered a solicitation to buy or sell any security.Redistribution is prohibited without written permission. To order reprints, call +1 312-696-6100. To license the research, call +1 312-696-6869.
ß ®

21
?
Express Scripts ESRX [Nasdaq] | QQQQTM
Last Price Fair Value Consider Buy Consider Sell Uncertainty Economic Moat Stewardship Morningstar Credit Rating Industry54.55 USD 73.00 USD 51.10 USD 98.55 USD Medium Wide . Health Care Plans A-
Currency amounts expressed with "$"are in U.S. dollars (USD) unlessotherwise denoted.
SXC and Catalyst to Merge, Further Concentrating PBMIndustry
by Matthew Coffina, CFASenior Stock AnalystAnalysts covering this company do notown its stock.
Pricing data through May 07, 2012.Rating updated as ofMay 07, 2012.
08 09 10 11 12
23.0
33.0
43.0
53.0
Stock Price
Analyst Note Apr. 18, 2012 SXC Health Solutions and Catalyst Health Solutionsannounced Wednesday their intention to merge. Catalystshareholders will receive $28 in cash and 0.6606 share ofSXC for every Catalyst share owned, amounting to a 28%premium to Catalyst’s stock price before the deal wasannounced. We don’t currently cover either SXC orCatalyst, but this transaction supports our thesis ofcontinuing consolidation in the pharmacy benefitmanagement sector. We had previously speculated thatthe Medco-Express Scripts merger could open thefloodgates to further health plan consolidation, and thisdeal could be a harbinger of more acquisition activityamong both pharmacy benefit managers andmanaged-care organizations. Thesis Apr. 03, 2012 We expect pharmacy benefit managers like ExpressScripts to enjoy a bevy of positive trends in the nextseveral years.�Industry�consolidation, the�agingpopulation, a slew of patent expirations for brand-namedrugs, health-care cost-containment efforts,�growth in thenumber of people with insurance as a result of healthreform, and increasing customer acceptance of mail-orderpharmacies all bode well for Express Scripts. With themerger with Medco now complete, we believe ExpressScripts has a wide economic moat.� PBMs administer drug benefits on behalf of clients suchas employers and managed-care organizations, with theprincipal goal of controlling costs. Express Scripts�has twoprimary strategies for achieving this.�First, the companyleverages its purchasing power to extract better pricesfrom suppliers. Second, it encourages its members�tomake cost-effective pharmaceutical consumption choices,such as switching to generic drugs and preferred brands,improving therapy adherence,�or using the company’smail-order pharmacy.�
Express Scripts earns mid-single-digit margins. At thesame time, pharmaceutical spending accounts for onlyaround 10% of overall health-care spending. This meansthat Express Scripts’�operating income�accounts for wellless than 1% of its clients’ overall health-care costs. IfExpress Scripts can lower its clients’ health-care costs byeven a percentage point more than the competition,�it�willjustify�its margins and�facilitate market share gains.� We believe �scale provides Express Scripts withsignificant competitive advantages. For example, scaleallows Express Scripts to extract better rebates frombrand-name drugmakers, better prices from genericdrugmakers, and favorable reimbursement rates withretail pharmacies. Scale also allows Express Scripts toleverage fixed costs like claims processing infrastructureand mail-order facilities.�Furthermore, we think thesecompetitive advantages are getting stronger over time asthe PBM industry consolidates. Even though ExpressScripts earns a return on equity north of 40% and hasexperienced 23% compound annual operating incomegrowth during the past five years, smaller competitors likeWellPoint�and Aetna�have been looking to exit thisbusiness in favor of partnering with the independentPBMs. In our view, the merger with Medco greatlyenhances Express Scripts’ scale advantages.� Express Scripts has a�history of successfully integratingacquisitions, and we see no reason Medco will be anydifferent, particularly since we already consider thecompany to be very well run. Express Scripts now hasmore than�100 million members and controls around 35%of U.S. pharmaceutical spending. It dwarfs second-placeCVS Caremark, which is likely�to find it nearly impossibleto catch up, given the lack of other possible acquisitiontargets of size. Other suppliers and competitors--such asretail pharmacies, distributors, and smaller PBMs--riskseeing their own margins compress, to Express Scripts’benefit. Valuation, Growth and Profitability We estimate Express Scripts’ fair value at $73 per share.

22
Morningstar Stock Data Sheet Pricing data thru May 07, 2012 Rating updated as of May 07, 2012Pricing data thru May 07, 2012 Rating updated as of May 07, 2012 Fiscal year-end: December
Express Scripts ESRX Sales USD Mil Mkt Cap USD Mil Industry Sector46,128 26,470 Health
Care Plans Healthcare
TMMorningstar Rating Last Price Fair Value Uncertainty Economic Moat Stewardship GradeQQQQ 54.55 73.00 Medium Wide .
per share prices in USD
2002 2003 2004 2005 2006 2007 2008 2009 2010 2011 YTD
1.0
4.0
9.0
19.0
39.0
6.0
14.0
8.244.83
9.435.79
10.157.29
22.709.15
23.7514.70
37.2016.16
39.5524.18
44.9421.38
55.6837.75
60.8934.47
58.9844.69
Annual Price HighLowRecent Splits
Price VolatilityMonthly High/LowRel Strength to S&P 500
52 week High/Low60.89 - 34.47
10 Year High/Low60.89 - 4.83
Bear-Market Rank6 (10=worst)
Trading Volume Million
Stock Performance
2:1 2:1 2:1
Express Scripts is the largest pharmacy benefit manager inthe United States. Through its mail-order pharmacy andnetwork of retail pharmacies, we expect Express Scripts toadminister around 1.5 billion adjusted prescriptions in 2013. �
One Express Way Saint Louis, MO 63121Phone: 1 314 996-0900Website: http://www.express-scripts.com
Growth Rates Compound AnnualGrade: A 1 Yr 3 Yr 5 Yr 10 Yr
Revenue % 2.6 28.0 21.2 17.3Operating Income % 11.6 21.8 22.9 25.6Earnings/Share % 14.5 17.7 24.8 29.2Dividends % . . . .
Book Value/Share % -25.3 32.8 19.7 14.5Stock Total Return % -5.8 20.8 17.5 21.6+/- Industry -8.4 -0.9 15.2 10.3+/- Market -7.4 6.1 19.4 19.0
Profitability AnalysisGrade: D Current 5 Yr Avg Ind Mkt
Return on Equity % 42.0 52.1 16.4 22.2Return on Assets % 9.8 11.0 5.8 9.3Fixed Asset Turns 116.9 102.9 46.5 7.5Inventory Turns 113.4 104.1 129.5 16.8Revenue/Employee USD K3515.9 2888.3 . 1035.3
Gross Margin % 7.0 8.5 13.6 40.1Operating Margin % 5.0 5.5 7.0 18.9Net Margin % 2.8 3.1 4.3 11.3Free Cash Flow/Rev % 4.4 4.8 4.7 0.1R&D/Rev % . . . 9.4
*
*3Yr Avg data is displayed in place of 5Yr Avg
Financial PositionGrade: B 12-10 USD Mil 12-11 USD Mil
Cash 524 5620Inventories 382 374Receivables 1721 1916
Current Assets 2941 8058
Fixed Assets 373 416Intangibles 7211 7107
Total Assets 10558 15607
Payables 3323 3802Short-Term Debt 0 1000
Current Liabilities 3917 5458Long-Term Debt 2494 7076
Total Liabilities 6951 13133
Total Equity 3607 2474
2002 2003 2004 2005 2006 2007 2008 2009 2010 2011 TTM FinancialsRevenue USD Mil12261 13295 15115 16266 17660 18274 21978 24749 44973 46128 46128Gross Margin %6.7 6.5 6.2 7.4 8.5 9.7 9.3 9.8 6.6 7.0 7.0Oper Income USD Mil372 449 493 643 824 1061 1281 1498 2071 2312 2312Operating Margin %3.0 3.4 3.3 4.0 4.7 5.8 5.8 6.1 4.6 5.0 5.0
Net Income USD Mil203 250 278 400 474 568 776 828 1181 1276 1276
Earnings Per Share USD0.32 0.40 0.45 0.67 0.84 1.08 1.54 1.56 2.17 2.53 2.53Dividends USD. . . . . . . . . . .Shares Mil637 631 620 596 568 528 504 532 544 505 505Book Value Per Share USD1.61 1.90 1.97 2.51 2.08 1.38 2.18 6.46 6.83 5.08 5.10
Oper Cash Flow USD Mil426 458 496 793 659 827 1103 1772 2117 2192 2192Cap Spending USD Mil-61 -53 -52 -60 -67 -75 -86 -149 -120 -144 -144Free Cash Flow USD Mil365 405 445 733 592 752 1017 1622 1998 2048 2048
Valuation AnalysisCurrent 5 Yr Avg Ind Mkt
Price/Earnings 21.6 24.0 11.3 15.1Forward P/E 12.4 . . 13.8Price/Cash Flow 12.6 14.7 6.7 7.9Price/Free Cash Flow 13.5 15.9 8.6 17.7Dividend Yield % . . 0.8 2.0Price/Book 10.7 12.5 1.8 2.2Price/Sales 0.6 0.8 0.5 1.3PEG Ratio 0.7 . . 1.8
Total Return %2.7 38.3 15.1 119.3 -14.6 103.9 -24.7 57.2 25.1 -17.3 22.1+/- Market26.1 11.9 6.1 116.3 -28.2 100.4 13.8 33.8 12.3 -17.3 13.2+/- Industry1.6 -9.9 -31.1 75.3 -9.2 80.8 23.4 21.6 15.2 -36.9 13.8
Dividend Yield %. . . . . . . . . . 0.0Market Cap USD Mil3743 5218 5808 12204 9697 18455 13605 23766 28542 21742 26470
2002 2003 2004 2005 2006 2007 2008 2009 2010 2011 TTM ProfitabilityReturn on Assets %7.1 7.5 7.9 8.8 8.9 11.0 14.4 9.5 10.5 9.8 9.8Return on Equity %22.1 22.7 23.3 30.1 36.6 62.4 87.5 35.8 33.0 42.0 42.0
Net Margin %1.7 1.9 1.8 2.5 2.7 3.1 3.5 3.3 2.6 2.8 2.8Asset Turnover4.30 4.02 4.31 3.58 3.33 3.53 4.08 2.84 4.00 3.53 3.53Financial Leverage3.2 2.9 3.0 3.8 4.5 7.5 5.1 3.4 2.9 6.3 6.3
2002 2003 2004 2005 2006 2007 2008 2009 2010 2011 12-11 Financial HealthWorking Capital USD Mil-150 -66 -370 -137 -657 -507 -678 -1313 -976 2600 2600Long-Term Debt USD Mil563 455 412 1401 1270 1760 1340 2493 2494 7076 7076Total Equity USD Mil1003 1194 1196 1465 1125 696 1078 3552 3607 2474 2474Debt/Equity0.56 0.38 0.34 0.96 1.13 2.53 1.24 0.70 0.69 2.86 1.38
2002 2003 2004 2005 2006 2007 2008 2009 2010 2011 TTM ValuationPrice/Earnings18.8 21.0 21.3 31.3 21.5 32.1 17.7 27.8 24.4 17.7 21.6P/E vs. Market. . . . . . . . . 1.0 1.4Price/Sales0.3 0.4 0.4 0.8 0.6 1.1 0.6 0.9 0.7 0.5 0.6Price/Book3.7 4.4 4.8 8.3 8.6 26.5 12.6 6.7 7.9 8.8 10.7Price/Cash Flow9.0 11.4 11.9 15.9 15.7 23.3 12.6 13.0 13.9 10.5 12.6
Quarterly ResultsRevenue
Rev Growth
Earnings Per Share
USD Mil Mar 11 Jun 11 Sep 11 Dec 11
% Mar 11 Jun 11 Sep 11 Dec 11
USD Mar 11 Jun 11 Sep 11 Dec 11
Most Recent Period 11094.5 11361.4 11571.0 12101.4Prior Year Period 11143.9 11288.8 11251.8 11294.2
Most Recent Period -0.4 0.6 2.8 7.2Prior Year Period 105.5 105.1 100.2 37.7
Most Recent Period 0.61 0.66 0.66 0.59Prior Year Period 0.47 0.53 0.56 0.62
Industry Peers by Market Cap
Major Fund Holders
Mkt Cap USD Mil Rev USD Mil P/E ROE%
% of shares
Express Scripts 26470 46128 21.6 42.0CVS Caremark Corp 58001 112203 16.9 9.3
.
.
.
TTM data based on rolling quarterly data if available; otherwise most recent annual data shown.
© 2012 Morningstar. All Rights Reserved. Unless otherwise provided in a separate agreement, you may use this report only in the country in which its original distributor is based. Data as originally reported. The information contained herein is not represented or warranted to be accurate, correct, complete, or timely. This report is for information purposes only, and should not be considered a solicitation to buy or sell any security. Redistribution is prohibited without written permission. To order reprints, call +1 312-696-6100. To license the research, call +1 312-696-6869. ß
®

23
Morningstar’s Approach to Rating Stocks
Our Key Investing ConceptsEconomic Moat Rating��Discounted Cash Flow��Discount Rate��Fair Value��Uncertainty��Margin of Safety��Consider Buying/Consider Selling��Stewardship Grades��
TMAt Morningstar, we evaluate stocks as pieces of abusiness, not as pieces of paper. We think that purchasingshares of superior businesses at discounts to theirintrinsic value and allowing them to compound their valueover long periods of time is the surest way to createwealth in the stock market. We rate stocks 1 through 5 stars, with 5 the best and 1the worst. Our star rating is based on our analyst’sestimate of how much a company’s business is worth pershare. Our analysts arrive at this "fair value estimate" byforecasting how much excess cash--or "free cashflow"--the firm will generate in the future, and thenadjusting the total for timing and risk. Cash generatednext year is worth more than cash generated several yearsdown the road, and cash from a stable and consistentlyprofitable business is worth more than cash from acyclical or unsteady business. Stocks trading at meaningful discounts to our fair valueestimates will receive high star ratings. For high-qualitybusinesses, we require a smaller discount than formediocre ones, for a simple reason: We have moreconfidence in our cash-flow forecasts for strongcompanies, and thus in our value estimates. If a stock’smarket price is significantly above our fair value estimate,it will receive a low star rating, no matter how wonderfulwe think the business is. Even the best company is a baddeal if an investor overpays for its shares. Our fair value estimates don’t change very often, butmarket prices do. So, a stock may gain or lose stars based
just on movement in the share price. If we think a stock’sfair value is $50, and the shares decline to $40 withoutmuch change in the value of the business, the star ratingwill go up. Our estimate of what the business is worthhasn’t changed, but the shares are more attractive as aninvestment at $40 than they were at $50. Because we focus on the long-term value of businesses,rather than short-term movements in stock prices, at timeswe may appear out of step with the overall stock market.When stocks are high, relatively few will receive ourhighest rating of 5 stars. But when the market tumbles,many more will likely garner 5 stars. Although you mightexpect to see more 5-star stocks as the market rises, wefind assets more attractive when they’re cheap. We calculate our star ratings nightly after the marketsclose, and issue them the following business day, which iswhy the rating date on our reports will always be theprevious business day. We update the text of our reportsas new information becomes available, usually about onceor twice per quarter. That is why you’ll see two dates onevery Morningstar stock report. Of course, we monitormarket events and all of our stocks every business day, soour ratings always reflect our analyst’s current opinion. Economic Moat Rating The Economic Moat Rating is our assessment of a firm’sability to earn returns consistently above its cost of capitalin the future, usually by virtue of some competitiveadvantage. Competition tends to drive down such
TM
TM
Morningstar ResearchMethodology for ValuingCompanies QQQQQCompetitive Economic Company Fair Value Uncertainty
Analysis Moat Rating Valuation Estimate AssessmentTM
Analyst conducts The depth of the Analyst considers DCF model leads to An uncertaintycompany and industry firm’s competitive company financial the firm’s Fair Value assessmentresearch: advantage is rated: statements and Estimate, which establishes the� � competitive position anchors the rating margin ofManagement None to forecast future framework. safety required forinterviews Narrow cash flows. the stock rating.Conference calls Wide �Trade-show visits Assumptions areCompetitor, supplier, input into a dis-distributor, and counted cash-flowcustomer interviews model.
The current stockprice relative to fairvalue, adjustedfor uncertainty,determines therating.
QQQQQQQQQQQQQQQ
© 2012 Morningstar. All Rights Reserved. Unless otherwise provided in a separate agreement, you may use this report only in the country in which its original distributor is based. Data as originally reported.The information contained herein is not represented or warranted to be accurate, correct, complete, or timely. This report is for information purposes only, and should not be considered a solicitation to buy or sell any security.Redistribution is prohibited without written permission. To order reprints, call +1 312-696-6100. To license the research, call +1 312-696-6869.
ß ®

24
Morningstar’s Approach to Rating Stocks (continued)
economic profits, but companies that can earn them for anextended time by creating a competitive advantagepossess an Economic Moat. We see these companies assuperior investments. Discounted Cash Flow This is a method for valuing companies that involvesprojecting the amount of cash a business will generate inthe future, subtracting the amount of cash that thecompany will need to reinvest in its business, and usingthe result to calculate the worth of the firm. We use thistechnique to value nearly all of the companies we cover. Discount Rate We use this number to adjust the value of our forecastedcash flows for the risk that they may not materialize. For aprofitable company in a steady line of business, we’ll usea lower discount rate, also known as "cost of capital,"than for a firm in a cyclical business with fiercecompetition, since there’s less risk clouding the firm’sfuture. Fair Value This is the output of our discounted cash-flow valuationmodels, and is our per-share estimate of a company’sintrinsic worth. We adjust our fair values for off-balancesheet liabilities or assets that a firm might have--forexample, we deduct from a company’s fair value if it hasissued a lot of stock options or has an under-fundedpension plan. Our fair value estimate differs from a "targetprice" in two ways. First, it’s an estimate of what thebusiness is worth, whereas a price target typically reflectswhat other investors may pay for the stock. Second, it’s along-term estimate, whereas price targets generally focuson the next two to 12 months. Uncertainty To generate the Morningstar Uncertainty Rating, analystsconsider factors such as sales predictability, operatingleverage, and financial leverage. Analysts then classifytheir ability to bound the fair value estimate for the stockinto one of several uncertainty levels: Low, Medium, High,
Very High, or Extreme. The greater the level of uncertainty,the greater the discount to fair value required before astock can earn 5 stars, and the greater the premium to fairvalue before a stock earns a 1-star rating. Margin of Safety This is the discount to fair value we would require beforerecommending a stock. We think it’s always prudent tobuy stocks for less than they’re worth.The margin of safetyis like an insurance policy that protects investors from badnews or overly optimistic fair value estimates. We requirelarger margins of safety for less predictable stocks, andsmaller margins of safety for more predictable stocks. Consider Buying/Consider Selling The consider buying price is the price at which a stockwould be rated 5 stars, and thus the point at which wewould consider the stock an extremely attractivepurchase. Conversely, consider selling is the price atwhich a stock would have a 1 star rating, at which pointwe’d consider the stock overvalued, with low expectedreturns relative to its risk. Stewardship Grades Our corporate Stewardship Rating represents ourassessment of management’s stewardship of shareholdercapital, with particular emphasis on capital allocationdecisions. Analysts consider companies’ investmentstrategy and valuation, financial leverage, dividend andshare buyback policies, execution, compensation, relatedparty transactions, and accounting practices. Corporategovernance practices are only considered if they’ve had ademonstrated impact on shareholder value. Analystsassign one of three ratings: "Exemplary," "Standard," and"Poor." Analysts judge stewardship from an equity holder’sperspective. Ratings are determined on an absolute basis.Most companies will receive a Standard rating, and this isthe default rating in the absence of evidence thatmanagers have made exceptionally strong or poor capitalallocation decisions.
© 2012 Morningstar. All Rights Reserved. Unless otherwise provided in a separate agreement, you may use this report only in the country in which its original distributor is based. Data as originally reported.The information contained herein is not represented or warranted to be accurate, correct, complete, or timely. This report is for information purposes only, and should not be considered a solicitation to buy or sell any security.Redistribution is prohibited without written permission. To order reprints, call +1 312-696-6100. To license the research, call +1 312-696-6869.
ß ®

25
Express Scripts ESRX [Nasdaq] | QQQQTM
Last Price Fair Value Consider Buy Consider Sell Uncertainty Economic Moat Stewardship Morningstar Credit Rating Industry54.55 USD 73.00 USD 51.10 USD 98.55 USD Medium Wide . Health Care Plans A-
Close Competitors Currency(Mil) Market Cap TTM Sales Oper Income Net Income
Express Scripts
CVS Caremark Corp
USD
USD
26,470 46,128 2,312 1,276
58,001 112,203 6,429 3,524
Morningstar data as of May 07, 2012.
As a result of the Medco purchase, we project $1.6 billionworth of pretax synergies annually by 2016 from acombination of new client wins, lower drug costs becauseof increased bargaining power, and administrative costsavings. Our assumed cost synergies amount to justaround 1.5% of the combined entity’s total costs. Weproject approximately $113 billion of revenue and a 7.7%operating margin by 2016. We estimate Express Scripts’cost of equity at 10.5%. Risk Among the biggest risks to Express Scripts arecompetition and regulatory change. Although ExpressScripts’ competitive position has improved, aggressivepricing by competitors could still hurt profitability. Forexample, CVS Caremark may have an incentive tounderprice its PBM offering to drive more traffic to itsretail stores. UnitedHealth is expected to fully in-sourceits PBM business in 2013, which increases the competitivethreat from this MCO as well. While some health-carepolicy reforms could benefit Express Scripts, like genericbiologics legislation and expansion of insurance coverageto 32 million of the nation’s uninsured, other reforms couldmake it harder for Express Scripts to conduct business,such as PBM transparency requirements. Bulls Say
Demographic trends and growth in overall drugspending provide PBMs with a solid backdrop forgrowth.
Express Scripts makes much higher margins on genericdrugs, and the U.S. is in the midst of an unprecedentedwave of patent expirations on blockbuster brand-namedrugs. Some regulatory reform is beneficial for ExpressScripts, such as creation of a pathway for approval ofgeneric biologics and efforts to expand coverage to thenation’s uninsured. The acquisition of WellPoint’s NextRx PBM businessboosted Express Scripts’ scale and its competitiveadvantages. The Medco deal has transformed ExpressScripts into a wide-moat company.
Bears Say
The generics wave has driven higher margins forExpress Scripts, but will largely end after 2014. Thecompany will have to find new ways to create value forclients. The managed-care, retail pharmacy, andpharmaceutical manufacturing industries are all in aconsolidation phase. Larger customers and suppliershave stronger bargaining positions against ExpressScripts. Express Scripts could be hurt by aggressive pricing bycompetitors. For example, CVS Caremark couldunderprice its PBM services to drive greater traffic to itsretail stores. Medco is a much bigger company than NextRx was,which could lead to unforeseen integration problems. �
Financial Overview Financial Health: Express Scripts took on significant newdebt and issued stock to fund the NextRx purchase.However, the company quickly repaid the debt andrepurchased the stock. While the Medco purchase alsoresulted in a temporary increase in Express Scripts’financial leverage, we expect the company to use its
© 2012 Morningstar. All Rights Reserved. Unless otherwise provided in a separate agreement, you may use this report only in the country in which its original distributor is based. Data as originally reported.The information contained herein is not represented or warranted to be accurate, correct, complete, or timely. This report is for information purposes only, and should not be considered a solicitation to buy or sell any security.Redistribution is prohibited without written permission. To order reprints, call +1 312-696-6100. To license the research, call +1 312-696-6869.
ß ®

26
Express Scripts ESRX [Nasdaq] | QQQQTM
Last Price Fair Value Consider Buy Consider Sell Uncertainty Economic Moat Stewardship Morningstar Credit Rating Industry54.55 USD 73.00 USD 51.10 USD 98.55 USD Medium Wide . Health Care Plans A-
substantial cash flows to rebuild the balance sheet infairly short order. We remain comfortable with thecompany’s financial health. Company Overview Profile: Express Scripts is the largest pharmacy benefitmanager in the United States. Through its mail-orderpharmacy and network of retail pharmacies, we expectExpress Scripts to administer around 1.5 billion adjustedprescriptions in 2013. Management: We view Express Scripts’ stewardship asexemplary. The company is led by George Paz, whobecame CEO in 2005 and chairman of the board in 2006.Paz joined Express Scripts in 1998 as chief financialofficer. During his tenure as CEO, Paz has overseen anearly fourfold increase in Express Scripts’ earnings pershare. The stock has been a five-bagger during theseseven years, destroying returns at PBM peers and puttingPaz toward the top of the list of the best CEOs in healthcare, in our view. Paz will remain CEO now that the Medcomerger has been�consummated, although we hope thecompany can find room for some of Medco’s uppermanagement, as we also consider that company to beexceptionally well run.�Express Scripts did an admirablejob steering patients to alternative pharmacies when itexcluded Walgreen from its network, resulting in minimalclient disruption or attrition. We are particularly impressedby Express Scripts’ capital deployment. Terms of theNextRx acquisition were originally viewed as favorable toWellPoint, but the deal ended up being highly accretive toExpress Scripts. Aggressive share repurchases have alsoboosted shareholder value, and we expect significantvalue creation from the Medco deal.�We are encouragedby Express Scripts’ reasonable executive compensationpolicies. Paz’s total take was $8.5 million in 2011, down17% from the prior year. Even though earnings per sharegrew 19%, this was below the company’s target, which
prevented senior management from receiving any bonuseslast year.
© 2012 Morningstar. All Rights Reserved. Unless otherwise provided in a separate agreement, you may use this report only in the country in which its original distributor is based. Data as originally reported.The information contained herein is not represented or warranted to be accurate, correct, complete, or timely. This report is for information purposes only, and should not be considered a solicitation to buy or sell any security.Redistribution is prohibited without written permission. To order reprints, call +1 312-696-6100. To license the research, call +1 312-696-6869.
ß ®

27
Express Scripts ESRX [Nasdaq] | QQQQTM
Last Price Fair Value Consider Buy Consider Sell Uncertainty Economic Moat Stewardship Morningstar Credit Rating Industry54.55 USD 73.00 USD 51.10 USD 98.55 USD Medium Wide . Health Care Plans A-
Analyst Notes
Apr. 18, 2012 SXC and Catalyst to Merge, Further Concentrating PBM Industry
SXC Health Solutions and Catalyst Health Solutionsannounced Wednesday their intention to merge. Catalystshareholders will receive $28 in cash and 0.6606 share ofSXC for every Catalyst share owned, amounting to a 28%premium to Catalyst’s stock price before the deal wasannounced. We don’t currently cover either SXC or Catalyst,but this transaction supports our thesis of continuingconsolidation in the pharmacy benefit management sector.
We had previously speculated that the Medco-ExpressScripts merger could open the floodgates to further healthplan consolidation, and this deal could be a harbinger ofmore acquisition activity among both pharmacy benefitmanagers and managed-care organizations.�
Apr. 03, 2012 Express Scripts Closes Medco Acquisition, Establishes Wide Economic Moat
Express Scripts announced Monday that it has closed itsmerger with Medco Health Solutions. Medco shareholderswill receive $28.80 in cash and 0.81 share of ExpressScripts for each Medco share owned. Having accounted forexpected synergies from the deal, we value Express Scriptsat $73 per share, which implies an $88 fair value forMedco; we continue to recommend Express Scripts’ shares.We’re also raising our economic moat rating for ExpressScripts to wide, as we believe the company has greatlystrengthened its competitive advantage through this
merger. Size is the key to gaining bargaining power oversuppliers and leveraging administrative costs, and ExpressScripts will be far larger than its competitors, with around1.5 billion adjusted prescriptions. In a 3-1 vote, the FederalTrade Commission signed off on the merger, apparentlywithout demanding any concessions. We are maintainingour A- credit rating for Express Scripts, as we believe thefirm’s higher financial leverage is offset by its improvedcompetitive position.�
Mar. 28, 2012 Express Scripts May Close Medco Purchase Next Week
Express Scripts and Medco announced Wednesday thatthey may be able to close their merger as soon as nextweek. As we previously indicated, we plan to raise our fairvalue estimate for Express Scripts to $73 and for Medco to$88. We believe the merger has the potential to createsignificant revenue and cost synergies. If the transactioncloses as planned, it may have positive implications forExpress Scripts’ economic moat rating. We are maintainingour fair value estimate for Walgreen for now, as it remainsunclear how the pharmacy chain will react to thisdevelopment. In our opinion, Walgreen would be wise totake advantage of the temporary disruption of the mergerintegration to sign a new long-term deal with ExpressScripts. If Walgreen chooses to walk away from Medco’sbusiness as well, we are likely to lower our fair value
estimate.� �We were initially skeptical that the Federal TradeCommission would allow this deal to proceed. Even now,we had been assuming just a 60% probability that themerger would succeed. We expect the new Express Scriptsto have tremendous bargaining leverage over suppliers.Express Scripts has already been flexing its bargainingmuscle against Walgreen, but the merger with Medco givesthe pharmacy benefit manager unprecedented marketpower. We estimate that Express Scripts will controlaround 1.5 billion adjusted prescriptions in 2013, giving itapproximately 40% market share. Express Scripts will beabout 50% larger than its next largest competitor, CVSCaremark, and around 3 times the size of number-three
© 2012 Morningstar. All Rights Reserved. Unless otherwise provided in a separate agreement, you may use this report only in the country in which its original distributor is based. Data as originally reported.The information contained herein is not represented or warranted to be accurate, correct, complete, or timely. This report is for information purposes only, and should not be considered a solicitation to buy or sell any security.Redistribution is prohibited without written permission. To order reprints, call +1 312-696-6100. To license the research, call +1 312-696-6869.
ß ®

28
Express Scripts ESRX [Nasdaq] | QQQQTM
Last Price Fair Value Consider Buy Consider Sell Uncertainty Economic Moat Stewardship Morningstar Credit Rating Industry54.55 USD 73.00 USD 51.10 USD 98.55 USD Medium Wide . Health Care Plans A-
Analyst Notes (continued)
UnitedHealth. Express Scripts will be about 8 times largerthan the industry’s number-four player.� �We view Express Scripts’ management team as one of thebest in health care. The company has established a recordof successful acquisitions, most recently of WellPoint’sNextRx unit, and we do not anticipate significantintegration headaches. Over the long run, we expectExpress Scripts to wield its tremendous influence overpharmaceutical spending to pressure suppliers (generic andbrand-name drugmakers, distributors, retail pharmacies)and leverage administrative costs. This should enable thecompany to expand its own margins while passing somesavings through to customers and gaining market share.We view almost every other participant in thepharmaceutical supply chain as worse off as a result ofExpress Scripts’ improved clout.�
�Despite our optimism for Express Scripts, there are somerisks to the merger. Medco has historically been willing toaccommodate customers to a greater extent than ExpressScripts, leaving it with a number of large customizedcontracts where the PBM provides a limited set of services.Express Scripts has tended to prefer full-service contractswhere the PBM controls most aspects of the pharmacybenefit. Express Scripts will need to become more flexiblein order to retain some clients. There is a risk of clientattrition during the integration, particularly as ExpressScripts navigates other challenges like the exclusion ofWalgreen from its pharmacy network and CVS Caremark’srecent aggressive pricing. Express Scripts is greatlyincreasing its leverage to complete the deal, reducing itsmargin for error.�
Mar. 13, 2012 Regulatory Approval of Medco-Express Scripts Merger Could Be More Likely
The deadline for the Federal Trade Commission to respondto the proposed merger between Express Scripts andMedco came and went Monday, with no word from theregulator as to its position. Both companies filed an 8-K tosay that they had agreed to give the agency more time, butare expecting to close the merger early in the secondquarter. The Wall Street Journal reported late last weekthat the FTC is not taking the steps necessary to build alegal case against the merger and appears likely to approvethe deal with some conditions. It remains unclear whetherthe companies and the FTC will be able to find acompromise that satisfies both sides, but we now think the
balance has shifted slightly toward approval. We anticipateincreasing our assumption for the probability that themerger receives regulatory approval to 60% from 40%,which should result in an increase to our fair valueestimates for both Express Scripts and Medco in the5%-10% range. We are maintaining all other fair valueestimates pending more information. The company atgreatest risk of a fair value estimate decrease should themerger go through is Walgreen�, since it risks beingexcluded from Medco’s pharmacy network in addition toExpress Scripts’ network.�
Feb. 23, 2012 Dispute With Walgreen Demonstrates Express Scripts’ Expanding Economic Moat
Express Scripts reported 2011 earnings that were slightlybelow our expectations but still showed solid growth fromthe prior year. Management reaffirmed that the exclusionof Walgreen from the pharmacy network is having little
adverse impact on client retention, and that the mergerwith Medco remains on pace for a first-half 2012 close. Atrecent trading levels around $53, we think Express Scriptsis modestly undervalued relative to our $61 fair value
© 2012 Morningstar. All Rights Reserved. Unless otherwise provided in a separate agreement, you may use this report only in the country in which its original distributor is based. Data as originally reported.The information contained herein is not represented or warranted to be accurate, correct, complete, or timely. This report is for information purposes only, and should not be considered a solicitation to buy or sell any security.Redistribution is prohibited without written permission. To order reprints, call +1 312-696-6100. To license the research, call +1 312-696-6869.
ß ®

29
Express Scripts ESRX [Nasdaq] | QQQQTM
Last Price Fair Value Consider Buy Consider Sell Uncertainty Economic Moat Stewardship Morningstar Credit Rating Industry54.55 USD 73.00 USD 51.10 USD 98.55 USD Medium Wide . Health Care Plans A-
Analyst Notes (continued)
estimate. Our fair value estimate assumes a 40%probability that the Medco merger succeeds. If the mergerfails, our fair value estimate would revert to $53, and wewould see Express Scripts as fairly valued. If the mergersucceeds, our fair value estimate would increase to around$72, leaving significant upside for investors.� �Express Scripts’ full-year adjusted earnings of $2.97 pershare increased 19% from the prior year. Despite this solidgrowth, earnings were below the company’s internal target,so management reports that it will receive zero bonuses for2011. Share repurchases and margin expansion were theprimary drivers of earnings growth, as revenue increasedjust 2.6%. The operating margin expanded 40 basis pointsto 5%. After several years of steady margin improvement,Express Scripts is now the most profitable of the big threepharmacy benefit managers. EBITDA per adjustedprescription came in at $3.54 for the year, compared with$3.23 for Medco and $2.93 for CVS Caremark. The sharecount fell 7.2% from the prior year, helped by $2.5 billion ofshare repurchases during 2011. The share count is nowback around a seven-year low, as Express Scripts was quickto repurchase the shares issued for the NextRx acquisition.� �
With the transition of patients away from Walgreen nowlargely complete, management reiterated its 97% clientretention rate for 2012, with 95% of clients moving forwardwithout Walgreen in their pharmacy networks. In our view,this is a powerful demonstration of Express Scripts’expanding economic moat (and Walgreen’s declining moat).It also shows exceptional execution on the part ofmanagement, as patient disruption was minimized duringwhat CEO George Paz called the "largest retail market sharemovement in the history of pharmacy." Express Scripts evenreceived praise from CVS Caremark on its conference call,as the head of the Caremark PBM stated, "I have to tip myhat here to our competitor Express. I think they have donean excellent job making this change very smooth for theircustomers. And many of the plans that I’ve spoken to thatactually have gone through this have been very clear thatthis has not really been a big deal for them." � �Express Scripts is due a response from the Federal TradeCommission on its merger with Medco within a month. Ifthe merger is allowed to proceed, there is a good chancethat the combined company could have a wide economicmoat, in our view.�
Feb. 06, 2012 FTC Rumored To Oppose the Medco/Express Scripts Deal
A Reuters article Monday claimed that key Federal TradeCommission (FTC) officials are opposed to the mergerbetween Medco and Express Scripts, and are working tobuild a case against it. Both stocks declined sharply on thenews. We have been assuming a 40% chance that the dealreceives regulatory approval and a 60% chance that it isrejected. The article did not name a source and we aremaintaining all fair value estimates pending somesubstantiation of this rumor.� �We expected the Medco/Express Scripts merger to create
considerable synergies, which were incorporated in ourbull-case assumptions for both companies. Assuming thedeal is rejected, we would revert to our stand-alone fairvalue estimates, which are $60 for Medco and $53 forExpress Scripts. At current trading levels, we view bothcompanies as about fairly valued if the deal fails ormeaningfully undervalued if the merger succeeds. We arenot surprised by the regulatory scrutiny. Since the mergerwas announced, we’ve consistently stated that regulatorswere more likely than not to reject the deal due to the highdegree of consolidation in the PBM industry and the Obama
© 2012 Morningstar. All Rights Reserved. Unless otherwise provided in a separate agreement, you may use this report only in the country in which its original distributor is based. Data as originally reported.The information contained herein is not represented or warranted to be accurate, correct, complete, or timely. This report is for information purposes only, and should not be considered a solicitation to buy or sell any security.Redistribution is prohibited without written permission. To order reprints, call +1 312-696-6100. To license the research, call +1 312-696-6869.
ß ®

30
Express Scripts ESRX [Nasdaq] | QQQQTM
Last Price Fair Value Consider Buy Consider Sell Uncertainty Economic Moat Stewardship Morningstar Credit Rating Industry54.55 USD 73.00 USD 51.10 USD 98.55 USD Medium Wide . Health Care Plans A-
Analyst Notes (continued)
administration’s view that competition between health-carepayors is necessary for controlling health-care costs.� �If the merger is rejected, it would be a significant positivefor CVS Caremark and especially Walgreen, which recentlyexited Express Scripts’ network. It would also be a marginalpositive for AmerisourceBergen, whose largest customer is
Medco. However, we are maintaining our fair valueestimates for all of these companies as our relativelypessimistic take on the regulatory outlook for the mergerprevented us from explicitly incorporating possible effectsof the merger in our base-case forecasts.�
Feb. 03, 2012 Walgreen Waves Goodbye to Express Scripts’ Members, Perhaps Forever
Walgreen’s January sales release showed a precipitous7.9% decline in pharmaceutical same-store sales, asExpress Scripts’ PBM members abandoned the retailpharmacy chain in droves. While we had anticipated thiswould happen if Walgreen and Express Scripts couldn’treach an agreement by the end of last year, we hadexpected more of an offset from growth among othercustomers. Instead, it appears the Express Scripts loss wascompounded in January by a relatively weak cold and fluseason as well as a strengthening headwind from newgeneric launches. Even though the negative flu comparisonswill moderate in the rest of the year, we are reducing ourassumptions for both same-store sales and margins andlowering our fair value estimate for Walgreen to $35 from$37. Our fair value uncertainty remains high, as the cloudsover Walgreen are as dark as ever, particularly consideringthe pending Express Scripts-Medco merger.� �Walgreen’s overall January sales declined 2.3%, whileoverall same-store sales declined 4.6%. Same-storefront-end sales increased 1.6%, strengtheningmanagement’s frequently made case that there is a lowcorrelation between front-end and prescription sales.Same-store prescription sales declined 7.9% asprescription volumes plummeted 8.6%. The loss of ExpressScripts created a 10.6% headwind to prescription sales, asWalgreen was able to retain at best 15% of theseprescriptions. We had consistently stated that Walgreen’s
prescription retention target of 25%-75% was unrealistic.With sales falling more steeply than management hadhoped, it is likely that margin contraction will also be moresevere, as the company will struggle to offset so much lostrevenue with cost cuts. New generic drugs and therelatively weak flu season resulted in a 2.1% and 2.4%headwind to same-store pharmacy sales, respectively,while calendar day shifts provided a 1.3% tailwind.� �Our interpretation of the Walgreen-Express Scripts disputeremains the same. PBMs enjoy growing bargaining power,while retail pharmacies face fierce competitive andreimbursement pressure. Investors have likely noticed signsat most major pharmacy chains welcoming Express Scripts’customers with open arms. Walgreen bet that PBMcustomers would not accept a pharmacy network thatexcluded Walgreen, and Express Scripts called that bet.Express Scripts should feel minimal adverse impact fromthe dispute, while Walgreen faces sharply declining salesand margins. This reinforces our view that Express Script’seconomic moat is widening, while Walgreen’s moat is indecline.� �It appears that Walgreen has got itself in a real pickle.Pharmacy customers tend to be sticky: they are both hard tolose, and hard to win back. Many of the customers who areabandoning Walgreen now probably won’t return, even ifthe company reaches an agreement with Express Scripts in
© 2012 Morningstar. All Rights Reserved. Unless otherwise provided in a separate agreement, you may use this report only in the country in which its original distributor is based. Data as originally reported.The information contained herein is not represented or warranted to be accurate, correct, complete, or timely. This report is for information purposes only, and should not be considered a solicitation to buy or sell any security.Redistribution is prohibited without written permission. To order reprints, call +1 312-696-6100. To license the research, call +1 312-696-6869.
ß ®

31
Express Scripts ESRX [Nasdaq] | QQQQTM
Last Price Fair Value Consider Buy Consider Sell Uncertainty Economic Moat Stewardship Morningstar Credit Rating Industry54.55 USD 73.00 USD 51.10 USD 98.55 USD Medium Wide . Health Care Plans A-
Analyst Notes (continued)
the future. With customer disruption already in the past,Express Scripts has little reason to compromise now, soWalgreen will be lucky to even receive the reimbursementterms Express Scripts’ offered originally. Worst of all, if themerger between Express Scripts and Medco is allowed toproceed, Walgreen stands to lose an even greaterpercentage of sales and face even more severe margincontraction. On the plus side, while Express Scripts andMedco project their combination to close within the nextfive months, we still believe there is only a 40% chance ofthe deal receiving regulatory approval.� �We have been considering Walgreen’s strategicalternatives, and we don’t see many. The company’s currentapproach of trying to circumvent Express Scripts and reachside deals with its clients does not appear to be working.Few clients seem willing to pay higher prices or switchPBMs to keep Walgreen in their pharmacy network. If theExpress Scripts-Medco merger goes through, Walgreencould find itself in a desperate situation, with no bargaining
leverage and facing a sharp profit falloff.� �We can think of at least one truly bold move Walgreencould make. The company should consider a merger with itschief retail rival, CVS Caremark. While certainly a long shotin light of the companies’ different cultures and highregulatory hurdles to a deal, a merger between CVS andWalgreen would both improve bargaining power relative tothird-party PBMs--helping the companies defend retailprofit margins--and enhance the value proposition of CVSCaremark’s integrated retail-PBM model. If the ExpressScripts-Medco deal can get by the Federal TradeCommission, a CVS-Walgreen tie-up would seem no lesslikely. The retail pharmacy business would still be muchmore competitive than the PBM industry, and unlikeExpress Scripts and Medco, CVS and Walgreen could divestindividual stores to mitigate concerns about regionalmarket share concentration.�
Dec. 21, 2011 Walgreen’s and Express Scripts’ Game of Chicken Coming Close to a Crash
Walgreen reported weak fiscal first-quarter results, sendingthe shares down another 7% Wednesday morning. Thestock is down more than 30% since Walgreen announced inJune that it is exiting Express Scripts’ pharmacy network atthe end of this year, but Walgreen continues to stand itsground on its reimbursement demands. Although we aremaintaining our fair value estimate, we are temporarilyincreasing our fair value uncertainty rating for Walgreen tohigh.� �In our view, it is in both Walgreen’s and Express Scripts’best interest to reach a compromise, and there is still somepossibility of a deal before the end of the year. However,absent a new contract we see much more potentialdownside for Walgreen than Express Scripts, particularly if
Express Scripts’ proposed merger with Medco is allowed toproceed. Walgreen says it would be willing to walk awayfrom Medco’s business too, but we can hardly see how thatis a serious threat. The combined Express Scripts-Medcowould control around 40% of the nation’s prescriptionvolume. The only other major pharmacy benefit manager isCVS Caremark--Walgreen’s largest retail competitor and acompany that is aggressively trying to direct patients to itsown retail stores. Walgreen increasingly looks like the oddman out.� �The Walgreen-Express Scripts dispute boils down to a fewsimple questions, but each company has fundamentallydifferent answers. Are there meaningful savings to be hadby excluding high-cost pharmacies from PBM networks?
© 2012 Morningstar. All Rights Reserved. Unless otherwise provided in a separate agreement, you may use this report only in the country in which its original distributor is based. Data as originally reported.The information contained herein is not represented or warranted to be accurate, correct, complete, or timely. This report is for information purposes only, and should not be considered a solicitation to buy or sell any security.Redistribution is prohibited without written permission. To order reprints, call +1 312-696-6100. To license the research, call +1 312-696-6869.
ß ®

32
Express Scripts ESRX [Nasdaq] | QQQQTM
Last Price Fair Value Consider Buy Consider Sell Uncertainty Economic Moat Stewardship Morningstar Credit Rating Industry54.55 USD 73.00 USD 51.10 USD 98.55 USD Medium Wide . Health Care Plans A-
Analyst Notes (continued)
Walgreen says pharmacy costs vary within a tight band, butExpress Scripts says potential savings are material. Areclients willing to sacrifice access to some pharmacies inexchange for lower costs? Walgreen says customersdemand access to its pharmacies, but Express Scripts saystheir preference is for lower costs. Are clients willing tochange PBMs to keep Walgreen in-network? Ifprescriptions are transferred to competing pharmacies, willthose patients ever come back to Walgreen? In answer toboth of these questions, Walgreen says yes, ExpressScripts says no. � �We attended CVS Caremark’s investor day Tuesday in NewYork, and it was interesting to observe that CVS’management team seems to agree with Express Scripts onall the important points. CVS appears much moreenthusiastic about the opportunity to gain share on theretail side than on the PBM side and believes clients aren’tlikely to abandon Express Scripts just because Walgreen
isn’t in the network. We agree with this assessment andbelieve Walgreen may have overplayed its hand. � �Turning to Walgreen’s first-quarter results, earnings pershare increased by just a penny despite 4.7% revenuegrowth and a 5% reduction in the share count. This wasoffset by operating margin contraction to 5% from 5.4% inthe prior year. While the Express Scripts loss was a mildheadwind in the first quarter, the impact is likely to be feltmuch more strongly for the rest of the year. On the otherhand, Walgreen should benefit from the huge volume ofbrand-name drugs facing generic competition later thisyear. While new generics will only compound the revenuechallenge, they should provide a helpful offset to margincontraction. We project a 5.3% operating margin for the fullyear, although substantial cost discipline will be requiredfrom management to achieve this result.�
© 2012 Morningstar. All Rights Reserved. Unless otherwise provided in a separate agreement, you may use this report only in the country in which its original distributor is based. Data as originally reported.The information contained herein is not represented or warranted to be accurate, correct, complete, or timely. This report is for information purposes only, and should not be considered a solicitation to buy or sell any security.Redistribution is prohibited without written permission. To order reprints, call +1 312-696-6100. To license the research, call +1 312-696-6869.
ß ®
Disclaimers & DisclosuresNo Morningstar employees are officers or directors of this company. Morningstar Inc. does not own more than 1% of the shares of this company. Analystscovering this company do not own its stock. The information contained herein is not represented or warranted to be accurate, correct, complete, or timely.This report is for information purposes only, and should not be considered a solicitation to buy or sell any security.

33
?
DCP Midstream Partners LP DPM [NYSE] | QQQQTM
Last Price Fair Value Consider Buy Consider Sell Uncertainty Economic Moat Stewardship Morningstar Credit Rating Industry44.49 USD 53.00 USD 31.80 USD 82.15 USD High Narrow . Oil & Gas Midstream BBB-
Currency amounts expressed with "$"are in U.S. dollars (USD) unlessotherwise denoted.
DCP Midstream Partners Reports Strong 1Q Growth in NaturalGas and NGL Businesses
by Avi FeinbergStock AnalystAnalysts covering this company do notown its stock.
Pricing data through May 07, 2012.Rating updated as ofMay 07, 2012.
08 09 10 11 12
8.0
19.0
29.0
39.0
Stock Price
Analyst Note May 08, 2012 DCP Midstream Partners �reported strong first-quarterresults driven by its core natural gas services and naturalgas liquids business, which easily made up for the impactof warm weather on the propane business. Adjustedearnings before interest, taxes, depreciation, andamortization climbed 31% year over year to $84 million,including the East Texas acquisition in both periods peraccounting rules. We think it’s useful to note that adjustedEBITDA jumped 60% from the originally reported 2011figure, which highlights the full impact of the drop-down.Quarterly adjusted EBITDA easily exceeded our forecast of$67 million largely due to higher-than-expected realizedcommodity prices, as illustrated by $17 million of nethedge receipts. However, we don’t foresee any changes toour long-term outlook or fair value estimate. Thepartnership increased its distribution 1.5% sequentially to$0.66 per unit while maintaining solid coverage of 1.29times during the quarter and 1.07 times over the past 12months. Natural gas service led the way at the segment level withadjusted segment EBITDA of $67 million, a 31% increasefrom the first quarter of 2011 and an 83% increase fromthe original 2011 number, excluding East Texas. GrossNGL production increased 13% year over year, or 55%from the originally reported figure, to 63 thousand barrelsper day. This type of growth illustrates the power ofdrop-downs on the partnership’s growth, which is themajor driver behind our robust outlook for the next threeyears or longer. The NGL logistics segment also turned ina solid quarter, posting adjusted segment EBITDA of $11.8million. This represents an 84% increase from the 2011quarter, driven by an 81% increase in NGL pipelinethroughput thanks to the Wattenberg expansion projectand DJ Basin fractionator acquisition. Finally, thewholesale propane segment saw adjusted segmentEBITDA decline 8% to $17 million as propane volumes fell14% due to extraordinarily warm winter weather. We
consider the quarter a pretty solid one in light of theweather and a confirmation that DCP’s model is somewhatless volatile than retail propane distribution. Thesis Mar. 12, 2012 DCP Midstream Partners LP is a master limited partnershipwith a� small but diverse asset base, attractive growthprospects, and� powerful sponsorship from its corporateparent, DCP Midstream LLC ("Midstream"). Acquisitionsand� asset drop-downs have grown the partnership’s�footprint since its IPO, a trend that looks to beaccelerating thanks to booming unconventional naturalgas liquids production. While acquisitions likely willcontinue to� drive growth, we welcome the trend ofincreasing organic growth spending that integrates andoptimizes the partnership’s growing footprint.� DCP’s three business segments include natural gasservices, wholesale propane, and natural gas liquids (NGL)logistics. Natural gas services, which contributes roughly70% of segment cash flows, includes gathering,compressing, treating, processing, fractionating,transporting and storing natural gas across seven states.Next, the seasonal wholesale propane business in theNortheast contributes around 15% of segment cash flows.Finally, NGL logistics also contributes about 15% of totalcash flows, bringing attractive fee-based revenues alongwith strong growth potential. On the whole, thepartnership’s cash flows are about 60% fee-based, upfrom 40% a couple of years ago, and pretty stable asmuch of the commodity exposure is hedged several yearsout.� Since inception, DCP has benefited greatly from thesponsorship� of general partner DCP Midstream LLC("Midstream"), a joint venture between� Spectra Energyand ConocoPhillips and the largest pure-playgathering-processing entity. Midstream understandsfirsthand the cost of capital advantages inherent in MLPsand is committed to spinning assets off to the MLP andusing it as a funding vehicle for organic growth projectsthat benefits the whole enterprise. To date, the GP has

34
DCP Midstream Partners LP DPM [NYSE] | QQQQTM
Last Price Fair Value Consider Buy Consider Sell Uncertainty Economic Moat Stewardship Morningstar Credit Rating Industry44.49 USD 53.00 USD 31.80 USD 82.15 USD High Narrow . Oil & Gas Midstream BBB-
Close Competitors Currency(Mil) Market Cap TTM Sales Oper Income Net Income
DCP Midstream Partners LP
Energy Transfer Partners, L.P.
Regency Energy Partners LP
Crosstex Energy, Inc.
USD
USD
USD
USD
2,029 1,570 117 75
10,755 6,850 1,245 236
3,618 1,434 40 57
667 2,014 74 -6
Morningstar data as of May 07, 2012.
dropped down numerous assets including its wholesalepropane business, a 40% stake in the Discovery offshoreassets, the East Texas gathering and processing assets,and the vertically integrated Southeast Texas assets.Looking forward, the size of drop-downs is set to jumpdramatically as the general partner requires larger equityinfusions to help fund an ambitious $4 billion NGL-drivencapital program, with another $2 billion of potentialprojects. As a result, the partnership plans to spend about$3 billion toward drop-downs through 2014, the majorityof which will go toward the new Sand Hills and SouthernHills NGL pipelines to the Gulf Coast. We strongly supportthe decision to drop these assets into the partnership,which will further stabilize cash flows, improve verticalintegration with the Natural Gas Services segment, andultimately drive distribution growth.�� While acquisitions have driven growth since inception,and will remain the top growth driver for several years tocome, organic growth has become increasingly important.Officially, the partnership follows a three-pronged growthstrategy: "optimize, build, acquire." From its 2005 IPO into2011, DCP spent about 90% of its growth capital onacquisitions (nearly half of them drop-downs from thegeneral partners), and 10% on organic growth.Acquisitions understandably dominated as the partnershipscaled up from scratch. But as the asset base matures,management anticipates that organic growthopportunities like the Eagle Plant newbuild will continueto materialize. Some of these organic growth projectsmight come through joint venture arrangements withMidstream. The general partner’s strong presence in
liquids-rich shale plays--most notably the Permian, EagleFord, and Niobrara--should translate to significantinvestment opportunities for a long time, and the GP hasexplicitly stated that it will involve the partnership in itsdevelopment plans. We’re glad to see DCP findingthird-party deals, and more so, ramping up organic growthspending, as even the best drop-down stories hinge onfavorable access to capital markets and don’t lastforever. Valuation, Growth and Profitability We are raising our fair value estimate for DCP MidstreamPartners to $53 per unit from $34 following a number ofsignificant changes. First, we incorporated a lift from thetime value of money as we rolled our model forward.Second, we lowered our cost of equity assumption by 1%to 10%, which recognizes the stable and increasinglyfee-based cash flow profile of the partnership, and placesit in line with other investment grade MLPs we cover.Finally, and most importantly, we significantly raised ourgrowth capital forecast based on the visible drop-downsmanagement has identified and planned over the nextthree years, which far exceed the partnership’s historicalgrowth spending and our prior estimates.� We continue to use a scenario� approach comprising high-,base-, and low-case fair value estimates� of $65, $52, and$42 per unit, respectively. In our base case, we� assumethat cash flows will grow roughly 30% per year onaverage for the next five years, up from 20% previously,thanks to some relatively massive investment in NGLinfrastructure over the next three years. Roughly $4 billionof growth spending over the next five years, primarilytoward NGL logistics assets, drives this growth. Afteraccounting for a 13% annual average increase in unitcount to support this growth and a growing GP burden, weestimate that per-unit distributions will grow about 8%annually over a five-year period. We discount cash flows
© 2012 Morningstar. All Rights Reserved. Unless otherwise provided in a separate agreement, you may use this report only in the country in which its original distributor is based. Data as originally reported.The information contained herein is not represented or warranted to be accurate, correct, complete, or timely. This report is for information purposes only, and should not be considered a solicitation to buy or sell any security.Redistribution is prohibited without written permission. To order reprints, call +1 312-696-6100. To license the research, call +1 312-696-6869.
ß ®

35
DCP Midstream Partners LP DPM [NYSE] | QQQQTM
Last Price Fair Value Consider Buy Consider Sell Uncertainty Economic Moat Stewardship Morningstar Credit Rating Industry44.49 USD 53.00 USD 31.80 USD 82.15 USD High Narrow . Oil & Gas Midstream BBB-
with a cost of equity of 10% and a weighted average costof capital of 8.9%. At our fair� value estimate, DCP’s unitswould yield 5.2% based on our 2012 distribution forecastof $2.73 per unit. Risk As with other gatherer-processors, DCP’s biggest threat is�lack of access to growth capital on favorable terms. Also,despite� a significant portion of fee-based business, closeto half the� partnership’s cash flows are either directlyexposed to commodities� or hedged. Interruptions inupstream production, adverse regulatory� changes, pipelineleaks or explosions, or tax law changes that reduce theattractiveness of MLPs could all hurt the partnership.Rising interest rates could drag on unit prices and drive upthe partnership’s cost of capital. Bulls Say
DCP’s general partner, DCP Midstream LLC, is amongthe largest U.S. midstream operators and bringsremarkable experience, management depth, and assetdrop-down opportunities to the partnership. The DCP enterprise has a strong presence in liquids-richshale plays including the Eagle Ford, Permian, andNiobrara, which should drive major drop-downopportunities for the partnership in the coming years. �Some of the company’s asset base is interlinked,allowing the firm to collect economic rents acrossmultiple portions of the midstream value chain. DCP is small enough that even modest projects anddeals will move the needle, and there’s much moreopportunity for small accretive projects in the industrythan for giant blockbusters. Increasing fee-based cash flows and hedging protectagainst downside commodity exposure while preservingsome upside.
Bears Say
DCP requires regular access to capital markets to obtaingrowth capital, which means a low stock price or risingrates could put a damper on future growth. The�partnership�is little more than an MLPappendage�of its general partner, and unitholders haveno assurance that their long-term interests will beserved. Customer concentration is another risk�since a�largeportion of total revenue comes from transactions withDCP’s general partner and the companies that own it. �Gathering and processing assets serve producers in onegeographic region, where production eventuallydeclines; active pursuit of growth is required togenerate free cash flows in the long run. Like owners of any partnership, investors in DCPPartners are responsible for their share of thepartnership’s tax bill. This can decrease the net returnsinvestors enjoy from holding the partnership units andincrease tax-filing complexity.
Financial Overview Financial Health: DCP historically has operated thepartnership quite conservatively, especially as fee-basedcash flows ramped up from about 40% a few years ago toaround 60% today, which stabilized and improveddistribution coverage. The general partner provides a nicefinancial backstop and has demonstrated in the past thatit will aid the partnership in times of need, be it with assetdrop-downs, equity purchases, loans, etc. Company Overview Profile: DCP Midstream Partners LP is a midstream masterlimited� partnership that gathers, processes, transports,stores fractionates and markets� natural gas and naturalgas liquids in Louisiana, Texas, Oklahoma,� Colorado,Wyoming, and Michigan. It also operates wholesale
© 2012 Morningstar. All Rights Reserved. Unless otherwise provided in a separate agreement, you may use this report only in the country in which its original distributor is based. Data as originally reported.The information contained herein is not represented or warranted to be accurate, correct, complete, or timely. This report is for information purposes only, and should not be considered a solicitation to buy or sell any security.Redistribution is prohibited without written permission. To order reprints, call +1 312-696-6100. To license the research, call +1 312-696-6869.
ß ®

36
DCP Midstream Partners LP DPM [NYSE] | QQQQTM
Last Price Fair Value Consider Buy Consider Sell Uncertainty Economic Moat Stewardship Morningstar Credit Rating Industry44.49 USD 53.00 USD 31.80 USD 82.15 USD High Narrow . Oil & Gas Midstream BBB-
propane� distribution terminals in the Northeastern UnitedStates. The� partnership is managed by its general partner,DCP Midstream LLC, a� joint venture between SpectraEnergy and ConocoPhillips. Management: Mark Borer, a long-time, experiencedexecutive with DCP Midstream, has led the partnership asCEO since 2006. The partnership’s board features a verydeep bench with seasoned current and former executivesfrom Spectra, ConocoPhillips, Duke Energy, and others.While the partnership is managed and controlled by itsgeneral partner, leaving little if any influence to commonunitholders, we feel that stewardship of unitholder capitalstill has been average. If we had to fault management forsomething, it would be for taking a potentially slower thannecessary route to unlock the potential of its relationshipwith the general partner and its strong position in the NGLvalue chain. However, the partnership’s three-year planunveiled in early 2012 takes the bull by the horn on both ofthese counts, and we applaud the transparency into futuregrowth and capital allocation plans. Operationally,management has run a pretty tight ship for the most part,with some downtime for planned maintenance at some ofthe legacy assets, as we’d expect, but no major mishaps.While the partnership has grown largely throughacquisitions, it has paid reasonable to attractive multipleson pretty much all of these deals, thanks partly to the factthat drop-downs tend to be more attractively priced thanthird-party deals.�
© 2012 Morningstar. All Rights Reserved. Unless otherwise provided in a separate agreement, you may use this report only in the country in which its original distributor is based. Data as originally reported.The information contained herein is not represented or warranted to be accurate, correct, complete, or timely. This report is for information purposes only, and should not be considered a solicitation to buy or sell any security.Redistribution is prohibited without written permission. To order reprints, call +1 312-696-6100. To license the research, call +1 312-696-6869.
ß ®

37
DCP Midstream Partners LP DPM [NYSE] | QQQQTM
Last Price Fair Value Consider Buy Consider Sell Uncertainty Economic Moat Stewardship Morningstar Credit Rating Industry44.49 USD 53.00 USD 31.80 USD 82.15 USD High Narrow . Oil & Gas Midstream BBB-
Analyst Notes
May 08, 2012 DCP Midstream Partners Reports Strong 1Q Growth in Natural Gas and NGL Businesses
DCP Midstream Partners �reported strong first-quarterresults driven by its core natural gas services and naturalgas liquids business, which easily made up for the impactof warm weather on the propane business. Adjustedearnings before interest, taxes, depreciation, andamortization climbed 31% year over year to $84 million,including the East Texas acquisition in both periods peraccounting rules. We think it’s useful to note that adjustedEBITDA jumped 60% from the originally reported 2011figure, which highlights the full impact of the drop-down.Quarterly adjusted EBITDA easily exceeded our forecast of$67 million largely due to higher-than-expected realizedcommodity prices, as illustrated by $17 million of net hedgereceipts. However, we don’t foresee any changes to ourlong-term outlook or fair value estimate. The partnershipincreased its distribution 1.5% sequentially to $0.66 perunit while maintaining solid coverage of 1.29 times duringthe quarter and 1.07 times over the past 12 months.� �Natural gas service led the way at the segment level withadjusted segment EBITDA of $67 million, a 31% increasefrom the first quarter of 2011 and an 83% increase from theoriginal 2011 number, excluding East Texas. Gross NGL
production increased 13% year over year, or 55% from theoriginally reported figure, to 63 thousand barrels per day.This type of growth illustrates the power of drop-downs onthe partnership’s growth, which is the major driver behindour robust outlook for the next three years or longer. TheNGL logistics segment also turned in a solid quarter,posting adjusted segment EBITDA of $11.8 million. Thisrepresents an 84% increase from the 2011 quarter, drivenby an 81% increase in NGL pipeline throughput thanks tothe Wattenberg expansion project and DJ Basinfractionator acquisition. Finally, the wholesale propanesegment saw adjusted segment EBITDA decline 8% to $17million as propane volumes fell 14% due to extraordinarilywarm winter weather. We consider the quarter a prettysolid one in light of the weather and a confirmation thatDCP’s model is somewhat less volatile than retail propanedistribution.�
Apr. 12, 2012 Enterprise, DCP Midstream, and Anadarko Announce Joint DJ Basin NGL Pipeline
Enterprise Products Partners�, DCP Midstream LLC, andAnadarko Petroleum�announced plans to jointly develop anew 435-mile natural gas liquids pipeline from the DJ Basinto Skellytown, Texas. The Front Range Pipeline will connectto Enterprise’s Mid-America Pipeline as well as the recentlyannounced Texas Express Pipeline, giving DJ Basin NGLproducers access to the Gulf Coast market. Subject to anupcoming binding open season, the parties expect initialcapacity of about 150,000 barrels per day, expandable to230,000 bpd.�Initial service is slated for the fourth quarterof 2013.� �
We like this project for all three players, as it meets amarket need in the DJ and allows them to push additionalvolumes onto the Texas Express Pipeline at its origin inSkellytown. In a separate but related announcementThursday, DCP Midstream Partners announced that it isacquiring a 10% interest in the Texas Express joint venturefrom Enterprise for $85 million, which means that all threepartners will have an interest in both Front Range andTexas Express. Down the road, we expect that Anadarkoand DCP Midstream LLC will drop down their respectiveinterests in Front Range to Western Gas and DCPMidstream Partners, further scaling up and diversifying the
© 2012 Morningstar. All Rights Reserved. Unless otherwise provided in a separate agreement, you may use this report only in the country in which its original distributor is based. Data as originally reported.The information contained herein is not represented or warranted to be accurate, correct, complete, or timely. This report is for information purposes only, and should not be considered a solicitation to buy or sell any security.Redistribution is prohibited without written permission. To order reprints, call +1 312-696-6100. To license the research, call +1 312-696-6869.
ß ®

38
DCP Midstream Partners LP DPM [NYSE] | QQQQTM
Last Price Fair Value Consider Buy Consider Sell Uncertainty Economic Moat Stewardship Morningstar Credit Rating Industry44.49 USD 53.00 USD 31.80 USD 82.15 USD High Narrow . Oil & Gas Midstream BBB-
Analyst Notes (continued)
master limited partnerships’ asset portfolios with attractivefee-based income. We see this ongoing midstreaminvestment as yet another example of why DCP MidstreamLLC and Anadarko are two of the most attractive generalpartners from a limited partner perspective.� �With respect to NGL markets, Front Range adds to the listof pipelines under construction by DCP Midstream, ONEOK,
and others that will alleviate pressure on the relatively thinConway market by providing direct or indirect access toMont Belvieu. However, realized NGL prices--particularlyethane--could remain soft until cracker expansions and newbuilds begin service, for the most part a few years beyondFront Range’s anticipated in-service date.�
Feb. 28, 2012 DCP Reports Solid 4Q, Acquires Rest of Southeast Texas Joint Venture for $240 Million
DCP Midstream Partners reported solid fourth-quarterresults and announced that it will acquire the 67% interestin the Southeast Texas joint venture owned by its generalpartner for $240 million. While the partnership’s 2011distributable cash flow and distribution growth were in linewith our expectations, we expect the first glimpse thepartnership will provide into its three-year business outlookwill reveal higher growth capital and faster distributiongrowth than we have modeled. The major driver behind thisis a robust set of growth projects for which the generalpartner will need financing help. Increased growthspending, an improving risk profile as DCP scales up anddiversifies its asset base, and an update for the time valueof money could boost our fair value estimate significantly.� �Fourth-quarter adjusted earnings before interest, taxes,depreciation, and amortization of $50 million increased16% year over year, or 28% from the original figurereported in the fourth quarter of 2010. Full-year 2011adjusted EBITDA climbed a similar 14% relative to 2010.We view the quarter and the whole of 2011 particularlyfavorably, considering that planned maintenance,third-party outages, and environmental remediation costsdragged on the natural gas services segment’s quarterlyand annual results. These factors caused natural gas
services’ adjusted segment EBITDA to fall 8% to $38million--the only segment to post a loss, though gasproduction was flat and natural gas liquids productionincreased 12%. As in recent years, wholesale propane andNGL logistics posted very strong growth and continued toincrease their share of the partnership’s cash flows.Wholesale propane logistics’ adjusted EBITDA climbed 44%to $12 million on higher unit margins, despite a warmerwinter. We continue to believe DCP’s model is among thebest in the propane market, though not without itsfluctuations. Finally, NGL logistics’ adjusted EBITDAclimbed to $10 million from $2 million and nearly doubledfor the year, thanks to an array of acquisitions and growthprojects. We expect this segment’s growth to accelerate asthe general partner taps the partnership for equitycontributions to help fund its growth program of $4billion-plus.� �DCP declared a distribution of $0.65 for the quarter, up1.6% from the third quarter and 5.3% from the fourthquarter of 2010. Distributable cash flow of $37 million forthe quarter and $150 million for the year provided coverageof 1.0 times and 1.1 times, respectively. We plan to updateour model and fair value estimate after digesting thepartnership’s three-year plan.�
© 2012 Morningstar. All Rights Reserved. Unless otherwise provided in a separate agreement, you may use this report only in the country in which its original distributor is based. Data as originally reported.The information contained herein is not represented or warranted to be accurate, correct, complete, or timely. This report is for information purposes only, and should not be considered a solicitation to buy or sell any security.Redistribution is prohibited without written permission. To order reprints, call +1 312-696-6100. To license the research, call +1 312-696-6869.
ß ®
Disclaimers & DisclosuresNo Morningstar employees are officers or directors of this company. Morningstar Inc. does not own more than 1% of the shares of this company. Analystscovering this company do not own its stock. The information contained herein is not represented or warranted to be accurate, correct, complete, or timely.This report is for information purposes only, and should not be considered a solicitation to buy or sell any security.

39
Morningstar Stock Data Sheet Pricing data thru May 07, 2012 Rating updated as of May 07, 2012Pricing data thru May 07, 2012 Rating updated as of May 07, 2012 Fiscal year-end: December
DCP Midstream Partners LP DPM Sales USD Mil Mkt Cap USD Mil Industry Sector1,570 2,029 Oil
& Gas Midstream Energy
TMMorningstar Rating Last Price Fair Value Uncertainty Economic Moat Stewardship GradeQQQQ 44.49 53.00 High Narrow .
per share prices in USD
2002 2003 2004 2005 2006 2007 2008 2009 2010 2011 YTD
1.0
4.0
9.0
19.0
39.0
49.0
199.0
25.2522.45
35.5424.00
51.3333.60
46.005.26
29.708.59
37.8526.76
47.9234.40
49.9343.70
Annual Price HighLowRecent Splits
Price VolatilityMonthly High/LowRel Strength to S&P 500
52 week High/Low49.93 - 34.40
10 Year High/Low51.33 - 5.26
Bear-Market Rank8 (10=worst)
Trading Volume Thousand
Stock Performance
DCP Midstream Partners LP is a midstream master limited�partnership that gathers, processes, transports, storesfractionates and markets� natural gas and natural gas liquidsin Louisiana, Texas, Oklahoma,� Colorado, Wyoming, andMichigan. It also operates wholesale propane� distributionterminals in the Northeastern United States. The� partnershipis managed by its general partner, DCP Midstream LLC, a�joint venture between Spectra Energy and ConocoPhillips.
370 17th Street Suite 2775Denver, CO 80202Phone: 1 303 633-2900Website: http://www.dcppartners.com
Growth Rates Compound AnnualGrade: D 1 Yr 3 Yr 5 Yr 10 Yr
Revenue % 23.7 6.8 14.6 16.3Operating Income % 86.0 -1.6 25.3 24.0Earnings/Share % 100.0 -19.1 -2.0 .Dividends % 3.9 2.1 17.3 .
Book Value/Share % 9.5 6.3 18.9 .Stock Total Return % 11.5 44.6 6.3 .+/- Industry -6.5 12.1 -4.9 .+/- Market 9.9 29.9 8.2 .
Profitability AnalysisGrade: C Current 5 Yr Avg Ind Mkt
Return on Equity % 13.1 10.1 11.9 22.2Return on Assets % 4.2 2.6 3.7 9.3Fixed Asset Turns 1.3 1.7 1.1 7.5Inventory Turns 20.6 27.1 25.1 16.8Revenue/Employee USD K4617.1 4197.7 . 1035.3
Gross Margin % 14.9 11.5 20.2 40.1Operating Margin % 7.4 5.1 11.2 18.9Net Margin % 4.8 2.4 5.3 11.3Free Cash Flow/Rev % 6.4 . 2.6 0.1R&D/Rev % . . . 9.4
*
*3Yr Avg data is displayed in place of 5Yr Avg
Financial PositionGrade: B 12-10 USD Mil 12-11 USD Mil
Cash 7 7Inventories 65 65Receivables 151 161
Current Assets 233 240
Fixed Assets 1169 1182Intangibles 187 256
Total Assets 1701 1904
Payables 137 188Short-Term Debt . .
Current Liabilities 211 269Long-Term Debt 648 747
Total Liabilities 1183 1275
Total Equity -28 -21
2002 2003 2004 2005 2006 2007 2008 2009 2010 2011 TTM FinancialsRevenue USD Mil553 766 510 785 796 878 1289 942 1270 1570 1570Gross Margin %. 7.8 11.2 9.7 9.0 2.2 17.7 10.2 12.4 14.9 14.9Oper Income USD Mil15 16 24 38 38 34 123 -1 63 117 117Operating Margin %2.6 2.1 4.7 4.8 4.8 3.9 9.5 -0.1 4.9 7.4 7.4
Net Income USD Mil0 0 20 38 33 -16 126 -31 31 75 75
Earnings Per Share USD0.00 . . 0.20 1.90 -1.05 3.25 -0.99 0.86 1.72 1.72Dividends USD. . . . 1.14 1.98 2.36 2.40 2.42 2.52 2.52Shares Mil. . . 18 18 20 27 31 36 44 44Book Value Per Share USD. . . 5.77 5.91 7.02 13.99 10.91 15.58 14.15 13.78
Oper Cash Flow USD Mil. . 26 76 69 65 102 108 141 204 204Cap Spending USD Mil. . -3 -8 -27 -21 -41 -165 -51 -104 -104Free Cash Flow USD Mil. . 23 68 42 44 61 -57 90 100 100
Valuation AnalysisCurrent 5 Yr Avg Ind Mkt
Price/Earnings 25.8 . 26.7 15.1Forward P/E 22.0 . . 13.8Price/Cash Flow 9.5 9.0 10.4 7.9Price/Free Cash Flow 19.4 . 52.6 17.7Dividend Yield % 5.8 . 4.7 2.0Price/Book 3.2 3.1 3.0 2.2Price/Sales 1.2 0.9 1.4 1.3PEG Ratio 2.9 . . 1.8
Total Return %. . . . 45.6 38.7 -74.4 240.1 34.7 33.6 -3.5+/- Market. . . . 32.0 35.2 -35.9 216.7 21.9 33.6 -12.4+/- Industry. . . . 16.6 26.1 -38.6 178.1 4.0 12.8 -8.1
Dividend Yield %. . . . 3.3 4.3 25.1 8.1 6.5 5.3 5.8Market Cap USD Mil. . . 429 605 1102 265 1023 1514 2109 2029
2002 2003 2004 2005 2006 2007 2008 2009 2010 2011 TTM ProfitabilityReturn on Assets %0.0 0.0 5.8 11.7 7.3 -2.0 10.9 -2.3 2.0 4.2 4.2Return on Equity %0.0 0.0 6.9 25.4 32.3 -11.6 50.5 -8.7 6.9 13.1 13.1
Net Margin %0.0 0.0 4.0 4.8 4.1 -1.8 9.8 -3.3 2.4 4.8 4.8Asset Turnover1.93 1.90 1.44 2.42 1.75 1.08 1.12 0.71 0.80 0.87 0.87Financial Leverage1.3 1.2 1.2 4.0 4.8 6.7 3.6 3.9 3.3 3.0 3.0
2002 2003 2004 2005 2006 2007 2008 2009 2010 2011 12-11 Financial HealthWorking Capital USD Mil. . 18 31 33 -1 40 7 22 -29 -29Long-Term Debt USD Mil0 0 . 210 268 630 657 613 648 747 747Total Equity USD Mil270 . 198 101 103 168 329 -32 -28 -21 -21Debt/Equity0.00 . . 2.08 2.59 3.74 1.99 1.62 1.25 1.19 0.39
2002 2003 2004 2005 2006 2007 2008 2009 2010 2011 TTM ValuationPrice/Earnings. . . 122.0 18.2 . 2.9 . 43.5 27.6 25.8P/E vs. Market. . . . . . . . . 1.6 1.7Price/Sales. . . 0.6 1.2 1.1 0.2 1.0 1.1 1.3 1.2Price/Book. . . 4.3 5.8 6.5 0.7 2.7 2.4 3.4 3.2Price/Cash Flow. . . 5.7 14.4 14.4 2.5 8.6 9.6 9.8 9.5
Quarterly ResultsRevenue
Rev Growth
Earnings Per Share
USD Mil Mar 11 Jun 11 Sep 11 Dec 11
% Mar 11 Jun 11 Sep 11 Dec 11
USD Mar 11 Jun 11 Sep 11 Dec 11
Most Recent Period 425.1 374.2 383.3 387.2Prior Year Period 403.7 277.5 239.9 348.4
Most Recent Period 5.3 34.9 59.8 11.1Prior Year Period 67.8 82.6 16.6 16.0
Most Recent Period -0.28 0.80 1.35 -0.18Prior Year Period 0.64 0.63 -0.23 -0.12
Industry Peers by Market Cap
Major Fund Holders
Mkt Cap USD Mil Rev USD Mil P/E ROE%
% of shares
DCP Midstream Partne 2029 1570 25.8 13.1Energy Transfer Part 10755 6850 43.3 4.5Regency Energy Partn 3618 1434 71.9 1.7
.
.
.
TTM data based on rolling quarterly data if available; otherwise most recent annual data shown.
© 2012 Morningstar. All Rights Reserved. Unless otherwise provided in a separate agreement, you may use this report only in the country in which its original distributor is based. Data as originally reported. The information contained herein is not represented or warranted to be accurate, correct, complete, or timely. This report is for information purposes only, and should not be considered a solicitation to buy or sell any security. Redistribution is prohibited without written permission. To order reprints, call +1 312-696-6100. To license the research, call +1 312-696-6869. ß
®

40
Morningstar’s Approach to Rating Stocks
Our Key Investing ConceptsEconomic Moat Rating��Discounted Cash Flow��Discount Rate��Fair Value��Uncertainty��Margin of Safety��Consider Buying/Consider Selling��Stewardship Grades��
TMAt Morningstar, we evaluate stocks as pieces of abusiness, not as pieces of paper. We think that purchasingshares of superior businesses at discounts to theirintrinsic value and allowing them to compound their valueover long periods of time is the surest way to createwealth in the stock market. We rate stocks 1 through 5 stars, with 5 the best and 1the worst. Our star rating is based on our analyst’sestimate of how much a company’s business is worth pershare. Our analysts arrive at this "fair value estimate" byforecasting how much excess cash--or "free cashflow"--the firm will generate in the future, and thenadjusting the total for timing and risk. Cash generatednext year is worth more than cash generated several yearsdown the road, and cash from a stable and consistentlyprofitable business is worth more than cash from acyclical or unsteady business. Stocks trading at meaningful discounts to our fair valueestimates will receive high star ratings. For high-qualitybusinesses, we require a smaller discount than formediocre ones, for a simple reason: We have moreconfidence in our cash-flow forecasts for strongcompanies, and thus in our value estimates. If a stock’smarket price is significantly above our fair value estimate,it will receive a low star rating, no matter how wonderfulwe think the business is. Even the best company is a baddeal if an investor overpays for its shares. Our fair value estimates don’t change very often, butmarket prices do. So, a stock may gain or lose stars based
just on movement in the share price. If we think a stock’sfair value is $50, and the shares decline to $40 withoutmuch change in the value of the business, the star ratingwill go up. Our estimate of what the business is worthhasn’t changed, but the shares are more attractive as aninvestment at $40 than they were at $50. Because we focus on the long-term value of businesses,rather than short-term movements in stock prices, at timeswe may appear out of step with the overall stock market.When stocks are high, relatively few will receive ourhighest rating of 5 stars. But when the market tumbles,many more will likely garner 5 stars. Although you mightexpect to see more 5-star stocks as the market rises, wefind assets more attractive when they’re cheap. We calculate our star ratings nightly after the marketsclose, and issue them the following business day, which iswhy the rating date on our reports will always be theprevious business day. We update the text of our reportsas new information becomes available, usually about onceor twice per quarter. That is why you’ll see two dates onevery Morningstar stock report. Of course, we monitormarket events and all of our stocks every business day, soour ratings always reflect our analyst’s current opinion. Economic Moat Rating The Economic Moat Rating is our assessment of a firm’sability to earn returns consistently above its cost of capitalin the future, usually by virtue of some competitiveadvantage. Competition tends to drive down such
TM
TM
Morningstar ResearchMethodology for ValuingCompanies QQQQQCompetitive Economic Company Fair Value Uncertainty
Analysis Moat Rating Valuation Estimate AssessmentTM
Analyst conducts The depth of the Analyst considers DCF model leads to An uncertaintycompany and industry firm’s competitive company financial the firm’s Fair Value assessmentresearch: advantage is rated: statements and Estimate, which establishes the� � competitive position anchors the rating margin ofManagement None to forecast future framework. safety required forinterviews Narrow cash flows. the stock rating.Conference calls Wide �Trade-show visits Assumptions areCompetitor, supplier, input into a dis-distributor, and counted cash-flowcustomer interviews model.
The current stockprice relative to fairvalue, adjustedfor uncertainty,determines therating.
QQQQQQQQQQQQQQQ
© 2012 Morningstar. All Rights Reserved. Unless otherwise provided in a separate agreement, you may use this report only in the country in which its original distributor is based. Data as originally reported.The information contained herein is not represented or warranted to be accurate, correct, complete, or timely. This report is for information purposes only, and should not be considered a solicitation to buy or sell any security.Redistribution is prohibited without written permission. To order reprints, call +1 312-696-6100. To license the research, call +1 312-696-6869.
ß ®

41
Morningstar’s Approach to Rating Stocks (continued)
economic profits, but companies that can earn them for anextended time by creating a competitive advantagepossess an Economic Moat. We see these companies assuperior investments. Discounted Cash Flow This is a method for valuing companies that involvesprojecting the amount of cash a business will generate inthe future, subtracting the amount of cash that thecompany will need to reinvest in its business, and usingthe result to calculate the worth of the firm. We use thistechnique to value nearly all of the companies we cover. Discount Rate We use this number to adjust the value of our forecastedcash flows for the risk that they may not materialize. For aprofitable company in a steady line of business, we’ll usea lower discount rate, also known as "cost of capital,"than for a firm in a cyclical business with fiercecompetition, since there’s less risk clouding the firm’sfuture. Fair Value This is the output of our discounted cash-flow valuationmodels, and is our per-share estimate of a company’sintrinsic worth. We adjust our fair values for off-balancesheet liabilities or assets that a firm might have--forexample, we deduct from a company’s fair value if it hasissued a lot of stock options or has an under-fundedpension plan. Our fair value estimate differs from a "targetprice" in two ways. First, it’s an estimate of what thebusiness is worth, whereas a price target typically reflectswhat other investors may pay for the stock. Second, it’s along-term estimate, whereas price targets generally focuson the next two to 12 months. Uncertainty To generate the Morningstar Uncertainty Rating, analystsconsider factors such as sales predictability, operatingleverage, and financial leverage. Analysts then classifytheir ability to bound the fair value estimate for the stockinto one of several uncertainty levels: Low, Medium, High,
Very High, or Extreme. The greater the level of uncertainty,the greater the discount to fair value required before astock can earn 5 stars, and the greater the premium to fairvalue before a stock earns a 1-star rating. Margin of Safety This is the discount to fair value we would require beforerecommending a stock. We think it’s always prudent tobuy stocks for less than they’re worth.The margin of safetyis like an insurance policy that protects investors from badnews or overly optimistic fair value estimates. We requirelarger margins of safety for less predictable stocks, andsmaller margins of safety for more predictable stocks. Consider Buying/Consider Selling The consider buying price is the price at which a stockwould be rated 5 stars, and thus the point at which wewould consider the stock an extremely attractivepurchase. Conversely, consider selling is the price atwhich a stock would have a 1 star rating, at which pointwe’d consider the stock overvalued, with low expectedreturns relative to its risk. Stewardship Grades Our corporate Stewardship Rating represents ourassessment of management’s stewardship of shareholdercapital, with particular emphasis on capital allocationdecisions. Analysts consider companies’ investmentstrategy and valuation, financial leverage, dividend andshare buyback policies, execution, compensation, relatedparty transactions, and accounting practices. Corporategovernance practices are only considered if they’ve had ademonstrated impact on shareholder value. Analystsassign one of three ratings: "Exemplary," "Standard," and"Poor." Analysts judge stewardship from an equity holder’sperspective. Ratings are determined on an absolute basis.Most companies will receive a Standard rating, and this isthe default rating in the absence of evidence thatmanagers have made exceptionally strong or poor capitalallocation decisions.
© 2012 Morningstar. All Rights Reserved. Unless otherwise provided in a separate agreement, you may use this report only in the country in which its original distributor is based. Data as originally reported.The information contained herein is not represented or warranted to be accurate, correct, complete, or timely. This report is for information purposes only, and should not be considered a solicitation to buy or sell any security.Redistribution is prohibited without written permission. To order reprints, call +1 312-696-6100. To license the research, call +1 312-696-6869.
ß ®

42
?
TC Pipelines LP TCP [NYSE] | QQQQTM
Last Price Fair Value Consider Buy Consider Sell Uncertainty Economic Moat Stewardship Morningstar Credit Rating Industry41.52 USD 50.00 USD 40.00 USD 62.50 USD Low Narrow . Oil & Gas Midstream .
Currency amounts expressed with "$"are in U.S. dollars (USD) unlessotherwise denoted.
TC Pipelines’ 1Q Distribution Coverage Solid Despite WeakQuarter for Great Lakes
by Avi FeinbergStock AnalystAnalysts covering this company do notown its stock.
Pricing data through May 07, 2012.Rating updated as ofMay 07, 2012.
08 09 10 11 12
22.0
32.0
42.0
52.0Stock Price
Analyst Note Apr. 25, 2012 TC Pipelines reported respectable first-quarter resultsconsidering the difficult market conditions that hamperedvolumes and cash flows on Great Lakes. Overall, thepartnership reported $51 million of distributable cashflow, which exceeded the $49 million reported in theprior-year quarter by 4%, but trailed our projection of $56million. We consider this a respectable quarter in light ofthe very challenging operating conditions, which includedwarm winter weather, high levels of storage, and lownatural gas prices and spreads. Despite these conditions,TC grew distributable cash flow thanks to a combined $9million of distributable cash flow from GTN and Bison,acquired in May 2011. This more than made up for a $6million decrease in distributable cash flow at Great Lakes,while cash flows from Northern Border and other pipelineswere essentially flat. The partnership maintained itsdistribution of $0.77 per unit, which is 2.7% higher thanthe payout from the prior-year quarter. Distributioncoverage above 1.2 times illustrates the stability of thepartnership’s portfolio and the conservatism ofmanagement, two traits that differentiate the partnershipin our view. Looking at the performance of TC’s asset baseoperationally, Great Lakes is again the only sore spot inour view. Great Lakes volumes of 2.00 billion cubic feetper day were off 30% from a strong 2011 quarter, but didimprove 12% from the fourth quarter. During the firstquarter, about 440 million cubic feet per day went unsold.At this point, Great Lakes is fully contracted for thesummer season through October 31, 2012, but only 22%contracted for November 1 onward, both atless-than-maximum rates. We’ll look for more detail onthese rates, but we continue to expect conditions toimprove entering 2013 with more normal weather, aresolution to the Mainline toll hearings, and an improvingnatural gas supply-demand balance. As for TC’s othermajor pipeline, Northern Border again operated at
near-maximum capacity with throughput of 2.92 Bcf/d, up5% year over year and 3% sequentially. Further, despiteweak basis differentials, Northern Border negotiatedcontract extensions for all capacity expiring in 2012, withmost of the terms for three years or longer. NorthernBorder is essentially fully contracted through March2013. Thesis Nov. 15, 2011 Income investors seeking relatively stable distributionpayments with some growth potential may want toconsider TC Pipelines LP, a pure-play natural gas pipelinemaster limited partnership (MLP). We think TC’sconservative approach and parent company, industryheavyweight TransCanada TRP, will support modestdistribution growth as TC rides the coattails ofTransCanada’s multi-billion dollar expansion plans in thecoming years. � TC’s assets comprise a 50% stake in Northern Border, a46% stake in Great Lakes, 25% stakes in GTN and Bison,and full ownership of the Tuscarora and North Bajapipelines, which have an aggregate capacity of 8.9 billioncubic feet per day. By focusing on pipelines and avoidingmore-cyclical midstream operations, such as gatheringand processing, TC maximizes cash-flow stability, whichbodes well for steady distribution payments. Some of TC’spipeline services are structured under firm contracts withcapacity reservation charges that customers must payregardless of actual volume usage. However, TC’s twolargest legacy assets--Great Lakes and NorthernBorder--rely on short-term contracts that are more subjectto market conditions. For instance, entering the winter of2011-12, Great Lakes had nearly 700 million cubic feet perday of uncontracted capacity, as a result of upstreamuncertainty regarding the rates on TransCanada’s Mainline(which feeds into Great Lakes). This makes cash flows lesspredictable than for newer pipelines with longer contractterms. � Also, TC’s basin exposure is somewhat concentrated. Evenafter adding exposure to the Rockies with the purchase of

43
TC Pipelines LP TCP [NYSE] | QQQQTM
Last Price Fair Value Consider Buy Consider Sell Uncertainty Economic Moat Stewardship Morningstar Credit Rating Industry41.52 USD 50.00 USD 40.00 USD 62.50 USD Low Narrow . Oil & Gas Midstream .
Close Competitors Currency(Mil) Market Cap TTM Sales Oper Income Net Income
TC Pipelines LP
Kinder Morgan Energy Partners LP
Williams Partners LP
Enbridge Energy Partners LP
USD
USD
USD
USD
2,220 222 183 151
19,069 8,142 1,859 -90
17,665 6,835 1,682 1,088
7,077 8,640 987 496
Morningstar data as of May 07, 2012.
Bison, most of TC’s pipeline volumes come from theWestern Canadian Sedimentary Basin, where productionhas been declining in recent years. On the bright side,development of the Horn River and Montney Shales inBritish Columbia bodes well for future volumes out ofCanada. However, this gas must compete with growingunconventional gas production in the lower 48, and aparadigm of increasingly regionalized supply could reducedemand for TC’s capacity down the road. Despite somevolume risk, we think TC’s favorable contracts, regulatorybarriers to entry, and historically high coverage ratioscreate a compelling case for the stability of itsdistributions. � As owner of TC’s general partner and about one third ofTC’s common units, TransCanada effectively controls TC’sdestiny. TransCanada manages and operates all pipelineson behalf of the MLP, ships major volume on TC’spipelines, and owns the remaining portions of GreatLakes, GTN and Bison. As a result, TransCanada isintimately involved in choosing internal growth projectsand acquisitions, which historically have come in the formof drop-downs from TransCanada’s massive pipelinenetwork. While pervasive, TransCanada’s control is typicalof most general partner/limited partner relationships andis not a negative factor in our view. We think TransCanadaintends to continue using TC as a tax-advantaged incomeplay and funding vehicle for the long haul, especiallyconsidering the 2009 incentive distribution rights (IDR)reset in exchange for common units. This transactionlowered TC’s cash cost of equity by reducing the generalpartner’s take, thus paving the way for more sustainable
distribution growth over the long term. � Perhaps ourbiggest question with TC is how quickly, and from where,future growth will come. Organic expansions such as theYuma lateral offer attractive rates of return, but we’re notsure TC’s relatively small asset base can support organicgrowth that will move the needle on distribution growth atthis stage. Drop-downs from TransCanada are an obviouspotential growth driver, and the pace of future drop-downswill depend on several factors: TransCanada’s willingnessto part with mature, MLP-appropriate assets; how muchcash TransCanada needs to raise to support its owngrowth plans; capital markets conditions; etc. Overall, weexpect TransCanada to remain a supportive sponsor and tohelp promote growth at TC, particularly with TransCanadainvesting heavily in an ongoing CAD 11 billion capitalprogram. However, we’d add that growth spending couldremain lumpy as tends to be the case withacquisition-driven models. Valuation, Growth and Profitability After weighing the positive impact of the time value ofmoney against the offsetting impact of more conservativethroughput assumptions on Great Lakes, we are modestlyincreasing our fair value estimate to $50 per unit from$49. Our fair value estimate equally considers our high-,base-, and low-case scenario fair value estimates of $56,$49, and $46 per unit, respectively. Given uncertaintyaround the tolls of the Canadian Mainline, which feedsinto Great Lakes, we reduced our 2012 throughputassumption about 10% to 2.1 billion cubic feet per day.However, we assume that this improves gradually withtime as the Mainline toll situation is finalized and BCshale volumes continue to grow. We project averageannual capital expenditures of $350 million towardacquisitions and related organic growth spending, whichdrives annual distributable cash flow growth of 12% overa five-year period. Factoring in future unit increases, weanticipate 5% annual distribution growth over the same
© 2012 Morningstar. All Rights Reserved. Unless otherwise provided in a separate agreement, you may use this report only in the country in which its original distributor is based. Data as originally reported.The information contained herein is not represented or warranted to be accurate, correct, complete, or timely. This report is for information purposes only, and should not be considered a solicitation to buy or sell any security.Redistribution is prohibited without written permission. To order reprints, call +1 312-696-6100. To license the research, call +1 312-696-6869.
ß ®

44
TC Pipelines LP TCP [NYSE] | QQQQTM
Last Price Fair Value Consider Buy Consider Sell Uncertainty Economic Moat Stewardship Morningstar Credit Rating Industry41.52 USD 50.00 USD 40.00 USD 62.50 USD Low Narrow . Oil & Gas Midstream .
period. Going forward, we expect that capitalexpenditures will remain lumpy. A large drop-down or twoat an attractive price could add further valuationupside--particularly if TC uses up spare debt capacity--butthis hinges on TransCanada’s growth and capitalallocation decisions. To discount future cash flows, weassume a 10% cost of equity and an 8.8% weightedaverage cost of capital. At our fair value estimate, TC’sunits would yield 6.4% based on our 2012 distributionforecast of $3.18 per unit. Risk Cost of capital remains a top risk for any MLP, thoughgeneral partner and industry titan TransCanada mitigatesthis concern for TC. With stakes in only four pipelines, TCfaces operational risks--leaks, spills, fires, or supplyinterruptions--that could have a large impact. Regulatoryor tax law changes could crimp the business. Pipelinerates could be cut in the future, and contract repricingsadd an element of uncertainty. Declining Canadian naturalgas production and competition with other supply sourcesare long-term risks.�Finally, higher interest rates couldmake TC’s units less attractive to investors. Bulls Say
By resetting incentive distribution rights and cappingthe GP share at 25%, TCLP reduced its cost of capitaland made it easier to increase distributions to limitedpartners consistently. Most pipelines have moats. Without a demonstratedeconomic need, new pipelines are not approved. Thisfact, along with large up-front building costs, createssizable barriers to entry and switching costs. TC has focused on the attractive pipeline businesswhile shying away from less-attractive industries suchas gathering and processing, power production, andenergy trading. This makes TC one of a few pure-play
natural gas pipeline operators. The Bison and GTN partial drop-downs set the stage forfuture drop-downs of the remaining interests, whichwould drive meaningful growth for TC. TC pays essentially no corporate income taxes, and thepartnership pays a high and tax-advantaged yield.
Bears Say
Both Northern Border’s and Great Lakes’ contracts haveshort durations, exposing TC to potential revenuedeclines as new pipelines bring competing gas into thepipelines’ traditional markets. The MLP model requires access to capital markets tofund growth projects, which is never guaranteed,though having a large sponsor like TransCanadahelps. Northern Border and Great Lakes are fed by natural gasproduction volume from western Canada, which hasbeen declining for years. TC depends on the performance of relatively fewpipelines; any sort of operational or financial problem atany of its core pipelines would have an outsize impacton TC’s cash flows. Master limited partnerships introduce tax-filingcomplexity for investors, who must file K-1 forms ratherthan traditional 1099s.
Financial Overview Financial Health: TC has historically maintained debtlevels well below the 50% of total capitalization commonfor MLPs. We suspect that the partnership will continue tosport a relatively strong balance sheet, leaving its optionsopen for drop-downs or third-party acquisitions. Afterdoubling its revolver capacity to $500 million andextending its maturity to 2016 in late 2011, thepartnership faces no significant debt maturities for thenext five years.
© 2012 Morningstar. All Rights Reserved. Unless otherwise provided in a separate agreement, you may use this report only in the country in which its original distributor is based. Data as originally reported.The information contained herein is not represented or warranted to be accurate, correct, complete, or timely. This report is for information purposes only, and should not be considered a solicitation to buy or sell any security.Redistribution is prohibited without written permission. To order reprints, call +1 312-696-6100. To license the research, call +1 312-696-6869.
ß ®

45
TC Pipelines LP TCP [NYSE] | QQQQTM
Last Price Fair Value Consider Buy Consider Sell Uncertainty Economic Moat Stewardship Morningstar Credit Rating Industry41.52 USD 50.00 USD 40.00 USD 62.50 USD Low Narrow . Oil & Gas Midstream .
Company Overview Profile: TC Pipelines is a master limited partnership thatholds some of the U.S. natural gas pipeline assets ofTransCanada, the largest Canadian pipeline company.TransCanada is the general partner of the partnership andalso owns about one third of TC’s common units. TC’spipelines, for the most part in the northwest U.S.,primarily transport Canadian gas into the United States. Management: TC’s general partner is an entity whollyowned by TransCanada, which also owns about one thirdof the firm’s common units outstanding. Greg Lohnes tookover as chairman of the general partner in March 2010,but has served as a director since 2007. Lohnes alsoserves as president of Natural Gas Pipelines atTransCanada and has held prior positions including CFO ofTransCanada and President/CEO of Great Lakes Pipelines.Steve Becker took over as president of the general partnerin 2010, bringing 30 years of industry experience includinga variety of roles at TransCanada since 1990. The currentboard comprises seven directors, four of which areemployed by TransCanada--a mix we’d like to see becomemore independent. However, we think the managementteam has allocated capital prudently on the whole andexpect more of the same, given TransCanada’s trove ofassets that could be dropped down.
© 2012 Morningstar. All Rights Reserved. Unless otherwise provided in a separate agreement, you may use this report only in the country in which its original distributor is based. Data as originally reported.The information contained herein is not represented or warranted to be accurate, correct, complete, or timely. This report is for information purposes only, and should not be considered a solicitation to buy or sell any security.Redistribution is prohibited without written permission. To order reprints, call +1 312-696-6100. To license the research, call +1 312-696-6869.
ß ®

46
TC Pipelines LP TCP [NYSE] | QQQQTM
Last Price Fair Value Consider Buy Consider Sell Uncertainty Economic Moat Stewardship Morningstar Credit Rating Industry41.52 USD 50.00 USD 40.00 USD 62.50 USD Low Narrow . Oil & Gas Midstream .
Analyst Notes
Apr. 25, 2012 TC Pipelines’ 1Q Distribution Coverage Solid Despite Weak Quarter for Great Lakes
TC Pipelines reported respectable first-quarter resultsconsidering the difficult market conditions that hamperedvolumes and cash flows on Great Lakes. Overall, thepartnership reported $51 million of distributable cash flow,which exceeded the $49 million reported in the prior-yearquarter by 4%, but trailed our projection of $56 million. Weconsider this a respectable quarter in light of the verychallenging operating conditions, which included warmwinter weather, high levels of storage, and low natural gasprices and spreads. Despite these conditions, TC grewdistributable cash flow thanks to a combined $9 million ofdistributable cash flow from GTN and Bison, acquired inMay 2011. This more than made up for a $6 milliondecrease in distributable cash flow at Great Lakes, whilecash flows from Northern Border and other pipelines wereessentially flat. The partnership maintained its distributionof $0.77 per unit, which is 2.7% higher than the payoutfrom the prior-year quarter. Distribution coverage above 1.2times illustrates the stability of the partnership’s portfolioand the conservatism of management, two traits thatdifferentiate the partnership in our view.� �Looking at the performance of TC’s asset baseoperationally, Great Lakes is again the only sore spot in our
view. Great Lakes volumes of 2.00 billion cubic feet per daywere off 30% from a strong 2011 quarter, but did improve12% from the fourth quarter. During the first quarter, about440 million cubic feet per day went unsold. At this point,Great Lakes is fully contracted for the summer seasonthrough October 31, 2012, but only 22% contracted forNovember 1 onward, both at less-than-maximum rates.We’ll look for more detail on these rates, but we continueto expect conditions to improve entering 2013 with morenormal weather, a resolution to the Mainline toll hearings,and an improving natural gas supply-demand balance. Asfor TC’s other major pipeline, Northern Border againoperated at near-maximum capacity with throughput of2.92 Bcf/d, up 5% year over year and 3% sequentially.Further, despite weak basis differentials, Northern Bordernegotiated contract extensions for all capacity expiring in2012, with most of the terms for three years or longer.Northern Border is essentially fully contracted throughMarch 2013.�
Feb. 17, 2012 TC Pipelines’ 4Q Solid With Strong Volumes on Northern Border, Contributions From Acquisitions
TC Pipelines reported solid fourth-quarter results, evenafter adjusting for a few one-off items that boostedquarterly cash flows. The partnership reported distributablecash flow of $84 million, which included a $20 milliondistribution from GTN based on its cash balance at the timeof acquisition. Adjusting for this one-time item, DCF of $64million was slightly below our projection of $66 million, butstill a strong showing, in our view. We note that this figureand our projection include cash distributions from GTN andBison for both the second and third quarters, as the initialpostacquisition cash distribution was held back because of
operational issues. Adjusting for the extra two months ofcash flows on Bison and GTN, we estimate a normalizedDCF figure of about $57 million for the quarter. TCmaintained its distribution of $0.77 per unit, which is 2.7%higher than the distribution paid in the prior-year quarter.Actual DCF of $84 million provided coverage of 2.00 times,and our normalized DCF estimate of $57 million would havestill provided solid coverage of 1.35 times.� � Looking at throughput across TC’s pipelines, the quarterwas a mixed bag. Northern Border proved the bright spot,
© 2012 Morningstar. All Rights Reserved. Unless otherwise provided in a separate agreement, you may use this report only in the country in which its original distributor is based. Data as originally reported.The information contained herein is not represented or warranted to be accurate, correct, complete, or timely. This report is for information purposes only, and should not be considered a solicitation to buy or sell any security.Redistribution is prohibited without written permission. To order reprints, call +1 312-696-6100. To license the research, call +1 312-696-6869.
ß ®

47
TC Pipelines LP TCP [NYSE] | QQQQTM
Last Price Fair Value Consider Buy Consider Sell Uncertainty Economic Moat Stewardship Morningstar Credit Rating Industry41.52 USD 50.00 USD 40.00 USD 62.50 USD Low Narrow . Oil & Gas Midstream .
Analyst Notes (continued)
with 2.84 billion cubic feet per day of throughput, up 7%from the 2010 quarter and essentially the maximum thepipeline can support. We note that the Princeton lateralbegan service in November. Also, Northern Borderrecontracted substantially all of its capacity through March2013. However, volumes on Great Lakes fell 25% year overyear to 1.76 Bcf/d because of warm weather and lingeringuncertainty around TransCanada’s Mainline toll, amongother factors. We expect similar weakness to persistthroughout the year, though we don’t anticipate muchfurther downside as Great Lakes has contracted 75% of its
capacity through October 2012. Next, GTN’s throughputdecreased 12% to 1.96 Bcf/d, as anticipated bymanagement, due to competition from Ruby. However,much of GTN’s capacity is subscribed under long-termcapacity reservation charges. Finally, Tuscarora’s and GTN’srate settlements took effect Jan. 1, which could result inmodestly lower revenue on the two pipelines of up to about$5 million-$6 million annually on each pipeline. We don’texpect this to materially affect the partnership’s ability tosustain and increase distributions.�
© 2012 Morningstar. All Rights Reserved. Unless otherwise provided in a separate agreement, you may use this report only in the country in which its original distributor is based. Data as originally reported.The information contained herein is not represented or warranted to be accurate, correct, complete, or timely. This report is for information purposes only, and should not be considered a solicitation to buy or sell any security.Redistribution is prohibited without written permission. To order reprints, call +1 312-696-6100. To license the research, call +1 312-696-6869.
ß ®
Disclaimers & DisclosuresNo Morningstar employees are officers or directors of this company. Morningstar Inc. does not own more than 1% of the shares of this company. Analystscovering this company do not own its stock. The information contained herein is not represented or warranted to be accurate, correct, complete, or timely.This report is for information purposes only, and should not be considered a solicitation to buy or sell any security.

48
Morningstar Stock Data Sheet Pricing data thru May 07, 2012 Rating updated as of May 07, 2012Pricing data thru May 07, 2012 Rating updated as of May 07, 2012 Fiscal year-end: December
TC Pipelines LP TCP Sales USD Mil Mkt Cap USD Mil Industry Sector222 2,220 Oil
& Gas Midstream Energy
TMMorningstar Rating Last Price Fair Value Uncertainty Economic Moat Stewardship GradeQQQQ 41.52 50.00 Low Narrow .
per share prices in USD
2002 2003 2004 2005 2006 2007 2008 2009 2010 2011 YTD
3.0
6.0
19.0
39.0
30.080.0
27.8821.30
33.7024.74
39.1828.47
41.2830.11
38.1329.85
43.2032.71
37.6518.11
41.5422.75
52.5133.51
54.9539.24
47.7541.00
Annual Price HighLowRecent Splits
Price VolatilityMonthly High/LowRel Strength to S&P 500
52 week High/Low49.04 - 39.24
10 Year High/Low54.95 - 18.11
Bear-Market Rank0 (10=worst)
Trading Volume Thousand
Stock Performance
TC Pipelines is a master limited partnership that holds someof the U.S. natural gas pipeline assets of TransCanada, thelargest Canadian pipeline company. TransCanada is thegeneral partner of the partnership and also owns about onethird of TC’s common units. TC’s pipelines, for the most partin the northwest U.S., primarily transport Canadian gas intothe United States.
13710 FNB Parkway Omaha, NE 68154-5200Phone: 1 877 290-2772Website: http://www.tcpipelineslp.com
Growth Rates Compound AnnualGrade: C 1 Yr 3 Yr 5 Yr 10 Yr
Revenue % 14.8 13.2 . .Operating Income % 13.9 10.4 . .Earnings/Share % 3.8 3.2 4.8 2.3Dividends % 3.4 3.1 5.5 4.5Book Value/Share % 3.5 -0.3 7.5 3.2Stock Total Return % -5.9 18.4 5.8 10.8+/- Industry -23.9 -14.1 -5.4 -6.2+/- Market -7.5 3.7 7.7 8.2
Profitability AnalysisGrade: C Current 5 Yr Avg Ind Mkt
Return on Equity % 12.4 11.9 11.9 22.2Return on Assets % 8.2 7.3 3.7 9.3Fixed Asset Turns 0.7 0.7 1.1 7.5Inventory Turns 17.3 . 25.1 16.8Revenue/Employee USD K . . . 1035.3
Gross Margin % 93.0 . 20.2 40.1Operating Margin % 82.6 76.3 11.2 18.9Net Margin % 68.2 116.3 5.3 11.3Free Cash Flow/Rev % . 120.1 2.6 0.1R&D/Rev % . . . 9.4
*
*3Yr Avg data is displayed in place of 5Yr Avg
Financial PositionGrade: A 12-11 USD Mil 03-12 USD Mil
Cash 30 5Inventories 1 1Receivables 8 7
Current Assets 38 13
Fixed Assets 299 295Intangibles 130 130
Total Assets 2082 2050
Payables . .Short-Term Debt 3 3
Current Liabilities 9 15Long-Term Debt 739 704
Total Liabilities 749 720
Total Equity -1 -1
2002 2003 2004 2005 2006 2007 2008 2009 2010 2011 TTM FinancialsRevenue USD Mil. . . . . 27 154 167 195 224 222Gross Margin %. . . . . . 93.8 93.4 93.3 93.5 93.0Oper Income USD Mil-2 -2 -2 -2 -4 12 138 135 163 185 183Operating Margin %. . . . . 44.9 89.4 80.9 83.4 82.8 82.6
Net Income USD Mil46 48 55 50 45 89 96 91 134 154 151
Earnings Per Share USD2.50 2.63 2.99 2.70 2.39 2.51 2.75 2.34 2.91 3.02 2.86Dividends USD2.05 2.15 2.25 2.30 2.33 2.57 2.78 2.87 2.94 3.04 3.06Shares Mil18 18 18 18 18 35 35 39 46 51 53Book Value Per Share USD17.53 17.03 16.85 17.23 17.37 25.82 25.12 23.89 24.08 24.93 24.87
Oper Cash Flow USD Mil52 50 55 50 46 99 114 123 156 169 174Cap Spending USD Mil. . . . . -14 -7 -2 -9 -4 .Free Cash Flow USD Mil. . . . . 84 107 122 147 166 .
Valuation AnalysisCurrent 5 Yr Avg Ind Mkt
Price/Earnings 14.2 14.4 26.7 15.1Forward P/E . . . 13.8Price/Cash Flow 12.6 12.1 10.4 7.9Price/Free Cash Flow . 13.0 52.6 17.7Dividend Yield % 7.4 . 4.7 2.0Price/Book 1.7 1.6 3.0 2.2Price/Sales 9.9 16.6 1.4 1.3PEG Ratio . . . 1.8
Total Return %10.2 33.4 22.8 -8.2 18.3 7.7 -28.1 70.8 49.1 -2.9 -9.2+/- Market33.6 7.0 13.8 -11.2 4.7 4.2 10.4 47.4 36.3 -2.9 -18.1+/- Industry5.2 -11.3 5.5 -21.4 -10.7 -4.9 7.7 8.8 18.4 -23.7 -13.8
Dividend Yield %7.9 6.6 6.0 7.1 6.5 7.1 11.9 7.8 5.7 6.4 7.4Market Cap USD Mil407 540 661 567 630 1262 810 1702 2402 2536 2220
2002 2003 2004 2005 2006 2007 2008 2009 2010 2011 TTM ProfitabilityReturn on Assets %15.8 16.7 17.8 15.5 8.2 7.8 6.5 5.8 8.1 8.3 8.2Return on Equity %16.8 17.3 19.1 16.8 14.8 14.8 10.8 9.2 12.1 12.6 12.4
Net Margin %. . . . . 327.2 62.2 54.2 68.9 68.9 68.2Asset Turnover. . . . . 0.02 0.10 0.11 0.12 0.12 0.12Financial Leverage1.0 1.0 1.1 1.1 2.6 1.7 1.6 1.5 1.5 1.6 1.5
2002 2003 2004 2005 2006 2007 2008 2009 2010 2011 03-12 Financial HealthWorking Capital USD Mil6 1 -5 -12 -3 -3 -9 -60 -494 29 -2Long-Term Debt USD Mil12 . 30 . 463 569 532 488 30 739 704Total Equity USD Mil274 282 295 302 304 900 -35 -26 -15 -1 -1Debt/Equity0.04 . 0.10 . 1.52 0.63 0.61 0.44 0.03 0.55 0.53
2002 2003 2004 2005 2006 2007 2008 2009 2010 2011 TTM ValuationPrice/Earnings10.4 12.4 12.6 12.0 15.1 14.4 8.4 15.8 17.9 15.7 14.2P/E vs. Market. . . . . . . . . 0.9 0.9Price/Sales. . . . . 46.5 5.3 8.5 12.3 10.4 9.9Price/Book1.5 1.9 2.2 1.9 2.1 1.4 0.9 1.5 2.2 1.9 1.7Price/Cash Flow9.1 11.5 12.0 11.3 13.7 12.8 7.1 11.6 15.4 13.8 12.6
Quarterly ResultsRevenue
Rev Growth
Earnings Per Share
USD Mil Jun 11 Sep 11 Dec 11 Mar 12
% Jun 11 Sep 11 Dec 11 Mar 12
USD Jun 11 Sep 11 Dec 11 Mar 12
Most Recent Period 17.6 17.6 171.4 54.0Prior Year Period 42.3 53.0 51.5 55.9
Most Recent Period -58.4 -66.8 232.8 -3.4Prior Year Period 415.9 202.9 -55.7 15.7
Most Recent Period 0.69 0.75 0.65 0.71Prior Year Period 0.59 0.82 0.79 0.90
Industry Peers by Market Cap
Major Fund Holders
Mkt Cap USD Mil Rev USD Mil P/E ROE%
% of shares
TC Pipelines LP 2220 222 14.2 12.4Kinder Morgan Energy 19069 8142 18.6 -1.3Williams Partners LP 17665 6835 11.5 19.1
.
.
.
TTM data based on rolling quarterly data if available; otherwise most recent annual data shown.
© 2012 Morningstar. All Rights Reserved. Unless otherwise provided in a separate agreement, you may use this report only in the country in which its original distributor is based. Data as originally reported. The information contained herein is not represented or warranted to be accurate, correct, complete, or timely. This report is for information purposes only, and should not be considered a solicitation to buy or sell any security. Redistribution is prohibited without written permission. To order reprints, call +1 312-696-6100. To license the research, call +1 312-696-6869. ß
®

49
Morningstar’s Approach to Rating Stocks
Our Key Investing ConceptsEconomic Moat Rating��Discounted Cash Flow��Discount Rate��Fair Value��Uncertainty��Margin of Safety��Consider Buying/Consider Selling��Stewardship Grades��
TMAt Morningstar, we evaluate stocks as pieces of abusiness, not as pieces of paper. We think that purchasingshares of superior businesses at discounts to theirintrinsic value and allowing them to compound their valueover long periods of time is the surest way to createwealth in the stock market. We rate stocks 1 through 5 stars, with 5 the best and 1the worst. Our star rating is based on our analyst’sestimate of how much a company’s business is worth pershare. Our analysts arrive at this "fair value estimate" byforecasting how much excess cash--or "free cashflow"--the firm will generate in the future, and thenadjusting the total for timing and risk. Cash generatednext year is worth more than cash generated several yearsdown the road, and cash from a stable and consistentlyprofitable business is worth more than cash from acyclical or unsteady business. Stocks trading at meaningful discounts to our fair valueestimates will receive high star ratings. For high-qualitybusinesses, we require a smaller discount than formediocre ones, for a simple reason: We have moreconfidence in our cash-flow forecasts for strongcompanies, and thus in our value estimates. If a stock’smarket price is significantly above our fair value estimate,it will receive a low star rating, no matter how wonderfulwe think the business is. Even the best company is a baddeal if an investor overpays for its shares. Our fair value estimates don’t change very often, butmarket prices do. So, a stock may gain or lose stars based
just on movement in the share price. If we think a stock’sfair value is $50, and the shares decline to $40 withoutmuch change in the value of the business, the star ratingwill go up. Our estimate of what the business is worthhasn’t changed, but the shares are more attractive as aninvestment at $40 than they were at $50. Because we focus on the long-term value of businesses,rather than short-term movements in stock prices, at timeswe may appear out of step with the overall stock market.When stocks are high, relatively few will receive ourhighest rating of 5 stars. But when the market tumbles,many more will likely garner 5 stars. Although you mightexpect to see more 5-star stocks as the market rises, wefind assets more attractive when they’re cheap. We calculate our star ratings nightly after the marketsclose, and issue them the following business day, which iswhy the rating date on our reports will always be theprevious business day. We update the text of our reportsas new information becomes available, usually about onceor twice per quarter. That is why you’ll see two dates onevery Morningstar stock report. Of course, we monitormarket events and all of our stocks every business day, soour ratings always reflect our analyst’s current opinion. Economic Moat Rating The Economic Moat Rating is our assessment of a firm’sability to earn returns consistently above its cost of capitalin the future, usually by virtue of some competitiveadvantage. Competition tends to drive down such
TM
TM
Morningstar ResearchMethodology for ValuingCompanies QQQQQCompetitive Economic Company Fair Value Uncertainty
Analysis Moat Rating Valuation Estimate AssessmentTM
Analyst conducts The depth of the Analyst considers DCF model leads to An uncertaintycompany and industry firm’s competitive company financial the firm’s Fair Value assessmentresearch: advantage is rated: statements and Estimate, which establishes the� � competitive position anchors the rating margin ofManagement None to forecast future framework. safety required forinterviews Narrow cash flows. the stock rating.Conference calls Wide �Trade-show visits Assumptions areCompetitor, supplier, input into a dis-distributor, and counted cash-flowcustomer interviews model.
The current stockprice relative to fairvalue, adjustedfor uncertainty,determines therating.
QQQQQQQQQQQQQQQ
© 2012 Morningstar. All Rights Reserved. Unless otherwise provided in a separate agreement, you may use this report only in the country in which its original distributor is based. Data as originally reported.The information contained herein is not represented or warranted to be accurate, correct, complete, or timely. This report is for information purposes only, and should not be considered a solicitation to buy or sell any security.Redistribution is prohibited without written permission. To order reprints, call +1 312-696-6100. To license the research, call +1 312-696-6869.
ß ®

50
Morningstar’s Approach to Rating Stocks (continued)
economic profits, but companies that can earn them for anextended time by creating a competitive advantagepossess an Economic Moat. We see these companies assuperior investments. Discounted Cash Flow This is a method for valuing companies that involvesprojecting the amount of cash a business will generate inthe future, subtracting the amount of cash that thecompany will need to reinvest in its business, and usingthe result to calculate the worth of the firm. We use thistechnique to value nearly all of the companies we cover. Discount Rate We use this number to adjust the value of our forecastedcash flows for the risk that they may not materialize. For aprofitable company in a steady line of business, we’ll usea lower discount rate, also known as "cost of capital,"than for a firm in a cyclical business with fiercecompetition, since there’s less risk clouding the firm’sfuture. Fair Value This is the output of our discounted cash-flow valuationmodels, and is our per-share estimate of a company’sintrinsic worth. We adjust our fair values for off-balancesheet liabilities or assets that a firm might have--forexample, we deduct from a company’s fair value if it hasissued a lot of stock options or has an under-fundedpension plan. Our fair value estimate differs from a "targetprice" in two ways. First, it’s an estimate of what thebusiness is worth, whereas a price target typically reflectswhat other investors may pay for the stock. Second, it’s along-term estimate, whereas price targets generally focuson the next two to 12 months. Uncertainty To generate the Morningstar Uncertainty Rating, analystsconsider factors such as sales predictability, operatingleverage, and financial leverage. Analysts then classifytheir ability to bound the fair value estimate for the stockinto one of several uncertainty levels: Low, Medium, High,
Very High, or Extreme. The greater the level of uncertainty,the greater the discount to fair value required before astock can earn 5 stars, and the greater the premium to fairvalue before a stock earns a 1-star rating. Margin of Safety This is the discount to fair value we would require beforerecommending a stock. We think it’s always prudent tobuy stocks for less than they’re worth.The margin of safetyis like an insurance policy that protects investors from badnews or overly optimistic fair value estimates. We requirelarger margins of safety for less predictable stocks, andsmaller margins of safety for more predictable stocks. Consider Buying/Consider Selling The consider buying price is the price at which a stockwould be rated 5 stars, and thus the point at which wewould consider the stock an extremely attractivepurchase. Conversely, consider selling is the price atwhich a stock would have a 1 star rating, at which pointwe’d consider the stock overvalued, with low expectedreturns relative to its risk. Stewardship Grades Our corporate Stewardship Rating represents ourassessment of management’s stewardship of shareholdercapital, with particular emphasis on capital allocationdecisions. Analysts consider companies’ investmentstrategy and valuation, financial leverage, dividend andshare buyback policies, execution, compensation, relatedparty transactions, and accounting practices. Corporategovernance practices are only considered if they’ve had ademonstrated impact on shareholder value. Analystsassign one of three ratings: "Exemplary," "Standard," and"Poor." Analysts judge stewardship from an equity holder’sperspective. Ratings are determined on an absolute basis.Most companies will receive a Standard rating, and this isthe default rating in the absence of evidence thatmanagers have made exceptionally strong or poor capitalallocation decisions.
© 2012 Morningstar. All Rights Reserved. Unless otherwise provided in a separate agreement, you may use this report only in the country in which its original distributor is based. Data as originally reported.The information contained herein is not represented or warranted to be accurate, correct, complete, or timely. This report is for information purposes only, and should not be considered a solicitation to buy or sell any security.Redistribution is prohibited without written permission. To order reprints, call +1 312-696-6100. To license the research, call +1 312-696-6869.
ß ®

51
?
Yamana Gold, Inc. AUY [NYSE] | QQQQTM
Last Price Fair Value Consider Buy Consider Sell Uncertainty Economic Moat Stewardship Morningstar Credit Rating Industry13.84 USD 18.00 USD 10.80 USD 27.90 USD High None . Gold .
Currency amounts expressed with "$"are in U.S. dollars (USD) unlessotherwise denoted.
Yamana Treads Water in First Quarter, but Projects Remain onSchedule
by Joung ParkEquity AnalystAnalysts covering this company do notown its stock.
Pricing data through May 07, 2012.Rating updated as ofMay 07, 2012.
08 09 10 11 12
4.0
5.0
6.0
8.0
14.0
Stock Price
Analyst Note May 02, 2012 Yamana Gold reported modest results during the firstquarter, with gold production growth muted mostly due tomajor maintenance work at Chapada. Yamana achievedtotal production of 279,000 gold-equivalent ounces, orGEOs, during the quarter, which marks just a 4%year-over-year increase despite the start of production atthe firm’s new Mercedes gold-silver mine in February ofthis year. However, we think that Yamana’s goldproduction growth will pick up during the rest of the yearand allow the firm to comfortably exceed the low end ofits 2012 production guidance of 1.2 million GEOs. Theincreased production should also help on the cost side as2012 progresses, in our opinion. Meanwhile, Yamanacontinued to make solid progress on its slate ofdevelopment projects during the quarter, and we think thefirm’s aggressive strategy of bringing four new mines aswell as several brownfield expansion projects online overthe next three to four years remains well on track. Thesis Feb. 28, 2012 Founded in 2003, Yamana Gold has aggressively�boostedits production through expansion projects andacquisitions. We view Yamana as one of the mostattractive players in gold mining because of its stronggrowth potential and below-average production costs. Inparticular, Yamana’s world-class Agua Rica gold-copperdeposit could deliver significant shareholder value.However, tapping this resource probably will take manyyears, as the project is still in its infancy.� Through a combination of mine developments andacquisitions, most notably the back-to-back acquisitions ofMeridian Gold and Northern Orion in October 2007,Yamana has been able to increase its gold output morethan 20-fold since 2005, generating just over 1 million goldequivalent ounces (which translates silver ounces to goldequivalents at a 50/1 ratio) in 2011. The company has
accumulated an attractive portfolio of gold and silvermines in Central and South America, with co-product cashcosts of less than $500 per gold equivalent ounce in 2011,situating Yamana at the low end of the industry costcurve. Yamana also generates significant copper output atits Chapada mine in Brazil. One of the reasons forYamana’s favorable cost profile is high average metalgrades. For example, the firm’s flagship El Penonunderground mine in Chile exhibits an impressive goldreserve grade of more than seven grams per ton.� Yamana also boasts a full pipeline of developmentprojects, including several advanced-stage projects.Although management has not always stuck to mineconstruction schedules in the past, we think Yamana willbe able to commence gold production at its Pilar, C1 SantaLuz, and Ernesto mines by the end of 2013, given themodest scale and advanced stage of these projects. Thefirm already has gained some credibility by commencingproduction at the Mercedes mine in Mexico in late 2011,slightly ahead of management’s initial schedule. Webelieve these four new mines, together with a fewbrownfield expansion initiatives such as a tailingsreprocessing project at the Minera Florida mine, will boostYamana’s production by more than 600,000 goldequivalent ounces during the next several years.� While we are excited about Yamana’s growth potential,we do have some concerns about how the firm will fundits development pipeline. Yamana historically relied onmassive equity issuances to fund major acquisitions andexpansion projects. The firm has done a better job ofmatching its investing cash outflows to its operating cashinflows in recent years, and we believe that goingforward, the firm will be able to fund most of itsinvestment needs through internal cash flows, especiallyif gold prices cooperate. However, given management’shistory with large equity issuances, we cannot guaranteethat the company will not significantly dilute existingshareholders in the future.� A potential boon for Yamana shareholders is the firm’sAgua Rica gold-copper deposit in Argentina, which houses

52
Yamana Gold, Inc. AUY [NYSE] | QQQQTM
Last Price Fair Value Consider Buy Consider Sell Uncertainty Economic Moat Stewardship Morningstar Credit Rating Industry13.84 USD 18.00 USD 10.80 USD 27.90 USD High None . Gold .
Close Competitors Currency(Mil) Market Cap TTM Sales Oper Income Net Income
Yamana Gold, Inc.
Goldcorp, Inc.
Eldorado Gold Corp
Agnico-Eagle Mines
USD
USD
USD
USD
10,324 2,257 968 570
29,299 5,495 2,224 1,709
9,120 1,099 513 319
6,613 1,878 666 -536
Morningstar data as of May 07, 2012.
an impressive 6.6 million ounces of gold reserves andalmost 10 billion pounds of copper reserves. Yamana sold87.5% of its stake in Agua Rica in March 2011 toGoldcorp�and Xstrata. In return, Yamana received cashconsiderations totaling more than $300 million and alsowill be entitled to the bulk of cash flows related to AguaRica’s future gold production. We like this deal because itshifts much of Agua Rica’s massive capital requirementsto Yamana’s partners while still giving the company goodexposure to the project’s future gold production throughthe aforementioned streaming agreement. While there isstill a chance that Agua Rica will not be developed, webelieve Yamana’s collaboration with two deep-pocketedpartners, as well as the deposit’s large size and favorableeconomics, will help the project to continue its advance tocommercial production. Valuation, Growth and Profitability Our fair value estimate for Yamana is $18 per share. Weassume that Yamana’s gold production will grow from lessthan 1.1 million gold equivalent ounces in 2011 to morethan 1.8 million gold equivalent ounces in 2015, with thisgrowth stemming from the startup of four new mines(Ernesto, C1 Santa Luz, Pilar, and Jeronimo) as well as atailings reprocessing project in Minera Florida and higherore throughput in Gualcamayo and Chapada. We alsobelieve the total cash proceeds that Yamana will receivefrom its sale of Agua Rica in March 2011, as well as thefirm’s residual claim on future production from Agua Rica,adds $1 per share in equity value. Our model assumes along-term gold price assumption of $1,200 per ounce in
2015,�with gold price assumptions for 2012 to 2014pegged to Comex gold futures contracts prices. We use acost of equity assumption of 8.5%, and our impliedterminal multiple is roughly�10 times enterprisevalue/earnings before interest, taxes, depreciation, andamortization. Risk Environmental concerns, volatile gold prices, andproject-specific concerns are the biggest risks facing goldminers, including Yamana. Additionally, Yamana’sresource ounces are heavily concentrated in SouthAmerica, so regulatory instability is a material risk factor.Shareholders face the risk of being diluted by major equityissuances, should Yamana deem internal cash flows to beinsufficient to fund major acquisitions or expansionprojects. Bulls Say
Yamana has several projects coming on line during thenext few years, which should help boost goldproduction. Yamana enjoys one of the lowest cash operating costsin the gold mining industry. Gold companies tend to be countercyclical. They alsoprovide an excellent hedge to inflation risk.
Bears Say
Risk of project development delays can negativelyaffect the company. Yamana historically has deployed massive equity raisesto fund its expansion projects and acquisitions. Investors looking for gold exposure can skirtcompany-specific risk by investing in gold-backedexchange-traded funds.
© 2012 Morningstar. All Rights Reserved. Unless otherwise provided in a separate agreement, you may use this report only in the country in which its original distributor is based. Data as originally reported.The information contained herein is not represented or warranted to be accurate, correct, complete, or timely. This report is for information purposes only, and should not be considered a solicitation to buy or sell any security.Redistribution is prohibited without written permission. To order reprints, call +1 312-696-6100. To license the research, call +1 312-696-6869.
ß ®

53
Yamana Gold, Inc. AUY [NYSE] | QQQQTM
Last Price Fair Value Consider Buy Consider Sell Uncertainty Economic Moat Stewardship Morningstar Credit Rating Industry13.84 USD 18.00 USD 10.80 USD 27.90 USD High None . Gold .
Financial Overview Financial Health: Yamana ended 2011 with $550 million incash against $432 million in debt and a debt/equity ratioof roughly 6%. The firm covered its interest expenses withEBITDA more than 30 times in 2011. We believe the firmis in good financial health and expect future capital needsto be mostly met with internal cash flows without theneed to tap external bond or equity markets.� Company Overview Profile: Founded in 2003, Yamana Gold operates aportfolio of six mines in Central and South America thatprimarily produce gold. Total production in 2011 was lessthan 1.1 million gold equivalent ounces, with goldconstituting more than 80% of that amount. Yamana hasbased its historical growth primarily on acquisitions butseems to have shifted strategies in recent years to focusmore on generating internal growth. The firm’s proven andprobable reserves at the end of 2011 included 23.6 millionounces of gold. Management: Peter Marrone has been CEO since Yamanawas founded in 2003. A lawyer by training, Marronepreviously was the executive vice president and managingdirector of investment banking at Canaccord Capital,before which he was partner at Cassels Brock &Blackwell, practicing securities law. Marrone also ischairman of Yamana’s board, a role we would prefer tosee filled by an independent director. Executivecompensation seems reasonable, but company executivesand directors as a group hold less than 1% of total sharesoutstanding, a number we would like to see increased tobetter align management’s interests with those ofshareholders. Overall, we believe Yamana’s managementhas a mixed record in terms of stewardship. Currentmanagement can be credited for leading Yamana toexplosive top-line growth while keeping production costs
below the industry average. However, management alsoenacted massive equity raises in years past to fund thefirm’s heady growth, which substantially diluted existingshareholders.
© 2012 Morningstar. All Rights Reserved. Unless otherwise provided in a separate agreement, you may use this report only in the country in which its original distributor is based. Data as originally reported.The information contained herein is not represented or warranted to be accurate, correct, complete, or timely. This report is for information purposes only, and should not be considered a solicitation to buy or sell any security.Redistribution is prohibited without written permission. To order reprints, call +1 312-696-6100. To license the research, call +1 312-696-6869.
ß ®

54
Yamana Gold, Inc. AUY [NYSE] | QQQQTM
Last Price Fair Value Consider Buy Consider Sell Uncertainty Economic Moat Stewardship Morningstar Credit Rating Industry13.84 USD 18.00 USD 10.80 USD 27.90 USD High None . Gold .
Analyst Notes
May 02, 2012 Yamana Treads Water in First Quarter, but Projects Remain on Schedule
Yamana Gold reported modest results during the firstquarter, with gold production growth muted mostly due tomajor maintenance work at Chapada. Yamana achievedtotal production of 279,000 gold-equivalent ounces, orGEOs, during the quarter, which marks just a 4%year-over-year increase despite the start of production atthe firm’s new Mercedes gold-silver mine in February ofthis year. However, we think that Yamana’s gold productiongrowth will pick up during the rest of the year and allow thefirm to comfortably exceed the low end of its 2012
production guidance of 1.2 million GEOs. The increasedproduction should also help on the cost side as 2012progresses, in our opinion. Meanwhile, Yamana continuedto make solid progress on its slate of development projectsduring the quarter, and we think the firm’s aggressivestrategy of bringing four new mines as well as severalbrownfield expansion projects online over the next three tofour years remains well on track.�
Feb. 23, 2012 Yamana Hit its Stride in 4Q, Continues to Fill its Project Pipeline
Yamana Gold met our expectations during the fourthquarter and set the stage for rapid production growth in2012 and 2013 as its project pipeline continues to advancein line with guidance. The firm continued to do areasonable job in controlling cash costs, which were only$486 per gold-equivalent ounce (GEO) during the quarter,representing a mere 4.5% year-over-year increase andfirmly situating the company in the bottom quartile of thegold mining industry. For the full year of 2011, Yamana sawits cash costs increase to $463 per GEO from $442 per GEOin 2010, which is roughly a 5% increase. Yamana’s cashcost achievement in 2011 is particularly notable given thedouble-digit increases suffered by some of its peers duringthe same time period. GEO production decreased by 3%year over year during the quarter to 277,000 GEOs, but stillincreased by 5% for the full year. We expect GEOproduction to increase dramatically in 2012 and 2013 ascommercial production at Mercedes was achieved inFebruary of this year, and the firm’s three other new mines,Ernesto, C1 Santa Luz, and Pilar, are scheduled to come online over the next two years. As of February 2012, physical
construction at Ernesto and C1 Santa Luz were 75% and60% complete, respectively, while 85% of detailedengineering for Pilar has been completed.� �While Yamana’s advanced-stage projects are progressingaccording to schedule, the firm has also been busy filling upthe early-stage portion of its project pipeline. Yamana wasable to increase its proven and probable reserves by 9%from 2011 to 17.04 million ounces; even more impressively,the average reserve gold grade increased to 0.86 grams perton, up from 0.78 grams per ton at the end of 2010. Yamanauses a lower gold price assumption to calculate its reserves($950 per ounce) than the industry average, meaning thatits expanded reserve is mostly the result of diligentexploration rather than from a higher gold priceassumption. Yamana expects to complete a feasibility studyon the Jeromino project in Chile by mid-2012, and we thinkthis project could be contributing gold production for thefirm as early as 2014, pending a positive constructiondecision. ��
Nov. 04, 2011 Yamana Gets Closer to Reaping the Fruits of its Labor in 3Q
Yamana Gold’s third-quarter results were in line with ourexpectations, and the company continued to bring its
near-term gold projects closer to actual production. We aremaintaining our fair value estimate of $18 per share for the
© 2012 Morningstar. All Rights Reserved. Unless otherwise provided in a separate agreement, you may use this report only in the country in which its original distributor is based. Data as originally reported.The information contained herein is not represented or warranted to be accurate, correct, complete, or timely. This report is for information purposes only, and should not be considered a solicitation to buy or sell any security.Redistribution is prohibited without written permission. To order reprints, call +1 312-696-6100. To license the research, call +1 312-696-6869.
ß ®

55
Yamana Gold, Inc. AUY [NYSE] | QQQQTM
Last Price Fair Value Consider Buy Consider Sell Uncertainty Economic Moat Stewardship Morningstar Credit Rating Industry13.84 USD 18.00 USD 10.80 USD 27.90 USD High None . Gold .
Analyst Notes (continued)
company and believe shares are moderately undervalued.Yamana did a good job in corralling production costs duringthe quarter, achieving coproduct cash costs of $468 pergold-equivalent ounce (GEO), which represents a 7%year-over-year increase. This cost inflation was relativelymild compared to that experienced by many of Yamana’speers. The firm undoubtedly benefited from its currencyhedge to the Brazilian reais, which has appreciated in 2011and pressured local production costs.�� �Yamana’s quarterly production of 279,000 GEOsrepresented a mere 4% increase from the year-ago quarter;however, we value the company not based on its existingproduction base but rather on the much larger productionbase we expect the company to have once its new goldprojects come on line. And on that front, the companycontinues to make solid progress. At the most advanced ofits quartet of near-term projects, the Mercedes mine inMexico, Yamana has now completed 94% of physicalconstruction, up from 85% at the end of the second quarter.The firm maintained its expectations for the first gold atMercedes to be poured by the end of the year. Yamana alsomaintained its construction schedule for its other three
advanced stage projects, Ernesto, C1 Santa Luz, and Pilar.� �Management also gave its take on Argentina’sannouncement of a new currency repatriation policy, andexplained that it would have a minimal impact on the firm’soperations. Our earnings note for Barrick, CreepingNationalization Overshadows Barrick’s Strong Performanceon Costs in the Third Quarter, contains our detailed take onArgentina’s new policy. Yamana currently operates theGualcamayo mine in Argentina, which contributed 14% ofthe firm’s GEO production in 2010. Looking ahead to thenext few quarters, we will be closely watching the progresson Mercedes as it ramps up to production in either thefourth quarter of 2011 or the first quarter of 2012 at thelatest. The tailings reprocessing project at the MineraFlorida mine should also start contributing incremental, lowcash cost gold ounces by the first quarter of 2012, but thereal boost to production should arrive in 2012 and 2013 asMercedes and the other new mines ramp up to fullproduction. We think this could be a positive catalyst forthe share price.�
© 2012 Morningstar. All Rights Reserved. Unless otherwise provided in a separate agreement, you may use this report only in the country in which its original distributor is based. Data as originally reported.The information contained herein is not represented or warranted to be accurate, correct, complete, or timely. This report is for information purposes only, and should not be considered a solicitation to buy or sell any security.Redistribution is prohibited without written permission. To order reprints, call +1 312-696-6100. To license the research, call +1 312-696-6869.
ß ®
Disclaimers & DisclosuresNo Morningstar employees are officers or directors of this company. Morningstar Inc. does not own more than 1% of the shares of this company. Analystscovering this company do not own its stock. The information contained herein is not represented or warranted to be accurate, correct, complete, or timely.This report is for information purposes only, and should not be considered a solicitation to buy or sell any security.

56
Morningstar Stock Data Sheet Pricing data thru May 07, 2012 Rating updated as of May 07, 2012Pricing data thru May 07, 2012 Rating updated as of May 07, 2012 Fiscal year-end: December
Yamana Gold, Inc. AUY Sales USD Mil Mkt Cap USD Mil Industry Sector2,257 10,324 Gold
Basic Materials
TMMorningstar Rating Last Price Fair Value Uncertainty Economic Moat Stewardship GradeQQQQ 13.84 18.00 High None .
per share prices in USD
2002 2003 2004 2005 2006 2007 2008 2009 2010 2011 YTD
1.0
3.0
6.0
14.0
2.0 7.0
4.740.28
3.760.98
3.491.77
6.762.67
13.816.60
15.888.40
19.933.31
14.375.80
13.139.16
17.4710.88
18.1613.62
Annual Price HighLowRecent Splits
Price VolatilityMonthly High/LowRel Strength to S&P 500
52 week High/Low18.16 - 11.10
10 Year High/Low19.93 - 0.28
Bear-Market Rank5 (10=worst)
Trading Volume Million
Stock Performance
1:27
Founded in 2003, Yamana Gold operates a portfolio of sixmines in Central and South America that primarily producegold. Total production in 2011 was less than 1.1 million goldequivalent ounces, with gold constituting more than 80% ofthat amount. Yamana has based its historical growthprimarily on acquisitions but seems to have shiftedstrategies in recent years to focus more on generatinginternal growth. The firm’s proven and probable reserves atthe end of 2011 included 23.6 million ounces of gold.
200 Bay Street Suite 2000Toronto, ON M5J 2J3Phone: 1 416 815-0220Website: http://www.yamana.com
Growth Rates Compound AnnualGrade: B 1 Yr 3 Yr 5 Yr 10 Yr
Revenue % 28.8 27.3 66.6 655.5Operating Income % 65.5 65.9 . .Earnings/Share % 25.4 6.1 . .Dividends % 106.7 15.7 50.6 .
Book Value/Share % 2.2 4.0 14.9 .Stock Total Return % 18.8 18.3 -0.1 19.2+/- Industry 39.5 12.8 -3.2 10.3+/- Market 17.2 3.6 1.8 16.6
Profitability AnalysisGrade: C Current 5 Yr Avg Ind Mkt
Return on Equity % 7.7 5.6 6.5 22.2Return on Assets % 5.3 3.8 4.2 9.3Fixed Asset Turns 0.3 0.2 0.5 7.5Inventory Turns 6.9 6.2 4.4 16.8Revenue/Employee USD K 443.9 369.2 . 1035.3
Gross Margin % 50.6 49.8 45.2 40.1Operating Margin % 42.9 32.6 26.3 18.9Net Margin % 25.3 26.1 14.1 11.3Free Cash Flow/Rev % 13.8 . 8.4 0.1R&D/Rev % 1.7 . . 9.4
*
*3Yr Avg data is displayed in place of 5Yr Avg
Financial PositionGrade: B 12-11 USD Mil 03-12 USD Mil
Cash 550 868Inventories 163 179Receivables 206 146
Current Assets 1103 1376
Fixed Assets 9044 9210Intangibles 71 71
Total Assets 10770 11238
Payables 488 483Short-Term Debt . .
Current Liabilities 495 489Long-Term Debt 432 766
Total Liabilities 3325 3653
Total Equity 7445 7586
2002 2003 2004 2005 2006 2007 2008 2009 2010 2011 TTM FinancialsRevenue USD Mil6 . 20 46 169 747 1055 1183 1687 2173 2257Gross Margin %33.7 . 44.9 34.0 40.9 61.5 52.9 39.5 44.3 50.6 50.6Oper Income USD Mil-10 -2 2 -4 -34 276 207 342 571 945 968Operating Margin %-163.5 . 11.8 -8.2 -19.9 36.9 19.6 28.9 33.9 43.5 42.9
Net Income USD Mil-11 -3 1 -4 -70 157 435 193 451 548 570
Earnings Per Share USD. . . -0.03 -0.25 0.36 0.62 0.26 0.61 0.74 0.76Dividends USD. . . . 0.02 0.04 0.10 0.04 0.08 0.16 0.18Shares Mil. . 62 145 277 432 702 734 741 745 746Book Value Per Share USD. 20.80 1.31 2.58 8.97 17.14 8.88 9.20 9.50 9.98 10.17
Oper Cash Flow USD Mil0 -1 6 3 -3 294 329 552 615 1226 1285Cap Spending USD Mil0 0 -6 -161 -219 -273 -587 -499 -482 -822 -975Free Cash Flow USD Mil0 -1 0 -158 -223 21 -258 53 133 404 310
Valuation AnalysisCurrent 5 Yr Avg Ind Mkt
Price/Earnings 18.1 26.8 22.7 15.1Forward P/E 9.3 . . 13.8Price/Cash Flow 8.0 15.0 9.3 7.9Price/Free Cash Flow 33.3 . 48.5 17.7Dividend Yield % 1.3 . 1.5 2.0Price/Book 1.4 1.1 1.6 2.2Price/Sales 4.6 6.1 3.4 1.3PEG Ratio 0.4 . . 1.8
Total Return %59.9 -5.4 24.8 118.9 99.7 -1.5 -39.6 47.9 13.2 16.0 -5.4+/- Market83.3 -31.8 15.8 115.9 86.1 -5.0 -1.1 24.5 0.4 16.0 -14.3+/- Industry-3.6 -48.3 35.6 88.7 90.1 -15.3 -22.7 19.2 -16.1 30.3 9.7
Dividend Yield %. . . . 0.1 0.3 1.4 0.3 0.6 1.1 1.3Market Cap USD Mil. 7 369 808 2522 4459 5658 8346 9489 10954 10324
2002 2003 2004 2005 2006 2007 2008 2009 2010 2011 TTM ProfitabilityReturn on Assets %-95.1 -40.5 2.0 -0.9 -5.3 2.6 4.5 2.0 4.5 5.2 5.3Return on Equity %. -86.5 2.4 -1.3 -6.9 4.1 7.0 2.9 6.5 7.5 7.7
Net Margin %. . 5.1 -8.9 -41.5 21.0 41.2 16.3 26.8 25.2 25.3Asset Turnover0.50 . 0.39 0.10 0.13 0.12 0.11 0.12 0.17 0.21 0.21Financial Leverage2.5 1.8 1.2 1.5 1.3 1.7 1.4 1.4 1.4 1.5 1.5
2002 2003 2004 2005 2006 2007 2008 2009 2010 2011 03-12 Financial HealthWorking Capital USD Mil-3 . 36 139 53 178 161 260 529 608 888Long-Term Debt USD Mil. . . 107 17 682 472 529 487 432 766Total Equity USD Mil4 4 81 315 1717 5907 6510 6749 7244 7445 7586Debt/Equity. . . 0.34 0.01 0.12 0.07 0.08 0.07 0.06 0.10
2002 2003 2004 2005 2006 2007 2008 2009 2010 2011 TTM ValuationPrice/Earnings. . . . . 36.0 12.4 43.9 21.7 19.8 18.1P/E vs. Market. . . . . . . . . 1.1 1.2Price/Sales21.9 . 6.7 17.6 18.7 7.5 5.1 7.1 5.6 5.0 4.6Price/Book. 0.1 2.3 2.6 1.5 0.8 0.9 1.2 1.4 1.5 1.4Price/Cash Flow. 65.4 23.6 . . 19.0 16.5 15.2 15.4 8.9 8.0
Quarterly ResultsRevenue
Rev Growth
Earnings Per Share
USD Mil Jun 11 Sep 11 Dec 11 Mar 12
% Jun 11 Sep 11 Dec 11 Mar 12
USD Jun 11 Sep 11 Dec 11 Mar 12
Most Recent Period 573.3 555.2 568.8 559.8Prior Year Period 351.4 454.0 535.1 476.1
Most Recent Period 63.2 22.3 6.3 17.6Prior Year Period 30.3 36.3 33.8 37.5
Most Recent Period 0.26 0.16 0.12 0.23Prior Year Period 0.12 0.17 0.22 0.20
Industry Peers by Market Cap
Major Fund Holders
Mkt Cap USD Mil Rev USD Mil P/E ROE%
% of shares
Yamana Gold, Inc. 10324 2257 18.1 7.7Goldcorp, Inc. 29299 5495 17.6 8.2Eldorado Gold Corp 9120 1099 22.1 10.2
.
.
.
TTM data based on rolling quarterly data if available; otherwise most recent annual data shown.
© 2012 Morningstar. All Rights Reserved. Unless otherwise provided in a separate agreement, you may use this report only in the country in which its original distributor is based. Data as originally reported. The information contained herein is not represented or warranted to be accurate, correct, complete, or timely. This report is for information purposes only, and should not be considered a solicitation to buy or sell any security. Redistribution is prohibited without written permission. To order reprints, call +1 312-696-6100. To license the research, call +1 312-696-6869. ß
®
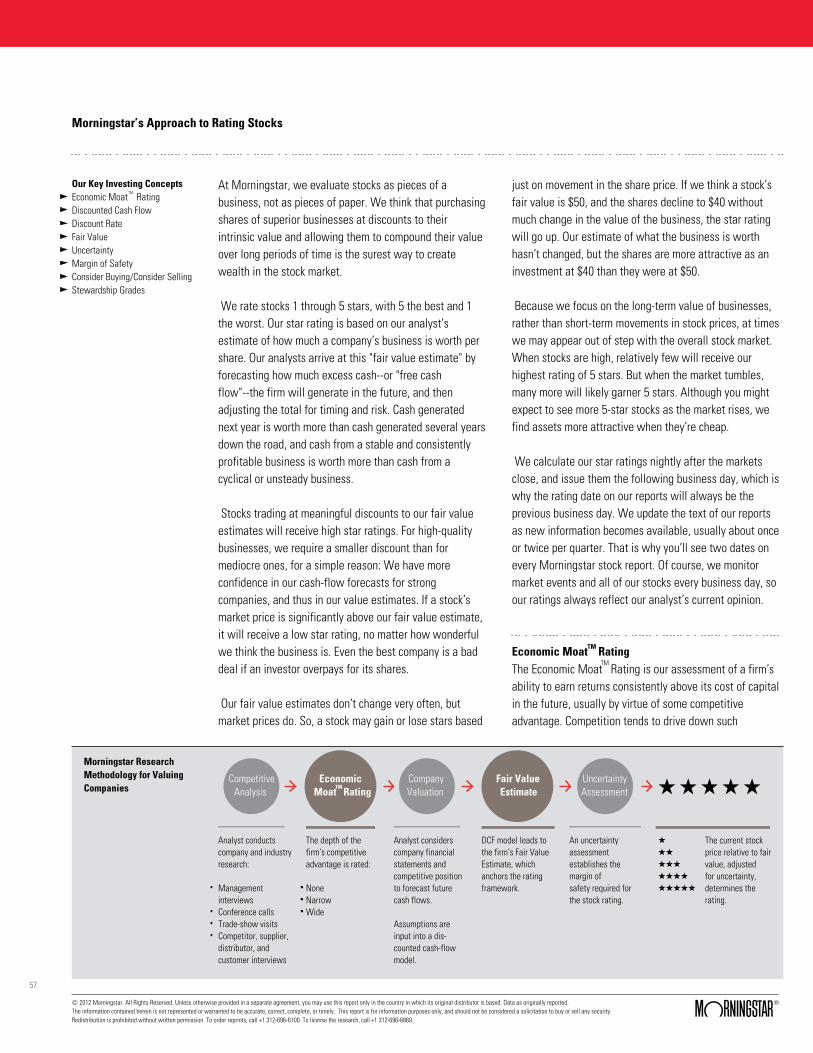
57
Morningstar’s Approach to Rating Stocks
Our Key Investing ConceptsEconomic Moat Rating��Discounted Cash Flow��Discount Rate��Fair Value��Uncertainty��Margin of Safety��Consider Buying/Consider Selling��Stewardship Grades��
TMAt Morningstar, we evaluate stocks as pieces of abusiness, not as pieces of paper. We think that purchasingshares of superior businesses at discounts to theirintrinsic value and allowing them to compound their valueover long periods of time is the surest way to createwealth in the stock market. We rate stocks 1 through 5 stars, with 5 the best and 1the worst. Our star rating is based on our analyst’sestimate of how much a company’s business is worth pershare. Our analysts arrive at this "fair value estimate" byforecasting how much excess cash--or "free cashflow"--the firm will generate in the future, and thenadjusting the total for timing and risk. Cash generatednext year is worth more than cash generated several yearsdown the road, and cash from a stable and consistentlyprofitable business is worth more than cash from acyclical or unsteady business. Stocks trading at meaningful discounts to our fair valueestimates will receive high star ratings. For high-qualitybusinesses, we require a smaller discount than formediocre ones, for a simple reason: We have moreconfidence in our cash-flow forecasts for strongcompanies, and thus in our value estimates. If a stock’smarket price is significantly above our fair value estimate,it will receive a low star rating, no matter how wonderfulwe think the business is. Even the best company is a baddeal if an investor overpays for its shares. Our fair value estimates don’t change very often, butmarket prices do. So, a stock may gain or lose stars based
just on movement in the share price. If we think a stock’sfair value is $50, and the shares decline to $40 withoutmuch change in the value of the business, the star ratingwill go up. Our estimate of what the business is worthhasn’t changed, but the shares are more attractive as aninvestment at $40 than they were at $50. Because we focus on the long-term value of businesses,rather than short-term movements in stock prices, at timeswe may appear out of step with the overall stock market.When stocks are high, relatively few will receive ourhighest rating of 5 stars. But when the market tumbles,many more will likely garner 5 stars. Although you mightexpect to see more 5-star stocks as the market rises, wefind assets more attractive when they’re cheap. We calculate our star ratings nightly after the marketsclose, and issue them the following business day, which iswhy the rating date on our reports will always be theprevious business day. We update the text of our reportsas new information becomes available, usually about onceor twice per quarter. That is why you’ll see two dates onevery Morningstar stock report. Of course, we monitormarket events and all of our stocks every business day, soour ratings always reflect our analyst’s current opinion. Economic Moat Rating The Economic Moat Rating is our assessment of a firm’sability to earn returns consistently above its cost of capitalin the future, usually by virtue of some competitiveadvantage. Competition tends to drive down such
TM
TM
Morningstar ResearchMethodology for ValuingCompanies QQQQQCompetitive Economic Company Fair Value Uncertainty
Analysis Moat Rating Valuation Estimate AssessmentTM
Analyst conducts The depth of the Analyst considers DCF model leads to An uncertaintycompany and industry firm’s competitive company financial the firm’s Fair Value assessmentresearch: advantage is rated: statements and Estimate, which establishes the� � competitive position anchors the rating margin ofManagement None to forecast future framework. safety required forinterviews Narrow cash flows. the stock rating.Conference calls Wide �Trade-show visits Assumptions areCompetitor, supplier, input into a dis-distributor, and counted cash-flowcustomer interviews model.
The current stockprice relative to fairvalue, adjustedfor uncertainty,determines therating.
QQQQQQQQQQQQQQQ
© 2012 Morningstar. All Rights Reserved. Unless otherwise provided in a separate agreement, you may use this report only in the country in which its original distributor is based. Data as originally reported.The information contained herein is not represented or warranted to be accurate, correct, complete, or timely. This report is for information purposes only, and should not be considered a solicitation to buy or sell any security.Redistribution is prohibited without written permission. To order reprints, call +1 312-696-6100. To license the research, call +1 312-696-6869.
ß ®

58
Morningstar’s Approach to Rating Stocks (continued)
economic profits, but companies that can earn them for anextended time by creating a competitive advantagepossess an Economic Moat. We see these companies assuperior investments. Discounted Cash Flow This is a method for valuing companies that involvesprojecting the amount of cash a business will generate inthe future, subtracting the amount of cash that thecompany will need to reinvest in its business, and usingthe result to calculate the worth of the firm. We use thistechnique to value nearly all of the companies we cover. Discount Rate We use this number to adjust the value of our forecastedcash flows for the risk that they may not materialize. For aprofitable company in a steady line of business, we’ll usea lower discount rate, also known as "cost of capital,"than for a firm in a cyclical business with fiercecompetition, since there’s less risk clouding the firm’sfuture. Fair Value This is the output of our discounted cash-flow valuationmodels, and is our per-share estimate of a company’sintrinsic worth. We adjust our fair values for off-balancesheet liabilities or assets that a firm might have--forexample, we deduct from a company’s fair value if it hasissued a lot of stock options or has an under-fundedpension plan. Our fair value estimate differs from a "targetprice" in two ways. First, it’s an estimate of what thebusiness is worth, whereas a price target typically reflectswhat other investors may pay for the stock. Second, it’s along-term estimate, whereas price targets generally focuson the next two to 12 months. Uncertainty To generate the Morningstar Uncertainty Rating, analystsconsider factors such as sales predictability, operatingleverage, and financial leverage. Analysts then classifytheir ability to bound the fair value estimate for the stockinto one of several uncertainty levels: Low, Medium, High,
Very High, or Extreme. The greater the level of uncertainty,the greater the discount to fair value required before astock can earn 5 stars, and the greater the premium to fairvalue before a stock earns a 1-star rating. Margin of Safety This is the discount to fair value we would require beforerecommending a stock. We think it’s always prudent tobuy stocks for less than they’re worth.The margin of safetyis like an insurance policy that protects investors from badnews or overly optimistic fair value estimates. We requirelarger margins of safety for less predictable stocks, andsmaller margins of safety for more predictable stocks. Consider Buying/Consider Selling The consider buying price is the price at which a stockwould be rated 5 stars, and thus the point at which wewould consider the stock an extremely attractivepurchase. Conversely, consider selling is the price atwhich a stock would have a 1 star rating, at which pointwe’d consider the stock overvalued, with low expectedreturns relative to its risk. Stewardship Grades Our corporate Stewardship Rating represents ourassessment of management’s stewardship of shareholdercapital, with particular emphasis on capital allocationdecisions. Analysts consider companies’ investmentstrategy and valuation, financial leverage, dividend andshare buyback policies, execution, compensation, relatedparty transactions, and accounting practices. Corporategovernance practices are only considered if they’ve had ademonstrated impact on shareholder value. Analystsassign one of three ratings: "Exemplary," "Standard," and"Poor." Analysts judge stewardship from an equity holder’sperspective. Ratings are determined on an absolute basis.Most companies will receive a Standard rating, and this isthe default rating in the absence of evidence thatmanagers have made exceptionally strong or poor capitalallocation decisions.
© 2012 Morningstar. All Rights Reserved. Unless otherwise provided in a separate agreement, you may use this report only in the country in which its original distributor is based. Data as originally reported.The information contained herein is not represented or warranted to be accurate, correct, complete, or timely. This report is for information purposes only, and should not be considered a solicitation to buy or sell any security.Redistribution is prohibited without written permission. To order reprints, call +1 312-696-6100. To license the research, call +1 312-696-6869.
ß ®

59
?
Eldorado Gold Corp EGO [NYSE] | QQQQTM
Last Price Fair Value Consider Buy Consider Sell Uncertainty Economic Moat Stewardship Morningstar Credit Rating Industry12.82 USD 19.00 USD 9.50 USD 33.25 USD Very High Narrow . Gold .
Currency amounts expressed with "$"are in U.S. dollars (USD) unlessotherwise denoted.
Eldorado Sees Modest Growth in 1Q, Steep Growth Trajectoryon Track
by Joung ParkEquity AnalystAnalysts covering this company do notown its stock.
Pricing data through May 07, 2012.Rating updated as ofMay 07, 2012.
08 09 10 11 12
4.0
5.0
6.0
8.0
14.0
19.0Stock Price
Analyst Note May 04, 2012 Eldorado Gold reported first-quarter results that werelargely in line with our expectations. Given thatmanagement had released its mining plan update a coupleweeks ago on April 12, we were not looking for any bigsurprises in Eldorado’s earnings release. While the firm’sgold production during the quarter of roughly 156,000ounces (representing a 5% year-over-year increase) wasnot particularly impressive, we think Eldorado will be ableto significantly expand its gold output as the yearprogresses, given that the company dealt with someseasonal issues in the first quarter, and will also benefitfrom incremental ounces from new projects coming on linelater in the year. As such, we think the firm will be able tocomfortably hit the top end of its 2012 productionguidance of 775,000 ounces. The increased productionshould also help on the cost side as 2012 progresses, inour opinion. Meanwhile, Eldorado is making solid progresson its near-term projects, and we expect to see initialproduction at two of these projects (Olympias and EasternDragon) sometime this year. We continue to believe thatEldorado’s shares represent an attractive buyingopportunity at current prices. Thesis Mar. 06, 2012 Eldorado Gold boasts one of the lowest production costsamong the midtier gold miners, with total unit cash costsof $472 per gold ounce in 2011 compared with theindustry average of more than $600 per ounce. We thinkthe firm will be able to maintain its low-cost position foryears to come thanks to its long mine life of more thantwo decades at 2011 production levels, which is why weaward the firm a narrow economic moat.� Eldorado’s flagship asset is its Kisladag gold mine inTurkey, which the company brought on line in 2006.Kisladag, which is Turkey’s largest gold mine, contributedmore than 40% of Eldorado’s total gold production in
2011. We think Eldorado’s plans to expand productionthere makes sense, given that Kisladag currently has amine life of more than three decades at 2011 productionlevels. The expansion project would help pull some of itspotential future production forward, enhancing Kisladag’seconomics. Eldorado has a second major Turkish project inthe works, as the Efemcukuru mine poured its first gold inmid-2011 and is ramping up production to design capacity.While Efemcukuru will produce less than half of Kisladag’scurrent gold output, the mine is projected to produce ateven lower unit cash costs than Kisladag thanks toEfemcukuru’s very high-grade ore.� In addition to its operations in Turkey, Eldorado alsoenjoys a significant presence in China, a country that mostWestern gold miners eschew. Eldorado first gained entryinto the Chinese market by constructing the Tanjianshan(TJS) mine, which started production in 2007. Thecompany further expanded its Chinese presence throughits $1.9 billion purchase of Sino Gold, which closed inDecember 2009 and brought the Jinfeng and WhiteMountain mines, as well as the Eastern Dragon project,under Eldorado’s purview. While gold mining in Chinadoes entail adhering to idiosyncratic permitting processesand allowing the government to take a small minoritystake in each mine, Eldorado’s ability to build amiablerelationships with the local governments as well as itssuccessful operational record in China helps to allay someof our concerns about potential geopolitical risks.� Of Eldorado’s three Chinese mines, Jinfeng is the largestgold producer, generating more than 170,000 ounces in2011, while the TJS and White Mountain mines producemuch smaller amounts of gold. All three mines exhibitslightly below-average production costs. Eldorado is ontrack to add a fourth Chinese mine, as it has resumedconstruction on the Eastern Dragon project and plans tostart production sometime in 2012. While Eastern Dragonwill be a relatively small gold producer, the mine willfeature very low production costs because of itssignificant silver byproduct credits.� Having established a secure foothold in Turkey and China,
Stock Price

60
Morningstar’s Approach to Rating Stocks (continued)
economic profits, but companies that can earn them for anextended time by creating a competitive advantagepossess an Economic Moat. We see these companies assuperior investments. Discounted Cash Flow This is a method for valuing companies that involvesprojecting the amount of cash a business will generate inthe future, subtracting the amount of cash that thecompany will need to reinvest in its business, and usingthe result to calculate the worth of the firm. We use thistechnique to value nearly all of the companies we cover. Discount Rate We use this number to adjust the value of our forecastedcash flows for the risk that they may not materialize. For aprofitable company in a steady line of business, we’ll usea lower discount rate, also known as "cost of capital,"than for a firm in a cyclical business with fiercecompetition, since there’s less risk clouding the firm’sfuture. Fair Value This is the output of our discounted cash-flow valuationmodels, and is our per-share estimate of a company’sintrinsic worth. We adjust our fair values for off-balancesheet liabilities or assets that a firm might have--forexample, we deduct from a company’s fair value if it hasissued a lot of stock options or has an under-fundedpension plan. Our fair value estimate differs from a "targetprice" in two ways. First, it’s an estimate of what thebusiness is worth, whereas a price target typically reflectswhat other investors may pay for the stock. Second, it’s along-term estimate, whereas price targets generally focuson the next two to 12 months. Uncertainty To generate the Morningstar Uncertainty Rating, analystsconsider factors such as sales predictability, operatingleverage, and financial leverage. Analysts then classifytheir ability to bound the fair value estimate for the stockinto one of several uncertainty levels: Low, Medium, High,
Very High, or Extreme. The greater the level of uncertainty,the greater the discount to fair value required before astock can earn 5 stars, and the greater the premium to fairvalue before a stock earns a 1-star rating. Margin of Safety This is the discount to fair value we would require beforerecommending a stock. We think it’s always prudent tobuy stocks for less than they’re worth.The margin of safetyis like an insurance policy that protects investors from badnews or overly optimistic fair value estimates. We requirelarger margins of safety for less predictable stocks, andsmaller margins of safety for more predictable stocks. Consider Buying/Consider Selling The consider buying price is the price at which a stockwould be rated 5 stars, and thus the point at which wewould consider the stock an extremely attractivepurchase. Conversely, consider selling is the price atwhich a stock would have a 1 star rating, at which pointwe’d consider the stock overvalued, with low expectedreturns relative to its risk. Stewardship Grades Our corporate Stewardship Rating represents ourassessment of management’s stewardship of shareholdercapital, with particular emphasis on capital allocationdecisions. Analysts consider companies’ investmentstrategy and valuation, financial leverage, dividend andshare buyback policies, execution, compensation, relatedparty transactions, and accounting practices. Corporategovernance practices are only considered if they’ve had ademonstrated impact on shareholder value. Analystsassign one of three ratings: "Exemplary," "Standard," and"Poor." Analysts judge stewardship from an equity holder’sperspective. Ratings are determined on an absolute basis.Most companies will receive a Standard rating, and this isthe default rating in the absence of evidence thatmanagers have made exceptionally strong or poor capitalallocation decisions.
© 2012 Morningstar. All Rights Reserved. Unless otherwise provided in a separate agreement, you may use this report only in the country in which its original distributor is based. Data as originally reported.The information contained herein is not represented or warranted to be accurate, correct, complete, or timely. This report is for information purposes only, and should not be considered a solicitation to buy or sell any security.Redistribution is prohibited without written permission. To order reprints, call +1 312-696-6100. To license the research, call +1 312-696-6869.
ß ®

61
Eldorado Gold Corp EGO [NYSE] | QQQQTM
Last Price Fair Value Consider Buy Consider Sell Uncertainty Economic Moat Stewardship Morningstar Credit Rating Industry12.82 USD 19.00 USD 9.50 USD 33.25 USD Very High Narrow . Gold .
Close Competitors Currency(Mil) Market Cap TTM Sales Oper Income Net Income
Eldorado Gold Corp
Yamana Gold, Inc.
Agnico-Eagle Mines
Iamgold Corp
USD
USD
USD
USD
9,120 1,099 513 319
10,324 2,257 968 570
6,613 1,878 666 -536
4,211 1,673 628 807
Morningstar data as of May 07, 2012.
Eldorado is turning its eyes further west toward Europe byacquiring European Goldfields through a $2.4 billionall-script deal. European Goldfields currently operates onlythe polymetallic Stratoni mine in northern Greece. But thereal prize of the acquisition for Eldorado would be twoshovel-ready gold projects in northern Greece: Skouriesand Olympias. Both projects have procured bankablefeasibility studies as well as the required construction andenvironmental permits from the Greek government, andOlympias could generate gold output as early as 2012from tailings reprocessing. European Goldfields also ownsthe advanced-stage Certej gold project in Romania, whichhas completed feasibility studies. We think that as long asEldorado can bring these inherited projects on line, theEuropean Goldfields transaction will prove to bevalue-accretive.� Eldorado’s near-term growth will come from its twoadvanced-stage projects, Efemcukuru, which is already inproduction, and Eastern Dragon, which should come online in 2012. Beyond these two mines, Eldorado has twopromising gold projects, Perama Hill in Greece andTocantinzinho in Brazil, as well as the threeadvanced-stage projects (Skouries, Olympias, and Certej)that it inherited from European Goldfields. Managementhas done an admirable job in executing its growth plans inthe past, as exemplified by the Kisladag and TJS mines,and we see little reason this would change going forward.We are also confident in Eldorado’s ability to successfullyfinance its expansion projects, as the firm is generatingsignificant cash flow at current gold prices and sports apristine balance sheet. As a result, we think Eldorado
offers significant gold production upside, while productioncosts should remain in the industry’s lowest quartile. Thisin turn should help Eldorado to generate significanteconomic profits for years to come. Valuation, Growth and Profitability We are increasing our fair value estimate to $19 per sharefrom $18. This increase is due primarily to incorporatingthe startup of production from the Certej andTocantinzinho projects, which we think will occur in 2014and 2015, respectively. Our previous valuation had notincorporated future gold production from Certej andTocantinzinho, but the progress made on these twoprojects gives us sufficient confidence to believe that theywill be adding to Eldorado’s cash flows in the intermediateterm. The increase in our fair value estimate fromincorporating these projects was partly offset by higherproduction cost assumptions for 2012. We think Eldoradowill enjoy explosive production growth over the nextseveral years, with production increasing from more than650,000 ounces in 2011 to more than 1.7 million ounces by2016. We assume that Olympias’ tailings retreatmentplant and the Eastern Dragon project will start generatinggold by 2012, while Skouries, Perama Hill, and Certejshould follow on their heels in 2014, and Tocantinzinhosoon after that in 2015. Our model assumes a long-termgold price assumption of $1,200 per ounce in 2015, withgold price assumptions for 2012 to 2014 pegged to Comexgold futures contracts prices. We use a cost of equityassumption of 8.5%, and our implied terminal multiple isroughly 11 times enterprise value/EBITDA. Risk Like most gold producers, Eldorado is highly leveraged togold prices, and sustained, weak prices will seriouslyhamper the firm’s earnings power. The company alsochiefly operates in Turkey and China, which comes with
© 2012 Morningstar. All Rights Reserved. Unless otherwise provided in a separate agreement, you may use this report only in the country in which its original distributor is based. Data as originally reported.The information contained herein is not represented or warranted to be accurate, correct, complete, or timely. This report is for information purposes only, and should not be considered a solicitation to buy or sell any security.Redistribution is prohibited without written permission. To order reprints, call +1 312-696-6100. To license the research, call +1 312-696-6869.
ß ®

62
Eldorado Gold Corp EGO [NYSE] | QQQQTM
Last Price Fair Value Consider Buy Consider Sell Uncertainty Economic Moat Stewardship Morningstar Credit Rating Industry12.82 USD 19.00 USD 9.50 USD 33.25 USD Very High Narrow . Gold .
some geopolitical risks. Investors should also be on thelookout for potential operational difficulties as Eldoradobrings its various mining projects on line. Finally, the firmcould be subject to higher royalties and fees imposed bylocal governments, especially for its operations located inChina. Bulls Say
Eldorado is the only major Western gold mineroperating in China, the largest gold-producing countryin the world. The firm is a low-cost gold producer, with total unitcash costs of $472 per ounce in 2011. Eldorado’s Efemcukuru and Eastern Dragon minesshould provide a significant boost to the firm’s goldproduction during the next few years. Gold companies tend to be countercyclical. They alsoprovide an excellent hedge to inflation risk. We believe Eldorado enjoys an economic moat thanksto its low-cost, long-life mining assets.
Bears Say
Eldorado operates in countries with relatively highgeopolitical risks, such as China and Turkey. Because the firm is planning to bring multiple newmines on line during the next few years, investors areexposed to execution risk and the possibility ofconstruction delays. Investors looking for gold exposure can skirtcompany-specific risk by investing in gold-backedexchange-traded funds.
Financial Overview Financial Health: With its low cash production costs,Eldorado is able to generate strong operating cash flowsat current high gold prices, and the company’s balance
sheet had $394 million in cash against just $81 million intotal debt at the end of 2011. We believe Eldorado shouldbe able to fund its approved growth projects withoutoverly burdening its balance sheet, and we view the firmto be in good financial health. Company Overview Profile: Eldorado Gold, based in Vancouver, is agold-mining company active in development andexploration in Turkey, China, Greece, and Brazil. Thecompany’s largest gold producer is its Kisladag mine inwestern Turkey. The firm also operates several gold minesand development projects in China, as well as the VilaNova iron ore mine in Brazil. Eldorado produced more than650,000 ounces of gold in 2011 at total unit cash costs of$472 per ounce. Management: Paul N. Wright joined Eldorado Gold in 1996and was appointed president and CEO in 1999. A graduateof the University of Newcastle, Wright has more thanthree decades of experience in developing and operatingopen-pit and underground gold mines. Before joiningEldorado, he worked with Placer Dome, Redpath Group,and Granges. Since assuming his current position as CEOin 1999, Wright has guided Eldorado from a fledglingjunior gold producer to the midtier gold producer it istoday, all while maintaining an enviable cost structurethat is among the lowest in the gold mining industry andgrowing production through internal exploration anddevelopment supplemented by accretive acquisitions. � Eldorado is the only company in our institutional goldmining coverage universe that has earned an economicmoat, which is largely attributable to Wright and hismanagement team amassing a portfolio of low-cost,long-life mining assets without paying an arm and a leg interms of capital spending. Wright has accomplished thisby focusing on under-the-radar mining jurisdictions such
© 2012 Morningstar. All Rights Reserved. Unless otherwise provided in a separate agreement, you may use this report only in the country in which its original distributor is based. Data as originally reported.The information contained herein is not represented or warranted to be accurate, correct, complete, or timely. This report is for information purposes only, and should not be considered a solicitation to buy or sell any security.Redistribution is prohibited without written permission. To order reprints, call +1 312-696-6100. To license the research, call +1 312-696-6869.
ß ®

63
Eldorado Gold Corp EGO [NYSE] | QQQQTM
Last Price Fair Value Consider Buy Consider Sell Uncertainty Economic Moat Stewardship Morningstar Credit Rating Industry12.82 USD 19.00 USD 9.50 USD 33.25 USD Very High Narrow . Gold .
as China, Turkey, and Greece (where the competition forquality mining assets is less intense), as well as throughprudent capital allocation. Indeed, Eldorado has largelyavoided large, dilutive acquisitions--a common destroyerof returns in the gold mining industry--and instead focusedon using its geological expertise to internally explore anddevelop gold mining assets. � The company is also committed to rewarding shareholdersand in October 2011 initiated a gold price-linked dividendscheme that will increase its dividend in a higher goldprice environment. The move makes Eldorado one of onlytwo gold miners to link its dividend to gold prices, and wethink the scheme benefits shareholders by limiting capitalavailable for reinvestment when gold prices are peakingand by granting equity investors greater leverage to goldprices.
© 2012 Morningstar. All Rights Reserved. Unless otherwise provided in a separate agreement, you may use this report only in the country in which its original distributor is based. Data as originally reported.The information contained herein is not represented or warranted to be accurate, correct, complete, or timely. This report is for information purposes only, and should not be considered a solicitation to buy or sell any security.Redistribution is prohibited without written permission. To order reprints, call +1 312-696-6100. To license the research, call +1 312-696-6869.
ß ®

64
Eldorado Gold Corp EGO [NYSE] | QQQQTM
Last Price Fair Value Consider Buy Consider Sell Uncertainty Economic Moat Stewardship Morningstar Credit Rating Industry12.82 USD 19.00 USD 9.50 USD 33.25 USD Very High Narrow . Gold .
Analyst Notes
May 04, 2012 Eldorado Sees Modest Growth in 1Q, Steep Growth Trajectory on Track
Eldorado Gold reported first-quarter results that werelargely in line with our expectations. Given thatmanagement had released its mining plan update a coupleweeks ago on April 12, we were not looking for any bigsurprises in Eldorado’s earnings release. While the firm’sgold production during the quarter of roughly 156,000ounces (representing a 5% year-over-year increase) wasnot particularly impressive, we think Eldorado will be ableto significantly expand its gold output as the yearprogresses, given that the company dealt with someseasonal issues in the first quarter, and will also benefitfrom incremental ounces from new projects coming on line
later in the year. As such, we think the firm will be able tocomfortably hit the top end of its 2012 production guidanceof 775,000 ounces. The increased production should alsohelp on the cost side as 2012 progresses, in our opinion.Meanwhile, Eldorado is making solid progress on itsnear-term projects, and we expect to see initial productionat two of these projects (Olympias and Eastern Dragon)sometime this year. We continue to believe that Eldorado’sshares represent an attractive buying opportunity at currentprices.�
Apr. 13, 2012 Eldorado Gold’s Update on Its Greek Mines Confirms Our Thesis
Eldorado Gold �reported updated mining plans Thursday forthe three projects it acquired through its December 2011purchase of European Goldfields, as well as for its legacyGreek mining project, Perama Hill. We think these updates,which entailed minimal schedule delays and only modestcapital cost inflation from prior studies, confirm our thesisthat Eldorado was able to scoop up some attractive assetsthrough its European Goldfields transaction at a bargainprice, thanks to misplaced concerns about Athens’ historicalenvironmental opposition to mining. As a result of the
announcement, Eldorado’s shares increased more than 12%on April 12 after the updated mining plans were released.� �We pegged Eldorado as being undervalued before therelease, and we think some of the easy upside hasdisappeared as a result of the strong share priceappreciation in response to the mining plan update.However, we still believe Eldorado’s shares have somemore room to run as the company successfully develops itsmultiple growth projects over the next few years.�
Feb. 24, 2012 Eldorado Meets Expectations in 4Q, Closes Acquisition of European Goldfields
Eldorado Gold enjoyed a good fourth quarter with healthyyear-over-year production gains and relatively tame costinflation. The much more important news, however, wasEldorado’s continued progress on its slate of developmentprojects, most notably at Perama Hill, as well as thesuccessful closing of its European Goldfields acquisition.After receiving overwhelming shareholder approval fromboth companies, Eldorado was able to close the transactionon February 24, 2012. We are encouraged by the promptclosing of this transaction as well as the absence of abidding war for European Goldfields, especially given that
we think Eldorado paid an attractive price for EuropeanGoldfields’ assets, at roughly $240 per reserve gold ounce.The three major development projects that Eldoradoacquired through this transaction, Skouries, Olympias, andCertej, are close to shovel-ready, as they have securedmost of the required permits and engineering studies.Eldorado expects to release a more detailed update onthese newly acquired assets during the second quarter of2012.� �For the quarter, Eldorado generated 169,000 gold ounces,
© 2012 Morningstar. All Rights Reserved. Unless otherwise provided in a separate agreement, you may use this report only in the country in which its original distributor is based. Data as originally reported.The information contained herein is not represented or warranted to be accurate, correct, complete, or timely. This report is for information purposes only, and should not be considered a solicitation to buy or sell any security.Redistribution is prohibited without written permission. To order reprints, call +1 312-696-6100. To license the research, call +1 312-696-6869.
ß ®

65
Eldorado Gold Corp EGO [NYSE] | QQQQTM
Last Price Fair Value Consider Buy Consider Sell Uncertainty Economic Moat Stewardship Morningstar Credit Rating Industry12.82 USD 19.00 USD 9.50 USD 33.25 USD Very High Narrow . Gold .
Analyst Notes (continued)
marking a 13% year-over-year increase thanks to theexpansion project at Kisladag and the start of production atEfemcukuru, which poured its first gold in June 2011 andachieved commercial production in December. Cash cost ofjust $418 per ounce during the quarter firmly situatesEldorado in the lowest quartile in the gold mining industryand is flat from the year-ago quarter. We anticipatecontinued production gains in 2012 as Efemcukurucontributes gold output for a full year and the company also
starts gold and silver production at its Eastern Dragonproject by the back half of the year. Eldorado is also doing agreat job filling the pipeline behind these near-termprojects, as the firm received approval on its preliminaryenvironmental impact statement for Perama Hill in February2012 and expects to secure construction and environmentalpermits for the project from the Greek government by theend of the year.�
Dec. 19, 2011 European Goldfields Is a Natural Fit for Eldorado, but Competing Bids Could Emerge
Eldorado Gold announced Monday that it has extended afriendly takeover offer for European Goldfields. Accordingto the terms of the offer, each share of European Goldfieldswould be swapped for 0.85 shares of Eldorado stock andCAD 0.0001 in cash, which values European Goldfields atCAD 13.08 per share based on Eldorado’s closing price onDec. 16. The total value of the offer is roughly $2.4 billionand represents a 48.4% premium for European Goldfieldsshareholders from the closing stock price on Dec. 5, whichwas the day before the firm announced it had receivedpreliminary takeover advances. We are placing our fairvalue estimate for Eldorado Gold under review as weassess its implication on the company’s valuation. � � �At first glance, we think this deal makes sense forEldorado. The company has long been viewed as a naturalsuitor for European Goldfields given the geographic overlapbetween the two miners’ assets in Greece and Turkey.Furthermore, European Goldfields’ mining assets tend to besmaller, low-cost projects that can be brought on linerelatively quickly, which fits Eldorado’s operationalpreference. European Goldfields currently has only onemine in operation: the Stratoni polymetallic mine innorthern Greece, which generates modest amounts ofsilver, zinc, and lead. However, the firm also has three
advanced-stage gold projects in its pipeline, including theSkouries and Olympias projects in Greece and the Certejproject in Romania. All three projects will require onlymodest initial capital expenditures to bring on line, andpromise to be low cash-cost producers. While the financialturmoil in Greece might scare some investors away, wethink that it actually helps mining companies as the Greekgovernment would welcome the job creation and additionaltax revenue that would accompany mine construction andoperation. For example, the current environmental ministerin Greece, George Papaconstantinou, used to serve as thecountry’s finance minister, which could help expedite themine permitting process. �� � � �Under the proposed terms, Eldorado would be acquiringEuropean Goldfields’ 10.1 million ounces of gold reserves atroughly $240 per ounce, which is cheap compared to recenttakeover prices within the gold mining space. However, thelow price Eldorado would be paying could lead to theemergence of competing bids for European Goldfields. Priorto Eldorado’s announcement, Centerra Gold was alsorumored to be in negotiation with European Goldfields, andwe think the list of interested parties could extend wellpast those two firms. While there are far greater
© 2012 Morningstar. All Rights Reserved. Unless otherwise provided in a separate agreement, you may use this report only in the country in which its original distributor is based. Data as originally reported.The information contained herein is not represented or warranted to be accurate, correct, complete, or timely. This report is for information purposes only, and should not be considered a solicitation to buy or sell any security.Redistribution is prohibited without written permission. To order reprints, call +1 312-696-6100. To license the research, call +1 312-696-6869.
ß ®

66
Eldorado Gold Corp EGO [NYSE] | QQQQTM
Last Price Fair Value Consider Buy Consider Sell Uncertainty Economic Moat Stewardship Morningstar Credit Rating Industry12.82 USD 19.00 USD 9.50 USD 33.25 USD Very High Narrow . Gold .
Analyst Notes (continued)
opportunities for synergies between European Goldfieldsand Eldorado given their Greece connection, we believe thefavorable bullion price environment means that juniors withlow-cost assets such as European Goldfields remainattractive to a host of larger producers even if nogeographic overlap exists. We should recall that inSeptember 2010, Eldorado’s bid for Andean Resources wastrumped by a higher bid from Goldcorp�(see our StockAnalyst Note published Sept. 3, 2010, "Goldcorp Sweeps inWith a CAD 3.6 billion Bid for Andean Resources").�Asimilar situation regarding the European Goldfields bid
cannot be ruled out. �Any competing bid would have to beat least 3% higher than Eldorado’s (given the CAD 75million breakup fee) to make financial sense for EuropeanGoldfields. The two companies have scheduled shareholdervoting on the deal for mid-February of 2012. At first glance,we see this transaction as a sound move for Eldorado,especially if competing bids that drive up the purchaseprice fail to materialize. However, until we can performmore detailed due diligence on European Goldfields’ assets,we cannot yet quantify its valuation impact for Eldorado.�
© 2012 Morningstar. All Rights Reserved. Unless otherwise provided in a separate agreement, you may use this report only in the country in which its original distributor is based. Data as originally reported.The information contained herein is not represented or warranted to be accurate, correct, complete, or timely. This report is for information purposes only, and should not be considered a solicitation to buy or sell any security.Redistribution is prohibited without written permission. To order reprints, call +1 312-696-6100. To license the research, call +1 312-696-6869.
ß ®
Disclaimers & DisclosuresNo Morningstar employees are officers or directors of this company. Morningstar Inc. does not own more than 1% of the shares of this company. Analystscovering this company do not own its stock. The information contained herein is not represented or warranted to be accurate, correct, complete, or timely.This report is for information purposes only, and should not be considered a solicitation to buy or sell any security.

67
Morningstar Stock Data Sheet Pricing data thru May 07, 2012 Rating updated as of May 07, 2012Pricing data thru May 07, 2012 Rating updated as of May 07, 2012 Fiscal year-end: December
Eldorado Gold Corp EGO Sales USD Mil Mkt Cap USD Mil Industry Sector1,099 9,120 Gold
Basic Materials
TMMorningstar Rating Last Price Fair Value Uncertainty Economic Moat Stewardship GradeQQQQ 12.82 19.00 Very High Narrow .
per share prices in USD
2002 2003 2004 2005 2006 2007 2008 2009 2010 2011 YTD
1.0
3.0
6.0
14.0
1.1 3.0
3.901.15
3.611.95
5.382.02
6.173.82
7.163.25
9.342.38
14.826.44
20.2311.39
22.1212.84
15.7412.44
Annual Price HighLowRecent Splits
Price VolatilityMonthly High/LowRel Strength to S&P 500
52 week High/Low22.12 - 12.44
10 Year High/Low22.12 - 1.15
Bear-Market Rank5 (10=worst)
Trading Volume Million
Stock Performance
Eldorado Gold, based in Vancouver, is a gold-miningcompany active in development and exploration in Turkey,China, Greece, and Brazil. The company’s largest goldproducer is its Kisladag mine in western Turkey. The firmalso operates several gold mines and development projectsin China, as well as the Vila Nova iron ore mine in Brazil.Eldorado produced more than 650,000 ounces of gold in 2011at total unit cash costs of $472 per ounce.
550 Burrard Street Suite 1188, Bentall 5Vancouver, BC V6C 2B5Phone: 1 604 687-4018Website: http://www.eldoradogold.com
Growth Rates Compound AnnualGrade: A 1 Yr 3 Yr 5 Yr 10 Yr
Revenue % 38.9 56.2 67.0 41.4Operating Income % 70.2 62.5 177.1 .Earnings/Share % 52.6 8.0 125.3 .Dividends % 136.4 . . .
Book Value/Share % 9.0 40.0 38.4 23.2Stock Total Return % -18.7 15.0 16.5 .+/- Industry 2.0 9.5 13.4 .+/- Market -20.3 0.3 18.4 .
Profitability AnalysisGrade: D Current 5 Yr Avg Ind Mkt
Return on Equity % 10.2 11.7 6.5 22.2Return on Assets % 8.2 9.4 4.2 9.3Fixed Asset Turns 0.4 0.4 0.5 7.5Inventory Turns 3.0 1.8 4.4 16.8Revenue/Employee USD K 205.5 173.4 . 1035.3
Gross Margin % 57.3 62.9 45.2 40.1Operating Margin % 46.7 39.4 26.3 18.9Net Margin % 29.0 31.8 14.1 11.3Free Cash Flow/Rev % 21.8 . 8.4 0.1R&D/Rev % . . . 9.4
*
*3Yr Avg data is displayed in place of 5Yr Avg
Financial PositionGrade: 12-10 USD Mil 12-11 USD Mil
Cash 314 394Inventories 147 164Receivables 42 20
Current Assets 565 658
Fixed Assets 2794 2848Intangibles 366 366
Total Assets 3780 3960
Payables . 107Short-Term Debt 99 81
Current Liabilities 254 249Long-Term Debt 68 0
Total Liabilities 813 706
Total Equity 2967 3255
2002 2003 2004 2005 2006 2007 2008 2009 2010 2011 TTM FinancialsRevenue USD Mil39 38 36 34 85 189 288 361 791 1099 1099Gross Margin %51.6 40.9 9.6 -4.7 45.9 61.5 68.1 63.3 64.3 57.3 57.3Oper Income USD Mil5 -3 -14 -34 3 58 120 145 301 513 513Operating Margin %13.2 -9.0 -40.0 -99.7 3.7 30.5 41.5 40.3 38.1 46.7 46.7
Net Income USD Mil2 -45 -14 -49 3 35 164 102 206 319 319
Earnings Per Share USD0.01 -0.20 -0.05 -0.17 0.01 0.10 0.46 0.26 0.38 0.58 0.58Dividends USD. . . . . . . . 0.05 0.11 0.11Shares Mil148 222 258 284 339 345 356 392 546 552 552Book Value Per Share USD. 0.60 0.75 0.81 1.31 1.31 2.15 4.92 5.40 5.90 4.58
Oper Cash Flow USD Mil9 4 -10 -14 -23 70 106 192 292 512 512Cap Spending USD Mil-8 -13 -23 -89 -95 -94 -124 -107 -226 -273 -273Free Cash Flow USD Mil2 -9 -34 -103 -118 -25 -18 85 66 239 239
Valuation AnalysisCurrent 5 Yr Avg Ind Mkt
Price/Earnings 22.1 40.5 22.7 15.1Forward P/E 14.2 . . 13.8Price/Cash Flow 13.8 26.8 9.3 7.9Price/Free Cash Flow 29.6 . 48.5 17.7Dividend Yield % 1.2 . 1.5 2.0Price/Book 2.8 3.4 1.6 2.2Price/Sales 6.4 11.1 3.4 1.3PEG Ratio 3.1 . . 1.8
Total Return %. . -8.1 66.1 10.2 7.4 37.1 78.2 31.4 -25.3 -5.8+/- Market. . -17.1 63.1 -3.4 3.9 75.6 54.8 18.6 -25.3 -14.7+/- Industry. . 2.7 35.9 0.6 -6.4 54.0 49.5 2.1 -11.0 9.3
Dividend Yield %. . . . . . . . 0.3 0.8 1.2Market Cap USD Mil. 815 815 1354 1634 1996 2928 7611 10180 7563 9120
2002 2003 2004 2005 2006 2007 2008 2009 2010 2011 TTM ProfitabilityReturn on Assets %1.7 -28.9 -7.0 -18.0 0.8 6.3 21.9 4.7 5.7 8.2 8.2Return on Equity %2.2 -33.0 -7.7 -22.8 1.1 8.4 26.4 6.0 7.3 10.2 10.2
Net Margin %5.4 . -38.8 . 3.9 18.8 56.8 28.4 26.0 29.0 29.0Asset Turnover0.31 0.25 0.18 0.12 0.20 0.34 0.39 0.17 0.22 0.28 0.28Financial Leverage1.2 1.1 1.1 1.4 1.3 1.3 1.1 1.3 1.3 1.2 1.2
2002 2003 2004 2005 2006 2007 2008 2009 2010 2011 12-11 Financial HealthWorking Capital USD Mil37 107 144 30 102 98 185 273 311 409 409Long-Term Debt USD Mil7 . . 51 51 0 . 135 68 0 0Total Equity USD Mil119 153 207 225 396 449 792 2641 2967 3255 3255Debt/Equity0.06 . . 0.23 0.13 0.00 . 0.05 0.02 . 0.01
2002 2003 2004 2005 2006 2007 2008 2009 2010 2011 TTM ValuationPrice/Earnings. . . . . 58.1 17.3 54.6 48.8 23.6 22.1P/E vs. Market. . . . . . . . . 1.3 1.5Price/Sales. 18.6 21.1 39.8 20.9 10.6 9.8 15.4 12.8 6.9 6.4Price/Book. 5.3 3.9 6.0 4.1 4.4 3.7 2.9 3.4 2.3 2.8Price/Cash Flow. . . . . 28.6 26.8 28.9 34.7 14.8 13.8
Quarterly ResultsRevenue
Rev Growth
Earnings Per Share
USD Mil Mar 11 Jun 11 Sep 11 Dec 11
% Mar 11 Jun 11 Sep 11 Dec 11
USD Mar 11 Jun 11 Sep 11 Dec 11
Most Recent Period 218.1 251.4 326.1 303.4Prior Year Period 182.2 207.8 190.3 212.9
Most Recent Period 19.7 21.0 71.3 42.5Prior Year Period 247.6 158.0 130.4 46.7
Most Recent Period 0.10 0.14 0.19 0.16Prior Year Period 0.10 0.11 0.09 0.08
Industry Peers by Market Cap
Major Fund Holders
Mkt Cap USD Mil Rev USD Mil P/E ROE%
% of shares
Eldorado Gold Corp 9120 1099 22.1 10.2Yamana Gold, Inc. 10324 2257 18.1 7.7Agnico-Eagle Mines 6613 1878 . -15.3
.
.
.
TTM data based on rolling quarterly data if available; otherwise most recent annual data shown.
© 2012 Morningstar. All Rights Reserved. Unless otherwise provided in a separate agreement, you may use this report only in the country in which its original distributor is based. Data as originally reported. The information contained herein is not represented or warranted to be accurate, correct, complete, or timely. This report is for information purposes only, and should not be considered a solicitation to buy or sell any security. Redistribution is prohibited without written permission. To order reprints, call +1 312-696-6100. To license the research, call +1 312-696-6869. ß
®

68
Morningstar’s Approach to Rating Stocks
Our Key Investing ConceptsEconomic Moat Rating��Discounted Cash Flow��Discount Rate��Fair Value��Uncertainty��Margin of Safety��Consider Buying/Consider Selling��Stewardship Grades��
TMAt Morningstar, we evaluate stocks as pieces of abusiness, not as pieces of paper. We think that purchasingshares of superior businesses at discounts to theirintrinsic value and allowing them to compound their valueover long periods of time is the surest way to createwealth in the stock market. We rate stocks 1 through 5 stars, with 5 the best and 1the worst. Our star rating is based on our analyst’sestimate of how much a company’s business is worth pershare. Our analysts arrive at this "fair value estimate" byforecasting how much excess cash--or "free cashflow"--the firm will generate in the future, and thenadjusting the total for timing and risk. Cash generatednext year is worth more than cash generated several yearsdown the road, and cash from a stable and consistentlyprofitable business is worth more than cash from acyclical or unsteady business. Stocks trading at meaningful discounts to our fair valueestimates will receive high star ratings. For high-qualitybusinesses, we require a smaller discount than formediocre ones, for a simple reason: We have moreconfidence in our cash-flow forecasts for strongcompanies, and thus in our value estimates. If a stock’smarket price is significantly above our fair value estimate,it will receive a low star rating, no matter how wonderfulwe think the business is. Even the best company is a baddeal if an investor overpays for its shares. Our fair value estimates don’t change very often, butmarket prices do. So, a stock may gain or lose stars based
just on movement in the share price. If we think a stock’sfair value is $50, and the shares decline to $40 withoutmuch change in the value of the business, the star ratingwill go up. Our estimate of what the business is worthhasn’t changed, but the shares are more attractive as aninvestment at $40 than they were at $50. Because we focus on the long-term value of businesses,rather than short-term movements in stock prices, at timeswe may appear out of step with the overall stock market.When stocks are high, relatively few will receive ourhighest rating of 5 stars. But when the market tumbles,many more will likely garner 5 stars. Although you mightexpect to see more 5-star stocks as the market rises, wefind assets more attractive when they’re cheap. We calculate our star ratings nightly after the marketsclose, and issue them the following business day, which iswhy the rating date on our reports will always be theprevious business day. We update the text of our reportsas new information becomes available, usually about onceor twice per quarter. That is why you’ll see two dates onevery Morningstar stock report. Of course, we monitormarket events and all of our stocks every business day, soour ratings always reflect our analyst’s current opinion. Economic Moat Rating The Economic Moat Rating is our assessment of a firm’sability to earn returns consistently above its cost of capitalin the future, usually by virtue of some competitiveadvantage. Competition tends to drive down such
TM
TM
Morningstar ResearchMethodology for ValuingCompanies QQQQQCompetitive Economic Company Fair Value Uncertainty
Analysis Moat Rating Valuation Estimate AssessmentTM
Analyst conducts The depth of the Analyst considers DCF model leads to An uncertaintycompany and industry firm’s competitive company financial the firm’s Fair Value assessmentresearch: advantage is rated: statements and Estimate, which establishes the� � competitive position anchors the rating margin ofManagement None to forecast future framework. safety required forinterviews Narrow cash flows. the stock rating.Conference calls Wide �Trade-show visits Assumptions areCompetitor, supplier, input into a dis-distributor, and counted cash-flowcustomer interviews model.
The current stockprice relative to fairvalue, adjustedfor uncertainty,determines therating.
QQQQQQQQQQQQQQQ
© 2012 Morningstar. All Rights Reserved. Unless otherwise provided in a separate agreement, you may use this report only in the country in which its original distributor is based. Data as originally reported.The information contained herein is not represented or warranted to be accurate, correct, complete, or timely. This report is for information purposes only, and should not be considered a solicitation to buy or sell any security.Redistribution is prohibited without written permission. To order reprints, call +1 312-696-6100. To license the research, call +1 312-696-6869.
ß ®

69
?
General Motors Co GM [NYSE] | QQQQQTM
Last Price Fair Value Consider Buy Consider Sell Uncertainty Economic Moat Stewardship Morningstar Credit Rating Industry22.41 USD 48.00 USD 28.80 USD 74.40 USD High None . Auto Manufacturers .
Currency amounts expressed with "$"are in U.S. dollars (USD) unlessotherwise denoted.
GM’s First-Quarter Beat Not Enough to Keep Stock Up inBroad Auto Sell-Off
by David Whiston, CFA, CPA, CFESenior AnalystAnalysts covering this company do notown its stock.
Pricing data through May 07, 2012.Rating updated as ofMay 07, 2012.
08 09 10 11 12
20.0
29.0
Stock Price
Analyst Note May 03, 2012 General Motors Company�reported first-quarter resultsThursday that beat Street expectations. We see no reasonto change our investment thesis based on the results, sowe are�leaving�our fair value estimate in place. Adjustedearnings per diluted share came in at $0.93 andconsolidated revenue was $37.8 billion. Both figures beatconsensus estimates of $0.85 and $37.6 billion. The onlyspecial items this quarter were a $590 million GM Europe(GME) goodwill-impairment charge and a $22 milliongoodwill-impairment charge in GM International (GMIO).Revenue increased 4.3% year over year, while automotiverevenue increased 4%. Adjusted EBIT came in at justunder $2.2 billion compared with $2.0 billion in the firstquarter of 2011, while adjusted EBIT margin increased 20basis points year over year to 5.8%. All segments wereprofitable except for GME, which posted an adjusted lossof $256 million compared with a $5 million profit in theprior year’s quarter. The only good news for GME was thatthe loss is about half of what it was in the fourth quarterof 2011 and about the same as the third quarter. Thiscould suggest that Europe is bottoming out; but even if itis the bottom, we do not expect major improvement forGME this year. Management still has not given furtherdetail on its plans to overhaul GME, so we continue toexpect an announcement or series of announcements laterthis year. At the consolidated level, an approximate $400 millionpositive year-over-year contribution from volume andabout an $800 million contribution from pricing offsethigher costs and an unfavorable mix contribution, resultingin the approximate $200 million year-over-year adjustedEBIT increase. GM North America, the most criticalsegment for GM, posted solid results with adjusted EBITup 35% year over year to nearly $1.7 billion and adjustedEBIT margin up 130 basis points to 7%. Strongcontributions from higher volume and pricing comfortablyoffset negative contributions in mix and costs. The
approximately $300 million in higher costs came from$200 million of reduced pension income due to a lowerreturn assumption now in place and from $100 million ofcosts to buy out 1,400 skilled workers. The payback periodon this attrition program is slightly over one year.Management also gave second- and third-quarterguidance for GMNA results to be "comparable" withfirst-quarter numbers. Other good news is that onTuesday, GM in its April sales release announced anincrease in its 2012 U.S. light vehicle sales forecast to 14million-14.5 million vehicles, up from 13.5 million-14million. Our only concern for GMNA is that the ratio ofGM’s percentage of its U.S. retail incentives as apercentage of average transaction price divided by thatsame percentage for the industry has crept up above 1.0as the year has unfolded, reaching 1.15 in April. Althoughthis ratio is lower than during the company’s incentivebinge in January and February 2011 (1.25 and 1.22,respectively), management’s long-stated intention is tohave this ratio be about 1.0 for a year, so we expect thisratio to decline in the future. On a unit basis, GM’s U.S.incentives are down $360 year over year. GMIO did see margin decline of 100 bps, excluding jointventures, to 2.1%, and Chinese JV margin declined 180bps to 10.2%. GM China’s volume was excellent, however,during the quarter and well outperformed the industry. Thecompany had record sales volume in China in the quarter,and its market share increased 150 bps to 15.1%. Marginsshould also improve over the next several years in Chinaas Chinese Cadillac production ramps up starting this year.GM’s goal over the next three to five years is for ChineseCadillac production to be 150,000-180,000 units a year.GMIO’s equity income, which is mostly GM China, wasonly up slightly year over year to $421 million. GM SouthAmerica (GMSA) posted a 20 bps decline in margin to2.1%. Profit was roughly flat year over year, but theseresults are significantly improved from the negative 5.4%margin in the fourth quarter. We expect growth in profitsin GMSA as 2012 unfolds thanks to new product launches.Good news also came out of GM Financial, which grew itspretax earnings 39.2% from 1Q 2011 to $181 million andsaw meaningful year-over-year declines in delinquencies

70
General Motors Co GM [NYSE] | QQQQQTM
Last Price Fair Value Consider Buy Consider Sell Uncertainty Economic Moat Stewardship Morningstar Credit Rating Industry22.41 USD 48.00 USD 28.80 USD 74.40 USD High None . Auto Manufacturers .
Analyst Notes (continued)
share. Still, we remain very optimistic about the long-termprospects of the new GM, so we are leaving our fair valueestimate in place. However, as always, we will reassess allof our valuation model inputs after the company files its10-K later this month. Revenue came in at $38 billion, up3% year over year, but missed Street expectations of $38.2billion. GAAP net income attributable to commonstockholders was $472 million, or $0.28 per share. Theseresults include $0.11 per share of special charges, however,so the adjusted $0.39 per share missed consensus by $0.02.Special items consisted of a $749 million gain related tothe establishment of a health-care trust for the CanadianAuto Workers union, a $400 million gain for reversal of adeferred tax asset valuation allowance in Australia, a $63million gain on debt extinguishment, a $621 milliongoodwill impairment charge for GM Europe, a $258 milliongoodwill impairment for GM International (GMIO), and a$555 million impairment on GM’s investment in AllyFinancial common stock. Adjusted EBIT came in at $1.1billion, up from $1 billion in the fourth quarter of 2010,while adjusted automotive EBIT margin barely improved to2.9% from 2.7% in the prior year’s quarter.� �Geographic results were disappointing other than in NorthAmerica (GMNA), which saw its adjusted EBIT rise to $1.5billion from about $800 million in the year-ago quarter.GMNA did well thanks to a $1.3 billion improvement involume, pricing, and cost reductions offsetting a $600million unfavorable mix variance. The unit’s EBIT marginimproved to 6.5% from 3.4% in the fourth quarter of 2010while capacity utilization improved to 93% from 89.5% infourth quarter 2010. The only good thing to say about GMEurope is that the $562 million loss was about flat with theprior year’s quarter (EBIT before restructuring declinedabout $100 million year over year). GMIO EBIT marginexcluding China declined 60 basis points year over year to1.5%, while GM South America’s margin fell to negative5.4% from positive 4.4% in the prior year’s quarter. Itappears the company has not yet been able to recoup
development costs in South America, but we continue toexpect improvement in 2012 and 2013 as GM’s outdatedlineup is replaced. GM South America will launch sevennew models in 2012. This refresh is badly needed, but weexpect it to be several more quarters before meaningfulEBIT improvement occurs in this segment.� �The balance sheet remains in great shape, with totalautomotive liquidity of $37.5 billion at year-end, $31.6billion of which is cash and investments. We calculateautomotive net cash to be nearly $26.4 billion, or about $14per share. We calculate consolidated net cash per shareincluding the captive finance arm, GM Financial, to be$9.63. The U.S. pension plan finished the year 88% fundedcompared with 89% funded at the end of 2010. U.S. planunderfunding at the end of 2011 was $13.3 billion(excluding a $900 million nonqualified plan projectedbenefit obligation, or PBO) compared with $11.5 billion atthe end of 2010. The non-U.S. plan finished 2011 $11.2billion underfunded compared with $9.9 billion at the end of2010. The U.S. plan’s actual 2011 return was an impressive11.1% thanks to the strong rise in U.S. Treasury pricesthroughout the year.� �GM also announced several changes to its pension. First,effective September 30, the company will freeze the planfor all salaried U.S. plan participants hired before 2001.Starting October 1, these participants will join the salariedworkers hired from 2001 onward in having a 401(k) plan. Noexact amount of PBO reduction was given, but over timethis move will help management achieve its goal ofde-risking the plan since these workers will not earn futurepension benefits after September. The U.S. plan’s expectedreturn was reduced significantly to 6.2% from 8% in 2011,which we think is the right move, as 8% is probably toohigh. The plan’s discount rate also declined 80 bps in 2011,which alone increased the underfunding by $8.4 billion.Also noteworthy is a large change in asset allocation in theU.S. plan toward fixed income. The target is now 66% of
© 2012 Morningstar. All Rights Reserved. Unless otherwise provided in a separate agreement, you may use this report only in the country in which its original distributor is based. Data as originally reported.The information contained herein is not represented or warranted to be accurate, correct, complete, or timely. This report is for information purposes only, and should not be considered a solicitation to buy or sell any security.Redistribution is prohibited without written permission. To order reprints, call +1 312-696-6100. To license the research, call +1 312-696-6869.
ß ®

71
General Motors Co GM [NYSE] | QQQQQTM
Last Price Fair Value Consider Buy Consider Sell Uncertainty Economic Moat Stewardship Morningstar Credit Rating Industry22.41 USD 48.00 USD 28.80 USD 74.40 USD High None . Auto Manufacturers .
Analyst Notes (continued)
plan assets compared with 41% at year-end 2010. Thischange was likely done to better duration match the plan’sassets to its liabilities, which we again see as consistentwith management’s de-risking objective. Although thismove is concerning given that U.S. interest rates will likelyonly go up in the long run from their current ultra-lowlevels, management expects the eventual increase in ratesto also lower the PBO enough to make up for declines inbond prices.� �Management gave short and vague 2012 outlook commentsin the press release. Market share is expected to be flatcompared with 2011, but industry volume, GM’s volume,
and GM’s average selling prices are all expected toincrease. Mix will be unfavorable, which is likely due to anexpectation of more small cars being sold as gas pricesincrease and because of increasing sales in emergingmarkets. Costs are expected to be roughly flat from 2011while capital expenditure will be about $8 billion, up from$6.2 billion in 2011. This higher amount is not concerning tous since guidance since the IPO has been for normal capitalexpenditures each year of $7 billion-$8 billion. We stress toinvestors that we see 2012 as the final transition year forthe new GM to get up to full speed, other than problems inEurope. GM’s new generation of full�
Feb. 16, 2012 GM’s 4Q Misses Consensus
General Motors Company��reported fourth-quarter resultsThursday that missed consensus by $0.02 per diluted share.Revenue came in at $38 billion, up 3% year over year, butmissed Street expectations of $38.2 billion. GAAP netincome attributable to common stockholders was $472million, or $0.28 per share. These results include $0.11 pershare of special charges, however, so the adjusted $0.39per share missed consensus by $0.02. Special itemsconsisted of a $749 million gain related to theestablishment of a health-care trust for the Canadian AutoWorkers union, a $400 million gain for reversal of adeferred tax asset valuation allowance in Australia, a $63million gain on debt extinguishment, a $621 milliongoodwill impairment charge for GM Europe, a $258 milliongoodwill impairment for GM International (GMIO), and a$555 million impairment on GM’s investment in AllyFinancial common stock. Adjusted EBIT came in at $1.1billion, up from $1 billion in the fourth quarter of 2010. � �Geographic results were disappointing other than in NorthAmerica (GMNA), which saw its adjusted EBIT rise to $1.5billion from about $800 million in the year-ago quarter.
GMNA did well thanks to a $1.3 billion improvement involume, pricing, and cost reductions offsetting a $600million unfavorable mix variance. The unit’s EBIT marginimproved to 6.5% from 3.4% in the fourth quarter of 2010.The only good thing to say about GM Europe is that the$562 million loss was about flat with the prior year’squarter (EBIT before restructuring declined about $100million year over year). GMIO margins excluding Chinadeclined 60 basis points year over year to 1.5%, while GMSouth America’s margins fell to negative 5.4% frompositive 4.4% in the prior year’s quarter. It appears thecompany has not yet been able to recoup developmentcosts in South America.� �The balance sheet remains in great shape, with totalautomotive liquidity of $37.5 billion at year-end, $31.6billion of which is cash and investments. The U.S. pensionplan finished the year 88% funded compared with 89%funded at the end of 2010. U.S. plan underfunding at theend of 2011 was $13.3 billion (excluding a $900 millionnonqualified plan projected benefit obligation) comparedwith $11.5 billion at the end of 2010. Non-U.S. plan
© 2012 Morningstar. All Rights Reserved. Unless otherwise provided in a separate agreement, you may use this report only in the country in which its original distributor is based. Data as originally reported.The information contained herein is not represented or warranted to be accurate, correct, complete, or timely. This report is for information purposes only, and should not be considered a solicitation to buy or sell any security.Redistribution is prohibited without written permission. To order reprints, call +1 312-696-6100. To license the research, call +1 312-696-6869.
ß ®

72
General Motors Co GM [NYSE] | QQQQQTM
Last Price Fair Value Consider Buy Consider Sell Uncertainty Economic Moat Stewardship Morningstar Credit Rating Industry22.41 USD 48.00 USD 28.80 USD 74.40 USD High None . Auto Manufacturers .
Analyst Notes (continued)
underfunding finished 2011 $11.2 billion underfundedcompared with $9.9 billion underfunded at the end of 2010.
We will publish another note after the earnings call.�
Nov. 09, 2011 GM Reports Third-Quarter Results: Our Thesis Is Still In Place, but Investors Must Be Patient
General Motors Company��reported third-quarter resultsWednesday that significantly beat consensus. These resultsgive us no reason to change our investment thesis, and weare not changing our fair value estimate. The market soldoff GM’s stock hard Wednesday morning, which likely wasdue to contagion fears after Italy’s 10-year bond yieldexceeded 7%. Although the European debt crisis is aserious matter, we remind investors that the vast majorityof GM’s operating and equity earnings come from theUnited States and China. A European contagion eventwould, in our opinion, only delay the inevitable recovery inannual U.S. auto sales to 16 million-17 million units. U.S.industry sales likely will end the year at around 12.7 to 12.8million, up from 11.6 million in 2010.� �As for the third quarter, there were no special items, anddiluted earnings per share to common shareholders of$1.03 easily beat consensus expectations of $0.96.Revenue increased 7.6% year over year to $36.7 billion.Although vehicle volume increased in all four geographicsegments compared with the year-ago quarter, EBITdeclined slightly to $2.2 billion from $2.3 billion as risingcosts of $400 million (mostly engineering and marketing)roughly offset $400 million of favorable variance fromimproved pricing. Volume and mix contribution was $0 forthe quarter compared with the third quarter of 2010, andGM North America’s (GMNA) EBIT only increased by about$100 million to $2.2 billion. GMNA did see an unfavorablemix variance of $170 million due to more compact vehiclesthan last year’s third quarter when the Chevrolet Cruze wasjust launching. The company also announced that it will notmeet its goal of GM Europe (GME) breaking even on anadjusted EBIT basis, citing "deteriorating economic
conditions," which also likely led to the stock’s sell-off.Europe posted negative EBIT of $292 million, animprovement from a $559 million loss in the prior year’squarter. � �GM International Operations (GMIO) saw its EBIT, includingChinese joint ventures, decline 29% to $365 million. Higherincentives for commercial mini-vehicles in China as well aslaunch costs for the new Baojun small car brand in WesternChina drove Chinese joint-venture margin down 130 basispoints year over year to 10.5%. Over time, we see Chinacontinuing to post excellent earnings for GM across manyvehicle segments. Earnings should improve long term as theworld’s largest auto market continues to grow. GM alsoshould benefit from increasing its market share and localparts sourcing once it starts Cadillac production in China inthird-quarter 2012. � �GM South America’s (GMSA) EBIT declined to a negative$44 million from a positive $163 million. Management citedinflationary pressure in this market from labor andmaterials, which offset favorable pricing improvements inVenezuela and Argentina. Chairman and CEO Dan Akersonreferred to this quarter’s GME and GMSA results asunsustainable and unacceptable and the company willcontinue to seek head count reductions and processimprovements to lower these divisions’ break-even points.As discussed in prior quarters, GMSA has seven newproducts coming to market in 2012 and just launched theCruze and new Cobalt this year. Thus, we expect morelaunch costs to initially weigh down GMSA’s results forsome time as these launches need time to generate scaleto recoup investment costs. �
© 2012 Morningstar. All Rights Reserved. Unless otherwise provided in a separate agreement, you may use this report only in the country in which its original distributor is based. Data as originally reported.The information contained herein is not represented or warranted to be accurate, correct, complete, or timely. This report is for information purposes only, and should not be considered a solicitation to buy or sell any security.Redistribution is prohibited without written permission. To order reprints, call +1 312-696-6100. To license the research, call +1 312-696-6869.
ß ®

73
General Motors Co GM [NYSE] | QQQQQTM
Last Price Fair Value Consider Buy Consider Sell Uncertainty Economic Moat Stewardship Morningstar Credit Rating Industry22.41 USD 48.00 USD 28.80 USD 74.40 USD High None . Auto Manufacturers .
Analyst Notes (continued)
�GM Financial posted good results with EBIT of $178 millionand the unit’s best EBIT margin of the year at 45.5%. Weexpect the captive finance arm to continue increasing GM’sleasing sales mix each quarter going forward. In the thirdquarter, leasing was 11.4% of GM’s U.S. sales compared to20.6% for the industry. We expect GM’s leasing percentageeventually to be much closer to the industry average, whichshould boost market share and pricing as longas�consumers remain willing to pay up for its vehicles.� �The balance sheet remains a fortress with $38.8 billion intotal auto liquidity as of� Sept, 30. This included $33 billionof cash and securities, and short-term and long-term autodebt of just $4.2 billion. Automotive free cash flowgeneration for the quarter totaled $300 million. On Nov. 8,GM announced that it received legal approval to set up aretiree health-care trust for its Canadian hourly retirees.The independent Canadian Healthcare Trust (HCT) will worksimilar to the VEBA in the United States and becameeffective Oct. 31. At that time, GM eliminated CAD 3 billionin other postemployment benefit liabilities and met itsfunding obligation to the HCT with a CAD 800 million cash
payment and by issuing a CAD 1.1 billion note. Thecompany says it will record an $800 million noncash gain inthe fourth quarter from this transaction. Annual cashsavings will be about $100 million, before interest costs onthe new note. We see this announcement as great news forGM because it meets a CAD 3 billion obligation with CAD1.9 billion of cash and debt. GM Canada has no furtherobligation on these retiree health-care claims goingforward.� �Although its third-quarter results arrive amid very badmacroeconomic news, GM still has room to continuecutting costs and increasing its economies of scale. Theturnaround story at GM is not complete, and we thinkinvestors will need further patience to realize a satisfactoryprofit. As U.S. auto sales increase, we expect GM to reportoutstanding profits and free cash flow generation. We alsocontinue to expect the U.S. Treasury to exit most, if not all,of its GM holdings before the presidential election.Although this exit could occur by a large one-time dumpingof shares onto the market, the event itself would finallyrelieve the stock of a major overhang.�
Nov. 09, 2011 First Impression of GM’s 3Q
General Motors Company��reported third-quarter resultsWednesday that significantly beat consensus. These resultsgive us no reason to change our investment thesis, and wedo not expect to change our fair value estimate. GM’s stockwas being sold off hard in premarket trading, which is likelydue to fears after Italy’s 10-year bond yield exceeded 7%today. Although the European debt crisis is a seriousmatter, we remind investors that nearly all of GM’soperating and equity earnings come from North Americaand China. A European contagion event would, in ouropinion, only delay the inevitable recovery in U.S. autosales to 16 million-17 million units. �
�As for the quarter, there were no special items and dilutedearnings per share to common shareholders of $1.03 easilybeat consensus expectations of $0.96. Revenue increased7.6% year over year to $36.7 billion. Although vehiclevolume increased in all four geographic segmentscompared with the year-ago quarter, EBIT declined slightlyto $2.2 billion from $2.3 billion as rising costs (probablycommodity-driven) of $400 million roughly offset $400million of favorable variance from improved pricing. Volumeand mix contribution was $0 for the quarter compared withthe third quarter of 2010 and GM North America EBIT only
© 2012 Morningstar. All Rights Reserved. Unless otherwise provided in a separate agreement, you may use this report only in the country in which its original distributor is based. Data as originally reported.The information contained herein is not represented or warranted to be accurate, correct, complete, or timely. This report is for information purposes only, and should not be considered a solicitation to buy or sell any security.Redistribution is prohibited without written permission. To order reprints, call +1 312-696-6100. To license the research, call +1 312-696-6869.
ß ®

74
General Motors Co GM [NYSE] | QQQQQTM
Last Price Fair Value Consider Buy Consider Sell Uncertainty Economic Moat Stewardship Morningstar Credit Rating Industry22.41 USD 48.00 USD 28.80 USD 74.40 USD High None . Auto Manufacturers .
Analyst Notes (continued)
increased $100 million to $2.2 billion. The company alsoannounced that it will not meet its goal of GM Europebreaking even on an adjusted EBIT basis, citing"deteriorating economic conditions." Although these resultscome as there is very bad macroeconomic news, GM still
has room to continue to cut costs and increase itseconomies of scale. The turnaround story at GM is notcomplete, and we think will take further patience forinvestors to realize a satisfactory profit.�
© 2012 Morningstar. All Rights Reserved. Unless otherwise provided in a separate agreement, you may use this report only in the country in which its original distributor is based. Data as originally reported.The information contained herein is not represented or warranted to be accurate, correct, complete, or timely. This report is for information purposes only, and should not be considered a solicitation to buy or sell any security.Redistribution is prohibited without written permission. To order reprints, call +1 312-696-6100. To license the research, call +1 312-696-6869.
ß ®
Disclaimers & DisclosuresNo Morningstar employees are officers or directors of this company. Morningstar Inc. does not own more than 1% of the shares of this company. Analystscovering this company do not own its stock. The information contained herein is not represented or warranted to be accurate, correct, complete, or timely.This report is for information purposes only, and should not be considered a solicitation to buy or sell any security.

75
Morningstar Stock Data Sheet Pricing data thru May 07, 2012 Rating updated as of May 07, 2012Pricing data thru May 07, 2012 Rating updated as of May 07, 2012 Fiscal year-end: December
General Motors Co GM Sales USD Mil Mkt Cap USD Mil Industry Sector151,841 35,091 Auto
Manufacturers Consumer Cyclical
TMMorningstar Rating Last Price Fair Value Uncertainty Economic Moat Stewardship GradeQQQQQ 22.41 48.00 High None .
per share prices in USD
2002 2003 2004 2005 2006 2007 2008 2009 2010 2011 YTD
2.0
5.0
9.0
19.0
19.0
49.0
36.9833.07
39.4819.00
27.6820.27
Annual Price HighLowRecent Splits
Price VolatilityMonthly High/LowRel Strength to S&P 500
52 week High/Low32.08 - 19.00
10 Year High/Low39.48 - 19.00
Bear-Market Rank0 (10=worst)
Trading Volume Million
Stock Performance
General Motors Company emerged from the bankruptcy ofGeneral Motors Corporation (old GM) in July 2009. GM has12 brands and operates under�five segments: GM NorthAmerica, GM Europe, GM South America, GM InternationalOperations, and GM Financial. The United States now hasfour brands instead of eight. The company remains themarket leader in the U.S. with�nearly 20% share in 2011. GMFinancial became the company’s captive finance arm on Oct.1, 2010, via the purchase of AmeriCredit.
300 Renaissance Center Detroit, MI 48265-3000Phone: 1 313 556-5000Website: http://www.gm.com
Growth Rates Compound AnnualGrade: F 1 Yr 3 Yr 5 Yr 10 Yr
Revenue % 10.8 0.3 . .Operating Income % 11.3 . . .Earnings/Share % 58.5 . . .Dividends % . . . .
Book Value/Share % 3.1 . . .Stock Total Return % -29.8 . . .+/- Industry -18.2 . . .+/- Market -31.4 . . .
Profitability AnalysisGrade: Current 5 Yr Avg Ind Mkt
Return on Equity % 19.2 . 14.9 22.2Return on Assets % 3.7 . 4.0 9.3Fixed Asset Turns 6.9 . 3.8 7.5Inventory Turns 8.9 . 10.4 16.8Revenue/Employee USD K 733.5 . . 1035.3
Gross Margin % 12.8 . 15.2 40.1Operating Margin % 3.8 . 4.3 18.9Net Margin % 3.6 . 5.4 11.3Free Cash Flow/Rev % 2.2 . 0.3 0.1R&D/Rev % . . . 9.4
*
*3Yr Avg data is displayed in place of 5Yr Avg
Financial PositionGrade: C 12-11 USD Mil 03-12 USD Mil
Cash 15499 17378Inventories 14324 15844Receivables 9949 15799
Current Assets 60247 69216
Fixed Assets 22957 24275Intangibles 39032 38120
Total Assets 144603 150194
Payables 24494 27576Short-Term Debt 1682 5350
Current Liabilities 48932 56577Long-Term Debt 11650 8874
Total Liabilities 106483 110938
Total Equity 38120 39256
2002 2003 2004 2005 2006 2007 2008 2009 2010 2011 TTM FinancialsRevenue USD Mil. . . . . . 148979 104589 135592 150276 151841Gross Margin %. . . . . . -0.2 -7.3 12.4 12.7 12.8Oper Income USD Mil. . . . . . -21230 -21023 5084 5656 5703Operating Margin %. . . . . . -14.3 -20.1 3.7 3.8 3.8
Net Income USD Mil. . . . . . -30943 104690 4668 7585 5438
Earnings Per Share USD. . . . . . -53.47 113.18 2.89 4.58 3.32Dividends USD. . . . . . . . . . .Shares Mil. . . . . . 579 925 1624 1668 1637Book Value Per Share USD. . . . . . . . 17.19 17.72 18.43
Oper Cash Flow USD Mil. . . . . . -12065 -17239 6780 8166 11042Cap Spending USD Mil. . . . . . -7530 -5379 -4200 -7078 -7734Free Cash Flow USD Mil. . . . . . -19595 -22618 2580 1088 3308
Valuation AnalysisCurrent 5 Yr Avg Ind Mkt
Price/Earnings 5.1 . 8.7 15.1Forward P/E 4.8 . . 13.8Price/Cash Flow 3.3 . 5.5 7.9Price/Free Cash Flow 11.1 . 75.2 17.7Dividend Yield % . . 0.7 2.0Price/Book 1.2 . 1.1 2.2Price/Sales 0.2 . 0.4 1.3PEG Ratio 0.3 . . 1.8
Total Return %. . . . . . . . . -45.0 10.6+/- Market. . . . . . . . . -45.0 1.7+/- Industry. . . . . . . . . -17.7 -4.7
Dividend Yield %. . . . . . . . . . 0.0Market Cap USD Mil. . . . . . . . 55295 31714 35091
2002 2003 2004 2005 2006 2007 2008 2009 2010 2011 TTM ProfitabilityReturn on Assets %. . . . . . -34.0 92.1 3.4 5.3 3.7Return on Equity %. . . . . . . . 19.9 28.4 19.2
Net Margin %. . . . . . -20.8 100.1 3.4 5.0 3.6Asset Turnover. . . . . . 1.64 0.92 0.99 1.06 1.03Financial Leverage. . . . . . . 6.4 5.4 5.2 5.2
2002 2003 2004 2005 2006 2007 2008 2009 2010 2011 03-12 Financial HealthWorking Capital USD Mil. . . . . . -31341 6812 5896 11315 12639Long-Term Debt USD Mil. . . . . . 29018 5562 9142 11650 8874Total Equity USD Mil. . . . . . -85560 21249 36180 38120 39256Debt/Equity. . . . . . . 0.26 0.35 0.42 0.31
2002 2003 2004 2005 2006 2007 2008 2009 2010 2011 TTM ValuationPrice/Earnings. . . . . . . . 12.8 4.4 5.1P/E vs. Market. . . . . . . . . 0.2 0.3Price/Sales. . . . . . . . 0.4 0.2 0.2Price/Book. . . . . . . . 2.1 1.1 1.2Price/Cash Flow. . . . . . . . 8.8 4.2 3.3
Quarterly ResultsRevenue
Rev Growth
Earnings Per Share
USD Mil Jun 11 Sep 11 Dec 11 Mar 12
% Jun 11 Sep 11 Dec 11 Mar 12
USD Jun 11 Sep 11 Dec 11 Mar 12
Most Recent Period 39373.0 36719.0 37990.0 37759.0Prior Year Period 33174.0 34060.0 36882.0 36194.0
Most Recent Period 18.7 7.8 3.0 4.3Prior Year Period . 27.2 14.1 15.0
Most Recent Period 1.54 1.03 0.28 0.60Prior Year Period . . 0.29 1.77
Industry Peers by Market Cap
Major Fund Holders
Mkt Cap USD Mil Rev USD Mil P/E ROE%
% of shares
General Motors Co 35091 151841 5.1 19.2Toyota Motor Corp 123373 221244 52.4 1.9Honda Motor Co Ltd 60918 97927 26.5 4.3
.
.
.
TTM data based on rolling quarterly data if available; otherwise most recent annual data shown.
© 2012 Morningstar. All Rights Reserved. Unless otherwise provided in a separate agreement, you may use this report only in the country in which its original distributor is based. Data as originally reported. The information contained herein is not represented or warranted to be accurate, correct, complete, or timely. This report is for information purposes only, and should not be considered a solicitation to buy or sell any security. Redistribution is prohibited without written permission. To order reprints, call +1 312-696-6100. To license the research, call +1 312-696-6869. ß
®

76
Morningstar’s Approach to Rating Stocks
Our Key Investing ConceptsEconomic Moat Rating��Discounted Cash Flow��Discount Rate��Fair Value��Uncertainty��Margin of Safety��Consider Buying/Consider Selling��Stewardship Grades��
TMAt Morningstar, we evaluate stocks as pieces of abusiness, not as pieces of paper. We think that purchasingshares of superior businesses at discounts to theirintrinsic value and allowing them to compound their valueover long periods of time is the surest way to createwealth in the stock market. We rate stocks 1 through 5 stars, with 5 the best and 1the worst. Our star rating is based on our analyst’sestimate of how much a company’s business is worth pershare. Our analysts arrive at this "fair value estimate" byforecasting how much excess cash--or "free cashflow"--the firm will generate in the future, and thenadjusting the total for timing and risk. Cash generatednext year is worth more than cash generated several yearsdown the road, and cash from a stable and consistentlyprofitable business is worth more than cash from acyclical or unsteady business. Stocks trading at meaningful discounts to our fair valueestimates will receive high star ratings. For high-qualitybusinesses, we require a smaller discount than formediocre ones, for a simple reason: We have moreconfidence in our cash-flow forecasts for strongcompanies, and thus in our value estimates. If a stock’smarket price is significantly above our fair value estimate,it will receive a low star rating, no matter how wonderfulwe think the business is. Even the best company is a baddeal if an investor overpays for its shares. Our fair value estimates don’t change very often, butmarket prices do. So, a stock may gain or lose stars based
just on movement in the share price. If we think a stock’sfair value is $50, and the shares decline to $40 withoutmuch change in the value of the business, the star ratingwill go up. Our estimate of what the business is worthhasn’t changed, but the shares are more attractive as aninvestment at $40 than they were at $50. Because we focus on the long-term value of businesses,rather than short-term movements in stock prices, at timeswe may appear out of step with the overall stock market.When stocks are high, relatively few will receive ourhighest rating of 5 stars. But when the market tumbles,many more will likely garner 5 stars. Although you mightexpect to see more 5-star stocks as the market rises, wefind assets more attractive when they’re cheap. We calculate our star ratings nightly after the marketsclose, and issue them the following business day, which iswhy the rating date on our reports will always be theprevious business day. We update the text of our reportsas new information becomes available, usually about onceor twice per quarter. That is why you’ll see two dates onevery Morningstar stock report. Of course, we monitormarket events and all of our stocks every business day, soour ratings always reflect our analyst’s current opinion. Economic Moat Rating The Economic Moat Rating is our assessment of a firm’sability to earn returns consistently above its cost of capitalin the future, usually by virtue of some competitiveadvantage. Competition tends to drive down such
TM
TM
Morningstar ResearchMethodology for ValuingCompanies QQQQQCompetitive Economic Company Fair Value Uncertainty
Analysis Moat Rating Valuation Estimate AssessmentTM
Analyst conducts The depth of the Analyst considers DCF model leads to An uncertaintycompany and industry firm’s competitive company financial the firm’s Fair Value assessmentresearch: advantage is rated: statements and Estimate, which establishes the� � competitive position anchors the rating margin ofManagement None to forecast future framework. safety required forinterviews Narrow cash flows. the stock rating.Conference calls Wide �Trade-show visits Assumptions areCompetitor, supplier, input into a dis-distributor, and counted cash-flowcustomer interviews model.
The current stockprice relative to fairvalue, adjustedfor uncertainty,determines therating.
QQQQQQQQQQQQQQQ
© 2012 Morningstar. All Rights Reserved. Unless otherwise provided in a separate agreement, you may use this report only in the country in which its original distributor is based. Data as originally reported.The information contained herein is not represented or warranted to be accurate, correct, complete, or timely. This report is for information purposes only, and should not be considered a solicitation to buy or sell any security.Redistribution is prohibited without written permission. To order reprints, call +1 312-696-6100. To license the research, call +1 312-696-6869.
ß ®

77
Morningstar’s Approach to Rating Stocks (continued)
economic profits, but companies that can earn them for anextended time by creating a competitive advantagepossess an Economic Moat. We see these companies assuperior investments. Discounted Cash Flow This is a method for valuing companies that involvesprojecting the amount of cash a business will generate inthe future, subtracting the amount of cash that thecompany will need to reinvest in its business, and usingthe result to calculate the worth of the firm. We use thistechnique to value nearly all of the companies we cover. Discount Rate We use this number to adjust the value of our forecastedcash flows for the risk that they may not materialize. For aprofitable company in a steady line of business, we’ll usea lower discount rate, also known as "cost of capital,"than for a firm in a cyclical business with fiercecompetition, since there’s less risk clouding the firm’sfuture. Fair Value This is the output of our discounted cash-flow valuationmodels, and is our per-share estimate of a company’sintrinsic worth. We adjust our fair values for off-balancesheet liabilities or assets that a firm might have--forexample, we deduct from a company’s fair value if it hasissued a lot of stock options or has an under-fundedpension plan. Our fair value estimate differs from a "targetprice" in two ways. First, it’s an estimate of what thebusiness is worth, whereas a price target typically reflectswhat other investors may pay for the stock. Second, it’s along-term estimate, whereas price targets generally focuson the next two to 12 months. Uncertainty To generate the Morningstar Uncertainty Rating, analystsconsider factors such as sales predictability, operatingleverage, and financial leverage. Analysts then classifytheir ability to bound the fair value estimate for the stockinto one of several uncertainty levels: Low, Medium, High,
Very High, or Extreme. The greater the level of uncertainty,the greater the discount to fair value required before astock can earn 5 stars, and the greater the premium to fairvalue before a stock earns a 1-star rating. Margin of Safety This is the discount to fair value we would require beforerecommending a stock. We think it’s always prudent tobuy stocks for less than they’re worth.The margin of safetyis like an insurance policy that protects investors from badnews or overly optimistic fair value estimates. We requirelarger margins of safety for less predictable stocks, andsmaller margins of safety for more predictable stocks. Consider Buying/Consider Selling The consider buying price is the price at which a stockwould be rated 5 stars, and thus the point at which wewould consider the stock an extremely attractivepurchase. Conversely, consider selling is the price atwhich a stock would have a 1 star rating, at which pointwe’d consider the stock overvalued, with low expectedreturns relative to its risk. Stewardship Grades Our corporate Stewardship Rating represents ourassessment of management’s stewardship of shareholdercapital, with particular emphasis on capital allocationdecisions. Analysts consider companies’ investmentstrategy and valuation, financial leverage, dividend andshare buyback policies, execution, compensation, relatedparty transactions, and accounting practices. Corporategovernance practices are only considered if they’ve had ademonstrated impact on shareholder value. Analystsassign one of three ratings: "Exemplary," "Standard," and"Poor." Analysts judge stewardship from an equity holder’sperspective. Ratings are determined on an absolute basis.Most companies will receive a Standard rating, and this isthe default rating in the absence of evidence thatmanagers have made exceptionally strong or poor capitalallocation decisions.
© 2012 Morningstar. All Rights Reserved. Unless otherwise provided in a separate agreement, you may use this report only in the country in which its original distributor is based. Data as originally reported.The information contained herein is not represented or warranted to be accurate, correct, complete, or timely. This report is for information purposes only, and should not be considered a solicitation to buy or sell any security.Redistribution is prohibited without written permission. To order reprints, call +1 312-696-6100. To license the research, call +1 312-696-6869.
ß ®

78
General Motors Co GM [NYSE] | QQQQQTM
Last Price Fair Value Consider Buy Consider Sell Uncertainty Economic Moat Stewardship Morningstar Credit Rating Industry22.41 USD 48.00 USD 28.80 USD 74.40 USD High None . Auto Manufacturers .
Close Competitors Currency(Mil) Market Cap TTM Sales Oper Income Net Income
General Motors Co
Toyota Motor Corp
Honda Motor Co Ltd
Bayerische Motoren Werke AG
USD
USD
USD
USD
35,091 151,841 5,703 5,438
123,373 221,244 2,061 2,373
60,918 97,927 2,091 2,329
. . . .
Morningstar data as of May 07, 2012.
and annualized net credit losses as a percentage ofaverage finance receivables to 4.4% and 2.5%,respectively. Automotive free cash flow for the quarter was about $300million and consolidated free cash flow totaled $505million, or 1.3% of revenue compared with a negative4.7% in 1Q 2011. GM remains in an excellent liquidityposition with $31.5 billion of cash and marketablesecurities plus $5.9 billion available on its credit lines.Although we remain very positive on the outlook for thenew GM, we continue to stress that the company is notdone transforming itself into a more efficient automaker.As for the stock price, until GM reveals its turnaround planfor Europe, reduces its underfunded pension, and mostimportant, sees the U.S. and Canadian governments’ selltheir equity stakes, we expect the stock will remain farbelow our fair value estimate. That said, we remain veryconfident that the company is on the right track tocompleting its transformation. We would also like to seeGM use some of its cash to buy back its shares, as wethink the stock is currently very cheap. Thesis Mar. 08, 2012 Although the "Government Motors" stigma is likely tohang over General Motors Company for several years, wethink GM’s car models are of the best quality and designin decades. The company is already a leader in truckmodels, so a fully competitive lineup combined with amuch smaller cost base leads us to think that GM will beprinting money as vehicle demand recovers.�
We think GM’s earnings potential is excellent because itfinally has a healthy North American unit and can focus itsU.S. marketing efforts on just four brands instead of eight.The most critical cost-saving measure was setting up avoluntary employees’ beneficiary association�for theretiree health-care costs of the United Auto Workers. Thismove saves GM about $3 billion a year; other benefitconcessions and plant closings have drastically loweredGM North America’s break-even point to U.S. industrysales of about 10.5 million vehicles, assuming 18%-19%share. The actual point varies based on mix and incentivelevels.�We think the normative demand for U.S. lightvehicles is about 16.1 million-17.3 million units, so weexpect GM to report excellent earnings growth as vehicledemand comes back during the next few years.� Dramatically better pricing has helped GM to be profitableat volume levels that would have meant billions in lossesa few years ago. The Buick LaCrosse, for example,�wasrecently selling�for about $7,800 more per unit than in2009. Simply put, GM makes products for whichconsumers are willing to pay more than in the past. GM nolonger has to overproduce in an attempt to cover highlabor costs and then dump cars into rental fleets (whichhurts residual values). It now operates in a demand-pullmodel where it can produce only to meet demand and isstructured to break even at the bottom of an economiccycle.� We think the largest threat to profitability is Europe,which has been losing money for a long time. Previousrestructuring moves, such as closing the Antwerpplant�and buyouts, have not been enough, so GMannounced an alliance with struggling French automakerPeugeot�in March (GM now owns 7% of Peugeot). Thetwo firms created a purchasing venture with $125 billionin annual buying power. Although the alliance will bringGM more scale in Europe via purchasing and sharedvehicle parts and platforms,�management�acknowledges
© 2012 Morningstar. All Rights Reserved. Unless otherwise provided in a separate agreement, you may use this report only in the country in which its original distributor is based. Data as originally reported.The information contained herein is not represented or warranted to be accurate, correct, complete, or timely. This report is for information purposes only, and should not be considered a solicitation to buy or sell any security.Redistribution is prohibited without written permission. To order reprints, call +1 312-696-6100. To license the research, call +1 312-696-6869.
ß ®

79
General Motors Co GM [NYSE] | QQQQQTM
Last Price Fair Value Consider Buy Consider Sell Uncertainty Economic Moat Stewardship Morningstar Credit Rating Industry22.41 USD 48.00 USD 28.80 USD 74.40 USD High None . Auto Manufacturers .
that additional European restructuring is needed. Capacitymust be better utilized or reduced, but union issues makeplant closures nearly impossible. We expect GM Europe toremain unprofitable for at least a few more years.� GM stockholders have to consider politics as long as theU.S. Treasury, Canadian and Ontario governments, and anaffiliate of the UAW own large amounts (more than half)of GM stock. We think this ownership will be an overhangon the stock for some time, since�the market is afraid thatthe U.S. Treasury will quickly dump more than 500 millionshares on the market.�We also expect the VEBA to reduceits stake over time since it needs to monetize its�holdingsto pay retiree health-care claims. Although these concernsare valid, we see them as short-term issues that will beresolved. We think a patient GM shareholder eventuallywill be rewarded, as the company is about to see theupside to having a high degree of operating leverage. Valuation, Growth and Profitability We are�maintaining our fair value�estimate at $48 pershare.�Total industry North American light-vehicleproduction is a critical input to our valuation, and we havelong believed that 2008-11 volume was well belownormative levels of demand. We model 2012 NorthAmerican production of 13.8 million units, 14.5 million in2013, 15.4 million in 2014, 16 million in 2015, and 16.5million in 2016 as the industry finally absorbs pent-updemand. We model the critical midcycle operating marginin the last year of our explicit forecast period at about 6%.Capital expenditure is modeled�at 5% of revenue onaverage.� GM began re-establishing its captive finance arm with thecreation of GM Financial on Oct. 1, 2010, via theacquisition of AmeriCredit. We�add GM Financial to thevaluation at�its year-end 2011�book value but have madeno other adjustments for possible future captive finance
expansion. Our weighted average cost of capital is 10%,and we are deducting about $11.9 billion in preferredstock from our common stock valuation. Our diluted sharecount is about 1.9 billion to reflect additional shares fromwarrants, restricted stock units, and equity issuances tofund the pension.� Our fair value estimate could change dramatically, giventhe extreme sensitivity of our discounted cash flow modelto key inputs such as North American light-vehicleproduction, midcycle margin, and the WACC. For example,reducing our year-five midcycle margin by 100 basispoints, while holding all other assumptions constant,reduces our fair value to $43, or 10.4%. Our fair valuedeclines 20.8% to $38 if we raise the WACC to 10.5%lower the midcycle margin 100 basis points and lower ouryear-five North American production estimate by 1 millionunits. Our fair value uncertainty is high to account for thewide possibilities in GM’s fair value, given its high degreeof operating leverage. Risk The biggest risk to GM would be a scenario where toomany Americans refuse to buy its vehicles because ofanimosity over the taxpayer-financed bailout and thegovernment’s continued ownership of the company. Ifsales were to decline for many years, GM probably wouldgo bankrupt. We consider the likelihood of this scenariooccurring to be nearly zero. GM can break even atnear-depression-like sales volume, and it is selling moreunits in the U.S. with four brands than old GM did witheight brands.�Another important risk is GM’s underfundedpension. The plan was underfunded by $25.4 billion asof�year-end 2011.�In late 2010, GM contributed $4 billionin cash to the pension and another $2.2 billion in GMcommon stock in January 2011. Management does notexpect to be forced to make a material contributionthrough 2014 following the $6.2 billion voluntary
© 2012 Morningstar. All Rights Reserved. Unless otherwise provided in a separate agreement, you may use this report only in the country in which its original distributor is based. Data as originally reported.The information contained herein is not represented or warranted to be accurate, correct, complete, or timely. This report is for information purposes only, and should not be considered a solicitation to buy or sell any security.Redistribution is prohibited without written permission. To order reprints, call +1 312-696-6100. To license the research, call +1 312-696-6869.
ß ®

80
General Motors Co GM [NYSE] | QQQQQTM
Last Price Fair Value Consider Buy Consider Sell Uncertainty Economic Moat Stewardship Morningstar Credit Rating Industry22.41 USD 48.00 USD 28.80 USD 74.40 USD High None . Auto Manufacturers .
contribution, but that assertion is only an estimate. U.S.gas prices going well over $4 a gallon is also a risk, sinceGM is unveiling a new generation of full-size pickup trucks(its most profitable vehicles) in 2013. Bulls Say
GM’s break-even point is drastically lower than it wasunder the old GM. The company’s earnings should growrapidly as U.S. vehicle sales bounce back from the 2009low. The VEBA saves GM billions of dollars in cash everyyear, and the new UAW contract gives GM labor coststability through at least September 2015. New models such as Buick’s LaCrosse and Regal andthe Chevrolet Cruze have been very successful. GM cancharge thousands of dollars more per vehicle in certainsegments. Higher prices with fewer incentive dollarsallow GM to get more margin per vehicle, which helpsmitigate the severe decline in light-vehicle sales. Models like Chevrolet’s Malibu, Cruze, and Sonic showthat GM can make a vehicle to compete directly withthe models produced by Japanese and Europeanautomakers. GM already is a top player in criticalemerging markets such as Brazil and China. It sellsnearly 70% of its vehicles outside North America.
Bears Say
The cadence of a recovery in global vehicle demand isvery uncertain. Auto stocks are often sold off severely because ofmacroeconomic concerns--even if the bottom-up storylooks attractive. The U.S. auto market is becoming more crowded eachyear. Hyundai and Volkswagen are likely to take moreshare over time from existing players such as GM. Some American consumers will never buy another GMvehicle because of their anger over GM’s receiving
taxpayer loans. GM’s offerings in the key U.S. full-size sedan andpickup markets are old, although new models will arrivein 2013.
Financial Overview Financial Health: GM’s balance sheet and liquidity werevery strong at the end of 2011, apart from $32.7 billion inunderfunded pension and other postemploymentbenefit�obligations. As of year-end 2011, nonrestrictedautomotive cash and investments was $31.6 billion, andavailable credit lines (including a $5 billion secured facilityannounced in October 2010) provide another $5.3 billion infunds if needed. We calculate that as of year-end 2011,GM had a net cash position, excluding legacy obligations,of $18.3 billion, or�$9.63 per diluted share. GM’s S-1stated that the company does not expect a materialmandatory pension contribution through 2014 afterfactoring in the $4 billion cash contribution in late 2010and the $2.2 billion stock contribution made in January2011. However, we would not be surprised if GM makesvoluntary cash pension contributions in 2012 beyond the$840 million of planned contributions disclosed in the10-K. Company Overview Profile: General Motors Company emerged from thebankruptcy of General Motors Corporation (old GM) in July2009. GM has 12 brands and operates under�fivesegments: GM North America, GM Europe, GM SouthAmerica, GM International Operations, and GM Financial.The United States now has four brands instead of eight.The company remains the market leader in the U.S.with�nearly 20% share in 2011. GM Financial became thecompany’s captive finance arm on Oct. 1, 2010, via thepurchase of AmeriCredit.
© 2012 Morningstar. All Rights Reserved. Unless otherwise provided in a separate agreement, you may use this report only in the country in which its original distributor is based. Data as originally reported.The information contained herein is not represented or warranted to be accurate, correct, complete, or timely. This report is for information purposes only, and should not be considered a solicitation to buy or sell any security.Redistribution is prohibited without written permission. To order reprints, call +1 312-696-6100. To license the research, call +1 312-696-6869.
ß ®

81
General Motors Co GM [NYSE] | QQQQQTM
Last Price Fair Value Consider Buy Consider Sell Uncertainty Economic Moat Stewardship Morningstar Credit Rating Industry22.41 USD 48.00 USD 28.80 USD 74.40 USD High None . Auto Manufacturers .
Management: GM’s capital allocation history is short butalready mixed. Return on invested capital has been closeto the weighted average cost of capital in the firm’s firsttwo full years of operation. The concern we--and a lot ofinvestors--have is what GM will do with its growing cashhoard. We would like to see a combination of voluntarypension funding and common stock repurchases since theshares trade far below our fair value estimate. Cashpayments to the pension would also alleviate a majoroverhang on the stock. Another option is to directlyrepurchase some or all of the 640,150,000 common sharesheld by the U.S., Canada, and Ontario governments. GMcould then retire these shares rather than see themdumped on the market. Investors have been hoping fornews like buybacks or pension funding, and we think themarket was disappointed to instead see GM buy 7% ofPeugeot.� GM’s leadership has undergone tremendous changeduring the restructuring. Dan Akerson is already the thirdCEO since the company emerged from old GM’sbankruptcy. Akerson is a telecommunications veteran andwas at Carlyle Group before becoming CEO. Dan Ammann,39, became CFO in April 2011 following the surpriseresignation of Chris Liddell, who was CFO for just over ayear and probably left to seek a CEO position. Ammannjoined GM in March 2010 and was previously head ofindustrials investment banking at Morgan Stanley. Theboard also has changed dramatically from old GM, withtwo thirds of its members new to the company, and wesee only vice chairman Stephen Girsky having significantprior automotive experience. Girsky was appointed to theboard by the VEBA and was a�Morgan Stanley�auto stockanalyst.
© 2012 Morningstar. All Rights Reserved. Unless otherwise provided in a separate agreement, you may use this report only in the country in which its original distributor is based. Data as originally reported.The information contained herein is not represented or warranted to be accurate, correct, complete, or timely. This report is for information purposes only, and should not be considered a solicitation to buy or sell any security.Redistribution is prohibited without written permission. To order reprints, call +1 312-696-6100. To license the research, call +1 312-696-6869.
ß ®

82
General Motors Co GM [NYSE] | QQQQQTM
Last Price Fair Value Consider Buy Consider Sell Uncertainty Economic Moat Stewardship Morningstar Credit Rating Industry22.41 USD 48.00 USD 28.80 USD 74.40 USD High None . Auto Manufacturers .
Analyst Notes
May 03, 2012 GM’s First-Quarter Beat Not Enough to Keep Stock Up in Broad Auto Sell-Off
General Motors Company�reported first-quarter resultsThursday that beat Street expectations. We see no reasonto change our investment thesis based on the results, sowe are�leaving�our fair value estimate in place. Adjustedearnings per diluted share came in at $0.93 andconsolidated revenue was $37.8 billion. Both figures beatconsensus estimates of $0.85 and $37.6 billion. The onlyspecial items this quarter were a $590 million GM Europe(GME) goodwill-impairment charge and a $22 milliongoodwill-impairment charge in GM International (GMIO).Revenue increased 4.3% year over year, while automotiverevenue increased 4%. Adjusted EBIT came in at just under$2.2 billion compared with $2.0 billion in the first quarter of2011, while adjusted EBIT margin increased 20 basis pointsyear over year to 5.8%. All segments were profitableexcept for GME, which posted an adjusted loss of $256million compared with a $5 million profit in the prior year’squarter. The only good news for GME was that the loss isabout half of what it was in the fourth quarter of 2011 andabout the same as the third quarter. This could suggest thatEurope is bottoming out; but even if it is the bottom, we donot expect major improvement for GME this year.Management still has not given further detail on its plansto overhaul GME, so we continue to expect anannouncement or series of announcements later this year.� �At the consolidated level, an approximate $400 millionpositive year-over-year contribution from volume and aboutan $800 million contribution from pricing offset higher costsand an unfavorable mix contribution, resulting in theapproximate $200 million year-over-year adjusted EBITincrease. GM North America, the most critical segment forGM, posted solid results with adjusted EBIT up 35% yearover year to nearly $1.7 billion and adjusted EBIT margin up130 basis points to 7%. Strong contributions from highervolume and pricing comfortably offset negativecontributions in mix and costs. The approximately $300
million in higher costs came from $200 million of reducedpension income due to a lower return assumption now inplace and from $100 million of costs to buy out 1,400skilled workers. The payback period on this attritionprogram is slightly over one year. Management also gavesecond- and third-quarter guidance for GMNA results to be"comparable" with first-quarter numbers. Other good newsis that on Tuesday, GM in its April sales release announcedan increase in its 2012 U.S. light vehicle sales forecast to14 million-14.5 million vehicles, up from 13.5 million-14million. Our only concern for GMNA is that the ratio ofGM’s percentage of its U.S. retail incentives as apercentage of average transaction price divided by thatsame percentage for the industry has crept up above 1.0 asthe year has unfolded, reaching 1.15 in April. Although thisratio is lower than during the company’s incentive binge inJanuary and February 2011 (1.25 and 1.22, respectively),management’s long-stated intention is to have this ratio beabout 1.0 for a year, so we expect this ratio to decline inthe future. On a unit basis, GM’s U.S. incentives are down$360 year over year. � �GMIO did see margin decline of 100 bps, excluding jointventures, to 2.1%, and Chinese JV margin declined 180 bpsto 10.2%. GM China’s volume was excellent, however,during the quarter and well outperformed the industry. Thecompany had record sales volume in China in the quarter,and its market share increased 150 bps to 15.1%. Marginsshould also improve over the next several years in China asChinese Cadillac production ramps up starting this year.GM’s goal over the next three to five years is for ChineseCadillac production to be 150,000-180,000 units a year.GMIO’s equity income, which is mostly GM China, was onlyup slightly year over year to $421 million. GM SouthAmerica (GMSA) posted a 20 bps decline in margin to2.1%. Profit was roughly flat year over year, but theseresults are significantly improved from the negative 5.4%
© 2012 Morningstar. All Rights Reserved. Unless otherwise provided in a separate agreement, you may use this report only in the country in which its original distributor is based. Data as originally reported.The information contained herein is not represented or warranted to be accurate, correct, complete, or timely. This report is for information purposes only, and should not be considered a solicitation to buy or sell any security.Redistribution is prohibited without written permission. To order reprints, call +1 312-696-6100. To license the research, call +1 312-696-6869.
ß ®

83
General Motors Co GM [NYSE] | QQQQQTM
Last Price Fair Value Consider Buy Consider Sell Uncertainty Economic Moat Stewardship Morningstar Credit Rating Industry22.41 USD 48.00 USD 28.80 USD 74.40 USD High None . Auto Manufacturers .
Analyst Notes (continued)
margin in the fourth quarter. We expect growth in profits inGMSA as 2012 unfolds thanks to new product launches.Good news also came out of GM Financial, which grew itspretax earnings 39.2% from 1Q 2011 to $181 million andsaw meaningful year-over-year declines in delinquenciesand annualized net credit losses as a percentage of averagefinance receivables to 4.4% and 2.5%, respectively. � �Automotive free cash flow for the quarter was about $300million and consolidated free cash flow totaled $505million, or 1.3% of revenue compared with a negative 4.7%in 1Q 2011. GM remains in an excellent liquidity positionwith $31.5 billion of cash and marketable securities plus$5.9 billion available on its credit lines. Although we
remain very positive on the outlook for the new GM, wecontinue to stress that the company is not donetransforming itself into a more efficient automaker. As forthe stock price, until GM reveals its turnaround plan forEurope, reduces its underfunded pension, and mostimportant, sees the U.S. and Canadian governments’ selltheir equity stakes, we expect the stock will remain farbelow our fair value estimate. That said, we remain veryconfident that the company is on the right track tocompleting its transformation. We would also like to seeGM use some of its cash to buy back its shares, as we thinkthe stock is currently very cheap.�
May 03, 2012 GM’s 1Q Beats Consensus
General Motors Company��reported first-quarter resultsThursday that beat Street expectations. At first glance, wesee no reason to change our investment thesis based onthe results, so we are likely to leave our fair value estimatein place. Adjusted earnings per diluted share came in at$0.93 and consolidated revenue was $37.8 billion. Bothfigures beat consensus estimates of $0.85 and $37.6billion. The only special items this quarter were a $590million GM Europe goodwill-impairment charge and a $22million goodwill-impairment charge in GM International.Adjusted EBIT came in at just under $2.2 billion comparedwith $2.0 billion in the first quarter of 2011, while adjustedEBIT margin increased 20 basis points year over year to5.8%. All segments were profitable except for GME, whichposted an adjusted loss of $256 million compared with a $5million profit in the prior year’s quarter. The only good newsabout GME is the loss is about half of what it was in thefourth quarter of 2011 and about the same as the thirdquarter. This could suggest that Europe is bottoming out,but only time will tell. Even if it is the bottom, we do notexpect major improvement for GME this year. Management
also gave second- and third-quarter guidance for NorthAmerican results to be "comparable" with first-quarternumbers.� �At the consolidated level, an approximate $400 millionpositive year-over-year contribution from volume and aboutan $800 million contribution from pricing offset higher costsand an unfavorable mix contribution, resulting in theapproximate $200 million year-over-year adjusted EBITincrease. GM North America, the most critical segment forGM, posted solid results with adjusted EBIT up 35% yearover year to nearly $1.7 billion and adjusted EBIT margin up130 basis points to 7%. Strong contributions from highervolume and pricing comfortably offset negativecontributions in mix and costs. Our only concern in GMNAis that the ratio of GM’s U.S. incentives as a percentage ofaverage transaction price compared with the industry’spercentage has crept up above 1.0 as the year hasunfolded, reaching 1.15 in April. Although this ratio is lowerthan the company’s incentive binge in January and February2011 (1.25 and 1.22, respectively), management’s
© 2012 Morningstar. All Rights Reserved. Unless otherwise provided in a separate agreement, you may use this report only in the country in which its original distributor is based. Data as originally reported.The information contained herein is not represented or warranted to be accurate, correct, complete, or timely. This report is for information purposes only, and should not be considered a solicitation to buy or sell any security.Redistribution is prohibited without written permission. To order reprints, call +1 312-696-6100. To license the research, call +1 312-696-6869.
ß ®

84
General Motors Co GM [NYSE] | QQQQQTM
Last Price Fair Value Consider Buy Consider Sell Uncertainty Economic Moat Stewardship Morningstar Credit Rating Industry22.41 USD 48.00 USD 28.80 USD 74.40 USD High None . Auto Manufacturers .
Analyst Notes (continued)
long-stated intention is to have this ratio be about 1.0 for ayear, so we expect this ratio to decline in the future. �
Feb. 29, 2012 GM to Form Alliance With Peugeot, Buys 7% Stake
General Motors Company��and France’sPeugeot��announced an alliance on Wednesday designed tobring relief to both firms’ struggling European operations.We will summarize the deal below, but also refer readersto our Feb. 22 and Feb. 29 Peugeot notes for our discussionof why we are not in favor of this deal. Although we do notsee this deal drastically hurting GM, we think it will need tosolve its European problems through more work than justthis alliance, a point that management also stressed manytimes on today’s call. Thus we think plant closings, movingmore production into Europe to increase capacity utilizationand further discussions with the unions are likely (thoughwe do not see how the unions will agree). � �We are not changing our GM fair value estimate as wehave long based our investment thesis on a recovery in U.S.auto demand, which is a separate issue from this alliance.We do expect to reduce our Peugeot fair value estimate,however, because the company is incurring dilution via arights offering of about EUR 1 billion. As part of this EUR 1billion offering, GM will purchase a 7% stake in Peugeot foran undisclosed price, making it the second-largestshareholder after the Peugeot family. The family isinvesting additional capital into Peugeot "as a sign of theirconfidence in the success of the alliance." We see the factthat Peugeot is not purchasing a stake in GM, unlike mostother alliances, as support for our opinion that Peugeotneeds GM more than GM needs Peugeot. There is no putoption allowing GM to force Peugeot to buy back the 7%stake and there is no call option allowing GM to buy moreof Peugeot over time.� �
For now, the alliance will focus on sharing vehicleplatforms and creating a global purchasing joint venturewith total annual purchase volume of $125 billion (about$90 billion-$95 billion of which is from GM). The objectiveof the alliance is the use of common parts and to shareplatforms such that combined volume of 2.3 millionsub-compact units (B Segment) and 1.6 million midsizevehicles (D segment) is achieved. The firms also expect tobe able to offer vehicles that neither could have built ontheir own due to cost constraints. The first vehicle derivedfrom an alliance common platform is expected to launch in2016.� �The synergies from the alliance are expected to producetotal annual cost savings of $2 billion in about five years,with most savings starting in year three. Synergies areexpected to be split roughly equally, so we see Peugeotreaping more of the benefit because of its smaller size. Thealliance will be run by an equally staffed eight-personcommittee composed of senior management from bothautomakers and will be operational by the second half ofthis year. GM is also seeking to reduce its logistics costs inEurope and Russia by cooperating with Peugeot’s logisticssubsidiary, GEFCO.� �One challenge we see to this arrangement beyond what wediscussed in our Feb. 22 note is potential cultural clashes.Peugeot is a family-run company and most families onlywant to do things their way, while GM has alsotraditionally not been at all receptive to outsidesuggestions to change its modus operandi. Both firms willhave to put egos aside for this alliance to work. �
Feb. 22, 2012 Peugeot’s Talks With GM: Going the Wrong Way on a One-Way Street
France’s labor minister was quoted in the media as saying that Peugeot��is in discussions with General Motors. In our
© 2012 Morningstar. All Rights Reserved. Unless otherwise provided in a separate agreement, you may use this report only in the country in which its original distributor is based. Data as originally reported.The information contained herein is not represented or warranted to be accurate, correct, complete, or timely. This report is for information purposes only, and should not be considered a solicitation to buy or sell any security.Redistribution is prohibited without written permission. To order reprints, call +1 312-696-6100. To license the research, call +1 312-696-6869.
ß ®

85
General Motors Co GM [NYSE] | QQQQQTM
Last Price Fair Value Consider Buy Consider Sell Uncertainty Economic Moat Stewardship Morningstar Credit Rating Industry22.41 USD 48.00 USD 28.80 USD 74.40 USD High None . Auto Manufacturers .
Analyst Notes (continued)
opinion, an alliance between these two companies couldprovide some purchasing synergies where common vehiclearchitectures and common parts are used. However, this isnot the only kind of cost savings these two companies needto achieve. Peugeot and Opel/Vauxhall (GM’s Europeanoperations) both need to reduce head count and rationalizecapacity. In addition, General Motors wants to grow itsChevy brand in Europe as a low-priced entry while pushingits Opel (Germany)/Vauxhall (U.K.) brands more upscale.From our perspective, an alliance between Peugeot and GMwould not enable either company to benefit from the realcost savings each needs to achieve in Europe or would itsignificantly improve GM’s ability to grow the Chevroletbrand in the region.� �In order to be successful, an alliance, like the one thatRenault��and Nissan��have, would need the two partners tohave relatively little geographic overlap. At the time of theRenault-Nissan alliance, Renault was mainly in France aswell as other western European countries and Nissan wasmainly in Japan and North America. The two companieswere able to share vehicle architectures, engineering, andsupply chain management. Most importantly, the twocompanies were able to more effectively utilize theirrespective capacity (but not so much Renault in France) toaddress their respective markets.� �The problems faced by Peugeot and GM Europe are thateach has too many direct laborers and too much capacity.However, due to the highly charged nature of the issue, analliance between these companies that rationalizescapacity would be political suicide for any state leader whowould agree with it. Would German laborers accept headcount and capacity closures so that Peugeot facilities couldbe filled with Chevrolet and Opel models? Likewise, would
French laborers accept the same so that German plantscould reach optimum capacity? If an alliance between thetwo companies was not meant to improve the profitabilityof each within the European region, then what good is it?� �GM has no need of Peugeot platforms or technology, buthas a tremendous volume gap in its German facilities.Peugeot has no need of any GM platforms or technology,but desperately needs volume to fill its French plants. GMshould stick with its plan to take Opel/Vauxhall upscale andto grow the Chevy brand. While difficult to accomplish, it’sa better option than an alliance with Peugeot. The pricepoints on premium models would�improve GM’s mix whilemass market Chevrolets could potentially add to volume,filling up more of GM’s German capacity. We think Peugeotneeds GM more than GM needs Peugeot, since GM is notas dependent on Europe.� �If Peugeot truly wants to remain independent while formingan alliance with a company that will "fit in with its strategicvision" and will "provide significant cost synergies," thenGeneral Motors is not the answer. The company needsmore comprehensive cost synergies than an alliance withGM would provide. In our opinion, Mazda would make amore suitable partner. We also like the idea of aPeugeot-Maruti-Suzuki��alliance. Tata Motors�could beanother possibility. The amount of geographic overlap in allof these cases would be minimal. The potential fortechnology and platform sharing would be tremendous. Butmost important, the combined volume from any of thesealliances plus the potential for demand growth in the Indianmarket would enable Peugeot to fill more of its Frenchcapacity with units for export, something that aPeugeot-GM alliance would be woefully short of providing.�
Feb. 16, 2012 GM’s Fourth-Quarter Results Flat, Except in Critical North American Segment
General Motors Company��reported fourth-quarter results on February 16 that missed consensus by $0.02 per diluted
© 2012 Morningstar. All Rights Reserved. Unless otherwise provided in a separate agreement, you may use this report only in the country in which its original distributor is based. Data as originally reported.The information contained herein is not represented or warranted to be accurate, correct, complete, or timely. This report is for information purposes only, and should not be considered a solicitation to buy or sell any security.Redistribution is prohibited without written permission. To order reprints, call +1 312-696-6100. To license the research, call +1 312-696-6869.
ß ®

86
?
Ford Motor Co F [NYSE] | QQQQQTM
Last Price Fair Value Consider Buy Consider Sell Uncertainty Economic Moat Stewardship Morningstar Credit Rating Industry10.66 USD 23.00 USD 13.80 USD 35.70 USD High None . Auto Manufacturers BBB-
Currency amounts expressed with "$"are in U.S. dollars (USD) unlessotherwise denoted.
Ford’s First Quarter Shows North America Will Be the Story in2012
by David Whiston, CFA, CPA, CFESenior AnalystAnalysts covering this company do notown its stock.
Pricing data through May 07, 2012.Rating updated as ofMay 07, 2012.
08 09 10 11 12
1.0
2.0
3.0
4.0
6.0
8.0
14.0Stock Price
Analyst Note Apr. 27, 2012 Ford�reported first-quarter pretax results on Friday of a$2.3 billion profit, or $0.39 per diluted share, which beatconsensus estimates of $0.35. Revenue decreased 2.1%year over year to $32.4 billion, which still beat consensusof about $31.3 billion. We are leaving our fair valueestimate in place as the recovery we anticipate for theU.S. market appears to be taking hold. Ford North Americacontributes nearly all of the company’s automotiveearnings. Automotive operating margin did decline year over year to6.4% from 7.7%, as there was a flat contribution fromvolume and mix while net pricing only increasedautomotive pretax income by $200 million from the firstquarter of 2011. Materials and overhead costs more thanoffset the small improvement from pricing, which resultedin automotive pretax operating profit of $1.8 billioncompared with $2.1 billion in the prior year’s quarter. Asfor Ford Motor Credit, its results declined as expected to$452 million of pretax income from $713 million infirst-quarter 2011. We expect the captive will continue tobe hurt by a lower volume of vehicles coming off-lease,which can then be resold for profit. We expect thiscomparable to improve starting next year as 2009 was thebottom for U.S. new vehicle sales at 10.4 million units;thus, the supply of vehicles coming off-lease shouldgradually improve. Management also does not expect anyproduction disruptions due to the PA-12 resin shortagefollowing a March 31 supplier plant explosion in Germany.� This quarter showed a trend in automotive that we expectto mostly continue for the rest of the year--that is, NorthAmerican results were quite strong but other marketsdeclined from the prior year. In the first quarter, allgeographic markets outside North America had lowerresults than a year ago, with only South Americaprofitable. Europe lost $149 million, which was better thanmanagement expected, but the company continues to
guide for a full-year loss in Europe of $500 million-$600million. We expect Europe to be ugly for nearly allautomakers for the foreseeable future becausegovernments kept their cash-for-clunkers subsidyprograms in place for several years, even into 2011. Fordplants generally run three shifts in Europe, so actualcapacity utilization is likely far below the two-shift 93%figure given on Friday’s call. South America is guided to beprofitable for full-year 2012 but at a lower level than 2011.Automakers from both developed nations and emergingmarkets are flooding Brazil with capacity, which is leadingto pricing competition. Ford South America did postyear-over-year gains from volume, mix, and pricing of $77million, but these were more than offset by a negativematerials cost contribution of $118 million and a $93million unfavorable foreign exchange contribution.Segment operating margin declined severely to 2.3% from9.1% in first-quarter 2011. We agree with managementthat the second half of this year should see Ford SouthAmerica posting improved results as the new Ranger truckand new EcoSport small SUV will be profitable newprograms in the region by that time. Ford’s Asia Pacificand Africa segment is also guided to be profitable for thefull year thanks to the Ranger launch in the Thailandfactory and other new models. For first quarter, however,the segment saw major headwinds from materials andoverhead costs, which offset the strong $143 millionyear-over-year improvement from pricing. These international results are not ideal, but we think it isimportant to focus on the improvements shown by FordNorth America. The segment had its highest quarterlyprofit since at least 2000, when it was first reportedseparately, and its operating margin increased 120 basispoints year over year to 11.5% despite market sharedeclining 80 basis points to 15.2%. The reason for the$300 million increase in North American auto operatingprofit to $2.1 billion is that modest gains in volume, mix,pricing, and lower freight costs more than offset higherengineering and other overhead costs. Management hasmade it clear that Ford North America is the key reasonwhy it expects consolidated pretax operating profit to beflat in 2012 over 2011 but automotive pretax operating

87
Ford Motor Co F [NYSE] | QQQQQTM
Last Price Fair Value Consider Buy Consider Sell Uncertainty Economic Moat Stewardship Morningstar Credit Rating Industry10.66 USD 23.00 USD 13.80 USD 35.70 USD High None . Auto Manufacturers BBB-
Analyst Notes (continued)
U.S. auto sales came out remains in place at 13.5million-14.5 million, including medium and heavy trucks.Capital expenditure will be in the range of $5.5 billion-$6billion while 2011’s total came in well below guidance at$4.3 billion.� �Management also gave some helpful pension guidance andyear-end 2011 data. The worldwide plan finished the yearunderfunded by $15.4 billion (compared with $11.5 billion ayear ago) with $9.4 billion of that amount in the U.S. plan.Actual full-year 2011 U.S. plan asset returns were 7.7%and contributions for all plans totaled $1.1 billion. In 2012,the company expects to contribute $3.5 billion to all its
plans, which includes a $2 billion voluntary contribution tothe U.S. plan. This increase in contributions is consistentwith management’s previously stated goal of fully fundingthe plans in the next few years. We agree withmanagement that some of the remaining deficit will bemade up with an eventual increase in the discount rate ascurrent interest rate levels are well below normal. Atyear-end 2011, the U.S. plan’s expected long-term rate ofreturn is 7.5%, down from 8% at year-end 2010, and thediscount rate is down 60 bps to 4.64%. Although eventualhigher interest rates help the underfunded status, we doexpect more cash contributions by Ford in 2013 and beyond.�
Jan. 27, 2012 First Impression of Ford’s 4Q Results
Ford Motor Company��reported pro-forma fourth quarterresults Friday of $0.20 per diluted share, which missedconsensus expectations of $0.25. GAAP earnings per sharecame in at $3.40 because of a nearly $12.5 billion noncashgain from the reversal of the deferred tax asset valuationallowance. This reversal is not a surprise, as managementhas been guiding for it to happen in 2012 for nearly a year.It is a good sign for Ford, because it means the companyexpects to be profitable enough to use its deferred taxassets. The effective tax rate going forward will probablybe about 30%, but the important point is that cash taxeswill remain low for many years.� �Excluding special items, consolidated fourth-quarter pretaxincome was $1.1 billion, down 14.6% from the prior year’sfourth quarter. Automotive pretax income declined 20.9%to $586 million, primarily because of higher commodity andfreight costs as well as higher North Americancompensation due to the payment of the United AutoWorkers ratification bonus. Geographically, only NorthAmerica posted an increase in automotive pretax operatingprofit while Europe and Asia posted losses. Management
said at the North American International Auto Show earlierthis month that Asia would not be profitable in 2011because of a higher-than-expected impact from theThailand flooding in the fourth quarter. The Thai floodingcost Ford 34,000 units of lost production. On the positiveside, the global auto business generated a $1.8 billionimprovement from the fourth quarter of 2010 thanks tobetter volume, mix, and pricing. Management expects 2012commodity costs to increase but not materially, whichwould be a welcome relief from the pressure Fordexperienced in 2011.� �Revenue comfortably beat consensus by coming in at $34.6billion (up 6.5%) compared with consensus of $32.1 billion.We will analyze the results further and publish a longernote after the earnings call, but we are unlikely to changeour investment thesis because of the weak fourth quarter.We are disappointed by Friday’s news, but we remain veryoptimistic about Ford’s future; the company has terrificproducts and much-improved pricing power from a fewyears ago, and we expect significant improvement in U.S.light-vehicle sales over the coming years. The competition
© 2012 Morningstar. All Rights Reserved. Unless otherwise provided in a separate agreement, you may use this report only in the country in which its original distributor is based. Data as originally reported.The information contained herein is not represented or warranted to be accurate, correct, complete, or timely. This report is for information purposes only, and should not be considered a solicitation to buy or sell any security.Redistribution is prohibited without written permission. To order reprints, call +1 312-696-6100. To license the research, call +1 312-696-6869.
ß ®

88
Ford Motor Co F [NYSE] | QQQQQTM
Last Price Fair Value Consider Buy Consider Sell Uncertainty Economic Moat Stewardship Morningstar Credit Rating Industry10.66 USD 23.00 USD 13.80 USD 35.70 USD High None . Auto Manufacturers BBB-
Analyst Notes (continued)
is certainly fierce, but we think Ford will remain a globalauto manufacturing leader.�
Dec. 08, 2011 Ford to Resume Dividend
Ford Motor Company��announced today that it is resumingits dividend, a move we see as very positive formanagement’s opinion of Ford’s long-term prospects; weare leaving our fair value estimate unchanged. The dividendwill be five cents a quarter (about a 1.8% yield at today’sstock price of about $11), first payable on March 1, 2012 toClass B and common shareholders on record as of January31, 2012. This payment will be the company’s first dividendsince July 2006, as the company suspended its dividend inSeptember of that year due to its then-deterioratingfinancial health. � �Management has since done a tremendous job of taking
down automotive debt and had been guiding for some timethat dividend resumption was a top priority and was goingto happen soon. We had been expecting the announcementto come in January during the North American InternationalAuto Show or when the company reported fourth-quarterresults; however, we think the announcement coming nowdespite the turmoil in Europe is a good sign for Ford’slong-term path. Previous management comments indicatedthat they did not want to resume the dividend until theywere confident it could be maintained throughout abusiness cycle; thus, we think the dividend is saferegardless of future macroeconomic problems.�
Dec. 06, 2011 Ford Denies CEO Search Under Way
Last night, The Wall Street Journal released a story citingthat insiders at Ford Motor Company��have told the paperthat president and CEO Alan Mulally, 66, will resign withinthe next two years and the company has begun looking fora successor. A Ford spokesperson told the paper that nosearch is under way and called the story "false" in aninterview with Bloomberg. We do not like to speculate onrumors, but as we said in our Ford stock report, we wouldnot be surprised if Mulally resigns once Ford receives aninvestment grade credit rating from the major ratingagencies and resumes its dividend. Mulally joined Ford inlate 2006 but continues to reside in Seattle, so we neverhave expected him to stay at Ford for a long time.� �We would like Mulally to remain at Ford for many moreyears but should he leave, four of the possible successorsmentioned by the Journal are all competent executives, inour opinion. Ford leadership has repeatedly said it prefersto promote internally and we think there is no need to go
outside the company. The most likely candidate, in ouropinion, is Mark Fields, 50, president of the Americas, whojoined Ford in 1989. (He was CEO of Mazda from 2000 to2002.) Unlike some other Ford executives, Fields kept hisjob when Mulally joined Ford and has held leadership roleswith Ford in Europe and South America and now runs Ford’smost important division as the United States contributesthe vast majority of Ford’s profits. The paper also cited JoeHinrichs, 45, president of Ford Asia Pacific and Africa, andCEO of Ford China; Hyundai North America CEO JohnKrafcik, a former Ford veteran; and Phil Martens, 51, CEO ofaluminum rolled products maker Novelis. Martens was atFord from 1987 to 2005 in a variety of engineering andcorporate roles including product development. Krafcik is anexpert on lean production (even inventing the term)following his time at the NUMMI joint venture plant withold GM and Toyota��in California. Regardless of whoeventually succeeds Mulally, it is unlikely to change ourinvestment thesis that Ford is well positioned to profit from
© 2012 Morningstar. All Rights Reserved. Unless otherwise provided in a separate agreement, you may use this report only in the country in which its original distributor is based. Data as originally reported.The information contained herein is not represented or warranted to be accurate, correct, complete, or timely. This report is for information purposes only, and should not be considered a solicitation to buy or sell any security.Redistribution is prohibited without written permission. To order reprints, call +1 312-696-6100. To license the research, call +1 312-696-6869.
ß ®

89
Ford Motor Co F [NYSE] | QQQQQTM
Last Price Fair Value Consider Buy Consider Sell Uncertainty Economic Moat Stewardship Morningstar Credit Rating Industry10.66 USD 23.00 USD 13.80 USD 35.70 USD High None . Auto Manufacturers BBB-
Analyst Notes (continued)
what we see as a large increase in U.S. auto sales duringthe next few years.�
© 2012 Morningstar. All Rights Reserved. Unless otherwise provided in a separate agreement, you may use this report only in the country in which its original distributor is based. Data as originally reported.The information contained herein is not represented or warranted to be accurate, correct, complete, or timely. This report is for information purposes only, and should not be considered a solicitation to buy or sell any security.Redistribution is prohibited without written permission. To order reprints, call +1 312-696-6100. To license the research, call +1 312-696-6869.
ß ®
Disclaimers & DisclosuresNo Morningstar employees are officers or directors of this company. Morningstar Inc. does not own more than 1% of the shares of this company. Analystscovering this company do not own its stock. The information contained herein is not represented or warranted to be accurate, correct, complete, or timely.This report is for information purposes only, and should not be considered a solicitation to buy or sell any security.

90
Morningstar Stock Data Sheet Pricing data thru May 07, 2012 Rating updated as of May 07, 2012Pricing data thru May 07, 2012 Rating updated as of May 07, 2012 Fiscal year-end: December
Ford Motor Co F Sales USD Mil Mkt Cap USD Mil Industry Sector136,264 40,682 Auto
Manufacturers Consumer Cyclical
TMMorningstar Rating Last Price Fair Value Uncertainty Economic Moat Stewardship GradeQQQQQ 10.66 23.00 High None .
per share prices in USD
2002 2003 2004 2005 2006 2007 2008 2009 2010 2011 YTD
1.0
3.0
6.0
14.0
19.049.0
18.236.90
17.316.59
17.3412.61
14.757.57
9.486.06
9.706.65
8.791.01
10.371.50
17.429.75
18.979.05
13.0510.52
Annual Price HighLowRecent Splits
Price VolatilityMonthly High/LowRel Strength to S&P 500
52 week High/Low15.35 - 9.05
10 Year High/Low18.97 - 1.01
Bear-Market Rank5 (10=worst)
Trading Volume Million
Stock Performance
Ford Motor Company manufactures automobiles under itsFord and Lincoln brands. The company has about 17%market share in the United States and more than 8%�sharein Europe. Ford and Lincoln brand sales in North America andEurope made up 59% and 26% of 2011 auto revenue,respectively. The company also owns 3.5% of Mazda. Fordhas about 164,000 employees and is based in Dearborn,Mich.
One American Road Dearborn, MI 48126Phone: 1 313 322-3000Website: http://www.ford.com
Growth Rates Compound AnnualGrade: F 1 Yr 3 Yr 5 Yr 10 Yr
Revenue % 5.7 -2.3 -3.2 -1.7Operating Income % 4.3 . . .Earnings/Share % 197.6 . . .Dividends % . . . .
Book Value/Share % . . . -0.9Stock Total Return % -28.8 21.1 5.7 -2.0+/- Industry -17.2 17.3 9.4 -7.0+/- Market -30.4 6.4 7.6 -4.6
Profitability AnalysisGrade: Current 5 Yr Avg Ind Mkt
Return on Equity % . . 14.9 22.2Return on Assets % 11.8 2.0 4.0 9.3Fixed Asset Turns 6.0 5.0 3.8 7.5Inventory Turns 19.2 15.8 10.4 16.8Revenue/Employee USD K 830.9 738.2 . 1035.3
Gross Margin % 16.8 16.0 15.2 40.1Operating Margin % 5.1 1.9 4.3 18.9Net Margin % 14.8 2.1 5.4 11.3Free Cash Flow/Rev % 4.0 . 0.3 0.1R&D/Rev % . . . 9.4
*
*3Yr Avg data is displayed in place of 5Yr Avg
Financial PositionGrade: C 12-10 USD Mil 12-11 USD Mil
Cash 14805 17148Inventories 5917 5901Receivables 77458 78541
Current Assets 130620 133046
Fixed Assets 23179 22371Intangibles 102 100
Total Assets 164687 178348
Payables 16362 17724Short-Term Debt 15456 17629
Current Liabilities 48883 50356Long-Term Debt 88733 82060
Total Liabilities 165360 163320
Total Equity -673 15028
2002 2003 2004 2005 2006 2007 2008 2009 2010 2011 TTM FinancialsRevenue USD Mil163420 164196 171652 177089 160123 172455 146277 118308 128954 136264 136264Gross Margin %23.4 20.9 20.9 18.2 7.0 16.9 11.8 15.5 19.0 16.8 16.8Oper Income USD Mil9857 8116 10681 7493 -7926 8031 -4130 -2824 6658 6943 6943Operating Margin %6.0 4.9 6.2 4.2 -4.9 4.7 -2.8 -2.4 5.2 5.1 5.1
Net Income USD Mil-995 495 3335 2024 -12613 -2723 -14672 2717 6561 20213 20213
Earnings Per Share USD-0.54 0.27 1.73 1.05 -6.72 -1.38 -6.46 0.86 1.66 4.94 4.94Dividends USD0.40 0.40 0.40 0.40 0.25 0.00 0.00 0.00 0.00 0.00 0.00Shares Mil1819 1832 1830 1846 1879 1979 2273 2992 4178 4111 4111Book Value Per Share USD3.05 6.62 8.77 6.98 -1.83 2.67 -6.98 -2.34 -0.18 3.95 3.94
Oper Cash Flow USD Mil18633 20195 24514 21679 9611 17098 -179 16042 11477 9784 9784Cap Spending USD Mil-7278 -7749 -9237 -7517 -6848 -6022 -6696 -4561 -4092 -4293 -4293Free Cash Flow USD Mil11355 12446 15277 14162 2763 11076 -6875 11481 7385 5491 5491
Valuation AnalysisCurrent 5 Yr Avg Ind Mkt
Price/Earnings 2.3 . 8.7 15.1Forward P/E 6.1 . . 13.8Price/Cash Flow 4.6 . 5.5 7.9Price/Free Cash Flow 8.8 . 75.2 17.7Dividend Yield % 0.9 . 0.7 2.0Price/Book 2.5 . 1.1 2.2Price/Sales 0.3 0.3 0.4 1.3PEG Ratio 0.8 . . 1.8
Total Return %-38.3 77.0 -6.3 -44.5 0.5 -10.4 -66.0 336.7 67.9 -35.9 0.0+/- Market-14.9 50.6 -15.3 -47.5 -13.1 -13.9 -27.5 313.3 55.1 -35.9 -8.9+/- Industry-31.6 42.0 -22.5 -60.7 -30.4 5.7 -26.0 281.9 52.3 -8.6 -15.3
Dividend Yield %4.3 2.5 2.7 5.2 3.3 . . . . . 0.9Market Cap USD Mil17067 28269 26786 14341 14186 14202 5161 33370 63433 40889 40682
2002 2003 2004 2005 2006 2007 2008 2009 2010 2011 TTM ProfitabilityReturn on Assets %-0.3 0.2 1.1 0.7 -4.6 -1.0 -5.9 1.3 3.6 11.8 11.8Return on Equity %-14.9 5.7 24.1 14.0 . . . . . . .
Net Margin %-0.6 0.3 1.9 1.1 -7.9 -1.6 -10.0 2.3 5.1 14.8 14.8Asset Turnover0.58 0.54 0.56 0.63 0.58 0.62 0.59 0.57 0.72 0.79 0.79Financial Leverage51.8 27.1 18.2 20.8 . 49.6 . . . 11.9 11.9
2002 2003 2004 2005 2006 2007 2008 2009 2010 2011 12-11 Financial HealthWorking Capital USD Mil93924 89880 157480 104352 102615 101403 36806 99358 81737 82690 82690Long-Term Debt USD Mil162222 150231 172973 154332 144373 140255 90534 115373 88733 82060 82060Total Equity USD Mil5590 11651 16045 12957 -3465 5628 -17311 -7820 -673 15028 15028Debt/Equity29.02 12.89 10.78 11.91 . 24.92 . . . 5.46 13.17
2002 2003 2004 2005 2006 2007 2008 2009 2010 2011 TTM ValuationPrice/Earnings62.1 32.1 8.1 6.8 . . . 11.6 10.1 2.2 2.3P/E vs. Market. . . . . . . . . 0.1 0.2Price/Sales0.1 0.2 0.2 0.1 0.1 0.1 0.0 0.3 0.5 0.3 0.3Price/Book3.0 2.4 1.7 1.1 . 2.5 . . . 2.7 2.5Price/Cash Flow0.9 1.5 1.1 0.7 1.5 0.8 . 1.9 6.1 4.6 4.6
Quarterly ResultsRevenue
Rev Growth
Earnings Per Share
USD Mil Mar 11 Jun 11 Sep 11 Dec 11
% Mar 11 Jun 11 Sep 11 Dec 11
USD Mar 11 Jun 11 Sep 11 Dec 11
Most Recent Period 33114.0 35527.0 33047.0 34576.0Prior Year Period 31566.0 35067.0 29893.0 32428.0
Most Recent Period 4.9 1.3 10.6 6.6Prior Year Period 27.4 29.0 -3.2 -8.5
Most Recent Period 0.61 0.59 0.41 3.37Prior Year Period 0.50 0.61 0.43 0.04
Industry Peers by Market Cap
Major Fund Holders
Mkt Cap USD Mil Rev USD Mil P/E ROE%
% of shares
Ford Motor Co 40682 136264 2.3 .Toyota Motor Corp 123373 221244 52.4 1.9Honda Motor Co Ltd 60918 97927 26.5 4.3
.
.
.
TTM data based on rolling quarterly data if available; otherwise most recent annual data shown.
© 2012 Morningstar. All Rights Reserved. Unless otherwise provided in a separate agreement, you may use this report only in the country in which its original distributor is based. Data as originally reported. The information contained herein is not represented or warranted to be accurate, correct, complete, or timely. This report is for information purposes only, and should not be considered a solicitation to buy or sell any security. Redistribution is prohibited without written permission. To order reprints, call +1 312-696-6100. To license the research, call +1 312-696-6869. ß
®

91
Morningstar’s Approach to Rating Stocks
Our Key Investing ConceptsEconomic Moat Rating��Discounted Cash Flow��Discount Rate��Fair Value��Uncertainty��Margin of Safety��Consider Buying/Consider Selling��Stewardship Grades��
TMAt Morningstar, we evaluate stocks as pieces of abusiness, not as pieces of paper. We think that purchasingshares of superior businesses at discounts to theirintrinsic value and allowing them to compound their valueover long periods of time is the surest way to createwealth in the stock market. We rate stocks 1 through 5 stars, with 5 the best and 1the worst. Our star rating is based on our analyst’sestimate of how much a company’s business is worth pershare. Our analysts arrive at this "fair value estimate" byforecasting how much excess cash--or "free cashflow"--the firm will generate in the future, and thenadjusting the total for timing and risk. Cash generatednext year is worth more than cash generated several yearsdown the road, and cash from a stable and consistentlyprofitable business is worth more than cash from acyclical or unsteady business. Stocks trading at meaningful discounts to our fair valueestimates will receive high star ratings. For high-qualitybusinesses, we require a smaller discount than formediocre ones, for a simple reason: We have moreconfidence in our cash-flow forecasts for strongcompanies, and thus in our value estimates. If a stock’smarket price is significantly above our fair value estimate,it will receive a low star rating, no matter how wonderfulwe think the business is. Even the best company is a baddeal if an investor overpays for its shares. Our fair value estimates don’t change very often, butmarket prices do. So, a stock may gain or lose stars based
just on movement in the share price. If we think a stock’sfair value is $50, and the shares decline to $40 withoutmuch change in the value of the business, the star ratingwill go up. Our estimate of what the business is worthhasn’t changed, but the shares are more attractive as aninvestment at $40 than they were at $50. Because we focus on the long-term value of businesses,rather than short-term movements in stock prices, at timeswe may appear out of step with the overall stock market.When stocks are high, relatively few will receive ourhighest rating of 5 stars. But when the market tumbles,many more will likely garner 5 stars. Although you mightexpect to see more 5-star stocks as the market rises, wefind assets more attractive when they’re cheap. We calculate our star ratings nightly after the marketsclose, and issue them the following business day, which iswhy the rating date on our reports will always be theprevious business day. We update the text of our reportsas new information becomes available, usually about onceor twice per quarter. That is why you’ll see two dates onevery Morningstar stock report. Of course, we monitormarket events and all of our stocks every business day, soour ratings always reflect our analyst’s current opinion. Economic Moat Rating The Economic Moat Rating is our assessment of a firm’sability to earn returns consistently above its cost of capitalin the future, usually by virtue of some competitiveadvantage. Competition tends to drive down such
TM
TM
Morningstar ResearchMethodology for ValuingCompanies QQQQQCompetitive Economic Company Fair Value Uncertainty
Analysis Moat Rating Valuation Estimate AssessmentTM
Analyst conducts The depth of the Analyst considers DCF model leads to An uncertaintycompany and industry firm’s competitive company financial the firm’s Fair Value assessmentresearch: advantage is rated: statements and Estimate, which establishes the� � competitive position anchors the rating margin ofManagement None to forecast future framework. safety required forinterviews Narrow cash flows. the stock rating.Conference calls Wide �Trade-show visits Assumptions areCompetitor, supplier, input into a dis-distributor, and counted cash-flowcustomer interviews model.
The current stockprice relative to fairvalue, adjustedfor uncertainty,determines therating.
QQQQQQQQQQQQQQQ
© 2012 Morningstar. All Rights Reserved. Unless otherwise provided in a separate agreement, you may use this report only in the country in which its original distributor is based. Data as originally reported.The information contained herein is not represented or warranted to be accurate, correct, complete, or timely. This report is for information purposes only, and should not be considered a solicitation to buy or sell any security.Redistribution is prohibited without written permission. To order reprints, call +1 312-696-6100. To license the research, call +1 312-696-6869.
ß ®

92
Morningstar’s Approach to Rating Stocks (continued)
economic profits, but companies that can earn them for anextended time by creating a competitive advantagepossess an Economic Moat. We see these companies assuperior investments. Discounted Cash Flow This is a method for valuing companies that involvesprojecting the amount of cash a business will generate inthe future, subtracting the amount of cash that thecompany will need to reinvest in its business, and usingthe result to calculate the worth of the firm. We use thistechnique to value nearly all of the companies we cover. Discount Rate We use this number to adjust the value of our forecastedcash flows for the risk that they may not materialize. For aprofitable company in a steady line of business, we’ll usea lower discount rate, also known as "cost of capital,"than for a firm in a cyclical business with fiercecompetition, since there’s less risk clouding the firm’sfuture. Fair Value This is the output of our discounted cash-flow valuationmodels, and is our per-share estimate of a company’sintrinsic worth. We adjust our fair values for off-balancesheet liabilities or assets that a firm might have--forexample, we deduct from a company’s fair value if it hasissued a lot of stock options or has an under-fundedpension plan. Our fair value estimate differs from a "targetprice" in two ways. First, it’s an estimate of what thebusiness is worth, whereas a price target typically reflectswhat other investors may pay for the stock. Second, it’s along-term estimate, whereas price targets generally focuson the next two to 12 months. Uncertainty To generate the Morningstar Uncertainty Rating, analystsconsider factors such as sales predictability, operatingleverage, and financial leverage. Analysts then classifytheir ability to bound the fair value estimate for the stockinto one of several uncertainty levels: Low, Medium, High,
Very High, or Extreme. The greater the level of uncertainty,the greater the discount to fair value required before astock can earn 5 stars, and the greater the premium to fairvalue before a stock earns a 1-star rating. Margin of Safety This is the discount to fair value we would require beforerecommending a stock. We think it’s always prudent tobuy stocks for less than they’re worth.The margin of safetyis like an insurance policy that protects investors from badnews or overly optimistic fair value estimates. We requirelarger margins of safety for less predictable stocks, andsmaller margins of safety for more predictable stocks. Consider Buying/Consider Selling The consider buying price is the price at which a stockwould be rated 5 stars, and thus the point at which wewould consider the stock an extremely attractivepurchase. Conversely, consider selling is the price atwhich a stock would have a 1 star rating, at which pointwe’d consider the stock overvalued, with low expectedreturns relative to its risk. Stewardship Grades Our corporate Stewardship Rating represents ourassessment of management’s stewardship of shareholdercapital, with particular emphasis on capital allocationdecisions. Analysts consider companies’ investmentstrategy and valuation, financial leverage, dividend andshare buyback policies, execution, compensation, relatedparty transactions, and accounting practices. Corporategovernance practices are only considered if they’ve had ademonstrated impact on shareholder value. Analystsassign one of three ratings: "Exemplary," "Standard," and"Poor." Analysts judge stewardship from an equity holder’sperspective. Ratings are determined on an absolute basis.Most companies will receive a Standard rating, and this isthe default rating in the absence of evidence thatmanagers have made exceptionally strong or poor capitalallocation decisions.
© 2012 Morningstar. All Rights Reserved. Unless otherwise provided in a separate agreement, you may use this report only in the country in which its original distributor is based. Data as originally reported.The information contained herein is not represented or warranted to be accurate, correct, complete, or timely. This report is for information purposes only, and should not be considered a solicitation to buy or sell any security.Redistribution is prohibited without written permission. To order reprints, call +1 312-696-6100. To license the research, call +1 312-696-6869.
ß ®

93
Ford Motor Co F [NYSE] | QQQQQTM
Last Price Fair Value Consider Buy Consider Sell Uncertainty Economic Moat Stewardship Morningstar Credit Rating Industry10.66 USD 23.00 USD 13.80 USD 35.70 USD High None . Auto Manufacturers BBB-
Close Competitors Currency(Mil) Market Cap TTM Sales Oper Income Net Income
Ford Motor Co
Toyota Motor Corp
Honda Motor Co Ltd
Bayerische Motoren Werke AG
USD
USD
USD
USD
40,682 136,264 6,943 20,213
123,373 221,244 2,061 2,373
60,918 97,927 2,091 2,329
. . . .
Morningstar data as of May 07, 2012.
profit to increase. Full-year U.S. industry sales (after weback out 300,000 units for medium- and heavy-duty trucks)are guided to be between 14.2 million and 14.7 millionvehicles. This guidance is higher than our range of 13.8million-14.2 million but not an unreasonable assumption. Also noteworthy is that the company announced avoluntary pension buyout offer for all approximately90,000 U.S. salaried retirees and former U.S. salariedemployees. The funds for the buyout will come frompension plan assets rather than from Ford’s $23.1 billionautomotive cash and marketable securities balance.However, the company did contribute $1.1 billion to itsplans during the quarter and has previously said it willcontribute about $3.5 billion in cash this year. The exactacceptance rate of this buyout offer is too uncertain at thistime but the total salaried participant liability is about onethird of the U.S. plan’s $48.8 billion projected benefitobligation. The buyouts are expected to be completedduring 2013. It is possible that eventually a buyout offercould be extended to the hourly participants, but thiswould first require delicate negotiations with the UAW.The salaried plan has been closed to new hires since2004. Finally, the balance sheet remains strong with netautomotive cash at $9.3 billion compared to $9.8 billion atyear-end. Automotive cash slightly increased sequentiallybut automotive debt increased by $600 million, mostly dueto a $500 million draw on loans from the U.S. Departmentof Energy. Total liquidity was $32.9 billion at March 31.Ford has recently seen a lot of positives in its capital
allocation and capital structure. The first quarter saw thecompany resume its dividend (last paid in 2006) and Fordreceived an extension of its credit facility with $9 billioncommitted through November 2015. Also, this week, Fitchupgraded Ford to investment grade, which Morningstarhas already done, and the company should eventually seelower borrowing costs for its auto operations and thecaptive. Lower captive financing costs will likely lead tomore vehicle sales as Ford can offer consumers moreattractive lease offers and finance more consumers. Thesis Mar. 14, 2012 Ford Motor Company’s products, marketing, and unioncontract should position the automaker to compete betterthan in the past. Still, it will take time for the company toregain market share in the United States, as someconsumers are still very loyal to Japanese and Europeanbrands.� Detroit automakers continue to rely on pickup trucks andsport-utility vehicles for profits, but recent higher fuelprices have changed the industry. Since 2003, the U.S.light-truck/car mix has transitioned to 50%/50% from54%/46%, while Ford continues to get about two thirds ofits U.S. sales from light trucks. Ford’s managementrealizes the need to sell more cars, as gas prices willprobably rise over time�and Toyota, Honda, and Hyundaicontinue to push into light trucks. Ford’s overall U.S.market share is about 17% compared with more than 20%in 2003.� Ford continues to increase its consideration in America,mostly because it did not take government loans and ismaking better cars. In 2010, Ford picked up nearly 0.9percentage point of�market share and retained nearly allof this share in 2011. More emphasis on quality is payingoff as well. According to Ford, "projected resale value of2010 Ford, Lincoln, and Mercury vehicles after 36 months
© 2012 Morningstar. All Rights Reserved. Unless otherwise provided in a separate agreement, you may use this report only in the country in which its original distributor is based. Data as originally reported.The information contained herein is not represented or warranted to be accurate, correct, complete, or timely. This report is for information purposes only, and should not be considered a solicitation to buy or sell any security.Redistribution is prohibited without written permission. To order reprints, call +1 312-696-6100. To license the research, call +1 312-696-6869.
ß ®

94
Ford Motor Co F [NYSE] | QQQQQTM
Last Price Fair Value Consider Buy Consider Sell Uncertainty Economic Moat Stewardship Morningstar Credit Rating Industry10.66 USD 23.00 USD 13.80 USD 35.70 USD High None . Auto Manufacturers BBB-
in service increased by an average of $1,310 per vehiclecompared to the 2009 model year--the industry’s largestincrease among full-line manufacturers." These higherresidual values come from the fact that Ford now makescars people actually want to own instead of vehicles thatare purchased only because of heavy incentives. Weexpect continued improvement in residual values thanks todramatically better vehicles such as the Explorer, Taurus,and 2013 Fusion� Another key change is building more Ford models oncommon platforms, which will improve economies ofscale. By mid-decade, Ford expects 75% of its globalproduction, or 6 million vehicles, will come from fivevehicle architectures. This move will also allow Ford toswitch production faster to meet changing demand whiledrastically cutting costs via better economies of scale thanin recent decades. This change could save Ford billions ofdollars in development costs. The global subcompact andcompact platforms (B & C segments) now each get over 2million units of annual volume. Before Mulally’s arrival,Ford had a different platform in each segment for eachpart of the world. The old way wasted billions and hadvolumes too low to achieve the economies of scale Fordcan achieve going forward.� Branding is an area Ford continues to change. With the2008 sale of Jaguar and Land Rover to Tata Motors,brands consisted of Ford, Lincoln, Mercury, Volvo, andMazda. With Volvo sold to China’s Geely in August 2010,Mercury�now closed, and Ford owning only 3.5% ofMazda, the Ford and Lincoln brands are critical to thecompany’s success. Fuel-efficient models, such as theFiesta and Focus, have been well received, so Ford needsto give these consumers a desirable Lincoln to trade up towhen they are wealthier. A strong luxury group willincrease profits because it will allow Ford to sell to allconsumer variants while retaining current Ford customers.For now, however, Lincoln’s offerings put it more in the
premium segment, so better product is needed,�and thistransformation will take several years.� The 2007 collective bargaining agreement (amended in2009) with the�United Auto Workers has saved Fordbillions of dollars since the UAW’s voluntary employees’beneficiary association�fund, or VEBA, became solelyresponsible for retiree health care�in 2010.�This agreementis critically important because Ford finally has U.S. laborcosts close to foreign rivals’. Furthermore, with the2011�deal, Ford will have fixed-cost stability through Sept.14, 2015, and possibly beyond if the union does not returnto its old hard-line ways. This stability combined with ourexpectation of a large increase in U.S. auto sales meansFord’s earnings and free cash flow should be strong for along time. Valuation, Growth and Profitability We are�maintaining our fair value estimate�at $23 pershare. We believe there are millions of units of pent-updemand in the United States, which we expect will driveFord’s growth over the next few years.�Thus, we see muchmore upside potential than downside risk to Ford’s stock.We model 2012 North American industry light-vehicleproduction of 13.8 million units and then 14.5 million in2013 as the industry�gradually absorbs pent-up demand.We model the critical midcycle automotive�operatingmargin in the last year of our explicit forecast period atjust over 7%--well below Ford’s guidance of 8%-9% bymid-decade. Capital expenditure is modeled at about 4.5%of revenue on average. Our weighted average cost ofcapital is 10.5%. We use a higher WACC than what weuse for General Motors Company�to reflect overhang onFord stock for the dual share class arrangement that givesthe Ford family 40% voting rights.� Our fair value estimate could change dramatically, giventhe extreme sensitivity of our discounted cash flow model
© 2012 Morningstar. All Rights Reserved. Unless otherwise provided in a separate agreement, you may use this report only in the country in which its original distributor is based. Data as originally reported.The information contained herein is not represented or warranted to be accurate, correct, complete, or timely. This report is for information purposes only, and should not be considered a solicitation to buy or sell any security.Redistribution is prohibited without written permission. To order reprints, call +1 312-696-6100. To license the research, call +1 312-696-6869.
ß ®

95
Ford Motor Co F [NYSE] | QQQQQTM
Last Price Fair Value Consider Buy Consider Sell Uncertainty Economic Moat Stewardship Morningstar Credit Rating Industry10.66 USD 23.00 USD 13.80 USD 35.70 USD High None . Auto Manufacturers BBB-
to key inputs such as North American light-vehicleproduction, midcycle margin, and the WACC. For example,reducing our year five midcycle margin by 100 basispoints, while holding all other assumptions constant,reduces our fair value estimate to $20, or 13%. Our fairvalue uncertainty is high to account for the widepossibilities in Ford’s fair value, given its high degree ofoperating leverage. Risk Barriers to entry are declining as a growing global marketreduces fixed costs as a percentage of sales for newentrants. The company operates in a very cyclical industrythat is coming out from one of its worst-ever downturns. Akey risk to Ford long term is that the UAW goes back to amore hard-line negotiating style at the next�contractnegotiation in September 2015. Another important risk isthat the current ultralow interest rate environment willcause pension obligations to rise dramatically at the sametime that plan asset values are falling. Management’sgoal of fully funding the pension plans on a global basis bymid-decade will likely not be met if interest rates stay atcurrent levels. Bulls Say
Ford recently resumed its dividend, and we think itdeserves an investment-grade credit rating from themajor rating agencies. The revamped Fiesta, Focus, Fusion, and Taurus showFord can make quality, fuel-efficient vehicles tocompete with Toyota and Honda. We expect Ford’s free cash flow generation tosignificantly improve over the coming years. Ford is ahead of GM in its use of common vehicleplatforms.
Bears Say The auto industry is very cyclical, and until recently,Detroit automakers had been losing U.S. market shareto foreign automakers for years. Long-term profitability could be hindered by unions,which traditionally have wanted their share of the pie.The nonunionized import automakers in the U.S. do nothave this problem. Stricter fuel economy regulations will make cars moreexpensive to build, and these costs are likely to bepassed on to consumers. Ford’s stock can sell off heavily because ofmacroeconomic fears, even if the company itself isdoing well. Although Ford’s products are much improved, there areplenty of Americans who refuse to buy from a Detroitautomaker because of prior quality problems.
Financial Overview Financial Health: We think Ford will continue to use itsfree cash flow to pay off debt and reduce pensionliabilities, including a $3.5 billion cash pensioncontribution in 2012. Year-end pension underfundingtotaled $15.4 billion while international retiree health careadded another $6.6 billion of shortfall. The CFO’scomments on share repurchases at the June 2011 analystday�lead us to believe that no buyback program willhappen anytime soon. Since year-end 2009, Ford reducedits automotive debt (excluding legacy costs) by $20.5billion ($33.6 billion at year-end 2009 less $13.1 billionat�year-end 2011), which lowered annual interest costs bymore than $1 billion. As of the end of 2011, Fordautomotive had available liquidity of $32.4 billion and netcash of $9.8 billion. Company Overview Profile: Ford Motor Company manufactures automobiles
© 2012 Morningstar. All Rights Reserved. Unless otherwise provided in a separate agreement, you may use this report only in the country in which its original distributor is based. Data as originally reported.The information contained herein is not represented or warranted to be accurate, correct, complete, or timely. This report is for information purposes only, and should not be considered a solicitation to buy or sell any security.Redistribution is prohibited without written permission. To order reprints, call +1 312-696-6100. To license the research, call +1 312-696-6869.
ß ®

96
Ford Motor Co F [NYSE] | QQQQQTM
Last Price Fair Value Consider Buy Consider Sell Uncertainty Economic Moat Stewardship Morningstar Credit Rating Industry10.66 USD 23.00 USD 13.80 USD 35.70 USD High None . Auto Manufacturers BBB-
under its Ford and Lincoln brands. The company has about17% market share in the United States and more than8%�share in Europe. Ford and Lincoln brand sales in NorthAmerica and Europe made up 59% and 26% of 2011 autorevenue, respectively. The company also owns 3.5% ofMazda. Ford has about 164,000 employees and is based inDearborn, Mich. Management: Ford’s capital allocation has dramaticallyimproved the past few years. Return on invested capitalhas easily exceeded cost of capital the past two years andwe are pleased to see Ford use its cash to substantiallyreduce debt. We also agree with management’s goal offully funding the pension plan by mid-decade as doing sowill remove a major overhang on the stock. In December2011, Ford announced a resumption of the dividendstarting in March 2012. We think management would nothave done this unless they were confident the dividendcould be maintained in nearly any type of recession. Oncethe company finally receives an investment grade creditrating from the major agencies and better funds thepension, we want to see Ford start a share repurchaseprogram. The shares currently trade well below our fairvalue estimate and a buyback would offset dilution frommultiple share issuances in 2009.� Ford made a bold move in September 2006 by hiring AlanMulally to be president and CEO. Although he’s anoutsider to the auto industry, having come from Boeing,we think Mulally, 66,�has the leadership andmanufacturing expertise to run Ford. He wasMorningstar’s 2010 CEO of the Year. Mulally succeededWilliam Clay Ford Jr., who remains chairman. Like manyfamily companies that trade publicly, Ford has two shareclasses. Class A shares are available for any investor topurchase and each share equals one vote. The Ford familyalways has 40% voting power through ownership of ClassB shares. We would prefer to see one share class sooutside shareholders can have some influence in running
the company. Still, the Ford family’s high ownership alignsits interests with outside shareholders’. We would not besurprised if Mulally resigns shortly after Ford receives aninvestment-grade credit rating from the major agencies.We expect the next CEO to come from within Ford and wethink Mark Fields, president of the Americas, is the mostlikely successor.�
© 2012 Morningstar. All Rights Reserved. Unless otherwise provided in a separate agreement, you may use this report only in the country in which its original distributor is based. Data as originally reported.The information contained herein is not represented or warranted to be accurate, correct, complete, or timely. This report is for information purposes only, and should not be considered a solicitation to buy or sell any security.Redistribution is prohibited without written permission. To order reprints, call +1 312-696-6100. To license the research, call +1 312-696-6869.
ß ®

97
Ford Motor Co F [NYSE] | QQQQQTM
Last Price Fair Value Consider Buy Consider Sell Uncertainty Economic Moat Stewardship Morningstar Credit Rating Industry10.66 USD 23.00 USD 13.80 USD 35.70 USD High None . Auto Manufacturers BBB-
Analyst Notes
Apr. 27, 2012 Ford’s First Quarter Shows North America Will Be the Story in 2012
Ford�reported first-quarter pretax results on Friday of a $2.3billion profit, or $0.39 per diluted share, which beatconsensus estimates of $0.35. Revenue decreased 2.1%year over year to $32.4 billion, which still beat consensus ofabout $31.3 billion. We are leaving our fair value estimatein place as the recovery we anticipate for the U.S. marketappears to be taking hold. Ford North America contributesnearly all of the company’s automotive earnings.� �Automotive operating margin did decline year over year to6.4% from 7.7%, as there was a flat contribution fromvolume and mix while net pricing only increased automotivepretax income by $200 million from the first quarter of2011. Materials and overhead costs more than offset thesmall improvement from pricing, which resulted inautomotive pretax operating profit of $1.8 billion comparedwith $2.1 billion in the prior year’s quarter. As for FordMotor Credit, its results declined as expected to $452million of pretax income from $713 million in first-quarter2011. We expect the captive will continue to be hurt by alower volume of vehicles coming off-lease, which can thenbe resold for profit. We expect this comparable to improvestarting next year as 2009 was the bottom for U.S. newvehicle sales at 10.4 million units; thus, the supply ofvehicles coming off-lease should gradually improve.Management also does not expect any productiondisruptions due to the PA-12 resin shortage following aMarch 31 supplier plant explosion in Germany.� �This quarter showed a trend in automotive that we expectto mostly continue for the rest of the year--that is, NorthAmerican results were quite strong but other marketsdeclined from the prior year. In the first quarter, allgeographic markets outside North America had lowerresults than a year ago, with only South America profitable.Europe lost $149 million, which was better thanmanagement expected, but the company continues to guide
for a full-year loss in Europe of $500 million-$600 million.We expect Europe to be ugly for nearly all automakers forthe foreseeable future because governments kept theircash-for-clunkers subsidy programs in place for severalyears, even into 2011. Ford plants generally run three shiftsin Europe, so actual capacity utilization is likely far belowthe two-shift 93% figure given on Friday’s call. SouthAmerica is guided to be profitable for full-year 2012 but ata lower level than 2011. Automakers from both developednations and emerging markets are flooding Brazil withcapacity, which is leading to pricing competition. FordSouth America did post year-over-year gains from volume,mix, and pricing of $77 million, but these were more thanoffset by a negative materials cost contribution of $118million and a $93 million unfavorable foreign exchangecontribution. Segment operating margin declined severelyto 2.3% from 9.1% in first-quarter 2011. We agree withmanagement that the second half of this year should seeFord South America posting improved results as the newRanger truck and new EcoSport small SUV will be profitablenew programs in the region by that time. Ford’s Asia Pacificand Africa segment is also guided to be profitable for thefull year thanks to the Ranger launch in the Thailand factoryand other new models. For first quarter, however, thesegment saw major headwinds from materials andoverhead costs, which offset the strong $143 millionyear-over-year improvement from pricing. � �These international results are not ideal, but we think it isimportant to focus on the improvements shown by FordNorth America. The segment had its highest quarterly profitsince at least 2000, when it was first reported separately,and its operating margin increased 120 basis points yearover year to 11.5% despite market share declining 80 basispoints to 15.2%. The reason for the $300 million increase inNorth American auto operating profit to $2.1 billion is thatmodest gains in volume, mix, pricing, and lower freight
© 2012 Morningstar. All Rights Reserved. Unless otherwise provided in a separate agreement, you may use this report only in the country in which its original distributor is based. Data as originally reported.The information contained herein is not represented or warranted to be accurate, correct, complete, or timely. This report is for information purposes only, and should not be considered a solicitation to buy or sell any security.Redistribution is prohibited without written permission. To order reprints, call +1 312-696-6100. To license the research, call +1 312-696-6869.
ß ®
98
Ford Motor Co F [NYSE] | QQQQQTM
Last Price Fair Value Consider Buy Consider Sell Uncertainty Economic Moat Stewardship Morningstar Credit Rating Industry10.66 USD 23.00 USD 13.80 USD 35.70 USD High None . Auto Manufacturers BBB-
Analyst Notes (continued)
costs more than offset higher engineering and otheroverhead costs. Management has made it clear that FordNorth America is the key reason why it expectsconsolidated pretax operating profit to be flat in 2012 over2011 but automotive pretax operating profit to increase.Full-year U.S. industry sales (after we back out 300,000units for medium- and heavy-duty trucks) are guided to bebetween 14.2 million and 14.7 million vehicles. Thisguidance is higher than our range of 13.8 million-14.2million but not an unreasonable assumption. � �Also noteworthy is that the company announced a voluntarypension buyout offer for all approximately 90,000 U.S.salaried retirees and former U.S. salaried employees. Thefunds for the buyout will come from pension plan assetsrather than from Ford’s $23.1 billion automotive cash andmarketable securities balance. However, the company didcontribute $1.1 billion to its plans during the quarter andhas previously said it will contribute about $3.5 billion incash this year. The exact acceptance rate of this buyoutoffer is too uncertain at this time but the total salariedparticipant liability is about one third of the U.S. plan’s$48.8 billion projected benefit obligation. The buyouts areexpected to be completed during 2013. It is possible that
eventually a buyout offer could be extended to the hourlyparticipants, but this would first require delicatenegotiations with the UAW. The salaried plan has beenclosed to new hires since 2004.� �Finally, the balance sheet remains strong with netautomotive cash at $9.3 billion compared to $9.8 billion atyear-end. Automotive cash slightly increased sequentiallybut automotive debt increased by $600 million, mostly dueto a $500 million draw on loans from the U.S. Departmentof Energy. Total liquidity was $32.9 billion at March 31.Ford has recently seen a lot of positives in its capitalallocation and capital structure. The first quarter saw thecompany resume its dividend (last paid in 2006) and Fordreceived an extension of its credit facility with $9 billioncommitted through November 2015. Also, this week, Fitchupgraded Ford to investment grade, which Morningstar hasalready done, and the company should eventually see lowerborrowing costs for its auto operations and the captive.Lower captive financing costs will likely lead to morevehicle sales as Ford can offer consumers more attractivelease offers and finance more consumers.�
Apr. 27, 2012 Ford’s 1Q Beats Consensus
Ford��reported first-quarter pretax results Friday of a $2.3billion profit, or $0.39 per diluted share, which beatconsensus estimates of $0.35. Revenue decreased 2.1%year over year to $32.4 billion, which still beat consensus ofabout $31.3 billion. We will probably leave our fair valueestimate in place as the recovery we expect to happen inthe U.S. market appears to be taking hold.� �Automotive operating margin did decline year over year to6.4% from 7.7%, as there was a flat contribution fromvolume and mix while net pricing only increased automotive
pretax income by $200 million from the first quarter of2011. Materials and overhead costs more than offset thesmall improvement from pricing, which resulted inautomotive pretax operating profit of $1.8 billion comparedwith $2.1 billion in the prior year’s quarter. Also noteworthyis that the company announced a voluntary pension buyoutoffer for all approximately 90,000 U.S. salaried retirees andformer U.S. salaried employees. The funds for the buyoutwill come from pension plan assets rather than from Ford’s$23.1 billion automotive cash and marketable securitiesbalance.�
© 2012 Morningstar. All Rights Reserved. Unless otherwise provided in a separate agreement, you may use this report only in the country in which its original distributor is based. Data as originally reported.The information contained herein is not represented or warranted to be accurate, correct, complete, or timely. This report is for information purposes only, and should not be considered a solicitation to buy or sell any security.Redistribution is prohibited without written permission. To order reprints, call +1 312-696-6100. To license the research, call +1 312-696-6869.
ß ®
99
Ford Motor Co F [NYSE] | QQQQQTM
Last Price Fair Value Consider Buy Consider Sell Uncertainty Economic Moat Stewardship Morningstar Credit Rating Industry10.66 USD 23.00 USD 13.80 USD 35.70 USD High None . Auto Manufacturers BBB-
Analyst Notes (continued)
�This quarter showed a trend that we expect to continue forthe rest of the year, in that North American results werequite strong but other markets declined from the prior year.In the first quarter, all geographic markets outside NorthAmerica had lower results than a year ago, with only SouthAmerica profitable. These results are not ideal, but wethink it is important to focus on the improvements shown byFord North America. The segment had its highest quarterlyprofit since at least 2000, when it was first reported
separately, and its operating margin increased 120 basispoints year over year to 11.5% despite market sharedeclining 80 basis points to 15.2%. The reason for the $300million increase in North American auto operating profit to$2.1 billion is that modest gains in volume, mix, pricing, andlower freight costs more than offset higher engineering andother overhead costs. We will publish a more detailed noteafter the earnings call.�
Feb. 09, 2012 Ford’s CFO and Product Head to Retire; Huntsman Joins Board of Directors
Ford Motor Company��announced Thursday that CFO LewisBooth, 63, and product development chief Derrick Kuzak,60, will retire April 1. Booth will be succeeded bycontroller�Bob Shanks, 59, while Raj Nair, 47, will succeedKuzak. Nair is currently vice president of engineering andglobal product development. We see this move as orderlysuccession planning, and we are maintaining our fair valueestimate.� �Bloomberg first reported Booth’s retirement plans, whichFord denied, last month at the North American InternationalAuto Show in Detroit, so we are not surprised by the news.We think Ford wants to avoid having all of its seniormanagement retire at the same time as president and CEOAlan Mulally, who is 66. Mulally said�Thursday that he hasno plans to retire but we continue to expect him to leaveshortly after Ford receives an investment-grade credit ratingfrom the major rating agencies. Thus, we see today’s newsas the first step in passing the torch to the next group ofleaders within Ford. � �Shanks joined Ford in 1977 and has served as controller of
the Americas, CFO of Mazda, head of operations supportand finance for Ford Europe, and CFO of the company’s nowdefunct luxury brand unit, Premier Automotive Group. Healso has experience with Ford in South America and Asiaand has been visible to the investment community for sometime by representing Ford at various conferences. Nairjoined Ford in 1987 as a body and assembly launchengineer and has since served in Europe, Asia, and theAmericas in roles such as executive director of NorthAmerican product development. We think it is appropriatefor Ford to continue to promote from within as these peopleknow the company and its One Ford philosophy well; also,Shanks has probably known president of the AmericasMark Fields for a long time. We think Fields, 51, willsucceed Mulally, though Asia-Pacific and Africa boss JoeHinrichs, 45, is also in the mix.� �Ford also announced Thursday that former presidentialcandidate Jon Huntsman will immediately join the board ofdirectors. We think this appointment is a smart move asHuntsman is a former U.S. ambassador to China, speaksMandarin, and has plenty of connections in Washington.�
Jan. 27, 2012 Ford’s Fourth Quarter Misses Expectations, Long-Term Story Still Attractive
Ford Motor Company��reported pro forma fourth-quarter results Friday of $0.20 per diluted share, which missed
© 2012 Morningstar. All Rights Reserved. Unless otherwise provided in a separate agreement, you may use this report only in the country in which its original distributor is based. Data as originally reported.The information contained herein is not represented or warranted to be accurate, correct, complete, or timely. This report is for information purposes only, and should not be considered a solicitation to buy or sell any security.Redistribution is prohibited without written permission. To order reprints, call +1 312-696-6100. To license the research, call +1 312-696-6869.
ß ®

100
Ford Motor Co F [NYSE] | QQQQQTM
Last Price Fair Value Consider Buy Consider Sell Uncertainty Economic Moat Stewardship Morningstar Credit Rating Industry10.66 USD 23.00 USD 13.80 USD 35.70 USD High None . Auto Manufacturers BBB-
Analyst Notes (continued)
consensus expectations of $0.25. Revenue comfortably beatconsensus by coming in at $34.6 billion (up 6.5%) comparedwith consensus of $32.1 billion. We are disappointed byFriday’s news, but we remain very optimistic about Ford’sfuture; the company has much improved products andpricing power from a few years ago, and we expectsignificant improvement in U.S. light-vehicle sales over thecoming years. The competition is certainly fierce, but wethink Ford will remain a global auto manufacturing leader.We are leaving our fair value estimate unchanged but asalways, we will reassess our valuation inputs when we rollour model forward in February for the 10-K filing.� �Fourth-quarter GAAP earnings per share came in at $3.40because of a nearly $12.5 billion noncash gain from thereversal of the deferred tax asset valuation allowance. Thisreversal is not a surprise, as management has been guidingfor it to happen in 2011 for nearly a year. It is a good signfor Ford, because it means the company expects to beprofitable enough to use its deferred tax assets. Theeffective tax rate going forward per management will beabout 30%, but the important point is that cash taxes willremain low for many years. Ford’s balance sheet remains ina very good position with year-end automotive debt downto $13.1 billion from $19.1 billion at the end of 2010. Only$1 billion of debt is due in 2012 and the company has $32.4billion in automotive liquidity, including nearly $23 billion incash. � �Excluding special items, consolidated fourth-quarter pretaxincome was $1.1 billion, down 14.6% from the prior year’sfourth quarter. Automotive pretax income declined 20.9%to $586 million, primarily because of higher commodity andfreight costs as well as higher North Americancompensation due to the payment of the United AutoWorkers ratification bonus. Geographically, only NorthAmerica posted an increase in automotive pretax operatingprofit while Europe and Asia posted losses. CEO AlanMulally’s comment on the call that Ford Europe is at 93%
capacity utilization (which is high) shows how difficult allautomakers have it in Europe right now. Europe did see afavorable benefit from volume, mix, and pricing but thisincrease was just about completely offset by highercommodity and materials costs. Fortunately, the U.S. iswhat matters most for Ford since it contributes the vastmajority of earnings. Ford North America increased itsfourth-quarter operating margin 60 basis points, or bps,from fourth-quarter 2010 to 4.5% thanks to improvementsin volume, mix, and pricing offsetting increases incommodity, materials, and freight costs. South America’smargins were hit hard (3.9% versus 10% in fourth quarter2010) by lower volumes and a $95 million unfavorableforeign exchange impact. The company will start its newproduct rollouts in South America in the second half of thisyear so more time will be needed to see a turnaround inthis segment. Management said at the North AmericanInternational Auto Show earlier this month that Asia wouldnot be profitable in 2011 because of a higher-than-expectedimpact from the Thailand flooding in the fourth quarter. TheThai flooding cost Ford 34,000 units of lost production. Onthe positive side, volume, mix, and pricing continue to yieldearnings growth for the global auto business ($1.8 billioncontribution in fourth quarter 2010) and we see this fact asa good sign for Ford’s long-term earnings power ifcommodity costs moderate. Fourth-quarter automotiveoperating margin declined 80 bps from fourth quarter 2010to 2.2% and came in at 5.4% for the full year, comparedwith 6.1% in 2010. � �The company also released guidance for 2012 but did notprovide many specific numerical targets. Automotivepre-tax income will be "higher" than 2011 while Ford MotorCredit’s income will decline. Management expects 2012commodity costs to increase but not materially, whichwould be a welcome relief from the pressure Fordexperienced in 2011. Thus, the company expects itsautomotive operating margin to increase from 2011. TheU.S. auto industry sales guidance given after December
© 2012 Morningstar. All Rights Reserved. Unless otherwise provided in a separate agreement, you may use this report only in the country in which its original distributor is based. Data as originally reported.The information contained herein is not represented or warranted to be accurate, correct, complete, or timely. This report is for information purposes only, and should not be considered a solicitation to buy or sell any security.Redistribution is prohibited without written permission. To order reprints, call +1 312-696-6100. To license the research, call +1 312-696-6869.
ß ®

101
?
Gentex Corporation GNTX [Nasdaq] | QQQQQTM
Last Price Fair Value Consider Buy Consider Sell Uncertainty Economic Moat Stewardship Morningstar Credit Rating Industry23.19 USD 34.00 USD 23.80 USD 45.90 USD Medium Narrow . Auto Parts .
Currency amounts expressed with "$"are in U.S. dollars (USD) unlessotherwise denoted.
Gentex’s First Quarter Misses on Revenue Despite RecordResults
by David Whiston, CFA, CPA, CFESenior AnalystAnalysts covering this company do notown its stock.
Pricing data through May 07, 2012.Rating updated as ofMay 07, 2012.
08 09 10 11 12
8.0
17.0
25.0
Stock Price
Analyst Note Apr. 19, 2012 Gentex Corporation��reported all-time record quarterlyrevenue and net income on Thursday. Diluted earnings pershare matched consensus expectations of $0.32, but wethink the market was not pleased with the 130-basis-pointyear-over-year decline in gross margin to 34.7% and thedisappointing second-quarter revenue guidance. Marginwas hit by the usual annual price reductions demanded bycustomers as well as a higher mix of base mirrors asopposed to advanced feature mirrors. Also, Gentex’s15.8% year-over-year revenue increase to $290.7 millionmissed consensus estimates of $294 million. We are leaving our fair value estimate in place since wesee Gentex’s long-term volume outlook as very strong withU.S. light-vehicle sales continuing their return to normallevels. Gentex has no debt, no pension or health-careobligations, 88% market share, and about $4 per share ofcash and investments. Thursday’s sell-off seems to be anoverreaction, in our opinion, as we continue to believeGentex is one of the best auto suppliers in the world.Excluding cash and investments, we calculate that thestock is trading for less than 12 times 2013 consensusearnings as of mid-day April 19. Total unit shipments increased 15.5% year over year tonearly 6.3 million mirrors, thanks to higher demand fromNorth American and European automakers. NorthAmerican unit shipments increased 18% compared to a16% increase in total industry production whileinternational shipments increased 14%. Dimmable aircraftwindow unit volume increased 48% due to more volumeon the Boeing 787 but this segment remains a very smallpart of Gentex’s operations. Management kept guidance mostly limited to the secondquarter, with revenue projected to increase by about 15%year over year and with flat gross margin compared tofirst-quarter 2012. This revenue guidance equates to
projected second-quarter sales of $279.5 million, which isbelow consensus estimates of $285.8 million. Unit volumefor SmartBeam for full-year 2012 remains at a projectedincrease of 40%-45% compared to 1 million units in 2011.The company also gave its first full-year guidance for rearcamera display (RCD) mirrors (which we think the marketdid not like) of flat volume in 2012 (1.7 million units in2011). We share the Street’s concern given that it isreasonable to expect RCD volumes to increase in 2012since total North American production is up 16% throughMarch. It is possible RCD growth will remain flat until theNational Highway Traffic Safety Administration (NHTSA)issues final rules for automakers to comply with the KidsTransportation Safety Act, which NHTSA currently says itwill do by the end of this year. Although we think Gentex shares are cheap, there arelikely to be some headwinds this year, especially inEurope due to its debt problems. Europe made up 45% ofunit volume in full-year 2011, and fortunately for Gentex,Germany is its largest European market at nearly 17% oftotal revenue. According to the European AutomobileManufacturers’ Association (ACEA), German passenger carregistrations in the first quarter actually increased 1.3%from first-quarter 2011. The European auto market is sobad right now that any increase is considered to be goodnews. Further helpful factors to at least partially mitigateEuropean exposure is that Volkswagen��and Mercedes areabout 26% of total revenue and these two firms are someof the best positioned European OEMs today. Gentex doesnot have major foreign-exchange exposure since 90% ofits sales are in U.S. dollars. As for the looming PA-12 resin shortage following a largeexplosion at German chemical maker Evonik Industries AGon March 31, Gentex does not expect any disruptions toits own operations, but it is still assessing the impact. Thecompany did increase its raw material inventory by 6%from the fourth quarter, so there is a small buffer shouldthe situation become much worse. PA-12 is used as acoating in fuel and brake systems, so the shortage is not adirect threat to Gentex. We see Gentex’s overall downsideinvestment risk as limited following large sell-offs in the
102
Morningstar’s Approach to Rating Stocks (continued)
economic profits, but companies that can earn them for anextended time by creating a competitive advantagepossess an Economic Moat. We see these companies assuperior investments. Discounted Cash Flow This is a method for valuing companies that involvesprojecting the amount of cash a business will generate inthe future, subtracting the amount of cash that thecompany will need to reinvest in its business, and usingthe result to calculate the worth of the firm. We use thistechnique to value nearly all of the companies we cover. Discount Rate We use this number to adjust the value of our forecastedcash flows for the risk that they may not materialize. For aprofitable company in a steady line of business, we’ll usea lower discount rate, also known as "cost of capital,"than for a firm in a cyclical business with fiercecompetition, since there’s less risk clouding the firm’sfuture. Fair Value This is the output of our discounted cash-flow valuationmodels, and is our per-share estimate of a company’sintrinsic worth. We adjust our fair values for off-balancesheet liabilities or assets that a firm might have--forexample, we deduct from a company’s fair value if it hasissued a lot of stock options or has an under-fundedpension plan. Our fair value estimate differs from a "targetprice" in two ways. First, it’s an estimate of what thebusiness is worth, whereas a price target typically reflectswhat other investors may pay for the stock. Second, it’s along-term estimate, whereas price targets generally focuson the next two to 12 months. Uncertainty To generate the Morningstar Uncertainty Rating, analystsconsider factors such as sales predictability, operatingleverage, and financial leverage. Analysts then classifytheir ability to bound the fair value estimate for the stockinto one of several uncertainty levels: Low, Medium, High,
Very High, or Extreme. The greater the level of uncertainty,the greater the discount to fair value required before astock can earn 5 stars, and the greater the premium to fairvalue before a stock earns a 1-star rating. Margin of Safety This is the discount to fair value we would require beforerecommending a stock. We think it’s always prudent tobuy stocks for less than they’re worth.The margin of safetyis like an insurance policy that protects investors from badnews or overly optimistic fair value estimates. We requirelarger margins of safety for less predictable stocks, andsmaller margins of safety for more predictable stocks. Consider Buying/Consider Selling The consider buying price is the price at which a stockwould be rated 5 stars, and thus the point at which wewould consider the stock an extremely attractivepurchase. Conversely, consider selling is the price atwhich a stock would have a 1 star rating, at which pointwe’d consider the stock overvalued, with low expectedreturns relative to its risk. Stewardship Grades Our corporate Stewardship Rating represents ourassessment of management’s stewardship of shareholdercapital, with particular emphasis on capital allocationdecisions. Analysts consider companies’ investmentstrategy and valuation, financial leverage, dividend andshare buyback policies, execution, compensation, relatedparty transactions, and accounting practices. Corporategovernance practices are only considered if they’ve had ademonstrated impact on shareholder value. Analystsassign one of three ratings: "Exemplary," "Standard," and"Poor." Analysts judge stewardship from an equity holder’sperspective. Ratings are determined on an absolute basis.Most companies will receive a Standard rating, and this isthe default rating in the absence of evidence thatmanagers have made exceptionally strong or poor capitalallocation decisions.
© 2012 Morningstar. All Rights Reserved. Unless otherwise provided in a separate agreement, you may use this report only in the country in which its original distributor is based. Data as originally reported.The information contained herein is not represented or warranted to be accurate, correct, complete, or timely. This report is for information purposes only, and should not be considered a solicitation to buy or sell any security.Redistribution is prohibited without written permission. To order reprints, call +1 312-696-6100. To license the research, call +1 312-696-6869.
ß ®

103
Gentex Corporation GNTX [Nasdaq] | QQQQQTM
Last Price Fair Value Consider Buy Consider Sell Uncertainty Economic Moat Stewardship Morningstar Credit Rating Industry23.19 USD 34.00 USD 23.80 USD 45.90 USD Medium Narrow . Auto Parts .
Close Competitors Currency(Mil) Market Cap TTM Sales Oper Income Net Income
Gentex Corporation
Magna International Inc.
USD
USD
3,344 1,064 237 169
10,062 28,573 1,183 895
Morningstar data as of May 07, 2012.
stock due to the firm’s dominant and growing marketshare as well as due to its fortresslike balance sheet. � Thesis Mar. 19, 2012 Gentex is the creator of auto-dimming rearview and sidemirrors, using electrochromic technology. These mirrorsautomatically darken to eliminate headlight glare fordrivers, and have many other applications. With morethan�650 patents worldwide, some valid through 2029,and a dominant 88% market share, Gentex has a narroweconomic moat that it should be able to protect for a longtime.� The growth prospects for auto-dimming mirrors lookstrong. Gentex estimates that of current worldwideproduction, 20% of cars include interior auto-dimmingmirrors and 5% have at least one exterior auto-dimmingmirror. Management believes that during the next 10 to 12years, auto-dimming mirrors can achieve about 45%market share. This growth will come from increasedvehicle penetration, as more original-equipmentmanufacturers make the safety benefit of auto-dimmingtechnology available, the U.S. government mandatingcamera technology when a vehicle is in reverse, andGentex’s research creating new, advanced-feature mirrorsthat ultimately become standard products.� Growth should be boosted by continually investing inresearch and development. Research allows Gentex tomaintain its competitive advantage by inventing mirrorswith advanced features such as compasses, parking
assistance, and hands-free phone capability. These morehigh-tech mirrors bring higher-priced sales to Gentex andgive it a small degree of pricing power protection from theDetroit Three, which are always demanding concessions.Advanced-feature mirrors are 57% of the firm’s interiormirror shipments, and because pricing is consistentglobally, selling advanced mirrors overseas should notreduce margins. These mirrors are also attractive toautomakers because they offer new features withouthaving to redesign the vehicle’s entire interior.� The two most promising applications�are mirrors with rearcamera display and�SmartBeam mirrors, whichautomatically turn a vehicle’s brights on or off, dependingon conditions outside. Gentex sold 1.7 million RCD mirrorsin 2011, nearly all in the United States. The NationalHighway Traffic Safety Administration (NHTSA)�released aproposal in December 2010 to implement the KidsTransportation Safety Act of 2007. In addition to a gradualphase-in, NHTSA proposes that all vehicles made on orafter Sept. 1, 2014, that weigh 10,000 pounds or less musthave a way for the driver to see part of an area behind thevehicle when the vehicle is in reverse. NHTSA stated thatsensor technology was not acceptable, and thatcamera-based technology is the best way to meet thelegislation. Although NHTSA did not mandate use of anRCD mirror, we think Gentex is a winner in this proposalbecause it has 95% of the RCD market, and the rearviewmirror is an efficient way to meet the legislation. NHTSAcontinues to delay issuance of the final rules. However,since the legislation is already signed, we do expectNHTSA to eventually issue rules for automakers to complywith the law.� SmartBeam is mostly sold in Europe, but its safetybenefits could expand globally.�Research has found thatdrivers use their brights optimally only about 25% of thetime, so Gentex hopes to eventually make this itemstandard because there is such a need for it among
© 2012 Morningstar. All Rights Reserved. Unless otherwise provided in a separate agreement, you may use this report only in the country in which its original distributor is based. Data as originally reported.The information contained herein is not represented or warranted to be accurate, correct, complete, or timely. This report is for information purposes only, and should not be considered a solicitation to buy or sell any security.Redistribution is prohibited without written permission. To order reprints, call +1 312-696-6100. To license the research, call +1 312-696-6869.
ß ®

104
Gentex Corporation GNTX [Nasdaq] | QQQQQTM
Last Price Fair Value Consider Buy Consider Sell Uncertainty Economic Moat Stewardship Morningstar Credit Rating Industry23.19 USD 34.00 USD 23.80 USD 45.90 USD Medium Narrow . Auto Parts .
drivers. Over the long term, Gentex’s technology could alsobe brought to office and airplane windows. The company(in conjunction with PPG Aerospace ) won a contract tosupply auto-dimming passenger windows for the Boeing787 and�Beechcraft King Air 350i, which could expand tomore manufacturers over time. With plenty of cash and adebt-free balance sheet, Gentex has lots of room togrow. Valuation, Growth and Profitability We are raising�our fair value estimate�to $34 per sharefrom�$33. The increase is primarily�due to�a much higherfive-year global light vehicle production forecast by IHSAutomotive. We model Gentex’s 2015 market share toincrease to�nearly 89%, thanks to the NHTSA proposalthat 100% of light vehicles made on or after Sept. 1, 2014,have a way for drivers to see areas behind the vehiclewhen it is in reverse. Note that we assume NHTSA’smultiple delays in issuing final rules will result in itdelaying�its phase-in production schedule by one year.This delay would mean 100% of all vehicles made wouldhave to have a camera starting in Sept. 2015 instead ofthe proposed Sept. 2014. � We emphasize that there is significant uncertainty as tohow much of the industry will decide to place the cameraview in the mirror as opposed to a navigation screen,dashboard, radio or infotainment device. Gentex expectsthe top 20% of the market to use a navigation screen, butis not issuing guidance on how much of the bottom 80%of the market its mirrors will capture. We assume 30% ofthe entire North American market in 2015 uses a RCDmirror, with Gentex capturing 80% of that volume. If all ofthe bottom 80% of the market uses a RCD mirror andGentex keeps its 95% RCD share, our fair value estimatewould increase to $39. � We forecast revenue to increase about 12% on a five-year
compound annual growth rate basis�and operatingmargins to average about 22.5% during our five-yearexplicit forecast period. Top-line growth is important toGentex because margin expansion is difficult�dueto�automakers always seeking price concessions. Wethink the firm’s expertise and high-tech products will getgross margins back�to 36.5%. We forecast capitalexpenditures to average about 9% of revenue per year,and R&D expense to increase 12% to 15% per year. Ourweighted average cost of capital is 9%, reflectingGentex’s strong balance sheet. Risk Gentex’s only large competitor is�Magna Mirrors�(formerlyDonnelly). Magna��has much deeper pockets than Gentex,and could invest substantially in its auto-dimming mirrorgroup in order to try to beat Gentex’s technologyadvantage or devote more sales resources than Gentexcan afford. Also, there is always the possibility that a newand superior technology will be invented and take over theauto-dimming mirror market, but we consider this riskremote. Bulls Say
Gentex estimates that of all the vehicles sold annuallyworldwide, only 20% have an interior auto-dimmingmirror. This leaves plenty of room for more growth. Many of the advanced features Gentex offers can bepackaged and sold as optional equipment. BecauseOEMs can earn large margins on optional equipment,they are less likely to pressure Gentex to lowerprices. Safety legislation, such as the Kids TransportationSafety Act of 2007, requiring rear backup warningtechnology, could be a windfall for Gentex with its RCDmirror. Although the law will probably not require thetechnology to be fully implemented until at least
© 2012 Morningstar. All Rights Reserved. Unless otherwise provided in a separate agreement, you may use this report only in the country in which its original distributor is based. Data as originally reported.The information contained herein is not represented or warranted to be accurate, correct, complete, or timely. This report is for information purposes only, and should not be considered a solicitation to buy or sell any security.Redistribution is prohibited without written permission. To order reprints, call +1 312-696-6100. To license the research, call +1 312-696-6869.
ß ®

105
Gentex Corporation GNTX [Nasdaq] | QQQQQTM
Last Price Fair Value Consider Buy Consider Sell Uncertainty Economic Moat Stewardship Morningstar Credit Rating Industry23.19 USD 34.00 USD 23.80 USD 45.90 USD Medium Narrow . Auto Parts .
September 2014, more automakers are likely to bringthis technology into their vehicles sooner becauseGentex already has the product and consumers willwant a high-tech feature that can save lives. Auto-dimming technology has applications to otherparts of the car, such as headlights, and nonautomotiveproducts, such as airplane windows. Although tiny now,markets outside the auto industry could prove to be verylarge businesses down the road. The company’s financial health is so strong that Gentexcan survive any downturn in the U.S. easier than otherauto suppliers can.
Bears Say
General Motors is Gentex’s second largest customer,and its market share postbankruptcy is uncertain, whichcould affect Gentex’s revenue growth. Technological advantages can disappear very quickly ifa better product is invented by a competitor. As auto-dimming mirrors become available on morevehicle models, OEMs may want to lower their owncosts by pressuring Gentex to reduce prices or bysupporting emerging competitors. Gentex could find better uses for all its cash, such aspaying a higher dividend. A higher dividend would giveshareholders instead of management more control inallocating excess capital.
Financial Overview Financial Health: Gentex is in excellent financial shape,with no debt and�nearly $4�per share in cash andinvestments on its balance sheet. The company has plentyof cash on hand to fund more R&D or a higher dividend ifthe board chooses. Gentex has been paying a dividendsince 2003.
Company Overview Profile: Gentex was founded in 1974 to producesmoke-detection equipment. The company sold its firstglare-control interior mirror in 1982 and its first modelusing electrochromic technology in 1987. Auto-dimmingmirrors are now more than 95% of total sales, and thecompany is constantly developing new applications for thetechnology to remain on top. Sales from 2011 totaledabout $1 billion on�21.5 million units shipped. Thecompany is based in Zeeland, Mich. Management: Chairman and CEO Fred Bauer, 69,�foundedGentex in 1974 and owns 3.3% of thecompany.�Management has achieved returns on investedcapital far exceeding the cost of capital for many yearswhich we expect to continue. The company generates somuch free cash flow (11% of sales on average for the pastfive years) that it has amassed cash and an investmentportfolio, mostly consisting of stocks and governmentbonds, amounting to nearly half of assets. Rather thanpiling up investments, we would prefer to see an evenhigher dividend or more share repurchases when the stockis trading at or below its fair value.�The company has notrepurchased its shares since fourth quarter of 2008, andwe think management correctly recognizes when itsshares are cheap enough to buy back. We think Bauer’scapital allocation�preference is share repurchases becauseof his dislike of the double taxation of dividends.
© 2012 Morningstar. All Rights Reserved. Unless otherwise provided in a separate agreement, you may use this report only in the country in which its original distributor is based. Data as originally reported.The information contained herein is not represented or warranted to be accurate, correct, complete, or timely. This report is for information purposes only, and should not be considered a solicitation to buy or sell any security.Redistribution is prohibited without written permission. To order reprints, call +1 312-696-6100. To license the research, call +1 312-696-6869.
ß ®

106
Gentex Corporation GNTX [Nasdaq] | QQQQQTM
Last Price Fair Value Consider Buy Consider Sell Uncertainty Economic Moat Stewardship Morningstar Credit Rating Industry23.19 USD 34.00 USD 23.80 USD 45.90 USD Medium Narrow . Auto Parts .
Analyst Notes
Apr. 19, 2012 Gentex’s First Quarter Misses on Revenue Despite Record Results
Gentex Corporation��reported all-time record quarterlyrevenue and net income on Thursday. Diluted earnings pershare matched consensus expectations of $0.32, but wethink the market was not pleased with the 130-basis-pointyear-over-year decline in gross margin to 34.7% and thedisappointing second-quarter revenue guidance. Marginwas hit by the usual annual price reductions demanded bycustomers as well as a higher mix of base mirrors asopposed to advanced feature mirrors. Also, Gentex’s 15.8%year-over-year revenue increase to $290.7 million missedconsensus estimates of $294 million. � �We are leaving our fair value estimate in place since wesee Gentex’s long-term volume outlook as very strong withU.S. light-vehicle sales continuing their return to normallevels. Gentex has no debt, no pension or health-careobligations, 88% market share, and about $4 per share ofcash and investments. Thursday’s sell-off seems to be anoverreaction, in our opinion, as we continue to believeGentex is one of the best auto suppliers in the world.Excluding cash and investments, we calculate that thestock is trading for less than 12 times 2013 consensusearnings as of mid-day April 19.� �Total unit shipments increased 15.5% year over year tonearly 6.3 million mirrors, thanks to higher demand fromNorth American and European automakers. North Americanunit shipments increased 18% compared to a 16% increasein total industry production while international shipmentsincreased 14%. Dimmable aircraft window unit volumeincreased 48% due to more volume on the Boeing 787 butthis segment remains a very small part of Gentex’soperations.� �Management kept guidance mostly limited to the secondquarter, with revenue projected to increase by about 15%year over year and with flat gross margin compared to
first-quarter 2012. This revenue guidance equates toprojected second-quarter sales of $279.5 million, which isbelow consensus estimates of $285.8 million. Unit volumefor SmartBeam for full-year 2012 remains at a projectedincrease of 40%-45% compared to 1 million units in 2011.The company also gave its first full-year guidance for rearcamera display (RCD) mirrors (which we think the marketdid not like) of flat volume in 2012 (1.7 million units in2011). We share the Street’s concern given that it isreasonable to expect RCD volumes to increase in 2012since total North American production is up 16% throughMarch. It is possible RCD growth will remain flat until theNational Highway Traffic Safety Administration (NHTSA)issues final rules for automakers to comply with the KidsTransportation Safety Act, which NHTSA currently says itwill do by the end of this year.� �Although we think Gentex shares are cheap, there are likelyto be some headwinds this year, especially in Europe due toits debt problems. Europe made up 45% of unit volume infull-year 2011, and fortunately for Gentex, Germany is itslargest European market at nearly 17% of total revenue.According to the European Automobile Manufacturers’Association (ACEA), German passenger car registrations inthe first quarter actually increased 1.3% from first-quarter2011. The European auto market is so bad right now thatany increase is considered to be good news. Further helpfulfactors to at least partially mitigate European exposure isthat Volkswagen��and Mercedes are about 26% of totalrevenue and these two firms are some of the bestpositioned European OEMs today. Gentex does not havemajor foreign-exchange exposure since 90% of its sales arein U.S. dollars. � �As for the looming PA-12 resin shortage following a largeexplosion at German chemical maker Evonik Industries AGon March 31, Gentex does not expect any disruptions to its
© 2012 Morningstar. All Rights Reserved. Unless otherwise provided in a separate agreement, you may use this report only in the country in which its original distributor is based. Data as originally reported.The information contained herein is not represented or warranted to be accurate, correct, complete, or timely. This report is for information purposes only, and should not be considered a solicitation to buy or sell any security.Redistribution is prohibited without written permission. To order reprints, call +1 312-696-6100. To license the research, call +1 312-696-6869.
ß ®

107
Gentex Corporation GNTX [Nasdaq] | QQQQQTM
Last Price Fair Value Consider Buy Consider Sell Uncertainty Economic Moat Stewardship Morningstar Credit Rating Industry23.19 USD 34.00 USD 23.80 USD 45.90 USD Medium Narrow . Auto Parts .
Analyst Notes (continued)
own operations, but it is still assessing the impact. Thecompany did increase its raw material inventory by 6%from the fourth quarter, so there is a small buffer shouldthe situation become much worse. PA-12 is used as acoating in fuel and brake systems, so the shortage is not a
direct threat to Gentex. We see Gentex’s overall downsideinvestment risk as limited following large sell-offs in thestock due to the firm’s dominant and growing market shareas well as due to its fortresslike balance sheet.�
Feb. 29, 2012 DOT Again Delays Final Rules for Rear Camera Display in Vehicles
On Tuesday, Transportation Secretary Ray LaHood sent aletter to the chairmen of the House Commerce and SenateTransportation committees saying the Department ofTransportation is again extending the deadline to issuefinal rules for automakers to comply with the KidsTransportation Safety Act of 2007. The final rule was dueWednesday, but the DOT now expects to issue the rule byDec. 31. We mentioned in our Jan. 31 note that a delaywas possible. The anticipation of the final release today,followed by the delay, has caused severe volatility inGentex’s��stock price this week. As discussed in our Dec. 3,2010, note when the government first issued proposedrules, we see Gentex as a winner since the governmentsees camera technology as the best way to meet theprovisions of the Kids Transportation Safety Act. The lawrequires drivers to be able to see certain areas behind thevehicle while the vehicle is in reverse. The proposal fromDecember 2010 called for 10% of vehicles manufacturedbetween Sept. 1, 2012, and Aug. 31, 2013, to meet therules, 40% of vehicles made between Sept. 1, 2013, and
Aug. 31, 2014, and 100% of vehicles manufactured on orafter Sept. 1, 2014. The government has not specified theexact placement of the rear camera display, and we expectthe industry to eventually comply with the law by offeringRCD technology in navigation screens, dashboards, and inGentex’s RCD mirrors.� �Gentex’s stock sold off hard Wednesday because of thedelay in the final rules, which we think means that 100%compliance by September 2014 is unlikely. Gentexmanagement has long suspected that the government willeventually push full compliance back to at least 2015. Wesee the sell-off as an overreaction and we have no plans tochange our fair value estimate, since 100% compliance oneyear later in 2015 does not destroy Gentex’s value in ourdiscounted cash flow model. We will reassess ourvaluation assumptions in March once we process our modelfor Gentex’s 10-K filing, but as of now, we do not expectany material downward revision to our fair value estimatebecause of the government’s delay.�
Jan. 31, 2012 Gentex’s Fourth Quarter Misses Consensus Expectations
Gentex��reported fourth-quarter results Tuesday that missedconsensus expectations by $0.02 ($0.28 actual vs. $0.30expected). The company also missed revenue consensus byabout $13 million (sales increased 17% from fourth-quarter2010) and this negative earnings surprise drove the stockdown by as much as 13% Tuesday morning. We are notchanging our fair value estimate at this time but, as always,we will reassess our valuation inputs in February after the
company files its 10-K.� �Although the quarter disappointed the market, we do notsee anything in the results to derail our investment thesis.We continue to believe Gentex will remain one of the bestauto suppliers in the world and will continue to boast adebt free balance sheet that is loaded with cash andinvestments of nearly $4 per share at the end of 2011.
© 2012 Morningstar. All Rights Reserved. Unless otherwise provided in a separate agreement, you may use this report only in the country in which its original distributor is based. Data as originally reported.The information contained herein is not represented or warranted to be accurate, correct, complete, or timely. This report is for information purposes only, and should not be considered a solicitation to buy or sell any security.Redistribution is prohibited without written permission. To order reprints, call +1 312-696-6100. To license the research, call +1 312-696-6869.
ß ®

108
Gentex Corporation GNTX [Nasdaq] | QQQQQTM
Last Price Fair Value Consider Buy Consider Sell Uncertainty Economic Moat Stewardship Morningstar Credit Rating Industry23.19 USD 34.00 USD 23.80 USD 45.90 USD Medium Narrow . Auto Parts .
Analyst Notes (continued)
Gentex’s dominant 85% share of the auto-dimming mirrormarket, combined with our expectation of a significantincrease in U.S. light-vehicle sales over the next few years,leads us to believe that a large sell-off in the name fromone quarter’s results is not deserved. Further support for ouropinion comes from the fact that Gentex continues toincrease its unit shipments year over year many morepercentage points than changes in light-vehicle production.For example, in the fourth quarter, Gentex increased NorthAmerican mirror shipments by 22% while North Americanindustry production increased by 16%. International unitshipments increased 13% despite a 1% decline in Europeanindustry production thanks to continued business frombrands such as Volkswagen and Mercedes and because ofa 12% increase in industry production in Japan and Korea.� �Fourth-quarter gross margin came in at 34.7% compared to35.8% in the prior year’s quarter. Supply chain problemsfrom the Thailand flooding cost the company about 25 basispoints of margin, which was on the low end of its guidanceon the third-quarter earnings call, and the rest of thedecrease came from the annual price reductions that arecommon in the auto industry. Although inventory hasincreased considerably throughout 2011, the CFO said onTuesday’s earnings call that most of the increase is in rawmaterials due to longer lead times from electronicsshortages following the Japanese tsunami and Thaiflooding. Thus, we are looking for a favorable workingcapital change as 2012 unfolds. We also expect thecompany to get some capacity relief in the second half of2012 once its capital improvement projects finish.
Assuming revenue continues to grow, this could helpmargins as the company will not have to use as muchovertime labor.� �Management also gave some guidance for 2012.First-quarter revenue is expected to increase 15%-20%from first-quarter 2011, while gross margin will be in "thesame range" as fourth-quarter 2011. SmartBeam unitshipments are expected to increase 40%-45% in full-year2012 from a 1 million unit total in 2011. Rear cameradisplay mirrors (RCD) hit 1.7 million units shipped in 2011and management expects a 10%-15% increase in RCDshipments for first-quarter 2012. No full-year RCD guidancewas given. Capital expenditures in 2011 were $120.2million and are�forecast to be $130-$140 million in 2012.Once capital projects are finished later this year, interiormirror capacity will be 21 million-23 million units andexterior unit capacity will be 10 million. � �The company is eagerly awaiting the government’sannouncement of final rules to implement the KidsTransportation Safety Act. These rules were due by the endof last February but the deadline was extended to Dec. 31,2011, and was recently again extended to Feb. 29, 2012.Management expects the original implementation of RCDtechnology in all newly produced U.S. vehicles to be pushedback a year to September 2015 from September 2014, butwe will wait for the government to publish the final rule toknow for sure.�
© 2012 Morningstar. All Rights Reserved. Unless otherwise provided in a separate agreement, you may use this report only in the country in which its original distributor is based. Data as originally reported.The information contained herein is not represented or warranted to be accurate, correct, complete, or timely. This report is for information purposes only, and should not be considered a solicitation to buy or sell any security.Redistribution is prohibited without written permission. To order reprints, call +1 312-696-6100. To license the research, call +1 312-696-6869.
ß ®
Disclaimers & DisclosuresNo Morningstar employees are officers or directors of this company. Morningstar Inc. does not own more than 1% of the shares of this company. Analystscovering this company do not own its stock. The information contained herein is not represented or warranted to be accurate, correct, complete, or timely.This report is for information purposes only, and should not be considered a solicitation to buy or sell any security.
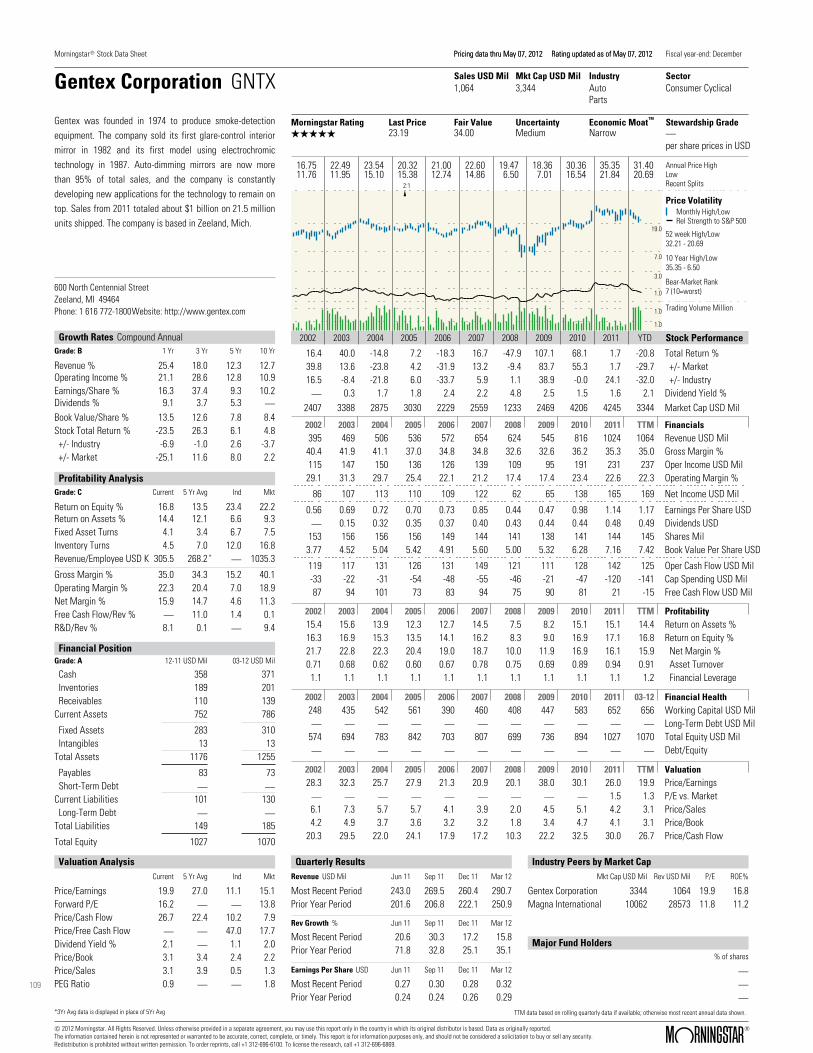
109
Morningstar Stock Data Sheet Pricing data thru May 07, 2012 Rating updated as of May 07, 2012Pricing data thru May 07, 2012 Rating updated as of May 07, 2012 Fiscal year-end: December
Gentex Corporation GNTX Sales USD Mil Mkt Cap USD Mil Industry Sector1,064 3,344 Auto
Parts Consumer Cyclical
TMMorningstar Rating Last Price Fair Value Uncertainty Economic Moat Stewardship GradeQQQQQ 23.19 34.00 Medium Narrow .
per share prices in USD
2002 2003 2004 2005 2006 2007 2008 2009 2010 2011 YTD
1.0
3.0
7.0
19.0
1.0
1.0
16.7511.76
22.4911.95
23.5415.10
20.3215.38
21.0012.74
22.6014.86
19.476.50
18.367.01
30.3616.54
35.3521.84
31.4020.69
Annual Price HighLowRecent Splits
Price VolatilityMonthly High/LowRel Strength to S&P 500
52 week High/Low32.21 - 20.69
10 Year High/Low35.35 - 6.50
Bear-Market Rank7 (10=worst)
Trading Volume Million
Stock Performance
2:1
Gentex was founded in 1974 to produce smoke-detectionequipment. The company sold its first glare-control interiormirror in 1982 and its first model using electrochromictechnology in 1987. Auto-dimming mirrors are now morethan 95% of total sales, and the company is constantlydeveloping new applications for the technology to remain ontop. Sales from 2011 totaled about $1 billion on�21.5 millionunits shipped. The company is based in Zeeland, Mich.
600 North Centennial Street Zeeland, MI 49464Phone: 1 616 772-1800Website: http://www.gentex.com
Growth Rates Compound AnnualGrade: B 1 Yr 3 Yr 5 Yr 10 Yr
Revenue % 25.4 18.0 12.3 12.7Operating Income % 21.1 28.6 12.8 10.9Earnings/Share % 16.3 37.4 9.3 10.2Dividends % 9.1 3.7 5.3 .
Book Value/Share % 13.5 12.6 7.8 8.4Stock Total Return % -23.5 26.3 6.1 4.8+/- Industry -6.9 -1.0 2.6 -3.7+/- Market -25.1 11.6 8.0 2.2
Profitability AnalysisGrade: C Current 5 Yr Avg Ind Mkt
Return on Equity % 16.8 13.5 23.4 22.2Return on Assets % 14.4 12.1 6.6 9.3Fixed Asset Turns 4.1 3.4 6.7 7.5Inventory Turns 4.5 7.0 12.0 16.8Revenue/Employee USD K 305.5 268.2 . 1035.3
Gross Margin % 35.0 34.3 15.2 40.1Operating Margin % 22.3 20.4 7.0 18.9Net Margin % 15.9 14.7 4.6 11.3Free Cash Flow/Rev % . 11.0 1.4 0.1R&D/Rev % 8.1 0.1 . 9.4
*
*3Yr Avg data is displayed in place of 5Yr Avg
Financial PositionGrade: A 12-11 USD Mil 03-12 USD Mil
Cash 358 371Inventories 189 201Receivables 110 139
Current Assets 752 786
Fixed Assets 283 310Intangibles 13 13
Total Assets 1176 1255
Payables 83 73Short-Term Debt . .
Current Liabilities 101 130Long-Term Debt . .
Total Liabilities 149 185
Total Equity 1027 1070
2002 2003 2004 2005 2006 2007 2008 2009 2010 2011 TTM FinancialsRevenue USD Mil395 469 506 536 572 654 624 545 816 1024 1064Gross Margin %40.4 41.9 41.1 37.0 34.8 34.8 32.6 32.6 36.2 35.3 35.0Oper Income USD Mil115 147 150 136 126 139 109 95 191 231 237Operating Margin %29.1 31.3 29.7 25.4 22.1 21.2 17.4 17.4 23.4 22.6 22.3
Net Income USD Mil86 107 113 110 109 122 62 65 138 165 169
Earnings Per Share USD0.56 0.69 0.72 0.70 0.73 0.85 0.44 0.47 0.98 1.14 1.17Dividends USD. 0.15 0.32 0.35 0.37 0.40 0.43 0.44 0.44 0.48 0.49Shares Mil153 156 156 156 149 144 141 138 141 144 145Book Value Per Share USD3.77 4.52 5.04 5.42 4.91 5.60 5.00 5.32 6.28 7.16 7.42
Oper Cash Flow USD Mil119 117 131 126 131 149 121 111 128 142 125Cap Spending USD Mil-33 -22 -31 -54 -48 -55 -46 -21 -47 -120 -141Free Cash Flow USD Mil87 94 101 73 83 94 75 90 81 21 -15
Valuation AnalysisCurrent 5 Yr Avg Ind Mkt
Price/Earnings 19.9 27.0 11.1 15.1Forward P/E 16.2 . . 13.8Price/Cash Flow 26.7 22.4 10.2 7.9Price/Free Cash Flow . . 47.0 17.7Dividend Yield % 2.1 . 1.1 2.0Price/Book 3.1 3.4 2.4 2.2Price/Sales 3.1 3.9 0.5 1.3PEG Ratio 0.9 . . 1.8
Total Return %16.4 40.0 -14.8 7.2 -18.3 16.7 -47.9 107.1 68.1 1.7 -20.8+/- Market39.8 13.6 -23.8 4.2 -31.9 13.2 -9.4 83.7 55.3 1.7 -29.7+/- Industry16.5 -8.4 -21.8 6.0 -33.7 5.9 1.1 38.9 -0.0 24.1 -32.0
Dividend Yield %. 0.3 1.7 1.8 2.4 2.2 4.8 2.5 1.5 1.6 2.1Market Cap USD Mil2407 3388 2875 3030 2229 2559 1233 2469 4206 4245 3344
2002 2003 2004 2005 2006 2007 2008 2009 2010 2011 TTM ProfitabilityReturn on Assets %15.4 15.6 13.9 12.3 12.7 14.5 7.5 8.2 15.1 15.1 14.4Return on Equity %16.3 16.9 15.3 13.5 14.1 16.2 8.3 9.0 16.9 17.1 16.8
Net Margin %21.7 22.8 22.3 20.4 19.0 18.7 10.0 11.9 16.9 16.1 15.9Asset Turnover0.71 0.68 0.62 0.60 0.67 0.78 0.75 0.69 0.89 0.94 0.91Financial Leverage1.1 1.1 1.1 1.1 1.1 1.1 1.1 1.1 1.1 1.1 1.2
2002 2003 2004 2005 2006 2007 2008 2009 2010 2011 03-12 Financial HealthWorking Capital USD Mil248 435 542 561 390 460 408 447 583 652 656Long-Term Debt USD Mil. . . . . . . . . . .Total Equity USD Mil574 694 783 842 703 807 699 736 894 1027 1070Debt/Equity. . . . . . . . . . .
2002 2003 2004 2005 2006 2007 2008 2009 2010 2011 TTM ValuationPrice/Earnings28.3 32.3 25.7 27.9 21.3 20.9 20.1 38.0 30.1 26.0 19.9P/E vs. Market. . . . . . . . . 1.5 1.3Price/Sales6.1 7.3 5.7 5.7 4.1 3.9 2.0 4.5 5.1 4.2 3.1Price/Book4.2 4.9 3.7 3.6 3.2 3.2 1.8 3.4 4.7 4.1 3.1Price/Cash Flow20.3 29.5 22.0 24.1 17.9 17.2 10.3 22.2 32.5 30.0 26.7
Quarterly ResultsRevenue
Rev Growth
Earnings Per Share
USD Mil Jun 11 Sep 11 Dec 11 Mar 12
% Jun 11 Sep 11 Dec 11 Mar 12
USD Jun 11 Sep 11 Dec 11 Mar 12
Most Recent Period 243.0 269.5 260.4 290.7Prior Year Period 201.6 206.8 222.1 250.9
Most Recent Period 20.6 30.3 17.2 15.8Prior Year Period 71.8 32.8 25.1 35.1
Most Recent Period 0.27 0.30 0.28 0.32Prior Year Period 0.24 0.24 0.26 0.29
Industry Peers by Market Cap
Major Fund Holders
Mkt Cap USD Mil Rev USD Mil P/E ROE%
% of shares
Gentex Corporation 3344 1064 19.9 16.8Magna International 10062 28573 11.8 11.2
.
.
.
TTM data based on rolling quarterly data if available; otherwise most recent annual data shown.
© 2012 Morningstar. All Rights Reserved. Unless otherwise provided in a separate agreement, you may use this report only in the country in which its original distributor is based. Data as originally reported. The information contained herein is not represented or warranted to be accurate, correct, complete, or timely. This report is for information purposes only, and should not be considered a solicitation to buy or sell any security. Redistribution is prohibited without written permission. To order reprints, call +1 312-696-6100. To license the research, call +1 312-696-6869. ß
®

110
Morningstar’s Approach to Rating Stocks
Our Key Investing ConceptsEconomic Moat Rating��Discounted Cash Flow��Discount Rate��Fair Value��Uncertainty��Margin of Safety��Consider Buying/Consider Selling��Stewardship Grades��
TMAt Morningstar, we evaluate stocks as pieces of abusiness, not as pieces of paper. We think that purchasingshares of superior businesses at discounts to theirintrinsic value and allowing them to compound their valueover long periods of time is the surest way to createwealth in the stock market. We rate stocks 1 through 5 stars, with 5 the best and 1the worst. Our star rating is based on our analyst’sestimate of how much a company’s business is worth pershare. Our analysts arrive at this "fair value estimate" byforecasting how much excess cash--or "free cashflow"--the firm will generate in the future, and thenadjusting the total for timing and risk. Cash generatednext year is worth more than cash generated several yearsdown the road, and cash from a stable and consistentlyprofitable business is worth more than cash from acyclical or unsteady business. Stocks trading at meaningful discounts to our fair valueestimates will receive high star ratings. For high-qualitybusinesses, we require a smaller discount than formediocre ones, for a simple reason: We have moreconfidence in our cash-flow forecasts for strongcompanies, and thus in our value estimates. If a stock’smarket price is significantly above our fair value estimate,it will receive a low star rating, no matter how wonderfulwe think the business is. Even the best company is a baddeal if an investor overpays for its shares. Our fair value estimates don’t change very often, butmarket prices do. So, a stock may gain or lose stars based
just on movement in the share price. If we think a stock’sfair value is $50, and the shares decline to $40 withoutmuch change in the value of the business, the star ratingwill go up. Our estimate of what the business is worthhasn’t changed, but the shares are more attractive as aninvestment at $40 than they were at $50. Because we focus on the long-term value of businesses,rather than short-term movements in stock prices, at timeswe may appear out of step with the overall stock market.When stocks are high, relatively few will receive ourhighest rating of 5 stars. But when the market tumbles,many more will likely garner 5 stars. Although you mightexpect to see more 5-star stocks as the market rises, wefind assets more attractive when they’re cheap. We calculate our star ratings nightly after the marketsclose, and issue them the following business day, which iswhy the rating date on our reports will always be theprevious business day. We update the text of our reportsas new information becomes available, usually about onceor twice per quarter. That is why you’ll see two dates onevery Morningstar stock report. Of course, we monitormarket events and all of our stocks every business day, soour ratings always reflect our analyst’s current opinion. Economic Moat Rating The Economic Moat Rating is our assessment of a firm’sability to earn returns consistently above its cost of capitalin the future, usually by virtue of some competitiveadvantage. Competition tends to drive down such
TM
TM
Morningstar ResearchMethodology for ValuingCompanies QQQQQCompetitive Economic Company Fair Value Uncertainty
Analysis Moat Rating Valuation Estimate AssessmentTM
Analyst conducts The depth of the Analyst considers DCF model leads to An uncertaintycompany and industry firm’s competitive company financial the firm’s Fair Value assessmentresearch: advantage is rated: statements and Estimate, which establishes the� � competitive position anchors the rating margin ofManagement None to forecast future framework. safety required forinterviews Narrow cash flows. the stock rating.Conference calls Wide �Trade-show visits Assumptions areCompetitor, supplier, input into a dis-distributor, and counted cash-flowcustomer interviews model.
The current stockprice relative to fairvalue, adjustedfor uncertainty,determines therating.
QQQQQQQQQQQQQQQ
© 2012 Morningstar. All Rights Reserved. Unless otherwise provided in a separate agreement, you may use this report only in the country in which its original distributor is based. Data as originally reported.The information contained herein is not represented or warranted to be accurate, correct, complete, or timely. This report is for information purposes only, and should not be considered a solicitation to buy or sell any security.Redistribution is prohibited without written permission. To order reprints, call +1 312-696-6100. To license the research, call +1 312-696-6869.
ß ®

111
?
Aflac Inc AFL [NYSE] | QQQQTM
Last Price Fair Value Consider Buy Consider Sell Uncertainty Economic Moat Stewardship Morningstar Credit Rating Industry43.74 USD 58.00 USD 29.00 USD 101.50 USD Very High Narrow . Insurance - Life A-
Currency amounts expressed with "$"are in U.S. dollars (USD) unlessotherwise denoted.
Aflac Japan Delivers Another Strong Quarter in 1Q
by Drew WoodburyEquity AnalystAnalysts covering this company do notown its stock.
Pricing data through May 07, 2012.Rating updated as ofMay 07, 2012.
08 09 10 11 12
16.0
26.0
36.0
46.0
56.0
66.0Stock Price
Analyst Note Apr. 25, 2012 Aflac released good first-quarter results which, similarlyto recent quarters, was driven by strength in its Japanesebusiness. Operating earnings per diluted share--whichexclude realized investment gains and losses--rose 7.4%to $1.74 in the quarter. The earnings benefited $0.04 pershare from the stronger yen/dollar exchange rate which,due to the company’s significant business in Japan andthe fact that they rarely convert between currencies,should be excluded when evaluating ongoing results. Aflac Japan again produced record sales in the firstquarter as new annualized premium sales rose 53.8% toJPY 52.4 billion. Bank channel sales (a relatively newsource of business for the company) continued to be verystrong, growing 209% year-over-year. For a number ofquarters management has warned that comparisonperiods would be very difficult to beat in its Japanesebusiness, yet Aflac continues to exceed expectations inthat region. The company now�expects Aflac Japan’sfull-year sales to increase 10%, a revision frommanagement’s previous expectation of a sales decline. Onthe other hand, challenges remain in the company’s U.S.business, though growth and profitability continues at asubdued pace. Realized losses (which are excluded from operatingearnings) declined significantly from a year ago. Thecompany is still in the process of de-risking its portfolio byeliminating or reducing exposures to troubled Europeansovereigns and financial institutions. The gains in thequarter are more a matter of timing rather than animprovement in the fundamentals of these securities asAflac notes the sales prices were simply above theirimpaired levels at the end of December. Aflac continues toremain exposed to Europe, however, and may trade in linewith news coming out of that region.
Thesis Mar. 07, 2012 A unique distribution model and first mover advantage inJapan� leave Aflac with an enviable competitive position.By focusing on� supplemental insurance products Aflac hasbeen able to consistently� generate excess returns forshareholders, a rarity for a company� linked to thehypercompetitive life insurance industry. Despite a strongbusiness model, the� firm’s balance sheet remains slightlystressed due to questions� over the value of some of itsinvestments.� Rather than targeting individuals through sales agents asmost� life insurers do, Aflac offers its products at theworkplace. Aflac� markets its products to companies as away to improve their benefit� lineups at no additional cost.Premiums are deducted from� employees’ paychecks andAflac pays cash benefits in the event that� a policyholdergets a specified disease. Once an employee becomes� anAflac policyholder, their rates will not increase and theycan� carry the policy with them from job to job. Aflac’sunique� distribution model yields low costs, which allow itto price below� competitors.� While Aflac writes policies domestically, its primary�market--representing around 75% of annual premiums--isJapan. Aflac� has a stranglehold on the Japanese marketfor its largest product:� cancer insurance. Due to strictregulation, Aflac was one of the� first companies licensedto offer supplemental insurance and the� first company tooffer cancer policies in Japan. Currently, Aflac� insuresaround 80% of all cancer polices in Japan. Economic�dynamics in Japan indicate that demand for Aflac’ssupplemental� policies will continue to be strong. AlthoughJapan has a� universal, government mandated health-caresystem, the aging of the� population combined with adeclining birth rate has left this� system underfunded. As aconsequence, copayments for medical� services have beenrising and consumers are increasingly bearing� the brunt ofthe cost. Consumers often find the supplemental� policiesoffered by Aflac and its competitors an effective way to�bridge the gap.� Though Aflac gained a significant advantage by being one

112
Aflac Inc AFL [NYSE] | QQQQTM
Last Price Fair Value Consider Buy Consider Sell Uncertainty Economic Moat Stewardship Morningstar Credit Rating Industry43.74 USD 58.00 USD 29.00 USD 101.50 USD Very High Narrow . Insurance - Life A-
Close Competitors Currency(Mil) Market Cap TTM Sales Oper Income Net Income
Aflac Inc
American International Group Inc
MetLife Inc
Prudential Financial Inc
USD
USD
USD
USD
20,431 22,171 2,992 1,964
57,121 65,241 4,829 19,709
36,742 70,262 10,026 6,713
24,477 48,498 3,690 2,138
Morningstar data as of May 07, 2012.
of the� first issuers of supplemental policies in Japan,deregulation of� the financial system has intensified thecompetitive environment.� While previously barred fromdoing so, Japanese life insurers are� now issuingsupplemental policies--especially medical--and� competingdirectly with Aflac. Finally, many people in Japan buy� theirinsurance through the national post office, Japan Post.The� government is in the process of privatizing Japan Postand the new,� profit-motivated entity could choose to offersupplemental policies� of its own, a direct threat to Aflac’scompetitive position.� Additionally, we have some concerns about the short-term�stresses on the firm’s balance sheet. In an effort to matchthe� duration and currency of its liabilities, Aflac investedin� yen-denominated, perpetual preferred shares ofEuropean banks. Many� of these banks became severelydistressed by the financial crisis,� and the potential forextraordinary government support or� nationalization hasput the value of these hybrid securities in� doubt. All ofthese preferred securities are still current on their� interestpayments, but their unique position in the banks’ capital�structure could cause them to be substantially impaired.Furthermore, the firm has direct exposure to certainstressed European sovereign debt. Valuation, Growth and Profitability Our fair value estimate for Aflac is $58 per share. Ouroperating assumptions include near-inflationary growth inboth policy prices and new policy growth over the longterm. We project premiums will grow at an average rate
of around 5% in Japan, though a substantial portion ofthis is driven by the benefit of the strengthening yen in thecurrent year. The rest of the growth in Japan is derivedfrom a combination of policy growth rate�accompanied�anaverage price change of 1%. In the U.S. we expectpremium growth to remain weak in the near term beforegrowing in the mid-single-digit range over the long term.This combination results in premiums increasing at a 4%compound annual growth rate during the next five years.We project that margins will stay essentially flat ataround 12% driven by a slight regression of currentlyelevated margins in the U.S. combined with a stablepretax margins of approximately 20% in Japan. If we wereto exclude realized investment losses from the past threeyears, this margin would be nearly the same as ourprojections. Risk Like many life insurers Aflac’s primary risks lie in its�investment portfolio. The firm has significant exposure to�yen-denominated, hybrid securities of European banks. Anumber of� these banks were hit particularly hard by thefinancial crisis and� government nationalization has beenconsidered. Given the unique� spot these securities hold inthe capital structure, there are� questions as to their valuein the event of potential� nationalization or default. WhileAflac’s leverage heading into the� crisis wasn’t quite ashigh as some of its life insurance peers,� the firm still has arelatively small equity cushion relative to� the size of itsinvestments. Relatively small write-downs will have� amagnified impact on shareholders’ equity. Bulls Say
Clients, especially in Japan, are very sticky once they�purchase policies. Persistency in Japan usually hoversaround 95%,� as the average customers stays with Aflacfor nearly 20� years.
© 2012 Morningstar. All Rights Reserved. Unless otherwise provided in a separate agreement, you may use this report only in the country in which its original distributor is based. Data as originally reported.The information contained herein is not represented or warranted to be accurate, correct, complete, or timely. This report is for information purposes only, and should not be considered a solicitation to buy or sell any security.Redistribution is prohibited without written permission. To order reprints, call +1 312-696-6100. To license the research, call +1 312-696-6869.
ß ®

113
Aflac Inc AFL [NYSE] | QQQQTM
Last Price Fair Value Consider Buy Consider Sell Uncertainty Economic Moat Stewardship Morningstar Credit Rating Industry43.74 USD 58.00 USD 29.00 USD 101.50 USD Very High Narrow . Insurance - Life A-
Japanese demographic trends are working to increasedemand for� supplemental policies. As the nation getsolder they will� increasingly demand coverage toaugment the state-run health-care� system. The deregulation of the financial system in Japan hasallowed� Aflac to sell its policies through banks or thepost office, places� where Japanese customers are usedto conducting financial� transactions. Aflac’s payroll deduction system helps�enable it to be�the low-cost provider for the supplemental policies inwhich� it�specializes.
Bears Say
Once Japan Post is fully privatized, it may choose toissue its� own supplemental policies. This could impactAflac’s sales through� Japan Post as well as itscompetitive position. Deregulation in Japan has allowed large life insurance�companies to compete directly with Aflac in issuingsupplemental� policies. Customer retention is much lower in the U.S. (around�75%) than in Japan. As Aflac attempts to grow in this�underpenetrated market, it could have a negativeimpact on� profitability.
Financial Overview Financial Health: Aflac’s debt/equity ratio of around 30%is low relative to other life insurance peers andreasonable considering the firm’s consistent profitability.The firm’s credit rating is� higher than those of�itsJapanese competitors, fostering an� excellent reputationamong consumers, an advantage in selling� long-durationpolicies. Company Overview Profile: Aflac offers supplemental health insurance and
life insurance� in the two largest insurance markets in theworld, the U.S. and� Japan. In addition to its cancerpolicies, the company has� broadened its product offeringsto include accident, disability,� and long-term careinsurance. It markets its products through� independentdistributors, selling most of its policies directly to�consumers at their places of work. Management: Daniel Amos has held a long tenure withthe firm that was� started by his family in 1955. He joinedthe firm in 1973 and has� been CEO since 1990 andchairman since 2001. While we would prefer� Amos’current roles be separated, we applaud Amos for the�shareholder value he has been able to create during histenure.� Amos owns more than 2% of the outstandingshares of the company,� representing around half a billiondollars, which we believes� aligns his interests very closelywith those of�shareholders.� Aflac rewards long-timeshareholders with a tenfold increase in� their voting power,giving stockholders an incentive to view their� investmentin the company from the perspective of owners.
© 2012 Morningstar. All Rights Reserved. Unless otherwise provided in a separate agreement, you may use this report only in the country in which its original distributor is based. Data as originally reported.The information contained herein is not represented or warranted to be accurate, correct, complete, or timely. This report is for information purposes only, and should not be considered a solicitation to buy or sell any security.Redistribution is prohibited without written permission. To order reprints, call +1 312-696-6100. To license the research, call +1 312-696-6869.
ß ®
114
Aflac Inc AFL [NYSE] | QQQQTM
Last Price Fair Value Consider Buy Consider Sell Uncertainty Economic Moat Stewardship Morningstar Credit Rating Industry43.74 USD 58.00 USD 29.00 USD 101.50 USD Very High Narrow . Insurance - Life A-
Analyst Notes
Apr. 25, 2012 Aflac Japan Delivers Another Strong Quarter in 1Q
Aflac released good first-quarter results which, similarly torecent quarters, was driven by strength in its Japanesebusiness. Operating earnings per diluted share--whichexclude realized investment gains and losses--rose 7.4% to$1.74 in the quarter. The earnings benefited $0.04 pershare from the stronger yen/dollar exchange rate which,due to the company’s significant business in Japan and thefact that they rarely convert between currencies, should beexcluded when evaluating ongoing results.� �Aflac Japan again produced record sales in the first quarteras new annualized premium sales rose 53.8% to JPY 52.4billion. Bank channel sales (a relatively new source ofbusiness for the company) continued to be very strong,growing 209% year-over-year. For a number of quartersmanagement has warned that comparison periods would bevery difficult to beat in its Japanese business, yet Aflaccontinues to exceed expectations in that region. Thecompany now�expects Aflac Japan’s full-year sales toincrease 10%, a revision from management’s previous
expectation of a sales decline. On the other hand,challenges remain in the company’s U.S. business, thoughgrowth and profitability continues at a subdued pace.� �Realized losses (which are excluded from operatingearnings) declined significantly from a year ago. Thecompany is still in the process of de-risking its portfolio byeliminating or reducing exposures to troubled Europeansovereigns and financial institutions. The gains in thequarter are more a matter of timing rather than animprovement in the fundamentals of these securities asAflac notes the sales prices were simply above theirimpaired levels at the end of December. Aflac continues toremain exposed to Europe, however, and may trade in linewith news coming out of that region.�
Jan. 31, 2012 Aflac’s 4Q Results Propelled by Another Strong Quarter in Japan
Aflac reported a generally strong fourth quarter, especiallyin light of the difficult comparisons the company faced,most notably in its Japanese business. Operating earningsper diluted share--which exclude realized investment gainsand losses--rose 11.3% to $1.48 in the quarter on ayear-over-year basis. As Aflac conducts a substantialportion of its business in Japan, it continued to benefit fromthe strengthening of the yen relative to the dollar. Thestronger yen/dollar exchange rate increased operatingearnings per diluted share by $0.06 in the quarter, whichwe believe should be excluded when evaluating ongoingresults.� �As with previous quarters, growth continues to be driventhrough Aflac’s Japanese business. After cautioning for a
number of periods that the business there would facedifficult comps, results continue to outpace management’sexpectations. Premium growth was particularly strong inthe bank channel, where sales rose by 135.7% over fourthquarter 2010. This is a relatively new channel for thecompany, and as such the large growth figures partiallyreflect a small premium base. That said, Aflac has beensourcing much of its growth from this channel asderegulation has allowed it to sell its insurance productsdirectly through banks sales networks, which is a commonpractice in Japan. Management continues to warninvestors that sales will slow in this channel given theincreasingly difficult comparisons.� �Results were less strong in the United States, hurt partially
© 2012 Morningstar. All Rights Reserved. Unless otherwise provided in a separate agreement, you may use this report only in the country in which its original distributor is based. Data as originally reported.The information contained herein is not represented or warranted to be accurate, correct, complete, or timely. This report is for information purposes only, and should not be considered a solicitation to buy or sell any security.Redistribution is prohibited without written permission. To order reprints, call +1 312-696-6100. To license the research, call +1 312-696-6869.
ß ®

115
Aflac Inc AFL [NYSE] | QQQQTM
Last Price Fair Value Consider Buy Consider Sell Uncertainty Economic Moat Stewardship Morningstar Credit Rating Industry43.74 USD 58.00 USD 29.00 USD 101.50 USD Very High Narrow . Insurance - Life A-
Analyst Notes (continued)
by an increased spending on IT and advertising initiatives.Profits fell by $198 million in the quarter, a decrease of11.8% compared with last year. On the positive side, salesgrowth has been improving since declining during therecession, which continued during the quarter at a rate of9.3%.� �Aflac’s investment portfolio has been a source of investorconcern for a number of quarters given its higherconcentration in European sovereign and financialinstitution debt relative to peers. The company hasattempted to be in front of any potential problems byproactively lowering the risk of its investments. During thecurrent quarter Aflac impaired a number of securities,
leading to a $522 million or $1.12 per diluted share realizedinvestment loss. This was partially offset by $355 million($0.76 per share) of investment gains, however, related tothe sale of the company’s holdings of Treasury strips andJGBs. The company’s capital levels continue to appearstrong, as evidenced by its estimated RBC ratio of 480% to520% after the quarter. While we believe the company hastaken the right steps to reduce its riskiest investments, itstill holds a material position in European securities due toits unique business model and cash flow profile. Therefore,we are still concerned about a possible tail risk scenario inEurope, and we believe the stock may trade closely withEuropean markets in the near term.�
© 2012 Morningstar. All Rights Reserved. Unless otherwise provided in a separate agreement, you may use this report only in the country in which its original distributor is based. Data as originally reported.The information contained herein is not represented or warranted to be accurate, correct, complete, or timely. This report is for information purposes only, and should not be considered a solicitation to buy or sell any security.Redistribution is prohibited without written permission. To order reprints, call +1 312-696-6100. To license the research, call +1 312-696-6869.
ß ®
Disclaimers & DisclosuresNo Morningstar employees are officers or directors of this company. Morningstar Inc. does not own more than 1% of the shares of this company. Analystscovering this company do not own its stock. The information contained herein is not represented or warranted to be accurate, correct, complete, or timely.This report is for information purposes only, and should not be considered a solicitation to buy or sell any security.
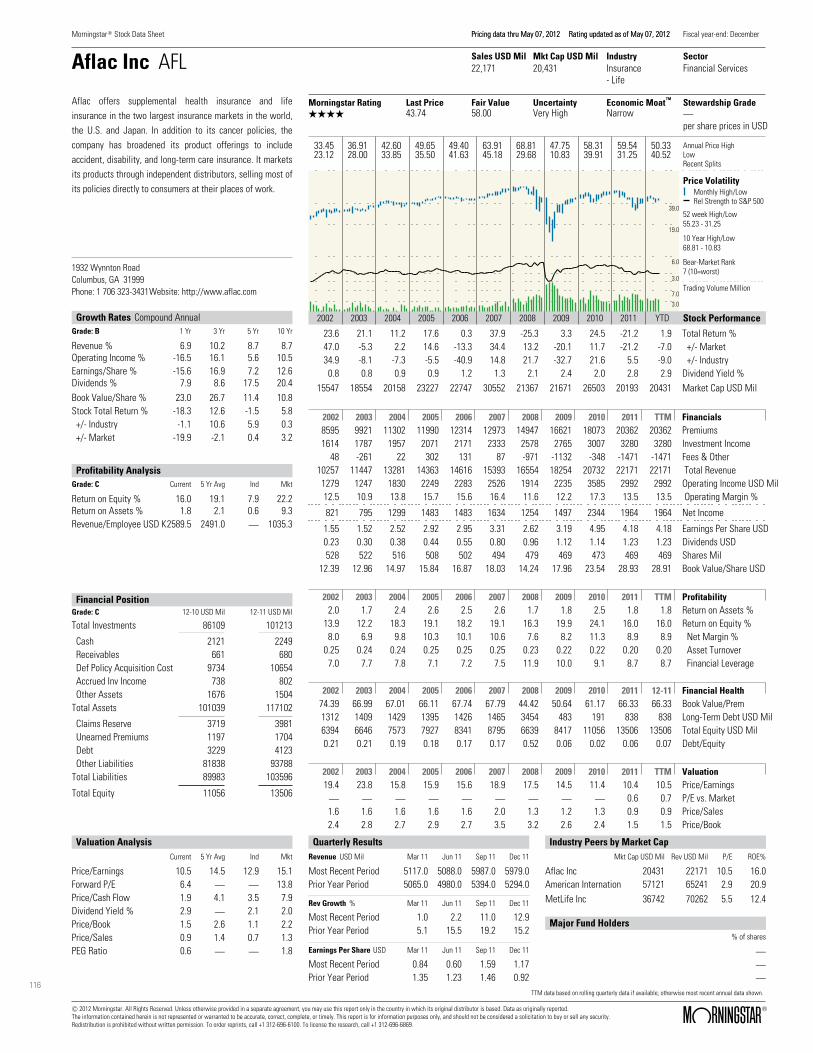
116
Morningstar Stock Data Sheet Pricing data thru May 07, 2012 Rating updated as of May 07, 2012Pricing data thru May 07, 2012 Rating updated as of May 07, 2012 Fiscal year-end: December
Aflac Inc AFL Sales USD Mil Mkt Cap USD Mil Industry Sector22,171 20,431 Insurance
- Life Financial Services
TMMorningstar Rating Last Price Fair Value Uncertainty Economic Moat Stewardship GradeQQQQ 43.74 58.00 Very High Narrow .
per share prices in USD
2002 2003 2004 2005 2006 2007 2008 2009 2010 2011 YTD
3.0
6.0
19.0
39.0
3.0
7.0
33.4523.12
36.9128.00
42.6033.85
49.6535.50
49.4041.63
63.9145.18
68.8129.68
47.7510.83
58.3139.91
59.5431.25
50.3340.52
Annual Price HighLowRecent Splits
Price VolatilityMonthly High/LowRel Strength to S&P 500
52 week High/Low55.23 - 31.25
10 Year High/Low68.81 - 10.83
Bear-Market Rank7 (10=worst)
Trading Volume Million
Stock Performance
Aflac offers supplemental health insurance and lifeinsurance� in the two largest insurance markets in the world,the U.S. and� Japan. In addition to its cancer policies, thecompany has� broadened its product offerings to includeaccident, disability,� and long-term care insurance. It marketsits products through� independent distributors, selling most ofits policies directly to� consumers at their places of work.
1932 Wynnton Road Columbus, GA 31999Phone: 1 706 323-3431Website: http://www.aflac.com
Growth Rates Compound AnnualGrade: B 1 Yr 3 Yr 5 Yr 10 Yr
Revenue % 6.9 10.2 8.7 8.7Operating Income % -16.5 16.1 5.6 10.5Earnings/Share % -15.6 16.9 7.2 12.6Dividends % 7.9 8.6 17.5 20.4Book Value/Share % 23.0 26.7 11.4 10.8Stock Total Return % -18.3 12.6 -1.5 5.8+/- Industry -1.1 10.6 5.9 0.3+/- Market -19.9 -2.1 0.4 3.2
Profitability AnalysisGrade: C Current 5 Yr Avg Ind Mkt
Return on Equity % 16.0 19.1 7.9 22.2Return on Assets % 1.8 2.1 0.6 9.3Revenue/Employee USD K2589.5 2491.0 . 1035.3
Financial PositionGrade: C 12-10 USD Mil 12-11 USD Mil
Total Investments 86109 101213
Cash 2121 2249Receivables 661 680Def Policy Acquisition Cost 9734 10654Accrued Inv Income 738 802Other Assets 1676 1504
Total Assets 101039 117102
Claims Reserve 3719 3981Unearned Premiums 1197 1704Debt 3229 4123Other Liabilities 81838 93788
Total Liabilities 89983 103596
Total Equity 11056 13506
2002 2003 2004 2005 2006 2007 2008 2009 2010 2011 TTM FinancialsPremiums8595 9921 11302 11990 12314 12973 14947 16621 18073 20362 20362Investment Income1614 1787 1957 2071 2171 2333 2578 2765 3007 3280 3280Fees & Other48 -261 22 302 131 87 -971 -1132 -348 -1471 -1471 Total Revenue10257 11447 13281 14363 14616 15393 16554 18254 20732 22171 22171Operating Income USD Mil1279 1247 1830 2249 2283 2526 1914 2235 3585 2992 2992 Operating Margin %12.5 10.9 13.8 15.7 15.6 16.4 11.6 12.2 17.3 13.5 13.5
Net Income821 795 1299 1483 1483 1634 1254 1497 2344 1964 1964
Earnings Per Share USD1.55 1.52 2.52 2.92 2.95 3.31 2.62 3.19 4.95 4.18 4.18Dividends USD0.23 0.30 0.38 0.44 0.55 0.80 0.96 1.12 1.14 1.23 1.23Shares Mil528 522 516 508 502 494 479 469 473 469 469Book Value/Share USD12.39 12.96 14.97 15.84 16.87 18.03 14.24 17.96 23.54 28.93 28.91
Valuation AnalysisCurrent 5 Yr Avg Ind Mkt
Price/Earnings 10.5 14.5 12.9 15.1Forward P/E 6.4 . . 13.8Price/Cash Flow 1.9 4.1 3.5 7.9Dividend Yield % 2.9 . 2.1 2.0Price/Book 1.5 2.6 1.1 2.2Price/Sales 0.9 1.4 0.7 1.3PEG Ratio 0.6 . . 1.8
Total Return %23.6 21.1 11.2 17.6 0.3 37.9 -25.3 3.3 24.5 -21.2 1.9+/- Market47.0 -5.3 2.2 14.6 -13.3 34.4 13.2 -20.1 11.7 -21.2 -7.0+/- Industry34.9 -8.1 -7.3 -5.5 -40.9 14.8 21.7 -32.7 21.6 5.5 -9.0
Dividend Yield %0.8 0.8 0.9 0.9 1.2 1.3 2.1 2.4 2.0 2.8 2.9Market Cap USD Mil15547 18554 20158 23227 22747 30552 21367 21671 26503 20193 20431
2002 2003 2004 2005 2006 2007 2008 2009 2010 2011 TTM ProfitabilityReturn on Assets %2.0 1.7 2.4 2.6 2.5 2.6 1.7 1.8 2.5 1.8 1.8Return on Equity %13.9 12.2 18.3 19.1 18.2 19.1 16.3 19.9 24.1 16.0 16.0
Net Margin %8.0 6.9 9.8 10.3 10.1 10.6 7.6 8.2 11.3 8.9 8.9Asset Turnover0.25 0.24 0.24 0.25 0.25 0.25 0.23 0.22 0.22 0.20 0.20Financial Leverage7.0 7.7 7.8 7.1 7.2 7.5 11.9 10.0 9.1 8.7 8.7
2002 2003 2004 2005 2006 2007 2008 2009 2010 2011 12-11 Financial HealthBook Value/Prem74.39 66.99 67.01 66.11 67.74 67.79 44.42 50.64 61.17 66.33 66.33Long-Term Debt USD Mil1312 1409 1429 1395 1426 1465 3454 483 191 838 838Total Equity USD Mil6394 6646 7573 7927 8341 8795 6639 8417 11056 13506 13506Debt/Equity0.21 0.21 0.19 0.18 0.17 0.17 0.52 0.06 0.02 0.06 0.07
2002 2003 2004 2005 2006 2007 2008 2009 2010 2011 TTM ValuationPrice/Earnings19.4 23.8 15.8 15.9 15.6 18.9 17.5 14.5 11.4 10.4 10.5P/E vs. Market. . . . . . . . . 0.6 0.7Price/Sales1.6 1.6 1.6 1.6 1.6 2.0 1.3 1.2 1.3 0.9 0.9Price/Book2.4 2.8 2.7 2.9 2.7 3.5 3.2 2.6 2.4 1.5 1.5
Quarterly ResultsRevenue
Rev Growth
Earnings Per Share
USD Mil Mar 11 Jun 11 Sep 11 Dec 11
% Mar 11 Jun 11 Sep 11 Dec 11
USD Mar 11 Jun 11 Sep 11 Dec 11
Most Recent Period 5117.0 5088.0 5987.0 5979.0Prior Year Period 5065.0 4980.0 5394.0 5294.0
Most Recent Period 1.0 2.2 11.0 12.9Prior Year Period 5.1 15.5 19.2 15.2
Most Recent Period 0.84 0.60 1.59 1.17Prior Year Period 1.35 1.23 1.46 0.92
Industry Peers by Market Cap
Major Fund Holders
Mkt Cap USD Mil Rev USD Mil P/E ROE%
% of shares
Aflac Inc 20431 22171 10.5 16.0American Internation 57121 65241 2.9 20.9MetLife Inc 36742 70262 5.5 12.4
.
.
.
TTM data based on rolling quarterly data if available; otherwise most recent annual data shown.
© 2012 Morningstar. All Rights Reserved. Unless otherwise provided in a separate agreement, you may use this report only in the country in which its original distributor is based. Data as originally reported. The information contained herein is not represented or warranted to be accurate, correct, complete, or timely. This report is for information purposes only, and should not be considered a solicitation to buy or sell any security. Redistribution is prohibited without written permission. To order reprints, call +1 312-696-6100. To license the research, call +1 312-696-6869. ß
®

117
Morningstar’s Approach to Rating Stocks
Our Key Investing ConceptsEconomic Moat Rating��Discounted Cash Flow��Discount Rate��Fair Value��Uncertainty��Margin of Safety��Consider Buying/Consider Selling��Stewardship Grades��
TMAt Morningstar, we evaluate stocks as pieces of abusiness, not as pieces of paper. We think that purchasingshares of superior businesses at discounts to theirintrinsic value and allowing them to compound their valueover long periods of time is the surest way to createwealth in the stock market. We rate stocks 1 through 5 stars, with 5 the best and 1the worst. Our star rating is based on our analyst’sestimate of how much a company’s business is worth pershare. Our analysts arrive at this "fair value estimate" byforecasting how much excess cash--or "free cashflow"--the firm will generate in the future, and thenadjusting the total for timing and risk. Cash generatednext year is worth more than cash generated several yearsdown the road, and cash from a stable and consistentlyprofitable business is worth more than cash from acyclical or unsteady business. Stocks trading at meaningful discounts to our fair valueestimates will receive high star ratings. For high-qualitybusinesses, we require a smaller discount than formediocre ones, for a simple reason: We have moreconfidence in our cash-flow forecasts for strongcompanies, and thus in our value estimates. If a stock’smarket price is significantly above our fair value estimate,it will receive a low star rating, no matter how wonderfulwe think the business is. Even the best company is a baddeal if an investor overpays for its shares. Our fair value estimates don’t change very often, butmarket prices do. So, a stock may gain or lose stars based
just on movement in the share price. If we think a stock’sfair value is $50, and the shares decline to $40 withoutmuch change in the value of the business, the star ratingwill go up. Our estimate of what the business is worthhasn’t changed, but the shares are more attractive as aninvestment at $40 than they were at $50. Because we focus on the long-term value of businesses,rather than short-term movements in stock prices, at timeswe may appear out of step with the overall stock market.When stocks are high, relatively few will receive ourhighest rating of 5 stars. But when the market tumbles,many more will likely garner 5 stars. Although you mightexpect to see more 5-star stocks as the market rises, wefind assets more attractive when they’re cheap. We calculate our star ratings nightly after the marketsclose, and issue them the following business day, which iswhy the rating date on our reports will always be theprevious business day. We update the text of our reportsas new information becomes available, usually about onceor twice per quarter. That is why you’ll see two dates onevery Morningstar stock report. Of course, we monitormarket events and all of our stocks every business day, soour ratings always reflect our analyst’s current opinion. Economic Moat Rating The Economic Moat Rating is our assessment of a firm’sability to earn returns consistently above its cost of capitalin the future, usually by virtue of some competitiveadvantage. Competition tends to drive down such
TM
TM
Morningstar ResearchMethodology for ValuingCompanies QQQQQCompetitive Economic Company Fair Value Uncertainty
Analysis Moat Rating Valuation Estimate AssessmentTM
Analyst conducts The depth of the Analyst considers DCF model leads to An uncertaintycompany and industry firm’s competitive company financial the firm’s Fair Value assessmentresearch: advantage is rated: statements and Estimate, which establishes the� � competitive position anchors the rating margin ofManagement None to forecast future framework. safety required forinterviews Narrow cash flows. the stock rating.Conference calls Wide �Trade-show visits Assumptions areCompetitor, supplier, input into a dis-distributor, and counted cash-flowcustomer interviews model.
The current stockprice relative to fairvalue, adjustedfor uncertainty,determines therating.
QQQQQQQQQQQQQQQ
© 2012 Morningstar. All Rights Reserved. Unless otherwise provided in a separate agreement, you may use this report only in the country in which its original distributor is based. Data as originally reported.The information contained herein is not represented or warranted to be accurate, correct, complete, or timely. This report is for information purposes only, and should not be considered a solicitation to buy or sell any security.Redistribution is prohibited without written permission. To order reprints, call +1 312-696-6100. To license the research, call +1 312-696-6869.
ß ®

118
Morningstar’s Approach to Rating Stocks (continued)
economic profits, but companies that can earn them for anextended time by creating a competitive advantagepossess an Economic Moat. We see these companies assuperior investments. Discounted Cash Flow This is a method for valuing companies that involvesprojecting the amount of cash a business will generate inthe future, subtracting the amount of cash that thecompany will need to reinvest in its business, and usingthe result to calculate the worth of the firm. We use thistechnique to value nearly all of the companies we cover. Discount Rate We use this number to adjust the value of our forecastedcash flows for the risk that they may not materialize. For aprofitable company in a steady line of business, we’ll usea lower discount rate, also known as "cost of capital,"than for a firm in a cyclical business with fiercecompetition, since there’s less risk clouding the firm’sfuture. Fair Value This is the output of our discounted cash-flow valuationmodels, and is our per-share estimate of a company’sintrinsic worth. We adjust our fair values for off-balancesheet liabilities or assets that a firm might have--forexample, we deduct from a company’s fair value if it hasissued a lot of stock options or has an under-fundedpension plan. Our fair value estimate differs from a "targetprice" in two ways. First, it’s an estimate of what thebusiness is worth, whereas a price target typically reflectswhat other investors may pay for the stock. Second, it’s along-term estimate, whereas price targets generally focuson the next two to 12 months. Uncertainty To generate the Morningstar Uncertainty Rating, analystsconsider factors such as sales predictability, operatingleverage, and financial leverage. Analysts then classifytheir ability to bound the fair value estimate for the stockinto one of several uncertainty levels: Low, Medium, High,
Very High, or Extreme. The greater the level of uncertainty,the greater the discount to fair value required before astock can earn 5 stars, and the greater the premium to fairvalue before a stock earns a 1-star rating. Margin of Safety This is the discount to fair value we would require beforerecommending a stock. We think it’s always prudent tobuy stocks for less than they’re worth.The margin of safetyis like an insurance policy that protects investors from badnews or overly optimistic fair value estimates. We requirelarger margins of safety for less predictable stocks, andsmaller margins of safety for more predictable stocks. Consider Buying/Consider Selling The consider buying price is the price at which a stockwould be rated 5 stars, and thus the point at which wewould consider the stock an extremely attractivepurchase. Conversely, consider selling is the price atwhich a stock would have a 1 star rating, at which pointwe’d consider the stock overvalued, with low expectedreturns relative to its risk. Stewardship Grades Our corporate Stewardship Rating represents ourassessment of management’s stewardship of shareholdercapital, with particular emphasis on capital allocationdecisions. Analysts consider companies’ investmentstrategy and valuation, financial leverage, dividend andshare buyback policies, execution, compensation, relatedparty transactions, and accounting practices. Corporategovernance practices are only considered if they’ve had ademonstrated impact on shareholder value. Analystsassign one of three ratings: "Exemplary," "Standard," and"Poor." Analysts judge stewardship from an equity holder’sperspective. Ratings are determined on an absolute basis.Most companies will receive a Standard rating, and this isthe default rating in the absence of evidence thatmanagers have made exceptionally strong or poor capitalallocation decisions.
© 2012 Morningstar. All Rights Reserved. Unless otherwise provided in a separate agreement, you may use this report only in the country in which its original distributor is based. Data as originally reported.The information contained herein is not represented or warranted to be accurate, correct, complete, or timely. This report is for information purposes only, and should not be considered a solicitation to buy or sell any security.Redistribution is prohibited without written permission. To order reprints, call +1 312-696-6100. To license the research, call +1 312-696-6869.
ß ®
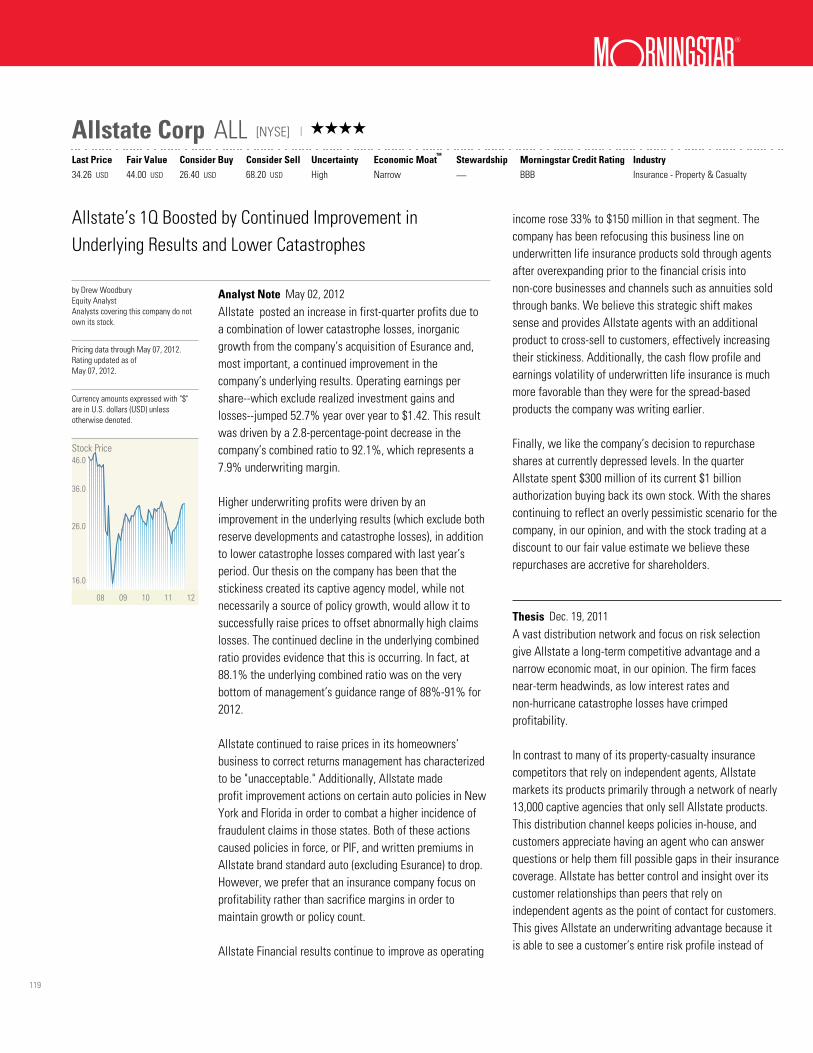
119
?
Allstate Corp ALL [NYSE] | QQQQTM
Last Price Fair Value Consider Buy Consider Sell Uncertainty Economic Moat Stewardship Morningstar Credit Rating Industry34.26 USD 44.00 USD 26.40 USD 68.20 USD High Narrow . Insurance - Property & Casualty BBB
Currency amounts expressed with "$"are in U.S. dollars (USD) unlessotherwise denoted.
Allstate’s 1Q Boosted by Continued Improvement inUnderlying Results and Lower Catastrophes
by Drew WoodburyEquity AnalystAnalysts covering this company do notown its stock.
Pricing data through May 07, 2012.Rating updated as ofMay 07, 2012.
08 09 10 11 12
16.0
26.0
36.0
46.0Stock Price
Analyst Note May 02, 2012 Allstate �posted an increase in first-quarter profits�due toa combination of lower catastrophe losses, inorganicgrowth from the company’s acquisition of Esurance and,most important, a continued improvement in thecompany’s underlying results. Operating earnings pershare--which exclude realized investment gains andlosses--jumped 52.7% year over year to $1.42. This resultwas driven by a 2.8-percentage-point decrease in thecompany’s combined ratio to 92.1%, which represents a7.9% underwriting margin.� Higher underwriting profits were driven by animprovement in the underlying�results (which exclude bothreserve developments and catastrophe losses), in additionto lower catastrophe losses compared with last year’speriod. Our thesis on the company has been that thestickiness created its captive agency model, while notnecessarily a source of policy growth, would allow it tosuccessfully raise prices to offset abnormally high claimslosses. The continued decline in the underlying combinedratio provides evidence that this is�occurring. In fact, at88.1% the underlying combined ratio was on the verybottom of management’s guidance range of 88%-91% for2012. Allstate continued to raise prices in its homeowners’business to correct returns management has characterizedto be "unacceptable." Additionally, Allstate madeprofit�improvement�actions on certain auto policies in NewYork and Florida in order to combat a higher incidence offraudulent claims in those states. Both of these actionscaused policies in force, or PIF, and written premiums inAllstate brand standard auto (excluding Esurance) to drop.However, we prefer that an insurance company focus onprofitability rather than sacrifice margins in order tomaintain growth or policy count. Allstate Financial results continue to improve as operating
income rose 33% to $150 million in that segment. Thecompany has been refocusing this business line onunderwritten life insurance products sold through agentsafter overexpanding prior to the financial crisis intonon-core businesses and channels such as annuities soldthrough banks. We believe this strategic shift makessense and provides Allstate agents with an additionalproduct to cross-sell to customers, effectively increasingtheir stickiness. Additionally, the cash flow profile andearnings volatility of underwritten life insurance is muchmore favorable than they were for the spread-basedproducts the company was writing earlier. Finally, we like the company’s decision to repurchaseshares at currently depressed levels. In the quarterAllstate spent $300 million of its current $1 billionauthorization buying back its own stock. With the sharescontinuing to reflect an overly pessimistic scenario for thecompany, in our opinion, and with the stock trading at adiscount to our fair value estimate we believe theserepurchases are accretive for shareholders. Thesis Dec. 19, 2011 A vast distribution network and focus on risk selectiongive Allstate a long-term competitive advantage and anarrow economic moat, in our opinion. The firm facesnear-term headwinds, as low interest rates andnon-hurricane catastrophe losses have crimpedprofitability.� In contrast to many of its property-casualty insurancecompetitors that rely on independent agents, Allstatemarkets its products primarily through a network of nearly13,000 captive agencies that only sell Allstate products.This distribution channel keeps policies in-house, andcustomers appreciate having an agent who can answerquestions or help them fill possible gaps in their insurancecoverage. Allstate has better control and insight over itscustomer relationships than peers that rely onindependent agents as the point of contact for customers.This gives Allstate an underwriting advantage because itis able to see a customer’s entire risk profile instead of
120
Allstate Corp ALL [NYSE] | QQQQTM
Last Price Fair Value Consider Buy Consider Sell Uncertainty Economic Moat Stewardship Morningstar Credit Rating Industry34.26 USD 44.00 USD 26.40 USD 68.20 USD High Narrow . Insurance - Property & Casualty BBB
Close Competitors Currency(Mil) Market Cap TTM Sales Oper Income Net Income
Allstate Corp
Berkshire Hathaway Inc
Progressive Corporation
USD
USD
USD
16,834 32,921 1,322 1,030
193,692 148,115 18,011 11,988
13,428 15,508 1,487 1,016
Morningstar data as of May 07, 2012.
evaluating risk on an individual policy basis.� Allstate continuously seeks new products or policyenhancements to improve the customer experience and itsagents’ ability to meet customers’ needs. As most of itsagents sell only Allstate products, the firm benefits fromsignificant cross-selling opportunities. The firm targets itsinsurance offerings to people and families with multiplepolicy needs. For example, the ideal Allstate customerowns a home and a number of cars as well as a boat andother leisure craft. Allstate hopes that these idealcustomers will come to their Allstate agent for all theirinsurance needs and are then less likely to switch insurersjust to save a couple of bucks on one of these policies.This strategy appears to work, as Allstate consistentlyretains a larger portion of its policies than its competitors.� � In an effort to meet the evolving demand of its customers,the company began offering life insurance and annuityproducts through its Allstate Financial segment. Whilethese products were originally sold through its corecaptive agent network, the segment ballooned to includedistribution through banks and brokers. Managementbelieved that increasing the size of Allstate Financialwould help diversify risks. While still a relatively smallportion of the company’s profitability--historicallyaccounting for just 10% of net income--the high balancesheet leverage inherent in running a life insuranceoperation caused the poor performance of this group todominate results during the credit crisis. While resultshave begun to stabilize, the firm still retains moreleverage than its property-casualty insurance peers.
Allstate is reorganizing this segment by focusing on thebusinesses that complement the strengths of its captiveagency model.� Allstate Financial also increased the riskiness of thecompany’s investment portfolio. As it grew, Allstateinvested more of its float in longer-duration securities. Intheory, life insurance or annuity products pay out over amuch longer period, allowing the company to invest inless-liquid securities. While stretching for return, Allstateinvested in a large book of mortgage and asset-backedsecurities that it was forced to mark to market prices.Allstate has since lowered the risk profile of itsinvestment portfolio, which has helped contribute to itsmore secure financial footing.� Recent results have been depressed by a number ofheadwinds, but we believe these will be short-term innature. The company is struggling because of low interestrates, higher claim levels due to non-hurricane storms, andpolicy losses in many of its businesses. We believe thatthese events are not indicative of a trend of depressedreturns, but rather are short-term events that are currentlyhurting profitability. As the company increases prices onits policies and storm losses normalize, we expect returnswill stabilize. Valuation, Growth and Profitability Our fair value estimate is $44 per share.�We assumeearned premiums in the property-liability segmentincrease at a 5% compound rate during the next sevenyears. As Allstate is in the business of insuring againstweather events, we have included one explicit largecatastrophe year for the company. On average, we assumeapproximately the same level of annual catastrophesduring the next seven years as the company hasexperienced during the past seven years. Overall, thisleads to our assumption for an average combined ratio of
© 2012 Morningstar. All Rights Reserved. Unless otherwise provided in a separate agreement, you may use this report only in the country in which its original distributor is based. Data as originally reported.The information contained herein is not represented or warranted to be accurate, correct, complete, or timely. This report is for information purposes only, and should not be considered a solicitation to buy or sell any security.Redistribution is prohibited without written permission. To order reprints, call +1 312-696-6100. To license the research, call +1 312-696-6869.
ß ®

121
Allstate Corp ALL [NYSE] | QQQQTM
Last Price Fair Value Consider Buy Consider Sell Uncertainty Economic Moat Stewardship Morningstar Credit Rating Industry34.26 USD 44.00 USD 26.40 USD 68.20 USD High Narrow . Insurance - Property & Casualty BBB
96% during our forecast horizon. We expect premium andcontract charges will increase at a 5% compound annualrate in Allstate Financial and that profitability will remainaround current levels. We assume that operating incomewill average 9% of Allstate Financial’s revenue, right inline with the average during the past five years. Risk Our uncertainty rating for Allstate is high. Market rallieshave boosted the firm’s investment portfolio, but futurelosses are possible as the company decides whichinvestments it intends to hold and which it will sell as itrestructures its Allstate Financial segment. Compared withmany of its property-casualty insurance peers, Allstateretains a large amount of balance sheet leverage, whichcould magnify the effect of a large loss year from acatastrophe event. Bulls Say
Allstate’s network of captive agents helps keep policiesin-house. Customers who insure their home, cars, andleisure craft aren’t likely to switch to a competitor tosave a couple of bucks on one policy. The company’s size gives it significant scale and costadvantages. It is able to spread its fixed costs over alarger base, which helps allow it to price policies lowerthan its competitors. Allstate is restructuring its Allstate Financial segmentto focus on sales through its captive agents, the core ofthe company’s moat. The company has derisked its balance sheet by sellingits riskiest investments, placing the company on moresecure financial footing.
Bears Say
The Allstate Financial segment dragged the company to
a loss during the financial crisis. Future losses in thissegment are possible as the firm restructures thisbusiness. Despite reducing its exposure to some coastal areas,Allstate may experience large loss years caused byMidwestern catastrophes. Allstate’s direct-to-consumer channel is not asdeveloped as some competitors’. Progressive and Geicohave proven experience in this increasingly populardistribution method.
Financial Overview Financial Health: In our opinion, Allstate narrowly avoidedhaving to raise additional capital during the financialcrisis. While we have become more comfortable with thefirm’s financial health, future write-downs may crimp itsequity base. Allstate is now in the position where it isable to return some capital to shareholders throughbuybacks or dividends. Company Overview Profile: On the basis of premium sales, Allstate is thesecond-largest U.S. personal lines property-casualtyinsurer. Personal auto represents an increasingpercentage of sales, as the firm is trimming homeowners’insurance to reduce catastrophic exposure. Life insurancecontributes less than 10% of sales. Allstate products aresold in North America by independent agents, banks, andbrokers, in addition to 13,000 company agents. Management: Our Stewardship Grade for Allstate is a B.The� firm is led by chairman and CEO Tom Wilson. Wewould prefer to see� Wilson’s two roles separated, as webelieve it fosters stronger� board independence. Despitethis, we believe the rest of the� directors to beindependent, which will help assure common� shareholdershave a voice in company decisions. We applaud Allstate�
© 2012 Morningstar. All Rights Reserved. Unless otherwise provided in a separate agreement, you may use this report only in the country in which its original distributor is based. Data as originally reported.The information contained herein is not represented or warranted to be accurate, correct, complete, or timely. This report is for information purposes only, and should not be considered a solicitation to buy or sell any security.Redistribution is prohibited without written permission. To order reprints, call +1 312-696-6100. To license the research, call +1 312-696-6869.
ß ®

122
Allstate Corp ALL [NYSE] | QQQQTM
Last Price Fair Value Consider Buy Consider Sell Uncertainty Economic Moat Stewardship Morningstar Credit Rating Industry34.26 USD 44.00 USD 26.40 USD 68.20 USD High Narrow . Insurance - Property & Casualty BBB
for its full disclosure of compensation structure as well asits� use of long-term performance metrics in decidingexecutive pay. All� named executives are required to holdmultiples of their base pay� in the form of common stock,and Wilson is required to hold more� than 7 times hisannual salary in stock.
© 2012 Morningstar. All Rights Reserved. Unless otherwise provided in a separate agreement, you may use this report only in the country in which its original distributor is based. Data as originally reported.The information contained herein is not represented or warranted to be accurate, correct, complete, or timely. This report is for information purposes only, and should not be considered a solicitation to buy or sell any security.Redistribution is prohibited without written permission. To order reprints, call +1 312-696-6100. To license the research, call +1 312-696-6869.
ß ®
123
Allstate Corp ALL [NYSE] | QQQQTM
Last Price Fair Value Consider Buy Consider Sell Uncertainty Economic Moat Stewardship Morningstar Credit Rating Industry34.26 USD 44.00 USD 26.40 USD 68.20 USD High Narrow . Insurance - Property & Casualty BBB
Analyst Notes
May 02, 2012 Allstate’s 1Q Boosted by Continued Improvement in Underlying Results and Lower Catastrophes
Allstate �posted an increase in first-quarter profits�due to acombination of lower catastrophe losses, inorganic growthfrom the company’s acquisition of Esurance and, mostimportant, a continued improvement in the company’sunderlying results. Operating earnings per share--whichexclude realized investment gains and losses--jumped52.7% year over year to $1.42. This result was driven by a2.8-percentage-point decrease in the company’s combinedratio to 92.1%, which represents a 7.9% underwritingmargin.�� �Higher underwriting profits were driven by an improvementin the underlying�results (which exclude both reservedevelopments and catastrophe losses), in addition to lowercatastrophe losses compared with last year’s period. Ourthesis on the company has been that the stickiness createdits captive agency model, while not necessarily a source ofpolicy growth, would allow it to successfully raise prices tooffset abnormally high claims losses. The continued declinein the underlying combined ratio provides evidence that thisis�occurring. In fact, at 88.1% the underlying combined ratiowas on the very bottom of management’s guidance range of88%-91% for 2012.� �Allstate continued to raise prices in its homeowners’business to correct returns management has characterizedto be "unacceptable." Additionally, Allstate madeprofit�improvement�actions on certain auto policies in NewYork and Florida in order to combat a higher incidence offraudulent claims in those states. Both of these actionscaused policies in force, or PIF, and written premiums inAllstate brand standard auto (excluding Esurance) to drop.However, we prefer that an insurance company focus on
profitability rather than sacrifice margins in order tomaintain growth or policy count.� �Allstate Financial results continue to improve as operatingincome rose 33% to $150 million in that segment. Thecompany has been refocusing this business line onunderwritten life insurance products sold through agentsafter overexpanding prior to the financial crisis intonon-core businesses and channels such as annuities soldthrough banks. We believe this strategic shift makes senseand provides Allstate agents with an additional product tocross-sell to customers, effectively increasing theirstickiness. Additionally, the cash flow profile and earningsvolatility of underwritten life insurance is much morefavorable than they were for the spread-based products thecompany was writing earlier.� �Finally, we like the company’s decision to repurchaseshares at currently depressed levels. In the quarter Allstatespent $300 million of its current $1 billion authorizationbuying back its own stock. With the shares continuing toreflect an overly pessimistic scenario for the company, inour opinion, and with the stock trading at a discount to ourfair value estimate we believe these repurchases areaccretive for shareholders.�
Feb. 01, 2012 Allstate Reports a Strong Fourth Quarter in the Absence of Catastrophes; Shares Still Undervalued
Allstate released very strong fourth-quarter results,demonstrating the strength of the company’s earnings
power in the absence of the large and unusual catastrophesthat have held down recent results. Operating
© 2012 Morningstar. All Rights Reserved. Unless otherwise provided in a separate agreement, you may use this report only in the country in which its original distributor is based. Data as originally reported.The information contained herein is not represented or warranted to be accurate, correct, complete, or timely. This report is for information purposes only, and should not be considered a solicitation to buy or sell any security.Redistribution is prohibited without written permission. To order reprints, call +1 312-696-6100. To license the research, call +1 312-696-6869.
ß ®
124
Allstate Corp ALL [NYSE] | QQQQTM
Last Price Fair Value Consider Buy Consider Sell Uncertainty Economic Moat Stewardship Morningstar Credit Rating Industry34.26 USD 44.00 USD 26.40 USD 68.20 USD High Narrow . Insurance - Property & Casualty BBB
Analyst Notes (continued)
earnings--which exclude realized investment gains andlosses--totaled $1.48 per diluted share, a nearly 200%increase year over year, driven by a robust 90.7% combinedratio.�In stark contrast to the earlier part of the year, andthe second quarter in particular, where the companyreported a much higher than average level of catastrophelosses, the current quarter had essentially no major stormsreported. Still, even with the benign fourth quarter,Allstate’s 2011 results were hit by the second-highest levelof annual catastrophe losses since the company was spunoff from Sears in the mid-1990s, falling short only of arecord year in 2005 that included Hurricane Katrina.Needless to say, we do not believe this is a normal result;Allstate’s earnings power is much stronger than 2011indicated, a fact we do not feel is appreciated by themarket or reflected in the stock price.� �Even though the subpar profitability may be temporary, thecompany continues to raise prices across its business in
order to improve underwriting results in a few key autoinsurance states and across the homeowners’ book. In thequarter, Allstate achieved rate increases averaging 7.8% in17 states in homeowners’ insurance, which helped propelnet written premiums up 2.8% in this line. We believeAllstate’s captive agency model, which is a primary sourceof its economic moat, creates stickier customers and givesit the pricing power to facilitate these rates increases.Unsurprisingly, policies in force (PIF) declined in both linesas a result of the profit improvement actions. That said, wethink it is best for an insurer to focus on profitability andreturns on capital first, rather than strive for policy growth.As these price increases work their way through thecompany’s book, combined with an eventual normalizationin weather losses, Allstate’s earnings will continue toimprove. Once this happens, we believe the market willincreasingly realize the long-term value in the company’sshares.�
© 2012 Morningstar. All Rights Reserved. Unless otherwise provided in a separate agreement, you may use this report only in the country in which its original distributor is based. Data as originally reported.The information contained herein is not represented or warranted to be accurate, correct, complete, or timely. This report is for information purposes only, and should not be considered a solicitation to buy or sell any security.Redistribution is prohibited without written permission. To order reprints, call +1 312-696-6100. To license the research, call +1 312-696-6869.
ß ®
Disclaimers & DisclosuresNo Morningstar employees are officers or directors of this company. Morningstar Inc. does not own more than 1% of the shares of this company. Analystscovering this company do not own its stock. The information contained herein is not represented or warranted to be accurate, correct, complete, or timely.This report is for information purposes only, and should not be considered a solicitation to buy or sell any security.

125
Morningstar Stock Data Sheet Pricing data thru May 07, 2012 Rating updated as of May 07, 2012Pricing data thru May 07, 2012 Rating updated as of May 07, 2012 Fiscal year-end: December
Allstate Corp ALL Sales USD Mil Mkt Cap USD Mil Industry Sector32,921 16,834 Insurance
- Property & Casualty Financial Services
TMMorningstar Rating Last Price Fair Value Uncertainty Economic Moat Stewardship GradeQQQQ 34.26 44.00 High Narrow .
per share prices in USD
2002 2003 2004 2005 2006 2007 2008 2009 2010 2011 YTD
3.0
6.0
19.0
39.0
3.0
6.0
41.9531.03
43.2730.05
51.9942.55
63.2249.66
66.1450.22
65.8548.90
52.9017.72
33.5013.77
35.5126.86
34.4022.27
34.8326.98
Annual Price HighLowRecent Splits
Price VolatilityMonthly High/LowRel Strength to S&P 500
52 week High/Low34.83 - 22.27
10 Year High/Low66.14 - 13.77
Bear-Market Rank9 (10=worst)
Trading Volume Million
Stock Performance
On the basis of premium sales, Allstate is the second-largestU.S. personal lines property-casualty insurer. Personal autorepresents an increasing percentage of sales, as the firm istrimming homeowners’ insurance to reduce catastrophicexposure. Life insurance contributes less than 10% of sales.Allstate products are sold in North America by independentagents, banks, and brokers, in addition to 13,000 companyagents.
2775 Sanders Road Northbrook, IL 60062Phone: 1 847 402-5000Website: http://www.allstate.com
Growth Rates Compound AnnualGrade: C 1 Yr 3 Yr 5 Yr 10 Yr
Revenue % 4.0 3.6 -1.8 1.2Operating Income % -12.6 . -37.5 -4.8Earnings/Share % -11.7 . -28.1 -0.6Dividends % 5.0 -20.0 -9.7 1.0Book Value/Share % 4.5 16.5 1.3 4.5Stock Total Return % 5.0 10.0 -8.9 1.1+/- Industry -3.6 -9.4 -10.1 -4.8+/- Market 3.4 -4.7 -7.0 -1.5
Profitability AnalysisGrade: D Current 5 Yr Avg Ind Mkt
Return on Equity % 5.3 5.3 4.7 22.2Return on Assets % 0.8 0.8 1.1 9.3Revenue/Employee USD K 875.6 872.6 . 1035.3
Financial PositionGrade: C 12-11 USD Mil 03-12 USD Mil
Total Investments 81767 82956
Cash 776 577Receivables 4920 4908Def Policy Acquisition Cost 4443 3716Accrued Inv Income 826 846Other Assets 32831 32930
Total Assets 125563 125933
Claims Reserve . 20283Unearned Premiums 10057 9888Debt 5908 6058Other Liabilities 90924 70522
Total Liabilities 106889 106751
Total Equity 18674 19182
2002 2003 2004 2005 2006 2007 2008 2009 2010 2011 TTM FinancialsPremiums25654 26981 28061 29088 29333 29099 28862 28152 25957 28180 28346Investment Income4854 4972 5284 5746 6177 6435 5622 4444 4102 3971 4000Fees & Other-929 196 591 549 286 1235 -5090 -583 1341 503 575 Total Revenue29579 32149 33936 35383 35796 36769 29394 32013 31400 32654 32921Operating Income USD Mil3578 5733 6919 4834 10237 6663 -3019 1241 1115 975 1322 Operating Margin %12.1 17.8 20.4 13.7 28.6 18.1 -10.3 3.9 3.6 3.0 4.0
Net Income1134 2705 3181 1765 4993 4636 -1679 854 928 788 1030
Earnings Per Share USD1.60 3.83 4.54 2.64 7.84 7.77 -3.07 1.58 1.71 1.51 2.00Dividends USD0.84 0.92 1.12 1.28 1.40 1.52 1.64 0.80 0.80 0.84 0.85Shares Mil710 706 700 667 637 597 546 541 542 523 515Book Value/Share USD24.81 29.23 31.80 31.12 34.96 38.29 23.59 31.08 35.68 36.95 39.04
Valuation AnalysisCurrent 5 Yr Avg Ind Mkt
Price/Earnings 17.1 . 17.8 15.1Forward P/E 8.3 . . 13.8Price/Cash Flow 8.8 5.3 12.5 7.9Dividend Yield % 2.5 . 1.9 2.0Price/Book 0.9 1.1 1.0 2.2Price/Sales 0.5 0.6 1.0 1.3PEG Ratio 0.7 . . 1.8
Total Return %12.3 18.8 22.8 7.0 23.0 -17.4 -34.1 -5.9 8.8 -11.4 25.8+/- Market35.7 -7.6 13.8 4.0 9.4 -20.9 4.4 -29.3 -4.0 -11.4 16.9+/- Industry21.2 -10.3 7.5 -11.8 8.0 -14.9 -11.2 -12.2 -8.3 -17.2 15.3
Dividend Yield %2.3 2.1 2.2 2.4 2.1 2.9 5.0 2.7 2.5 3.1 2.5Market Cap USD Mil26002 30268 35491 35072 40690 29809 17558 16131 16992 13852 16834
2002 2003 2004 2005 2006 2007 2008 2009 2010 2011 TTM ProfitabilityReturn on Assets %1.0 2.1 2.2 1.1 3.2 3.0 -1.1 0.6 0.7 0.6 0.8Return on Equity %6.5 14.2 15.0 8.4 23.8 21.2 -9.7 5.8 5.2 4.2 5.3
Net Margin %3.8 8.4 9.4 5.0 13.9 12.6 -5.7 2.7 3.0 2.4 3.1Asset Turnover0.26 0.26 0.24 0.23 0.23 0.23 0.20 0.24 0.24 0.25 0.26Financial Leverage6.7 6.5 6.9 7.7 7.2 7.2 10.7 8.0 6.9 6.7 6.6
2002 2003 2004 2005 2006 2007 2008 2009 2010 2011 03-12 Financial HealthBook Value/Prem67.97 76.22 77.77 69.40 74.48 75.09 43.80 59.29 73.26 66.27 67.67Long-Term Debt USD Mil3961 5073 5291 4887 4650 5640 5659 5910 5908 5908 6058Total Equity USD Mil17438 20565 21823 20186 21846 21851 12641 16692 19016 18674 19182Debt/Equity0.23 0.25 0.24 0.24 0.21 0.26 0.45 0.35 0.31 0.32 0.32
2002 2003 2004 2005 2006 2007 2008 2009 2010 2011 TTM ValuationPrice/Earnings23.1 11.2 11.4 20.5 8.3 6.7 . 19.0 18.7 18.1 17.1P/E vs. Market. . . . . . . . . 1.0 1.1Price/Sales0.9 0.9 1.1 1.0 1.2 0.8 0.6 0.5 0.6 0.4 0.5Price/Book1.5 1.5 1.6 1.7 1.9 1.4 1.4 1.0 0.9 0.7 0.9
Quarterly ResultsRevenue
Rev Growth
Earnings Per Share
USD Mil Jun 11 Sep 11 Dec 11 Mar 12
% Jun 11 Sep 11 Dec 11 Mar 12
USD Jun 11 Sep 11 Dec 11 Mar 12
Most Recent Period 8081.0 8242.0 8236.0 8362.0Prior Year Period 7656.0 7908.0 8087.0 8095.0
Most Recent Period 5.5 4.2 1.8 3.3Prior Year Period -9.8 4.3 0.4 4.5
Most Recent Period -1.19 0.32 1.38 1.53Prior Year Period 0.27 0.68 0.55 0.97
Industry Peers by Market Cap
Major Fund Holders
Mkt Cap USD Mil Rev USD Mil P/E ROE%
% of shares
Allstate Corp 16834 32921 17.1 5.3Berkshire Hathaway I 193692 148115 16.2 7.1Progressive Corporat 13428 15508 13.8 17.1
.
.
.
TTM data based on rolling quarterly data if available; otherwise most recent annual data shown.
© 2012 Morningstar. All Rights Reserved. Unless otherwise provided in a separate agreement, you may use this report only in the country in which its original distributor is based. Data as originally reported. The information contained herein is not represented or warranted to be accurate, correct, complete, or timely. This report is for information purposes only, and should not be considered a solicitation to buy or sell any security. Redistribution is prohibited without written permission. To order reprints, call +1 312-696-6100. To license the research, call +1 312-696-6869. ß
®

126
Morningstar’s Approach to Rating Stocks
Our Key Investing ConceptsEconomic Moat Rating��Discounted Cash Flow��Discount Rate��Fair Value��Uncertainty��Margin of Safety��Consider Buying/Consider Selling��Stewardship Grades��
TMAt Morningstar, we evaluate stocks as pieces of abusiness, not as pieces of paper. We think that purchasingshares of superior businesses at discounts to theirintrinsic value and allowing them to compound their valueover long periods of time is the surest way to createwealth in the stock market. We rate stocks 1 through 5 stars, with 5 the best and 1the worst. Our star rating is based on our analyst’sestimate of how much a company’s business is worth pershare. Our analysts arrive at this "fair value estimate" byforecasting how much excess cash--or "free cashflow"--the firm will generate in the future, and thenadjusting the total for timing and risk. Cash generatednext year is worth more than cash generated several yearsdown the road, and cash from a stable and consistentlyprofitable business is worth more than cash from acyclical or unsteady business. Stocks trading at meaningful discounts to our fair valueestimates will receive high star ratings. For high-qualitybusinesses, we require a smaller discount than formediocre ones, for a simple reason: We have moreconfidence in our cash-flow forecasts for strongcompanies, and thus in our value estimates. If a stock’smarket price is significantly above our fair value estimate,it will receive a low star rating, no matter how wonderfulwe think the business is. Even the best company is a baddeal if an investor overpays for its shares. Our fair value estimates don’t change very often, butmarket prices do. So, a stock may gain or lose stars based
just on movement in the share price. If we think a stock’sfair value is $50, and the shares decline to $40 withoutmuch change in the value of the business, the star ratingwill go up. Our estimate of what the business is worthhasn’t changed, but the shares are more attractive as aninvestment at $40 than they were at $50. Because we focus on the long-term value of businesses,rather than short-term movements in stock prices, at timeswe may appear out of step with the overall stock market.When stocks are high, relatively few will receive ourhighest rating of 5 stars. But when the market tumbles,many more will likely garner 5 stars. Although you mightexpect to see more 5-star stocks as the market rises, wefind assets more attractive when they’re cheap. We calculate our star ratings nightly after the marketsclose, and issue them the following business day, which iswhy the rating date on our reports will always be theprevious business day. We update the text of our reportsas new information becomes available, usually about onceor twice per quarter. That is why you’ll see two dates onevery Morningstar stock report. Of course, we monitormarket events and all of our stocks every business day, soour ratings always reflect our analyst’s current opinion. Economic Moat Rating The Economic Moat Rating is our assessment of a firm’sability to earn returns consistently above its cost of capitalin the future, usually by virtue of some competitiveadvantage. Competition tends to drive down such
TM
TM
Morningstar ResearchMethodology for ValuingCompanies QQQQQCompetitive Economic Company Fair Value Uncertainty
Analysis Moat Rating Valuation Estimate AssessmentTM
Analyst conducts The depth of the Analyst considers DCF model leads to An uncertaintycompany and industry firm’s competitive company financial the firm’s Fair Value assessmentresearch: advantage is rated: statements and Estimate, which establishes the� � competitive position anchors the rating margin ofManagement None to forecast future framework. safety required forinterviews Narrow cash flows. the stock rating.Conference calls Wide �Trade-show visits Assumptions areCompetitor, supplier, input into a dis-distributor, and counted cash-flowcustomer interviews model.
The current stockprice relative to fairvalue, adjustedfor uncertainty,determines therating.
QQQQQQQQQQQQQQQ
© 2012 Morningstar. All Rights Reserved. Unless otherwise provided in a separate agreement, you may use this report only in the country in which its original distributor is based. Data as originally reported.The information contained herein is not represented or warranted to be accurate, correct, complete, or timely. This report is for information purposes only, and should not be considered a solicitation to buy or sell any security.Redistribution is prohibited without written permission. To order reprints, call +1 312-696-6100. To license the research, call +1 312-696-6869.
ß ®

127
Morningstar’s Approach to Rating Stocks (continued)
economic profits, but companies that can earn them for anextended time by creating a competitive advantagepossess an Economic Moat. We see these companies assuperior investments. Discounted Cash Flow This is a method for valuing companies that involvesprojecting the amount of cash a business will generate inthe future, subtracting the amount of cash that thecompany will need to reinvest in its business, and usingthe result to calculate the worth of the firm. We use thistechnique to value nearly all of the companies we cover. Discount Rate We use this number to adjust the value of our forecastedcash flows for the risk that they may not materialize. For aprofitable company in a steady line of business, we’ll usea lower discount rate, also known as "cost of capital,"than for a firm in a cyclical business with fiercecompetition, since there’s less risk clouding the firm’sfuture. Fair Value This is the output of our discounted cash-flow valuationmodels, and is our per-share estimate of a company’sintrinsic worth. We adjust our fair values for off-balancesheet liabilities or assets that a firm might have--forexample, we deduct from a company’s fair value if it hasissued a lot of stock options or has an under-fundedpension plan. Our fair value estimate differs from a "targetprice" in two ways. First, it’s an estimate of what thebusiness is worth, whereas a price target typically reflectswhat other investors may pay for the stock. Second, it’s along-term estimate, whereas price targets generally focuson the next two to 12 months. Uncertainty To generate the Morningstar Uncertainty Rating, analystsconsider factors such as sales predictability, operatingleverage, and financial leverage. Analysts then classifytheir ability to bound the fair value estimate for the stockinto one of several uncertainty levels: Low, Medium, High,
Very High, or Extreme. The greater the level of uncertainty,the greater the discount to fair value required before astock can earn 5 stars, and the greater the premium to fairvalue before a stock earns a 1-star rating. Margin of Safety This is the discount to fair value we would require beforerecommending a stock. We think it’s always prudent tobuy stocks for less than they’re worth.The margin of safetyis like an insurance policy that protects investors from badnews or overly optimistic fair value estimates. We requirelarger margins of safety for less predictable stocks, andsmaller margins of safety for more predictable stocks. Consider Buying/Consider Selling The consider buying price is the price at which a stockwould be rated 5 stars, and thus the point at which wewould consider the stock an extremely attractivepurchase. Conversely, consider selling is the price atwhich a stock would have a 1 star rating, at which pointwe’d consider the stock overvalued, with low expectedreturns relative to its risk. Stewardship Grades Our corporate Stewardship Rating represents ourassessment of management’s stewardship of shareholdercapital, with particular emphasis on capital allocationdecisions. Analysts consider companies’ investmentstrategy and valuation, financial leverage, dividend andshare buyback policies, execution, compensation, relatedparty transactions, and accounting practices. Corporategovernance practices are only considered if they’ve had ademonstrated impact on shareholder value. Analystsassign one of three ratings: "Exemplary," "Standard," and"Poor." Analysts judge stewardship from an equity holder’sperspective. Ratings are determined on an absolute basis.Most companies will receive a Standard rating, and this isthe default rating in the absence of evidence thatmanagers have made exceptionally strong or poor capitalallocation decisions.
© 2012 Morningstar. All Rights Reserved. Unless otherwise provided in a separate agreement, you may use this report only in the country in which its original distributor is based. Data as originally reported.The information contained herein is not represented or warranted to be accurate, correct, complete, or timely. This report is for information purposes only, and should not be considered a solicitation to buy or sell any security.Redistribution is prohibited without written permission. To order reprints, call +1 312-696-6100. To license the research, call +1 312-696-6869.
ß ®