insights volume 6 october 2009
Upload: the-faculty-of-business-and-economics-the-university-of-melbourne
Post on 22-Jul-2016
216 views
DESCRIPTION
ÂTRANSCRIPT

Insights Melbourne Economics and Commerce a
insightsMelbourne Economics
and Commerce
volume 6 november 2009
Pricking bubbles in the wind: Could central banks have done more to head off the financial crisis?
By Howard Davies
Avoiding the 1930s-style protectionism: Lessons for today
By Douglas A Irwin
China’s challenges after growth rebound By Yiping Huang
One year after the Garnaut Climate Change Review
By Ross Garnaut
Search for a theory for unemployment By Ian King
Organising for co-creation: The service employee-customer
interface as a source of competitive advantage
By Simon Bell
A skilled workforce for the future By Kostas Mavromaras
The contribution of VET to Australia’s skill base
By Tom Karmel
An evidence-based approach to developing your career
By Leisa D Sargent
What does economics say about intellectual property?
By Russell Thomson and Elizabeth Webster
Are we taking Indonesia seriously? By Howard Dick
Occasional address By Ross Garnaut

Insights: Melbourne Economics and CommerceISSN:1834-6154
Editor: Emeritus Professor Joe Isaac, AOAssociate Editor: Ms Brooke YoungSub-editor: Ms Rebecca Gleeson
Advisory Board: Professor Robert DixonProfessor Bruce GrundyProfessor Bryan Lukas
Illustrator: Ms Lisa CouttsDesign: Ms Sophie Campbell
The wide-ranging nature of the articles published in Insights will be evident to readers. They reflect the multi-disciplinary and international scope of the subjects taught in the Faculty and the impact of these disciplines in the development of public policy. The distinguished authorities who deliver these public lectures go to great length to make the condensed versions of their lectures comprehensible to lay readers without compromising on the rigour of their material. This issue is no exception. It is pleasing to note that some of our articles are reprinted, with permission, in part or whole in other journals. Professor Graham Sewell’s article ‘Big brother or a fair go’ (Vol 4 November 2008) was featured in a recent issue of Risk Management.
The international financial crisis features again prominently, with papers by Sir Howard Davies and Professor Douglas Irwin focussing on prevention, and a third by Professor Huang dealing with recent Chinese experience. Professor Garnaut discusses the reception in Australia of his Climate Change Review. This is followed by two professorial inaugural addresses. Ian King expounds on his special interest – the ‘search theories’ concerned with the importance of frictions and uncertainty in the co-existence of unemployment and unfilled vacancies. Simon Bell develops the ‘co-creation’ marketing thesis, which argues that firms may profit from customers’ advice and suggestions in generating ideas and developing products. Vocational education features in two articles – one by Professor Kosta Mavromaras deals with whether we have enough skills and whether we are using them well, and Dr Tom Karmel examines the contribution of vocational education and training to the labour market.
Insights publishes condensed and edited versions of important public lectures connected with the Faculty of Economics and Commerce. Its object is to share with the wider public – especially alumni – the issues presented and developed in these lectures. Our goal is to provide readers with access to expert opinion on complex issues and make available some of the extensive resources that are freely available. Insights also constitutes an archival source of an important element in Faculty life.
Welcome
We also publish two of the Faculty’s refresher lectures, attended by alumni and present students. Associate Professor Leisa Sergeant’s paper draws on recent research evidence to consider various factors that inform contemporary career management. She presents research on changes to the fundamental notion of ‘career’ and the importance of strategies such as mentoring to build social capital and networks, to assist in career advancement and sourcing job opportunities. The other, by Dr Russell Thompson and Associate Professor Elizabeth Webster, shows the development over the years of the concept of intellectual property, the shifting weight of interest from the concern of lawyers with ‘moral rights and fair process’ to that of economists with ‘dynamic economic efficiency’. They discuss the ramifications of the latter for research and development.
Professor Howard Dick examines the development of our economic and political relations with Indonesia and argues that the need for closer relations is hampered because the Australian public remains deeply suspicious of Indonesia. Finally, words of wisdom to graduating students in dealing with the changing environment are contained in the Occasional Address by Professor Ross Garnaut.
In this issue, thanks must go to Lisa Coutts, whose striking illustrations add life to the various papers.

Insights Melbourne Economics and Commerce 01
insights vol 6
Table of contents
03 Pricking bubbles in the wind: Could central banks have done more to head off the financial crisis?
By Howard Davies It is necessary to reintegrate financial market
analysis, credit and asset prices into the monetary policy regime
08 Avoiding the 1930s-style protectionism: Lessons for today
By Douglas A Irwin Is there a risk of a 1930s-style increase in
protectionism? Fortunately, the world economy in the 2000s is very different from the world economy in the 1930s.
13 China’s challenges after growth rebound
By Yiping Huang Because of the government’s aggressive
policy actions, the Chinese economy quickly stabilised and rebounded during the first half of 2009. However, some short-term challenges are likely to remain – at least until the global economy recovers more fully.
19 One year after the Garnaut Climate Change Review
By Ross Garnaut While the ETS as proposed by the
government has many weaknesses, it is likely that changes to facilitate support in the Australian Senate would exacerbate rather than ameliorate these weaknesses
23 Search for a theory for unemployment
By Ian King The advantage of search theory is that it
explicitly takes into account the frictions and the uncertainty that agents in the labour market face, and it allows us to understand unemployment as an equilibrium phenomenon
29 Organising for co-creation: The service employee-customer interface as a source of competitive advantage
By Simon Bell For effective co-creation to occur, the
organisation needs to be willing to give up an element control
35 A skilled workforce for the future By Kostas Mavromaras Australia needs to produce additional human
capital and use existing human capital better. The role of an invigorated vocational education and training sector is crucial for both tasks.
41 The contribution of VET to Australia’s skill base
By Tom Karmel VET is more than a narrow preparation for
particular occupations. For the majority of people there is a loose relationship between their training and their employment.
Alumni refresher lecture series
47 An evidence-based approach to developing your career
By Leisa D Sargent Today’s working life is quite different
from that of our parents and grandparents. We live in more demanding and less predictable times.
52 What does economics say about intellectual property?
By Russell Thomson and Elizabeth Webster The issue for the policy maker is: can
we craft patent law so it provides the incentive needed for commercialisation while preserving the best features of the system of open science?
56 Are we taking Indonesia seriously?
By Howard Dick In 2009 most Australians have not made
up their mind whether they want to engage with Indonesia or not. Our hearts, minds and wallets are still elsewhere.
Occasional Address
60 Using good education in times of change
By Ross Garnaut Those features of the world that reflect and
shape human civilisation are changing on a scale and at a pace that has no precedent.

Article heading here2

Insights Melbourne Economics and Commerce 3
real interest rates on safe assets to historically low levels, reinforced by loose monetary policy.’
Others put forward a stronger critique, and maintain firmly that the crisis was ‘made in the Fed’. Steve Roach, the former chief economist of Morgan Stanley, does not mince his words. ‘Central banks’, he argues, ‘were asleep at the switch. Central banks have failed to provide a stable underpinning to world financial markets and to an increasingly asset-dependent global economy… It is high time for monetary authorities to adopt new procedures – namely taking asset markets into explicit consideration when framing policy options.’
John Taylor points out that interest rates in the US were, from the end of 2001, held significantly below the level which his rule would have indicated. He argues that this deliberately loose monetary policy was the direct cause of the house price boom and subsequent bust.
At the time, most central bank governors did not accept the argument that asset prices were giving dangerous signals, though Bill White, then chief economist at the BIS, argued for a greater focus on credit expansion and asset prices, and did so well before the crisis hit. Surely, he argued, there was a point at which it was possible to identify asset mispricing and bubbles? Why could interest rate policy not take some account of the risks posed by escalating asset prices, just as it did with other
The world economy is beginning to recoverThere are persuasive signs that the world economy is beginning to recover, and Australia may avoid a technical recession altogether. But we should not forget that the costs of the credit crisis are huge in terms of lost output, lost jobs, and fiscal deficits. In the UK, the crisis is the fourth largest fiscal event in history, after the Napoleonic War and the two World Wars of the twentieth century. In the US, the government’s commitments – which may not all be called – are twice as large as the cost of World War II.
So it is important to ask why the crisis arose in the virulent form it did. Many culprits have been identified: sleepy regulators, greedy bankers, poor risk managers, negligent (or worse) rating agencies. The political right tends now to argue that too much regulation was to blame; the left, that the problem was too little. But almost everyone agrees that an overhaul of global regulation is in order.
The role played by central banksShould we not also, however, look at the role played by central banks as monetary authorities?
As Charlie Bean, Deputy Governor of the Bank of England, noted, ‘You need fuel to make a fire, too. And that was provided by the ex ante excess supply of global savings over investment, which pushed
pricking bubbles in the wind: could central banks have done more to
head off the financial crisis?
It is necessary to reintegrate financial market analysis, credit and asset prices into the monetary policy regime
A condensed version of the 2009 David Finch Lecture delivered on 13 August at the University of Melbourne. The Lecture was established through the generosity of C David Finch, a distinguished alumnus of the University. The full paper is published in the Australian Economic Review 42, 4, December 2009.
by howard davies

4 Pricking bubbles in the wind: Could central banks have done more to head off the financial crisis?
Q2 Should the measure of inflation targeted include an element of asset price, and particularly house price inflation?
The current definition of inflation used in the UK and in EMU excludes any element of housing costs. In the UK the target rate was changed from the RPI, which did include an element of imputed house rental costs, to the CPI, on the model of the Harmonised Index of Consumer Prices used in the Euro area, in 2003.
Since then, the Bank of England has changed tack, and the Governor has now accepted that it would be preferable to change to a measure which did incorporate an element of housing costs.
So there appears to be an emerging consensus on this point. But just how sizeable an element of housing costs should be incorporated in the target rate is likely to prove far more controversial. In the US, the index includes an estimate of the price of owner-occupation based on a survey of rental costs. Stephen Cecchetti has calculated the impact on US inflation were that element to be replaced by an index of home sales prices. The effect is dramatic. Over five years from 2000, recomputed inflation would have been three quarters of a per cent a year higher than on the CPI index used. In the UK, the effect would have been even greater.
So while some readjustment of the index might be helpful as a signalling mechanism, it is highly unlikely that the adjustment would be anything like as dramatic as Cecchetti’s calculations imply.
The third question is where things get more difficult.
Q3 Is it possible to identify serious asset price misalignments, and are they of legitimate concern to monetary policy-makers?
Advocates of ‘leaning against the wind’ argue that there are long-run measures which can help to identify mispricing. In the equity markets, extravagant price-earnings ratios were a powerful leading indicator of trouble in the dot com boom. More recently, a dramatic fall in the risk premium on high yield bonds was a strong sign of mispricing there. In the case of housing there are price/earnings ratios, and perhaps more importantly price/rental
risks to inflation and growth? BIS economists became closely identified with the proposal that the monetary authorities, even those with a tight inflation objective focused on retail prices, should have been prepared to ‘lean against the wind’ of asset price escalation.
The central bank response to this heterodoxy, both before and during the crisis, was robust. Alan Greenspan challenged every link in the chain of argument. In his view it was not possible to identify when a bubble was inflating, and even if it were possible so to do, a monetary response would be ineffective. Furthermore, it would be undesirable to attempt to respond in a way which might constrain markets and hinder the processes of innovation. Instead, central banks should forget about preventive measures and ‘focus on policies to mitigate the fall-out when it occurs.’
These contrasting points of view seem to admit little possibility of accommodation. Yet there are more recent signs that central banks, faced with the massive value destruction of the last two years, are becoming more pensive about their record. If the bust is so dramatic and costly, should we not consider whether we might not have done more to avert it?
It is therefore worth picking through the details of the dispute to see if the outline of a more effective approach might emerge – one which does not compromise the success achieved in anti-inflation policy, but gives greater weight to financial stability.
Five questions
To do so it is useful to parse the argument into a series of questions on which different points of view are advanced.
Q1 Should central banks target asset prices?
On this, there is a large measure of agreement. Even those who argue for ‘leaning against the wind’ do not think central banks should target asset prices directly. So the argument is not about adjusting the definition of inflation on an ad hoc basis as asset prices fluctuate. It is about how far decision-makers should take account of asset price misalignments in setting interest rates.

Insights Melbourne Economics and Commerce 5
economy overall, and inflict greater damage on economic welfare than a policy of benign neglect, followed by aggressive easing if necessary.
But there is evidence that ‘leaning’ can be useful.
The Swedish Riksbank believes that its actions did have a helpful effect on the expansion of asset prices in Sweden, though they did not avoid a fall in 2008. The ECB, too, maintains that it takes asset prices into account in the monetary pillar of its analysis.
So there is a clear fault-line here within the central banking fraternity. The experience of 2007–08 strengthened the hands of those who favour ‘leaning against the wind’, and the language used by Governors has begun to change. Yet the Greenspan tendency is not down and out. Two months ago, Mervyn King argued, ‘Diverting monetary policy from its goal of price stability risks making the economy less stable and the financial system no more so.’
Both sides are agreed, though, that interest rates are not the only weapon that can be used. Even
income ratios, which point to the likelihood of downward shifts. The growth of credit aggregates may also be helpful in identifying unsustainable asset price increases. These indicators cannot be used as automatic triggers, and misalignments may persist for some time, but the uncertainties are no greater than in many other areas where the monetary authority has to take a view.
Q4 Even if we can identify misalignments, and believe that some price adjustment is bound to occur, is it right to use interest rates to try to moderate the expansion?
It is striking how often in this debate the opposing sides caricature each other’s positions. So advocates of the use of the interest rate weapon prefer to use the non-threatening metaphor of ‘leaning against the wind’. Those who resist it typically raise the stakes by talking of the risks of trying to ‘prick bubbles’.
In Bernanke’s view, the scale of interest rate changes needed to make a significant impact on a price bubble, whether in the equity or property markets, would be so large as to threaten the health of the

6 Pricking bubbles in the wind: Could central banks have done more to head off the financial crisis?
easy option, and should be considered alongside the interest rate decision, not apart from it.
Conclusions about ‘leaning against the wind’
In my view, central banks must pay more attention to asset price bubbles than they have in the recent past.
I am not persuaded by the argument that bubbles cannot be identified ex ante. Of course assessing price misalignments is not an exact science, but nor are many other aspects of monetary policy. Furthermore, I believe that asset prices should be identified as an explicit factor in the consideration of policy, and an element of housing costs should be re-incorporated in the index as soon as possible. That would help to explain policy.
I argue that, in future, monetary policy decision-makers in central banks should pay more attention to the creation of credit, both within and without the banks, in reaching decisions on interest rates.
central banks – which paid little attention to bank regulation before the crisis – are showing more interest in capital requirements. That leads to the fifth and last question.
Q5 Should we try to find and use mechanisms other than interest rates to moderate extravagant credit expansion and associated asset price bubbles?
Almost all central bankers would now answer yes, in principle, to this question, whether or not they believe that interest rate changes should also be used to that end. They tend to point to the use of variable capital ratios in the banking system. But raising capital ratios as a precautionary move will also affect the economy as a whole, unless regulators use some kind of sectoral approach (raising capital in relation to mortgage finance only, for example – likely to be a politically unpopular move). Credit rationing will feed into price through interest rate changes, which will themselves affect the monetary stance. So a macro-prudential mechanism is not an

Insights Melbourne Economics and Commerce 7
I recognise that the interest-rate weapon is powerful and blunt. There will be circumstances in which it will be more appropriate to act directly on the expansionary appetites of banks themselves, through adjusting capital requirements. We have to recognise, though, that the application of additional capital requirements for macroeconomic reasons, not directly related to the risk positions of individual banks, will feedback to interest rates and hence monetary policy.
Adjusting capital requirements to the state of the economic cycle would be very difficult. The decision to impose higher capital requirements would require courage on the part of economists and supervisors. But if the assessments were agreed by central banks from a broad range of countries, they would have authority and give line supervisors the cover they need to impose unpopular ‘taxes’ on their banks. We need to recognise that, at bottom, a macro-prudential tool is a tax, and one whose cost would largely be passed through to borrowers and savers. Now would be the right time to introduce a system of this kind, when the memories of the crisis are fresh and the wounds still raw.
At the G20 summit in April, Heads of Government agreed in principle that macro-prudential measures should be agreed, though it is not wholly clear that they knew quite what they were asking for. There is much work to do before we have a workable system, but it should not blind us to the need to reintegrate financial market analysis, credit and asset prices into the monetary policy regime. If it is conceived as a substitute, then it will inevitably disappoint.
Sir Howard Davies is Director of the London School of Economics, a post he took up in September 2003. Other important positions he has held include Chairman of the Financial Services Authority; Deputy Governor of the Bank of England; Director-General of the Confederation of British Industry; Controller of the Audit Commission; director of GKN plc; member of the International Advisory Board of Natwest; Foreign and Commonwealth Office and H M Treasury, both as an official and as special adviser to the Chancellor of the Exchequer; and management consultant for McKinsey and Co. Inc.
He writes regularly for the Financial Times and his reviews include fiction for the Literary Review and The Times, and historical and economics books for the Economist, The Times, the TLS and the Times Higher.
He is a Trustee of the Tate, a member of the governing body of the Royal Academy of Music; Patron of Working Families; and in 2004 was elected to an Honorary Fellowship at Merton College. Since 2003 he has been a member of the International Advisory Council of the China Banking Regulatory Commission. In 2004 he joined the board of Morgan Stanley as a non-executive director, and in 2006 joined the Board of Paternoster Limited, a new insurance company. In 2009 he became an advisor to the Government Investment Corporation of Singapore.

8 Avoiding the 1930s-style protectionism: Lessons for today
such that a 1930s-style resort to protectionism is unnecessary and unlikely.
The trade policy breakdown in the 1930s
Almost everyone with a rudimentary understanding of the 1930s knows that the period was marked by greater protectionism – the infamous Smoot-Hawley tariff in the US stands out in the public imagination – and collapsing trade. But was there any rhyme or reason to the mad scramble to block imports? Most accounts suggest that all countries succumbed to the pressure to close markets to foreign goods. In fact, there was a logical progression to events as they unfolded in the early 1930s and there was a high degree of variation in the extent to which countries limited trade.
To understand the breakdown in the world economy, it is essential to appreciate that the international monetary system was based on the gold standard. This regime of fixed exchange rates linked countries to one another and ensured that shocks to one country would be quickly transmitted to others. In addition, the gold standard tied the hands of monetary authorities, who were obligated to maintain the value of their currency in terms of its gold parity. The loss of monetary autonomy meant that the policymakers lacked an important policy instrument (an independent monetary policy) to help adjust to any such shocks. This has always been a theme of Max Corden’s work on
A statement released by the G-20 leaders on 2 April 2009 emphatically noted: “We will not repeat the historic mistakes of protectionism of previous eras.” What historic mistakes of previous eras were the leaders referring to?
Almost unquestionably, the reference was to the Great Depression of the 1930s. Indeed, the world’s current economic and financial crisis – complete with plummeting stock markets, collapsing world trade, sharply rising unemployment rates, and even the threat of deflation – has prompted many comparisons to the Depression. The 1929-32 period, which saw economic activity collapse around the world, was marked by a severe outbreak of protectionism and breakdown of the world trading system. The rise in trade barriers is believed to have intensified the Depression and to have hindered the economic recovery. And the trade barriers imposed under the ‘emergency’ conditions of the day remained in place for a period that stretched into decades, blocking the expansion of world trade even though the original justification for the barriers had long since passed.
In order to avoid repeating the calamity of the 1930s, it is necessary to understand precisely what happened to the world trading system during that terrible decade. Therefore, I will present a brief account of the deterioration in trade relations at that time and examine the similarities and differences between the situation then and today. I conclude that conditions are different enough today
avoiding the 1930s-style protectionism: lessons for today
Is there a risk of a 1930s-style increase in protectionism? Fortunately, the world economy in the 2000s is very different
from the world economy in the 1930s.
A condensed version of the Annual Max Corden Lecture delivered at the University of Melbourne on 30 July 2009.
by douglas a irwin

Insights Melbourne Economics and Commerce 9
trade policy around the world than the Smoot-Hawley tariff had been. In its World Economic Survey 1931/32, the League of Nations said that:
It is impossible in any brief summary to make anything like a complete statement of all the various devices brought into use to restrict trade. Especially after the abandonment of the gold standard by Great Britain in September 1931, there has been a veritable panic, which has piled new tariffs on old, turned licensing systems into prohibitions, monopolies and contingents; denounced existing commercial agreements; created more and more rigid exchange controls issuing in debt moratoria and paralysing trade; and substituted a slight and temporary framework of clearing agreements for previous existing treaties . . . There has never before been such a wholesale and widespread retreat from international economic co-operation.
The next year, the League of Nations argued: ‘By the middle of 1932, it was obvious that the international trading mechanism was in real danger of being smashed as completely as the international monetary system had been.’
Thus, by 1932, a wide range of controls and restrictions – higher tariffs, new import quotas, controls on foreign exchange transactions – had been imposed on world trade around the world. The volume of world trade fell 26 per cent between 1929 and 1932, as figure 1 shows. In addition,
the interrelationship between the macroeconomic policy and trade policy.
It is commonly believed that the US led the movement toward greater protectionism when President Herbert Hoover signed the Smoot-Hawley tariff act in June 1930. Yet the impact of the Smoot-Hawley tariff on world trade was relatively limited. About two thirds of US imports entered the country duty free, and only six per cent of Europe’s exports were destined for the US market. Although the US action provoked intense bitterness and resentment abroad, it did not lead to the collapse of the world trading system.
The series of events that really began to undermine the trading system started with the failure of Creditanstalt, Austria’s largest bank, in June 1931. This failure contributed to a financial panic that spread to neighboring countries and around the world. In particular, a financial crisis in Germany, which caused depositors to begin massive withdrawals of funds and demand gold in exchange for marks, prompted Germany to impose strict controls on foreign exchange transactions that impeded trade and capital flows alike. Many other countries followed suit to stem the loss of gold and foreign exchange reserves.
Other countries responded differently to the financial pressure. Britain, for example, and other sterling bloc countries, allowed their currencies to depreciate against gold and other currencies. This allowed them to use expansionary monetary policies to help recover more quickly from the Depression. Unfortunately, while there were sound domestic economic reasons for Britain’s action, it led to the breakdown of international trade relations. Britain’s devaluation triggered a defensive response by countries that remained on the gold standard as they sought to offset the competitive advantage gained by sterling area producers. Hence, another round of countries imposed exchange controls in late 1931. Exchange controls – which restricted the use of foreign exchange, not only to prevent capital flight but to reduce spending on imports as well – were among the most restrictive trade practices of the early 1930s.
The economic crisis of mid- to late-1931 was much more responsible for the deterioration in
130
120
110
100
90
80
70
601926 1927 1928 1929 1930 1931 1932 1933 1934 1935 1936 1937 1938
Industrial production
Primary production
World trade
Source: League of Nations
Figure 1: World Trade and World Production, 1926-1938

10
there should be fiscal retrenchment in an economic downturn, not a fiscal expansion. Therefore, since many countries ruled out the use of monetary or fiscal policy to address the Depression, the turn to protectionism was simply an alternative, albeit inferior way of reducing capital outflows and the loss of gold and foreign exchange reserves.
In this sense, devaluation, exchange controls and trade restrictions were substitute policy instruments. This is something that Max Corden has written about in the second edition of his classic book, Trade Policy and Economic Welfare. As he put it: ‘The inability to use the exchange rate as a policy instrument provides an incentive to impose or increase restrictive trade policies at times of crisis, and thus leads to protectionist measures which often fail to be reduced when the short-term crisis is at an end.’ Indeed, during the Depression, countries that chose to devalue their currencies tended not to employ exchange controls or resort to trade protection. Alternatively, countries that could not or would not devalue almost invariably imposed exchange controls or adopted protectionist trade measures. Furthermore, many of the trade controls adopted in the early 1930s were not removed until well after World War II.
Similarities and differences to today
What can we take away from the historical experience of the 1930s that might help us think about the current world slump? Without doubt, there will be an increase in protectionist measures during the current recession. Many such measures are WTO-legal. The use of antidumping duties is very countercyclical and inevitably rises as economic growth falters. In addition, for most developing countries, bound tariffs are much higher than applied tariffs. If they wanted to do so, these countries could increase their duties on imports without violating WTO commitments. Finally, in areas where WTO agreements are weak, such as government procurement, the temptation to impose buy-local requirements, such as the ‘Buy America’ provision in the stimulus bill, may prove irresistible.
But is there a risk of a 1930s-style increase in protectionism? Fortunately, the world economy in
countries began forming preferential trading areas, most notably the Imperial Preferences of the British Empire. This balkanised trade in exclusive trade blocs and complemented bilateral clearing arrangements as the multilateral pattern of trade and payments was in shambles.
Eventually, all countries left the gold standard. The US de-linked the dollar from gold in April 1933 and allowed the dollar to depreciate. The remaining gold bloc countries – France, the Netherlands, Belgium and Switzerland – clung to gold but eventually abandoned the standard in 1936 (in the case of Belgium, 1935). The timing of a country’s recovery during the Depression is intimately linked to when it abandoned the gold standard because it allowed countries to reduce interest rates and expand the money supply, relieving financial distress and promoting recovery. Britain and the European sterling area, which left gold in 1931, experienced a relatively mild recession, whereas the gold bloc countries, which did not leave until 1936, suffered a prolonged economic downturn.
This suggests that the best strategy to have combated the Depression would have been a suspension of the gold standard or a coordinated change in the gold parities such that all countries could have pursued monetary reflation even with fixed exchange rates. Instead, there was no international coordination, countries left the gold standard in a haphazard fashion, and those that did, intensified the economic problems faced by those remaining tied to gold. Unfortunately, the world trading system was a casualty of this process.
Understanding the 1930s breakdown
What should we learn from the breakdown in world trade relations in the early 1930s? In a recent paper, Barry Eichengreen and I have argued that the move toward protectionism was intimately related to the real or perceived constraints on macroeconomic policy instruments. Countries that clung to the gold standard were unable to use monetary policy to prevent the slide from recession to Depression. In addition, fiscal policy was constrained by the prevailing economic orthodoxy that governments should run balanced budgets even in bad times; hence, it was thought,
Avoiding the 1930s-style protectionism: Lessons for today

Insights Melbourne Economics and Commerce 11
that they have a vested interest in resisting protectionism. Many industries that faced import competition in the past, such as televisions and automobiles and semiconductors, have found that international diversification or joint ventures with foreign partners are a more profitable way of coping with global competition than simply stopping goods at the border. Many domestic industries no longer have much of an incentive to ask for import restrictions because foreign rivals now produce in the domestic market, eliminating the benefits of trade barriers for domestic firms. For example, unlike the early 1980s, US automakers are not asking for trade protection because it would not solve any of their problems; they are diversified into other markets with equity stakes in foreign producers, and other foreign firms operate large production facilities in the US.
These important differences suggest that a protectionist trade war need not break out like the 1930s. With more economic policy instruments in play today, the need to resort to trade restrictions should be less of a problem. Yet, severe recessions are always dangerous periods for trade policy, and policymakers should remain on guard against measures that have external ramifications and might lead to countervailing policies in other countries.
Professor Douglas Irwin is Robert E. Maxwell ‘23 Professor of Arts and Sciences in the Economics Department of Dartmouth College at Hanover New Hampshire.
the 2000s is very different from the world economy in the 1930s. Most of the differences augur well for preventing another outbreak of protectionism.
First, countries today have many more policy instruments for dealing with the current severe recession. Governments are significantly less constrained in terms of using monetary and fiscal policy to address the economic crisis. In the 1930s, governments took no responsibility for propping up financial institutions and were unable to pursue reflationary monetary policies because of the gold standard. Today, expansionary monetary and fiscal policy measures have been used in the US, the European Union, China, and elsewhere to offset the recession. While governments may be under political pressure to protect certain producer interests, policymakers are not under the illusion that protectionism can provide a macroeconomic stimulus on par with monetary and fiscal policy.
Second, in the early 1930s, countries imposed higher trade barriers unilaterally without violating any international agreements or anticipating much foreign reaction. Today, WTO agreements restrict the use of such discretionary trade policy. Countries that are tempted to violate WTO agreements can have no illusion that they will avoid swift foreign retaliation if they choose to do so. When a country is certain that its exports will face new impediments abroad if it chooses to impose WTO-inconsistent import restrictions, that country will think twice about restricting imports.
Third, the share of the workforce in sectors directly affected by international trade – mainly agriculture and manufacturing – is much lower today than in the 1930s. In the case of the US, for example, about 44 per cent of the labour force was in agriculture, mining, and manufacturing in 1930 and hence might benefit from import restrictions. Today, that share is about 14 per cent. The service sector of the economy is much more insulated from foreign competition, which means the scope for beneficial expenditure-switching policies is that much lower.
Fourth, unlike the early 1930s, foreign investment has transformed the world economy. Leading firms around the world have become so multinational in their production operations and supply chains

Article heading here12

Insights Melbourne Economics and Commerce 13
The object of this short paper is to examine the development of the Chinese economy during the period of US financial crisis. It will deal with three questions. One, what were the key channels through which US crisis affected the Chinese economy? Two, how did the Chinese government respond? And, three, what are the likely challenges ahead for China?
Effects of the crisis
Before the current US financial crisis, a popular ‘decoupling’ thesis maintained that China’s strong growth would continue regardless of the performance of the US economy. Such hypothesis was unrealistic even then, given that China had implemented an open-door policy for 20 years and that exports were already close to 40 per cent of GDP. Development during the past three quarters also illustrated the tight links between the Chinese and American economies – as the US fell rapidly into recession, Chinese GDP growth decelerated from 9 per cent in the third quarter of 2008 to 6.7 per cent in the fourth quarter and, again, to 6.1 per cent in the first quarter of this year.
The two economies are now interlocked through many channels. But it is likely the US financial crisis mainly affected the Chinese economy through the following three channels:
1. Collapse of exports
2. Reversal of hot money flows
3. Weakening of confidence.
Growth rebound
The release of the 2009 second-quarter GDP rate of 7.9 per cent, by China’s National Bureau of Statistics, pronounced an end to the economic decline. However, signs of stabilisation in economic activities emerged even earlier. The quarter-on-quarter annualised GDP growth had already rebounded from 0.4 per cent in the fourth quarter of 2008 to 6.2 per cent in the first quarter of 2009.
Some analysts remain skeptical about the reliability of Chinese statistics. While this may be a valid concern, information from other sources points to a sharp improvement in the economy in recent months. Electricity consumption recovered from a decline of close to 10 per cent at the end of last year to an increase of 6 per cent in July this year. Automobile sales are growing apace at 40 per cent, while demand for materials such as steel, copper and cement also rose sharply in recent months. In fact, all available data confirms that, as predicted earlier by Chinese Premier Wen Jiabao, of the world’s major economies, China was the first to come out of growth recession. Recovery of the Chinese economy injected positive sentiment to the global as well as Chinese markets. The Shanghai A-share Index, for instance, rose rapidly in June and July before the dips in late August, caused mainly by concerns of prospective policy tightening. Housing prices have also shown positive month-on-month growth since the beginning of the year.
china’s challenges after growth rebound
Because of the government’s aggressive policy actions, the Chinese economy quickly stabilised and rebounded during the first half of 2009.
However, some short-term challenges are likely to remain – at least until the global economy recovers more fully.
A condensed version of a paper given at the Melbourne Institute Economic Forum on 20 July 2009.
by yiping huang

14 China’s challenges after growth rebound
of 2009. From second quarter 2009, hot money returned to China as the economy recovered and asset prices began to rise again.
Confidence in the Chinese economy and markets also suffered broad-based collapse. For instance, the Purchasing Managers’ Index (PMI) declined from high fifties in early 2008 to below 40 in November that year (PMI above 50 implies expansion of manufacturing activities while PMI below 50 means recession). Furthermore, surveys by the People’s Bank of China (PBOC), showed that entrepreneur and consumer confidence also weakened in the wake of the US financial crisis.
Earlier pessimism
During the fourth quarter of 2008, economists and policymakers were very pessimistic about the outlook of Chinese growth, especially for 2009. Although the government indicated that it would make whatever efforts necessary to achieve 8 per cent growth, industry financial economists generally reduced their 2009 GDP forecasts.
Exports had been one of China’s key growth drivers until recently. During the first half of 2008, exports still expanded at a pace of 20 per cent, yet slowed significantly during the second half of that year. Since the beginning of 2009, exports have been declining by around 20 per cent. Given the importance of exports, the Chinese economy suffered badly. Job losses were massive, especially in export-oriented areas like Pearl River Delta and Yangtze River Delta. During the second quarter of 2009, net exports contributed minus 15 per cent to GDP growth.
Despite relatively strict controls of the capital account, cross-border speculative capital flows still appeared to be large and volatile. Analysts often look at the gap between accumulation of foreign exchange reserves and the sum of trade surplus and foreign direct investment inflows to gauge the size and direction of such capital flows. A quick glance at the data suggests that hot money probably flowed into China in early 2008 but reversed towards the end of the year and the beginning

Insights Melbourne Economics and Commerce 15
Second, many analysts also believed that after 30 years of economic reform, China has become another capitalist market economy. This is certainly evidenced by the much higher proportion of both international trade and the private sector in today’s economy compared to that of a couple of decades ago. Therefore, they assumed that China would most likely be subject to normal economic cycles associated with other capitalist market economies.
While these analysts were right in pointing out that the Chinese economy is now more market-oriented than before, they probably underestimated the government’s economic influence. In fact, the authorities’ ability to support economic growth strengthened rather than weakened compared to 10 years ago. Ten years ago, state budget revenues were only 11 per cent of GDP; today, they are 21 per cent of GDP. Ten years ago, the government’s contingent liabilities were more than 100 per cent of GDP; today, they are probably down to 60 per cent of GDP.
Importantly, the government’s means of supporting growth go way beyond fiscal measures. Ten years ago, the average non-performing loan ratio of Chinese banks was above 30 per cent; today, it is about 7 per cent. Ten years ago, the state sector as a whole made a net loss; today, it is massively profitable. Ten years ago, China’s foreign exchange reserves were only about $140 billion; today they exceed $2 trillion.
Policy responses
In early November 2008, the State Council announced a stimulus package for 2009–2010 of CNY4 trillion1. This was equivalent to 16 per cent of 2007 GDP. Later, when the government detailed the items of total spending, it became clear that more than 85 per cent was investment expenditure. An incomplete count of investment proposals put together by provincial governments point to a total of CNY18 trillion. These reflected the government’s belief that investment was the most effective way of lifting domestic demand and, therefore, GDP growth.
Only a portion of CNY4 trillion, about CNY1.2 trillion, would be directly financed by central
Excessive pessimism among some investors and analysts at that time was, in my view, caused by two key factors: misinterpretation of economic trends and underestimation of the government’s capability.
First, economic data weakened sharply during the fourth quarter of 2008. Growth of industrial production decelerated from above 15 per cent early that year to around three to five per cent at the end of the year. In particular, growth of power generation fell from above 10 per cent to minus nine per cent. Demand for key commodities such as steel, copper and aluminum also collapsed. These changes led to widespread concern that the Chinese economy was falling off the cliff.
In the meantime, however, data on the underlying demand of the economy were relatively strong. Growth of retail sales, a key indicator of consumer spending, continued to accelerate. Net exports also continued to surge, as imports declined much faster than exports. Real growth of fixed asset investment moderated, from 20 to 25 per cent at the start of 2008, to 10 to 15 per cent at the end of the year, caused mainly by the collapse of real estate investment.
The inconsistency between rapidly weakening production-based data and relatively resilient expenditure data could be explained by inventory adjustment. De-stocking is a common phenomenon during economic downturn. In the years preceding the recent downturn, inventories accumulated greatly because of a long period of economic boom and commodity price inflation. These trends, however, reversed from mid-2008 as the global economy fell into recession while commodity markets weakened substantially. These led to a massive reduction of inventories.
Nevertheless, these developments implied that the weakening of production activity was exaggerated compared to the moderation of underlying demand. Further, they also suggested that once the de-stocking process had ended, industrial production would stabilise, unless the slowing down of demand accelerated. In particular, the potential pickup in underlying demand could lead to re-stocking and faster acceleration of production than the rise in underlying demand.

16 China’s challenges after growth rebound
In the mean time, however, US households have increased their savings ratio. The bottom line is that external demand for Chinese exports may not recover quickly.
This implies an overcapacity problem in Chinese manufacturing sectors. Thus, deflation pressure is not likely to abate in the near term. During the past 10 years, China experienced deflation twice: first, during the Asian financial crisis in 1998–1999 and second, during the mild US recession in 2001–2002. In both cases, deflation was caused by overcapacity problems, which were the result of export difficulties. Should the same causation apply, the deflation pressure will likely be stronger and last longer this time.
While the government is able to lift GDP growth, it is not able to prevent deterioration of the job market. The jobs created by state investment projects are obviously not sufficient to offset the losses in the labour-intensive export sectors. More importantly, labour markets are often lagging indicators during economic cycles. Some provincial governments in Southern China recently adjusted downward the benchmark wage rates. All these are consistent with slowing income growth.
Overcapacity problems also assert downward pressures on corporate profits. China’s total industrial profits are still declining. Significant improvement of industrial profits is not likely until the overcapacity problems go away completely.
In addition to these economic difficulties, the stimulation policies have created some risks.
First, the massive liquidity expansion has already started new rounds of asset price growth, especially in the equity and housing markets. Asset prices running way ahead of the macroeconomic fundamentals are worrisome, given the US experienced similar problems in the years leading to the subprime crisis. Second, massive state-dominated investment activities also cause concerns about investment inefficiency and potential non-performing loans in the banking sector. They may also crowd out private investment, raising questions about growth sustainability even in the near term. And, finally, the stimulus package probably worsened the imbalance problems that the Chinese economy had already prior to
government budget. The remainder would come either from bank loans or investors’ own funds. This is also a reminder that it is important to look beyond fiscal measures when assessing the Chinese government’s ability to support economic growth.
Policy responses by the central bank were equally aggressive. PBOC started to loosen monetary policies soon after the economic momentum began to slow, with the first interest rate cut in September 2008. Most importantly, PBOC’s credit policy shifted from strict control of loan growth in early 2008 to effective encouragement of loan extension in early 2009.
Loan growth really surged from the beginning of 2009. During the first quarter, new loans rose to almost CNY5 trillion, close to the central bank’s target for the whole of 2009. Credit expansion slowed somewhat in April and May but then rose again to CNY1.5 trillion in June alone. Thus, new loans amounted to CNY7.37 trillion during the first half of 2009, which was almost 150 per cent of PBOC’s target for the entire 2009.
Currency appreciation against the US dollar also came to an abrupt halt during the fourth quarter of 2008. Chinese Yuan actually weakened against the US dollar during the fourth quarter, as export weakness intensified and ‘hot money’ outflows took place. Expectations of the offshore non-deliverable forward market shifted from an annual appreciation of 12 per cent at the start of the year to an annual depreciation of 3 per cent at the end of the year.
Challenges ahead
Because of these aggressive policy actions, the Chinese economy quickly stabilised and even rebounded during the first half of 2009. However, recovery of headline growth does not mean that China’s economic difficulties are over. On the contrary, some short-term challenges are likely to remain – at least until the global economy recovers more fully.
Exports will probably not improve any time soon, although the US economy might experience three per cent GDP growth, contributed to by improvement in net exports, re-stocking and pickup of activities in the automobile industry.

Insights Melbourne Economics and Commerce 17
Finally, during the past 30 years, the government has implemented an asymmetric approach in market liberalisation – complete liberalisation of goods markets but significant distortions in factor markets. Factor market distortions depressed production costs and were responsible for structural imbalances such as too much dependence of the economy on external markets and investment. Therefore, liberalising factor markets is a fundamental solution to the imbalance problem and should become a policy priority in the coming decade.
the current crisis. For instance, since 2003, the government has been concerned about very high share of investment in GDP. This share is likely to be much higher in two years’ time. During the second quarter of 2009, investment contributed 88 per cent of GDP.
Unfinished agenda
It is not my intention in this paper to criticise the policy strategies of the Chinese government. At a time when everybody feared the prospect of facing the worst recession since Great Depression, it was understandable that the authorities undertook whatever measures possible to prevent the economy sliding into such a state. In fact, the Chinese government should be congratulated for maintaining strong growth.
But now that growth has rebounded and will likely stay above eight per cent in the coming year or two, it is time for policymakers to think about the efficiency and sustainability of growth. To this end, I list briefly a few possible policy directions for improving the quality and sustainability of China’s rapid growth.
First, given the growing risks of asset bubbles and even over-stimulation of the economy, it is time for the authorities to consider some policy fine-tuning while maintaining overall policy expansion. Too many state-dominated investment projects, for instance, would not only cause efficiency problems but would also make it hard to exit from such investments, since most investment projects last for many years. If the global economy recovers strongly, there could be a serious risk of overheating the Chinese economy in the short term.
Second, policymakers need to downplay the importance of GDP growth. The real reason the Chinese government insists on achieving 8 per cent growth is to maintain social stability. However, there is a more effective and efficient way of achieving social stability – namely, by providing better social welfare supports. Better economic security may also facilitate long-term rebalancing of the domestic economy by stimulating consumption. It is, therefore, advisable that in future policymaking, the government focuses more on social welfare systems than on investment projects.
Yiping Huang is Professor of Economics at the China Center for Economic Research of the Peking University. He also holds the Rio Tinto Chair in the Chinese Economy, a professorial position in the China Economy and Business Program at the Crawford School of the Australian National University. Until early 2009, he was Managing Director and Chief Asia Economics at Citigroup.
1 Chinese Yuan = 0.174438751 Australian dollars

18 Avoiding the 1930s-style protectionism: Lessons for today

Insights Melbourne Economics and Commerce 19
Overall, the elections of new governments committed to stronger mitigation in the US and Japan, the strengthening of old governments in India and Indonesia, and strong community support for action has prevented a general international retreat on mitigation in the year since the Great Crash.
Response to the Review
The approaches of the Review to the science, and the uncertainty surrounding it, have been influential. The Review accepted the views of mainstream science ‘on a balance of probabilities’. There is a chance that it is wrong. But it is just a chance. To heed instead the views of the small minority of genuine sceptics in the relevant scientific communities would be to hide from reality. It would be imprudent beyond the normal limits of human irrationality.
Substantial support has been generated for the idea put forward in the Review, that Australia’s national interest is in a strong global agreement, with Australia’s part being to reduce emissions entitlements by 25 per cent from 2000 levels by 2020 and 90 per cent by 2050. The Government and Opposition have accepted the Review’s approach to conditional and unconditional targets for 2020. A year ago, the 60 per cent reduction target from 2000 levels by 2050 was seen as a stretch target, but now mainstream discussion is about how far beyond that we have to go.
One year has passed since I released the final draft of the Climate Change Review. In the lead-up to Copenhagen, this is a timely opportunity to reflect on developments in the consideration of this diabolical policy problem and where it is all going now. It is relevant that my final report was presented to the Australian Prime Minister on the morning of the biggest ever points-fall on the New York Stock Exchange. The discussion of the review was set against the back-drop of the Great Crash of 2008 and the recession which followed.
The effects of the Great Crash of 2008
The Great Crash had three effects on the climate change challenge. Firstly, it temporarily and briefly stopped the growth in global emissions, but by an amount that is not material in the sweep of history. Secondly, the unemployed resources – the capital and labour which were a consequence of the great recession – lowered the cost of investment in structural change. It made it a relatively cheap time to invest in new technologies. Many countries including the US and China made a major place for investment in emissions reducing structural change in their stimulus packages and the total effect of this on the world scale was considerable. Thirdly, the political economy of mitigation became more difficult. Because it is a time of rising unemployment globally, demands by established industries for support against structural change are on the rise.
one year after the garnaut climate change review
While the ETS as proposed by the government has many weaknesses, it is likely that changes to facilitate support in the Australian Senate
would exacerbate rather than ameliorate these weaknesses
This essay is adapted from a public lecture given at the Australian National University on 14 September 2009. For the background notes and podcast of this lecture, visit www.rossgarnaut.com.au
by ross garnaut

20 One year after the Garnaut Climate Change Review
mitigation, has led to arbitrary distribution, probably to over-allocation on average. It has led further to the absence of an expectation of, or process for, early phasing out as others move to stronger mitigation and to the ugliest ‘money politics’ we have seen for a generation. It is a pity that there has been so much focus on what are essentially transitional arrangements. We would have a more fruitful discussion if we focused on how the mitigation system would work once an effective global agreement was in place with all major economies taking part.
There has been relatively little fiscal allocation for innovation in low-emissions technologies. The pre-emption of permit revenue for other uses is one of the reasons why. The ambits of the government’s response have focused on carbon capture and storage technologies.
The Prime Minister has indicated willingness to seek a mandate at the next election to tighten old 2050 targets from 60 per cent to a larger reduction. Some environmental groups have wanted stronger mitigation with more ambitious goals than 450 parts per million, but I am not sure those views come to grips with the awful reality that any path to anything more ambitious than 450 must first secure 450 parts per million with some overshooting and then go lower. There is a danger that the best has become the enemy of the good, and the friend of the bad.
The Review’s approach to compensation for low-income households has been widely accepted by the government and has not been controversial, but compensation to businesses has followed different lines. The absence of principle in payments to trade-exposed industries for the temporary period in transition to effective global

Insights Melbourne Economics and Commerce 21
exacerbate rather than ameliorate weaknesses. One main exception to what I have just said would be if stronger measures were introduced to support innovation related to bio-sequestration. Another would be if it were possible to introduce explicit arrangements to phase out assistance to trade-exposed industries as other countries strengthen their mitigation efforts. But such good changes are much less likely than exacerbation of distortions in response from business interests. From that perspective, I hope that the ETS can be passed into law quickly and with no further distortion, if necessary through a Joint Sitting of the House of Representatives and the Senate.
Professor Garnaut is Vice-Chancellor’s Fellow and Professorial Fellow at the University of Melbourne. He is also Distinguished Professor at The Australian National University; Chairman, Papua New Guinea Sustainable Development Program Limited; Chairman, International Food Policy Research Institute. He was recently recognised by the award of Distinguished Fellow of the Economic Society of Australia.
Various debating items
The initiative that the Australian government took in global leadership on carbon capture and storage (CCS) is a valuable one. There has been criticism of the support for CCS technologies, mainly from green groups because it is seen as supporting an old industry, the coal industry. CCS research investments are thoroughly justified. The problem is not the support for CCS, but the absence of support for innovation in other technologies in which Australia has comparative advantage in research, a large economic interest, and which are potentially transformative for the global mitigation effort. Bio-sequestration is the most obvious of these.
Much of the debate has not been about the targets, the objectives or the need for mitigation, but has been about the instrument that Australia should use in reducing greenhouse gas emissions. There has been a tendency to compare an ideal carbon tax with a flawed emissions trading scheme (ETS). In truth, the political economy of implementing a clean carbon tax would be as difficult as a clean ETS. One senior business figure who favours a carbon tax has said to me that there is much controversy about giving free permits to favoured businesses, and it would be much more straightforward to give special support for a favoured industry under a carbon tax. Under the traditions of the Australian tax system, he said, if you want to favour some industry you just exempt it from the tax and people do not notice it very much.
The international regime proposed by the Review has held up well to the international discussion. There has been a fair bit of discussion of it in India, China and Indonesia, and this is to a considerable extent focused on the date at which convergence to equal per capita entitlements should occur. It is also focused on the parameters of support of developed countries for new technologies and adaptation. Further, there is growing acceptance in China that the Review’s formula for Chinese participation in a global regime is consistent with attainable Chinese policy objectives.
While the ETS as proposed by the government has many weaknesses, it is likely that changes to facilitate support in the Australian Senate would

Article heading here22

Insights Melbourne Economics and Commerce 23
Thus, when we see unemployment, the price of labour must be too high.
What is the price of labour? Wages are the key component. However, in economies that experience variability in overall prices, it is important to keep in mind that it is real wages that matter: wages divided by prices. If we let W denote wages, in dollar terms, and P denote a price index, then the real wage is W/P. Thus, according to the standard model, if we see unemployment, it must mean that W/P is too high.
What, then, would reduce unemployment? According to this view, the problem can be solved by simply allowing the real wage W/P to fall, back to its equilibrium value. There are two channels through which this might occur: a fall in W or a rise in P. The relative importance of these two channels has been hotly debated by ‘classical’ and ‘Keynesian’ economists. In the ‘classical’ view, unemployment will naturally be reduced by a fall in the money wage W. The policy prescription, then, when faced with unemployment, is to simply wait for W to adjust downwards – which will inevitably occur, at least in the long run.
Keynes’ most famous quotation is, of course: ‘in the long run we are all dead.’ In the context of the labour market, this quotation implies that it may take a long time before W adjusts to bring the real wage back down to its equilibrium level. Money wages can be ‘sticky’ downwards for a variety of
Background
Unemployment has been one of the key issues in economics as a discipline and a central preoccupation of macroeconomics as a field. Indeed, many would argue that John Maynard Keynes (1936) invented macroeconomics to explain the soaring unemployment rates of the Great Depression. In this lecture, I’ll review what I see as the main developments in the theory of unemployment, with a focus on modern theoretical developments and, in particular, ‘search-theoretic’ explanations. The aim is to identify what we have learned, and what remains to be explained.
Traditional explanations for unemployment
When seeking explanations for almost anything, an economist’s first instinct is to think of supply and demand. Generically, for any good that is for sale, the quantity supplied increases with the price, and the quantity demanded decreases. The equilibrium price occurs where the demand and supply curves intersect. If the price is too high, then quantity supplied exceeds the quantity demanded, and the price falls towards the equilibrium price. Similarly, if the price is too low, then the quantity demanded exceeds the quantity supplied, and the price rises towards the equilibrium price. Applying this to the market for labour, unemployment is interpreted as a situation where the supply of labour exceeds its demand.
search for a theory for unemployment
The advantage of search theory is that it explicitly takes into account the frictions and the uncertainty that agents in the labour market face, and it
allows us to understand unemployment as an equilibrium phenomenon
A condensed version of his Inaugural Lecture given at the University of Melbourne on 2 June 2009. The paper with full references to authors quoted can be found on the Insights website at http://insights.unimelb.edu.au
by ian king

24
has its origins in the engineering literature, and early applications in economics were relatively straightforward adaptations – with physical variables reinterpreted as economic variables. Over the past few decades, though, search theory in economics has developed significantly so that several branches exist today.
Sequential search
The first branch of search theory in economics, introduced by McCall (1970) and Mortensen (1970), followed the engineering approach of Wald (1950) and is known as ‘sequential search’. Here, each worker faces a set of possible job opportunities (vacancies) and knows properties about the distribution of wages available but does not know the specific wages available at individual vacancies. In order to find out the wages available at particular vacancies, the worker must visit the firm itself. This has a time cost: each visit takes one time period. The optimal strategy for a worker in this setting involves an ‘optimal stopping rule’: keep sampling (i.e. visiting firms) until she encounters a firm that is offering a wage above a certain reservation value – known as the ‘reservation wage’. Once the worker is offered a wage above this value, the optimal rule says that she should accept that offer, and stop searching.
This branch of search theory has enjoyed a long history, and is still used today for modelling unemployment. It suffers, however, from a key criticism that was identified quite early on. The framework assumes that firms simply offer a different distribution of wages. In fact, as Rothschild (1973) pointed out, firm decisions are not modelled at all in this setting. Moreover, Diamond (1971) made the point that, if we try modelling firms’ decisions in this setting, it becomes clear that firms would certainly not offer different wages. In fact, each firm would offer only the reservation wage. In that case, the entire distribution of wages degenerates down to only one wage, and no search would occur. This criticism has been a key driving force in the development of search theory ever since.
Equilibrium search
‘Equilibrium search’ originated in the work of Lucas and Prescott (1974). Here, the labour market is split up into a large number of distinct submarkets.
reasons, and high levels of unemployment can therefore persist. In the Keynesian view, the government can fix the problem by somehow increasing P, rather than waiting for W to fall. P is the price of goods, which is determined in the goods market. This can be accomplished through aggregate demand management: either through expansionary fiscal or monetary policy, P will rise, W/P will fall, and full employment can be restored. The influence of Keynes’ ideas was so profound that, for several decades, further developments in the theory of unemployment were mostly confined to answering the question: ‘Why are wages sticky?’
Some inconvenient truths
These theories shed some light on unemployment, but they share some basic criticisms that reach to the heart of the basic supply-and-demand paradigm upon which their foundations lie. First and foremost, data on job vacancies has become available in recent years, and one of the key lessons from this data is that significant vacancy rates and unemployment rates can exist simultaneously. This is a problem for the standard model because, according to that model, unemployment is a symptom of W/P being too high, whereas unfilled vacancies are a symptom of W/P being too low. How can W/P be both too high and too low at the same time?
Secondly, data on wage dispersion has shown that significant dispersion exists, and has been growing over time – even for workers that, according to the data, share the same characteristics. The basic model predicts that there will be one wage (whether or not it is the equilibrium wage) in the market for each type of worker.
Clearly, a complete understanding of the causes of unemployment would require some explanation of these two basic facts. Search theory has risen, at least in part, to meet this challenge.
Search to the rescue
The basic idea in search theory is that workers actively search for jobs and/or firms actively search for workers, in an environment with uncertainty. This uncertainty can lead to the co-existence of both vacancies and unemployed workers and is consistent with wage dispersion. Search theory
Search for a theory for unemployment

Insights Melbourne Economics and Commerce 25
as unemployment: it implies that there will be more unemployment in booms than in recessions! However, Jovanovic also proposed a fix-up: if workers have access to unemployment insurance, then some workers in low productivity locations will choose to ‘rest’ in their existing locations, waiting for local conditions to improve, while others will move. This, then, means that there are, conceptually, two types of unemployment in the model: ‘search unemployment’ and ‘rest unemployment’. Jovanovic shows that rest unemployment is countercyclical and, under certain conditions, total unemployment is also countercyclical in this model. Jovanovic’s original model allowed for only one worker per location, but similar results were found in models with competitive labour markets in each location (King (1990), Gouge and King (1997)).
In King and Sweetman (2002), we followed up the interpretation of each location as a profession, and considered the following question: is human capital re-tooling procyclical, as the theory implies? To answer this, we examined a data set which tracks the reasons for job separations, over several business cycles. One of the 13 possible reasons listed for job separations is ‘return to school’. We considered this series for workers who were over the age of 25 (to rule out summer jobs) and found that it was profoundly procyclical – with approximately double the number of workers choosing to go back to school in booms rather than in recessions.
Workers can participate in only one market at any time, but can choose to move from one market to another – with a cost of one time period. Lucas and Prescott interpret this movement as unemployment. In this setting, each location, with its own labour market, has competitive firms that face random shocks to their product demands – which imply random movements of the labour demand curves. In the absence of any aggregate uncertainty, in the steady state, in each time period a constant fraction of workers choose to move (i.e. be unemployed).
Lucas and Prescott left open the precise interpretation of what these locations would be. The most obvious interpretation is geography: physical locations such as cities or states. Another interpretation – which generated significant empirical investigation spearheaded by Lilien (1982) – is that each location represents a sector. (Thus, these are sometimes known as ‘sectoral reallocation’ models.) Yet another interpretation, one that I prefer myself, is that they represent professions. The common theme is that movement from one location to another is possible, but costly, for workers, and each location has uncertain productivity in the future.
Jovanovic (1987) pointed out a key criticism of this approach. If aggregate shocks (i.e. business cycles) are introduced into this setting, then worker movement turns out to be procyclical. This is problematic if this movement is interpreted

26 Search for a theory for unemployment
analysing the economics of the search and matching process itself – leaving it as an exogenous process – and simply examines its implications.
Directed search
Directed search picks up exactly on this point. Here, workers and firms are modelled as being fully aware of each other’s location, and of the wages available, but are uncoordinated in the sense that, when they choose who to approach, they are unaware of how many others are making the same choice. This can lead to situations where one vacancy may attract several workers, or vice versa. This congestion takes time to sort out and, with separation occurring at the other end, leads to both unemployed workers and unfilled vacancies in the steady state. In the tradition of modern game theory, this is typically modelled as a game, and the focus is on the mixed strategy equilibrium, where people choose probabilities of who to approach. This generates an equilibrium matching process which is very similar in nature to the matching function used in the approach described above, but which now embodies the conscious decisions of workers and firms.
This basic idea has been modelled in different ways. In Julien, Kennes, and King (2000), we modelled it with workers selling their labour, and firms choosing which workers to approach. In this setting, a worker may find that no-one approaches him, or one firm, or many – depending on the probabilities chosen by the firms, and the actual realisations. The wages paid to workers, in our framework, reflect how many firms approach the worker: effectively, the worker conducts an auction, with the highest bidder winning the right to employ the worker. If only one firm approaches the worker, then the wage is low: reflecting only the worker’s outside options. However, if more than one firm approaches the worker, then the worker receives a premium that reflects the cost, to the firm, of waiting another period to hire a worker. This, therefore, induces wage dispersion in equilibrium.
Alternatively, Burdett, Shi, and Wright (2001) model directed search by having firms sell jobs to workers, where workers choose which firms to approach. In this setting, the firm may find different numbers of workers approaching, but always pay the same wage – no matter how many workers approach.1 In this case, no wage dispersion occurs in equilibrium.
This approach to search certainly does have its advantages, but it does suffer from a major weakness: in all of these models, while workers can move, firms cannot. In fact, more generally, capital cannot move across locations in these models. This flies in the face of the reality of the world we live in, where capital mobility is a key feature. Incorporating capital decisions into this type of model is possible in principle but, so far, impossible in practice – due to the extreme technical complexity of these models. Introducing capital decisions, in effect, would require the fusion of two classic models developed by Lucas and Prescott: the equilibrium search model described above with the ‘investment under uncertainty’ model in Lucas and Prescott (1971). Despite the obvious appeal of taking this on, no-one has managed it yet.
Matching function search
Perhaps the simplest way to model the search process is to regard it as a technological, rather than economic one. This is the approach explored in papers by Diamond (1982), Mortensen (1982), and Pissarides (1985). In this setting, vacant jobs and unemployed workers are thought of as inputs to a technology which generates matches as its output. Workers and vacancies meet randomly and bilaterally (i.e. each vacancy will meet, at most, one worker, and vice versa), and then bargain over wages. Once again, job matches are also separated according to another random process and, in the steady state, the labour market experiences both unemployed workers and unfilled vacancies.
Arguably, this has become the dominant approach used to model unemployment in macroeconomics today. However, this approach does suffer from problems that arise from the purely technological nature of the matching process. First, due to the fact that prices (i.e. wages) play no role in the assignment of workers to vacancies, models of this sort have an inherent inefficiency built in. The equilibria of these models are generically inefficient, with efficiency only being obtained under miraculous circumstances when parameter values happen to be just right – the ‘Hosios rule’ (Hosios (1990)). Moreover, from the point of view of economic theory, this approach is somewhat disappointing because it abandons the project of

Insights Melbourne Economics and Commerce 27
An assessment
Search has been used as a theory of unemployment for almost 40 years now. The advantage of search theory is that it explicitly takes into account the frictions and the uncertainty that agents in the labour market face, and it allows us to understand unemployment as an equilibrium phenomenon – rather than as a product of wages that, for some reason, are slow to fall. It can easily explain the co-existence of unemployed workers and unfilled vacancies, and provides us with some guidance about the efficiency of this process, and what the relevant trade-offs are from a policy perspective. From this point of view, search theory can be seen as having been quite successful.
Theoretically, with the recent development of search-theoretic models of the money market, it is now possible to build models with both unemployment and inflation as equilibrium phenomena (Berentsen, Menzio, and Wright (2008)). This allows for analysis of equilibrium Phillips curves, with solid microeconomic foundations. While current models of this sort allow for only random matching search, monetary models with directed search do exist (Julien, Kennes, and King (2008); Dutu, Julien, and King (2009)) and there is good reason to hope that directed search can shed light on these important macroeconomic issues. Despite its history, much work remains to be done in search theory.
Fundamentally, search theory is an expression of how to proceed optimally under circumstances that involve uncertainty. As Professor Nilss Olekalns mentioned in his inaugural lecture (Olekalns (2008)), for better or for worse, this is an inherent feature of the world we live in.
Professor Ian King is Professor of Economics and Director of the Centre for Macroeconomics and the University of Melbourne.
1 See Shimer (1999) for an alternative approach, where firms auction off jobs.
In both cases, however, a fundamental trade-off exists for individuals when choosing who to approach: the person that offers the highest payoff will also be approached by the most people, so the probability of matching with that person is (relatively) small. If all sellers are identical, this leads to an outcome where all buyers assign the same probability to approaching each seller. However, if sellers are heterogeneous (i.e. some sellers have higher quality goods than others) then buyers will choose to assign higher probabilities to approaching higher quality sellers. In the context of the two different models described above, this implies that higher productivity workers will attract more firms, and higher productivity jobs will attract more workers.
Also, in both cases, when the labour market is large, the equilibrium outcome will be efficient in the sense that, given the coordination problem, the outcome maximises the expected amount of aggregate output. This makes these models quite different, from a policy perspective, from the matching function models discussed in the previous section. This also raises an interesting policy dilemma in models with heterogeneous workers: as mentioned above, in equilibrium, this implies that firms assign higher probability to approaching more productive workers. This is efficient, but it does not minimise the unemployment rate. Unemployment is minimised when firms assign equal probability to approaching each worker.
Directed search is now a burgeoning literature, with many new avenues being explored, of which I will mention only a few. Albrecht, Gautier, and Vroman (2006) develop a model that effectively synthesises the two directed search models mentioned above. In Julien, Kennes, and King (2006), we extend the basic model by allowing firms to create two different types of jobs: high and low quality ones, with higher quality ones being more expensive to create. Thus, the job mix becomes an endogenous variable, and the dispersion of wages becomes much more pronounced – closer, in calibrated examples, to the dispersion observed in empirical studies. In Julien, Kennes, King, and Mangin (2009), we introduce a public sector into the model, to examine the implications of tax rates, the progressivity of the tax structure, unemployment insurance, and employment subsidies in the basic model.

Article heading here28

Insights Melbourne Economics and Commerce 29
relinquished a degree of control over its business to customers. It transformed from a business that marketed to customers into a business that co-developed products with customers.
The changes for the business were significant. In the space of a few years, the company went from manufacturing a little over 600 products to close to 15,000 products. It was able to significantly reduce the number of in-house designers it had on staff. Manufacturing had to become more nimble and the company needed to build effective platforms for communicating and collaborating with customers – for example, web-based software platforms and aggressive launching of concept stores. However the payoff appears to have been worth it. In the midst of a five per cent drop in total US toy sales last year, Lego’s sales surged 18.7 per cent. It earned $355 million before taxes in 2008, and $178 million in the first half of 2009.
If you love something, set it free
At the heart of Lego’s success was the company’s willingness to explore and leverage the advantages that flow from collaborative relationships. Providing customers with the opportunity to immerse themselves in the product development process leads to a product that more closely meets consumers’ needs. The act of co-creation, by default, leads to greater engagement with the brand. Customers perceive an increase in control and the opportunity to make choices, both of which are intrinsically valued. Intriguingly, customers
Co-creation
The idea that customers can be a valuable source of innovation for firms is catching on in the business community. Many firms, which had previously kept customers at arm’s length, are sensing possibilities from closer collaboration with customers around the processes of idea generation and product development. In effect, these firms are embracing co-creation as a potential source of advantage.
The poster child for successful co-creation is Lego, a business that, despite a proud heritage built since the company was founded in 1932, was until recently progressing rapidly toward bankruptcy. In 2004, Lego made losses of over US$300 million on little over $2 billion in revenue. The future was looking grim for Lego. So it was perhaps out of necessity that Lego pursued quite a radical shift in the way it developed products for its customers. The first step was opening up to its community of more than two million adult users – which had been labeled until then the ‘shadow market’. Next, it formalised relationships with advanced users of its products who became ambassadors for the company, interacting with customers and Lego employees. It encouraged networking amongst its customer base and sought feedback – both positive and negative – from its customers. And perhaps most significantly, it turned to its customers for product designs, sometimes running competitions where the winning designs would be launched onto the market and the customer-designer would earn a royalty for every unit sold. In effect, the firm
organising for co-creation: the service employee-customer interface as a source of competitive advantage
For effective co-creation to occur, the organisation needs to be willing to give up an element control
A condensed version of his Inaugural Lecture delivered at the University of Melbourne on 18 August 2009.
by simon bell

30
help customers become more effective collaborators in the process. Finally, I wanted to understand how frontline service employees felt about a shift toward more collaborative relationships with customers.
After a number of interviews and a survey of over 1,200 high-value clients, I discovered that clients who took a more active part in the creation and delivery of the service were, in fact, significantly more loyal and spent more in brokerage with the firm in the year following the study. Along the way, I also found that the customers who were most effective in co-creating value with the firm were clear on what was expected of them, more motivated to get involved, and more expert investors. I found the notion of customer expertise particularly fascinating as it had enormous implications for the firm in equipping its clients with the necessary skills to become effective co-creators of value.
Educating customers
Lord Turner, the Chairman of the Financial Services Authority in the UK, as recently as June 2009 argued that, ‘It is common sense that people armed with skills … as well as up-to-date information about new products, will be better able to cope with what life throws at them.’ Clearly improving customer expertise is on the agenda of the peak regulator of the financial services industry in the UK. My research showed that expertise was a key determinant of customers’ competence in dealing with financial services firms, which lends support to Lord Turner’s view. Again, however, we observe relatively few proactive attempts by financial services firms to educate their customers, which I suspect is due to what Theodore Levitt called the ‘paradox of customer education’. Customer education, while at first drawing customers closer to the organisation, may paradoxically equip them to leave as their level of skill enables them to switch freely between competitors. At the extreme, expert customers may drop out of the market entirely, choosing to produce the service themselves, for example, use e-Trade or Commsec instead of a full-service broker.
My goal in a second study was to establish whether the customer-keeping benefits of educating clients
are also more tolerant of product failures – as co-developers of the product, they must shoulder some of the burden when things go wrong. All of these factors lead to stronger, more patient relationships between the firm and its customers and increased innovation. The only catch is that firms have to learn to give up control.
Giving up control is more difficult that it appears. Many businesses claim to be engaging in co-creation when the reality is that the customer involvement is staged, similar to Disneyland’s theatrical service offering to its customers – or ‘guests’, as they are known. Further, co-creation is not a simple customisation of what the firm already provides, nor is it a straight transfer or outsourcing of responsibility to clients – a model perfected by IKEA. Co-creation requires the genuine involvement and collaboration with customers where the outputs are, to a large degree, unknown and the processes by which these are achieved are continually evolving.
A spotlight on the services context
I was intrigued by the possibility of organising professional services firms around a co-creation model. The services context seemed to be perfect for co-creation. First, services are delivered face-to-face where there is plenty of scope for customer involvement. Second, the variability of services allows for real-time adaptation and customisation. Third, the face-to-face context often provides the consumer with a higher degree of visibility into the production process than is possible in manufacturing industries. Yet professional service firms have been very slow to embrace this idea. They tend to be reluctant to involve the customer anymore than is absolutely necessary. Indeed, the prevailing view tends to be that customer involvement is something that should be ‘managed away’ rather than actively encouraged. There is, above all, an ideology of ‘expertness’ in most service firms with practitioners who are generally sceptical of the customer’s ability to make a meaningful contribution to the service.
With this in mind I approached a large stock broking firm in Melbourne to test the idea that co-creation could lead to better business performance. I was also intrigued to discover how the firm could
Organising for co-creation: The service employee-customer interface as a source of competitive advantage

Insights Melbourne Economics and Commerce 31
piece in the puzzle was to understand what kind of support those responsible for customer education – namely, frontline service employees – needed to be able to achieve their objectives. Customer perceptions of value in a services context are determined at the employee-customer interface. A recent study in the retail sector showed that while 73 per cent of consumers attribute their best retail experience to store employees, some 81 per cent of consumers attribute their worst retail experience to store employees. Frontline service employees bear a great deal of responsibility when it comes to creating satisfied customers, and the same can be said for educating customers and involving them in co-creation.
In a study of over 400 service employees across 120 stores within a large Australian retailer, I sought to understand where employees looked for support when dealing with difficult customers. I found that role conflict arises when individuals are sandwiched between the expectations of two important stakeholders – the organisation, represented by
were outweighed by the risks of losing more expert clients as Levitt had speculated. Working closely with the same stock broking firm, I discovered that the effect of educating customers was, on balance, positive. I found that clients developed both firm-specific and market-related knowledge; the former leading to an increase in loyalty while the latter – as Levitt predicted – led to a decrease in loyalty. But I also found that educating customers was seen as a valuable augmentation to the service, which had customer-keeping benefits. Educating customers, at least for this particular firm, was good for business performance.
Frontline service employees: the meat in the sandwich
To this point, I had found that co-creation led to greater customer loyalty and that customers with more expertise were better co-creators of value, underscoring the need for client education. Further, I found that educating customers carried little risk of driving customers away. The final

32
What does all this mean for the firm?
It appears that for effective co-creation to occur, the organisation needs to be willing to give up an element of control. This can be uncomfortable for many firms and for the employees charged with delivering on the co-creation promise. An important question, therefore, is how do we help employees deliver on the education and co-creation promise?
There are three key things firms can influence. First, managers must focus on improving the
store management, and the customer. Employees turned to their co-workers for support when the organisational promise – that customer oriented behaviours will lead to customer satisfaction – was not met; namely, when customers complained despite employees’ best efforts. In other words, there are unintended consequences of internal marketing. Organisations’ continual emphasis on customer sovereignty actually sets employees up for a greater fall when customers, on occasions, disappoint the employee.
Organising for co-creation: The service employee-customer interface as a source of competitive advantage

Insights Melbourne Economics and Commerce 33
Where to from here?
While I have found preliminary evidence for the value of a co-creation business model to professional services firms, clearly more work needs to be done to prove the concept across a broader range of industries and customer types. Naturally, there will be some boundary conditions that I hope future studies will help to clarify. A co-creation model, and the lack of control that it entails, has potential legal implications, for example, intellectual property or potential for misrepresentation, which should not be underestimated. Further, the notion of giving up control is antithetical to the logic of brand management. These are tensions that further research will need to resolve. Nonetheless, I believe there has been a fundamental shift in the way firms innovate and relate to customers. Those firms still maintaining arms-length relationships with customers will, in my opinion, be ill-equipped to compete in the market place in coming years.
Professor Simon Bell is Professor of Marketing in the Department of Management and Marketing at the University of Melbourne.
skills of frontline service employees. The norm in recent years has been for service organisations to pursue standardisation of service which allows them to hire less skilled employees at lower wages – the McDonalds model. Co-creation, however, cannot work with low skilled service employees. Recruitment of capable individuals and ongoing training is therefore paramount. Second, employees should be provided with greater behavioral latitude in the workplace. The inevitable unpredictability that results from co-creation requires that service employees have sufficient flexibility and discretion to be able to respond to changing circumstances. Third, firms must revisit the way employees are rewarded. It is not unusual for call centre service staff to be rewarded on the basis of the number of calls answered per hour. Retail employees are often given incentives based on the dollar value of sales. There are no incentives in these reward structures requiring the employee to sit with a customer and work through their concerns, generate new ideas, and build a solution that better meets their needs. All this takes time and considerable effort. The importance of appropriately aligned rewards is essential for co-creation. I am often reminded of Upton Sinclair’s well-known saying, ‘It is difficult to get a man to understand something when his salary depends on his not understanding it.’
For the firm itself, co-creation means working toward a more porous organisational boundary. We need to pull back the curtain and let the customer see inside the organisation. Only then will both the employee and the customer understand what is actually possible on the co-creation front. Firms also need to provide the tools and platforms for helping and collaborating with customers. Dell provides an easy-to-use, engaging and flexible web interface that allows the customer to not only build a computer to their own specifications, but also reach other customers through blogs and chat-rooms – which can lead to further innovation. Finally, firms must invest in their operations and supply chain to achieve the kind of operational flexibility that allows them to make small quantities of different products without additional cost.

Article heading here34

Insights Melbourne Economics and Commerce 35
However, when one looks at the demands placed on the future labour market, not everything looks good. In the last decades, the economic global goalposts have been shifting continually, threatening Australia’s productivity and standard of living. It is also clear that, notwithstanding the interlude caused by the recent financial crisis, we are now heading towards a global skills shortage, which could harm Australia – a net skills importer.
Although there have been considerable warnings of skill shortages and under-performance in the past, these went largely unheeded. Economic success in the last decade was bound to increase economic complacency. The benign international economic conditions until 2007, and the considerable cushion provided by Australia’s resources, distorted the way long-run trends were perceived, allowing us to view their consequences in a light that was perhaps too optimistic. There are many examples of this optimism. For example, the negative impact of skill shortages on productivity was often dismissed, perhaps all too readily. The degree to which immigration filled the reported skills gap was not scrutinised as intensely as it deserved. Hindsight suggests that times were too good for negative messages to gain the necessary momentum. Now of course, things are different. In this paper, I focus on the arguments that there are fewer skills at hand than are needed in the Australian labour market, and that the skills that are present are often underutilised in the workplace.
Introduction
This paper focuses on two questions: First, do we have enough skills in the Australian labour market? Second, are we using the skills we have well? Both words – ‘enough’ and ‘well’ – can be interpreted in many ways and lead to different answers, depending on what we expect from the labour market and who we want to compare ourselves with. My thoughts about Australian policy on skills have been shaped by the simple, but far reaching and demanding, assumption that when it comes to building and utilising a skilled workforce, Australia has a long-standing ambition to be up there with the best skilled countries.
Looking back in time, one can argue that Australia has been a success story in building education and skills. Post-school education has been thriving in an institutional context that recognises the need for state intervention but also allows sufficient market freedom for innovation and diversity. In Australia, we can see a university sector that has become very successful in a globally competitive market for students and ideas. Australian universities are clearly amongst the best. Similarly, the vocational education and training (VET) sector has shown comparable successes, in its equally important role in the labour market. These achievements have been supported by a strong school system and a targeted skilled immigration policy. This historically ambitious position is presently matched by the renewed emphasis placed by both Prime Minister Kevin Rudd and Deputy Prime Minister Julia Gillard on policies reinforcing education and training.
a skilled workforce for the futureAustralia needs to produce additional human capital and use existing human capital better. The role of an invigorated vocational education
and training sector is crucial for both tasks.
An edited version of a Melbourne Institute Economics Forum given in Canberra on 19 March 2009 and a Melbourne Institute Public Economics Forum given in Melbourne on 25 March 2009.
by kostas mavromaras

36
When we look at the proportion of university degree graduates in Figure 1, Australia does well, though not as well as either the US or Finland. However, when we look at non-degree intermediate and low qualifications, Australia clearly has the lowest proportion of workers with intermediate qualifications and the highest proportion with low qualifications. We look rather similar to France and the UK with a long tail of low-qualified workers. By contrast, Germany, Finland and the US have a much smaller proportion of workers with low qualifications and a much larger proportion with intermediate qualifications. There are long run structural implications about the type of economic activity that each of these qualification distributions can support and, in my view, Germany, Finland and the US are better poised to retain successful high skill economic activity.
The level of upskilling that would be needed in Australia in order to change the present qualification composition so that Australia resembles more closely the US, Germany or Finland is massive. We would need to target people with low qualifications and upskill some 16 per cent of the total workforce from a low qualifications status to an intermediate qualifications status, which implies upskilling about 60 per cent of all
Do we have enough skills?
In answering this question I do not present any new research findings. Rather, I use the answer to indicate the extent of the problem in order to deal with the second question: are we using our existing skills well? I begin with a very simple OECD statistic in Figure 1 below, that looks at a number of countries and divides the working population by their level of formal qualifications, taking three broad brush categories – high, intermediate and low. There are two caveats to be aware of, but they should not cause undue concern. I will ask the reader to believe the cross-country equivalisation of qualifications carried out by the OECD and to bear with me when I assume that qualifications and skills are one and the same thing. Note that we do not need the perfectly equivalised data for the point I am making, we just need reliably and objectively constructed international data. The OECD data certainly fulfills these requirements. Further, we do not need to believe that qualifications and skills are perfectly correlated, just that they are positively correlated in a way that is similar between countries that are demographically and economically similar. Keeping these two caveats in mind we compare Australia with the US, Finland, France, Germany and the UK.1
A skilled workforce for the future
Figure 1: Working population only (OECD 2006)
100%
90%
80%
70%
60%
50%
40%
30%
20%
10%
0UK AUS FRA GER US FIN
High
Intermediate
Low

Insights Melbourne Economics and Commerce 37
over-education, where the worker has more formal qualifications than the job requires; and over-skilling, where the worker has more skills than the job requires. Most of this research is based on individual records and cross-section time series data that follows the same individuals over time. In the Australian context, we use the HILDA survey data. Here, I will consider almost exclusively results based on the over-skilling measure, because over-skilling is a truer reflection of mismatch than over-education.4
Our main results suggest that there are many mismatched persons in employment and that mismatched workers are worse off than their well-matched counterparts in a number of ways. Mismatched workers receive lower wages and they have higher job mobility – voluntary and involuntary. Mismatches scar workers; present mismatches cause future mismatches – that is, over and above the characteristics that helped generate the present mismatch – giving the workers concerned a bad reputation. Mismatches also lead to lower job satisfaction. One of the more important findings of our research is that most of these mismatched outcomes vary by the education pathway of the worker. We distinguish between higher education degree holders, VET graduates, Year 12 school graduates and those qualified below Year 12.
We find that the prevalence of skills mismatch is the lowest for VET and higher degree graduates – between 9 and 10 per cent; the highest for
workers with low qualifications to intermediate qualifications. This would have to be achieved principally through the VET sector, highlighting the central role of VET. One could argue that all economies including Australia in this example are currently upskilling, and that they do so especially at the labour market entry level, where upskilling is considered to be more cost effective. However, when one looks at the high proportion of labour market entrants with low qualification in Australia – about 20 per cent a year – and when one considers that, in this part of the labour market, qualifications and skills are highly correlated, it becomes clear that we are not keeping up with the best, and that, even if our comparators remain static, we will need a drastic change if we intend to catch up with them in the future.2 As mentioned earlier, for all its seriousness, this conclusion is not news, and is being presented in order to motivate the question regarding skills mismatch and utilisation. Our recent research on skills mismatch in the workplace is informative.
Do we match skills required by jobs and skills offered by workers well?
Clearly, if we find ourselves in the position of not having enough qualifications and skills, as suggested above, we should be trying hard to utilise what we have by matching worker skills supplied with job skills demanded. Our research focuses on job-worker mismatch and suggests that there is room for improvement.3 There are two main measures of mismatch in the literature:

38 A skilled workforce for the future
Our findings suggest that skills mismatch is an important and multifaceted labour market problem. Lower wages of mismatched workers may reflect lower productivity and some form of resource misallocation. They may also reflect transitory search activity or the presence of other compensating positive attributes of a job. Although mismatched workers show higher mobility, they do not show the type of mobility that improves their position in the labour market after they leave a mismatched job. The fact that mismatched workers also enjoy lowest job satisfaction suggests that mismatches are not likely to reflect voluntary skills underutilisation which would explain the lower wages. Put simply, our findings suggest that there is a great deal of skills mismatch in the Australian labour market and that, where it appears, it suggests the possibility of serious productivity losses.
Our research also finds that, as with many negative labour market outcomes, mismatch is a disadvantage
Year 12 graduates – about 18 per cent; and still high and statistically significant, for workers qualified below Year 12. When it comes to the wage penalties suffered by mismatched workers, we find that after controlling for differences in individual characteristics the similarities between degree and VET graduates – namely, that the two groups are least likely to be mismatched – do not apply. Mismatched degree graduates are paid on average a remarkable 24 per cent less than their well-matched counterparts. The corresponding wage penalty is around the 10 and 14 per cent mark for VET graduates and for workers without post-school qualifications respectively. When we examine how job satisfaction may be influenced by skills mismatch, we find that workers without post-school qualifications show the highest loss of job satisfaction when compared with their well-matched counterparts. Degree graduates follow, and VET graduates show the lowest loss of job satisfaction because of mismatch.

Insights Melbourne Economics and Commerce 39
on the labour market to use existing skills better and to reduce skills mismatch. Recent research reveals a number of negative outcomes of mismatch in workplaces, such as lower wages, higher mobility, lower job satisfaction and loss of reputation.
Some clear empirical regularities come out of our findings, the principal one being that labour market outcomes associated with mismatch differ by education pathway. Mismatch harms university graduates most and VET graduates least. The suggestion that VET graduates are the least likely group to be mismatched in their jobs and that those mismatched suffer the least damaging consequences, is an important finding, especially in the wider policy environment of the need for extensive upskilling through VET.
Professor Kostas Mavromaras is Professor of Economics and Director of the National Institute of Labour Studies (NILS) at The Flinders University of South Australia. Prior to this, he was Professorial Fellow and Director of Labour Economics and Social Policy at the Melbourne Institute, University of Melbourne. Professor Mavromaras’ research interests focus on the empirical study of different aspects of human capital, including employment, education, skills, professional labour markets, health and ageing. His papers have been published in many top economics journals, including the Economic Journal, the Journal of Public Economics, the Journal of Human Resources and the Journal of Applied Econometrics.
1 The reader can verify that these arguments look equally strong using other comparator countries.
2 The main difference between qualifications and skills appears amongst older workers who have developed informal skills on the job, but have no commensurate qualifications.
3 The research mentioned has been carried out in collaboration with a number of colleagues, principally Seamus McGuinness, Nigel O’Leary and Peter Sloane; and has benefited by funding from a number of sources including the University of Melbourne and the National Centre for Vocational Education Research.
4 We have examined over-education and indeed we are currently working on a measure of combined over-skilling and over-education with promising results.
that can scar the workers who experience it. We find that mismatch is a self-perpetuating labour market state, in that a worker who is presently mismatched is more likely to be mismatched in the future, independent of the causes of their original mismatch status. Being mismatched today implies a higher probability of being mismatched tomorrow! Intuitively put, being mismatched damages the labour market reputation of an individual. This reputation-effect varies with the worker’s education pathway, suggesting that there is both a supply and demand explanation behind it. University graduates who are mismatched suffer the highest reputation mismatch damage. Getting it wrong is very costly for degree holders – they lose in wages and in reputation.
Interestingly, while the reputation mismatch loss is also present for workers without any post-school qualifications, it is absent for VET graduates. There could be a number of competing explanations for these specific differences in reputation outcomes, but we have no data to test them, principally because we know very little about the employers’ characteristics in mismatch situations. If I were to pick on one promising research direction to complement the evidence on which most related literature is based, I would suggest investigating the role of employers and labour demand on skills mismatch.
Conclusion
I started by asking whether we have enough skills in Australia in order to retain our relative position in the global economy. With severe skills shortages forecast, I argued that upskilling the Australian workforce is necessary. OECD data suggests that a concerted effort will have to be made in Australia to move people from the low qualifications and skills category into the intermediate category. There will be intense demands on the VET system to create new skills, as VET is the natural route for low to intermediate upskilling. Considerable resources and reform will be necessary. My second question was whether we utilise the skills we have by matching workers and jobs sufficiently. Research based on the HILDA data suggests that there is considerable mismatch of existing skills in Australian workplaces – a wasteful outcome. Expected skill shortages will place intense pressure

Article heading here40

Insights Melbourne Economics and Commerce 41
representing around one in nine people aged 15–64 years. The majority are enrolled part-time and around 55 per cent are aged 25 years and over. It covers qualifications that range from basic (certificate I and II) to diplomas and advanced diplomas (Table 1) and all fields of study (Table 2), although the numbers in the natural and physical sciences are small.
Table 1: Total VET students by qualification, 2007
AQF* qualifications Students
Diploma or higher 165,965
Certificate IV 188,665
Certificate III 476,785
Certificate II 281,619
Certificate I 100,055
AQF sub-total 1,213,089
Non-AQF qualifications
Other recognised courses 251,097
Non-award courses 87,410
Subject only – no qualification 113,422
Non-AQF sub-total 451,929
Total students 1,665,018
* Australian Qualifications Framework
Source: National VET Provider Collection, 2007
Introduction
Vocational education and training (VET) provides employment related training at the certificate and diploma level, aimed at all occupational groups with the possible exception of professionals – which are largely served by higher education. It is delivered within both an institutional and workplace setting. An important element is the apprenticeship/traineeship that incorporates formal training within an employment relationship.
The aim of this paper is to look at the contribution of VET to the labour market. Three aspects are focused on: the relationship between the training and occupations VET graduates work in; the extent to which the qualified proportion of the workforce has increased (skill deepening) and the link between VET and skills acquisition. The unifying theme of these aspects is that there is no deterministic link between VET and the labour market – skills are not raw materials consumed in a manufacturing process; rather they are akin to capital that has alternative uses. Before examining these aspects, however, I will briefly describe the sector, to show the breadth of its provision.
The breadth of VET
VET is large. In 2007 there were some 1.67 million students enrolled in the public VET system,
the contribution of vetto australia’s skill base
VET is more than a narrow preparation for particular occupations. For the majority of people there is a loose relationship between
their training and their employment.
An edited version of a paper delivered at the Melbourne Institute’s Public Economic Forum on Getting the Skills Australia Needs on 19 March 2009. The full paper will be found in Karmel, Tom (2009) The contribution of VET to Australia’s skills base, published by the National Centre for Vocational Education Research.
by tom karmel

42
Table 3: Qualifications and qualification equivalents completed by total VET students by field of education, 2006
Qualifications Qualification Field of education completed equivalents
Natural and physical sciences 1,387 2,230
Information technology 10,099 13,433
Engineering and related technologies 45,391 80,086
Architecture and building 13,208 26,680
Agriculture, environmental and related studies 11,671 21,904
Health 10,729 14,078
Education 10,880 9,598
Management and commerce 84,275 124,285
Society and culture 55,680 65,129
Creative arts 9,961 15,240
Food, hospitality and personal services 25,846 36,414
Mixed field programmes 15,518 42,759
Total 294,645 451,835
Source: National VET Provider Collection, 2007
Table 4: Apprentice and trainee completions in 12 months ending 30 September 2008, Australia (‘000)
Occupation (ANZSCO) group 2008
Managers and professionals 4.0
Technicians and trade workers 42.7
Community and personal service workers 25.4
Clerical and administrative workers 28.3
Sales workers 19.8
Machinery operators and drivers 16.2
Labourers 13.6
Total (’000) 149.9
Source: National Apprentice and Trainee Collection, December 2008 estimates, unpublished
The numbers in Tables 3 and 4 represent additions to the skills base and have resulted in a substantial increase in the proportion of the workforce with formal qualifications. Table 5 presents the stock of skills for 2006. VET qualifications represent the most important component of post-school qualifications2.
Table 2: Total VET students by course field of education, 2007
Field of Education Students
01 – Natural and physical sciences 5,871
02 – Information technology 36,598
03 – Engineering and related technologies 278,835
04 – Architecture and building 111,947
05 – Agriculture, environmental and related studies 70,554
06 – Health 85,207
07 – Education 51,460
08 – Management and commerce 337,881
09 – Society and culture 161,945
10 – Creative arts 44,062
11 – Food, hospitality and personal services 169,187
12 – Mixed field programmes 198,049
Subject only – no course field of education 113,422
Total 1,665,018
Source: National VET Provider Collection, 2007
These large numbers of students translate into additional skills in the workforce. This can be seen from the flow of qualified people into the workforce each year. Table 3 shows these, but with a small twist. One of the characteristics of VET is that completion rates of full qualifications are relatively low. While this is of policy concern, it needs to be recognised that many students attend VET to obtain particular skills by undertaking particular units or modules – rather than a complete qualification – and these skills do add to the skills base. So in Table 3 we present not only complete qualifications but also the total number of modules and units successfully completed, expressed as ‘qualifications equivalent’. Thus the output of VET is around 50 per cent higher than indicated by the number of completions. Table 4 show the number of apprentice and trainee completions, noting that apprenticeships and traineeships are a very important part of VET and represent around half of all completions.
The contribution of VET to Australia’s skill base

Insights Melbourne Economics and Commerce 43
VET and the labour market
It is a mistake to think that there is a tight and deterministic relationship between VET and the labour market. VET provides skills that can be used in a variety of jobs. Most occupations, with the exception of some professions and the licensed trades, do not require particular qualifications. Similarly, training for an occupation does not imply that the training must be used only in that occupation. Much education, including VET, has a large component of generic education. This lack of a tight link partly reflects the type of society we live in and also because many skills are learned on the job – skills come from both formal training and experience.
Data from the Student Outcome Survey illustrates the lack of a tight match between training and occupations (Table 6).
Table 5: Employed persons by qualification level, 2006
%
Bachelor degree or above 22.0
Advanced diploma or diploma 9.0
Certificate III or IV 18.2
Certificate I or II 1.4
Level inadequately described/not stated(a) 7.4
No-non school qualification/Not applicable(b) 42.1
Total 100.0
Source: Derived from the Australian Bureau of Statistics (ABS) Census of Population and Housing, 2006
Notes:
(a) This category includes certificate not further defined and level inadequately described or not stated.
(b This category also comprises persons who have a qualification that is out of scope of this classification and persons still studying for a first qualification.

44 The contribution of VET to Australia’s skill base
occupations. For example, according to ABS Population Census data, the proportion of managers and administrators with a degree increased from 22 per cent to 32 per cent. Similarly, the proportion of intermediate clerical, sales and service workers with a certificate III/IV increased from 6 per cent to 15 per cent. Overall we saw substantial increases in the proportion of people with a degree or certificate III/IV. The proportion with a diploma was largely unchanged while the proportion with a certificate I/II declined. All these trends reflect an increase in higher-level qualifications, and we see that people with degrees are becoming increasingly valued in a wide range
While the match is high for those completing an apprenticeship in the trades, it is much lower in most fields of study. However, as can be seen from the table, the proportion of VET graduates working in some other occupation reporting that their training is relevant is very substantial, indicating the generic nature of much VET. Overall, the proportion working in ‘non-matched’ jobs who reported their training as useful exceeds the numbers working the same occupation as their training.
Changes in the proportions of people with qualifications also demonstrate that there is no predetermined qualification profile in most
Employed
In same occupation group(b) In different occupation group (as training course) (to training course)
Training was highly or Training was of very little somewhat relevant relevance or not at all to current job relevant to current job
% % %
Intended occupation of training activity(b)
Managers 10.7 54.4 15.6
Professionals 20.7 40.4 21.4
Technicians and trades workers 54.2 21.7 11.2
Community and personal service workers 37.4 22.1 19.3
Clerical and administrative workers 13.5 41.4 17.0
Sales workers 36.3 33.1 13.9
Machinery operators and drivers 22.7 51.9 18.0
Labourers 21.8 38.3 19.5
Training was part of an apprenticeship or traineeship
In a trade occupation course(c) 78.9 10.5 3.9
In a non-trade occupation course 37.6 37.7 11.4
All graduates(d) 30.3 33.8 16.8
Source: NCVER Student Outcomes Survey 2008
Notes: * The estimate has a relative standard error greater than 25 per cent and therefore should be used with caution.
(a) These questions are not asked of students from community education providers. Therefore, the percentage reported represents the proportion of graduates excluding those from community education providers.
(b) Occupation is defined by the Australian and New Zealand Classification of Occupations (ANZSCO 2006). This is an Australian Bureau of Statistics classification that identifies occupations according to their primary purpose. Matching between intended and destination occupation occurs at the ANZSCO sub-major group level.
(c) A trade course has an intended occupation code corresponding to ‘Technicians and Trades Workers’.
(d) Totals exclude students from community education providers (for whom occupation after training is not captured). Also excluded are a small number of students with an unknown intended ANZSCO.
Table 6: Occupational destination and training relevance for graduates(a) by various training characteristics, 2008

Insights Melbourne Economics and Commerce 45
Table 7: Weekly wages for full-time wage and salary earners, by level and field of qualification, 2003–2004, relative to Year 12.
Relative to Year 12
Year 11 or below 0.90
Year 12 1.00
Certificate I/II
Science, IT, engineering 0.93
Architecture, building, agriculture 0.87
Health, education, society and culture, creative arts 0.94
Management and commerce 0.96
Food, hospitality, personal services 1.01
Certificate III/IV
Science, IT, engineering 1.04
Architecture and building 1.14
Agriculture 0.82
Health 0.97
Education, society and culture, creative arts 0.94
Management and commerce 1.04
Food, hospitality, personal services 0.99
Diplomas and degrees
Science 1.40
Information technology 1.58
Engineering 1.28
Architecture and building 1.03
Agriculture 1.03
Health 1.42
Education 1.34
Management and commerce 1.36
Society and culture, food, hospitality and personal services 1.31
Creative arts 1.10
Notes: Calculated for a male, age 30, working 40 hours (for the hourly rate). The relativity to Year 12 is not affected by this assumption.
Source: Derived from modelling by the author, based on the unit record file, ABS Household Expenditure Survey and Survey of Income and Housing, 2003–04.
of occupations, including those that are outside the traditional ‘degree’ jobs. The one exception is the trades, where there has been relatively little change in qualification levels.
While I am arguing that there is no predetermined mix of qualifications for particular occupations, I am not arguing that there is no value in qualifications. At an aggregate level, there clearly is, as can be seen from Table 7. Here, those with diplomas and degrees are, on the whole, earning the most. There is, however, considerable variation by field of study. For example, we see that a certificate III or IV in architecture and building (covering many of the traditional trades) has a very healthy wage premium compared to Year 12, while the same cannot be said for these level certificates in agriculture, health, education, society and the creative arts.
To some extent the return to qualifications will reflect the types of occupations individuals obtain, and we see that the variation is less at the occupational level (Table 8). There are still pay-offs to certain qualifications but it is not the case that degree holders always get paid more than others within an occupation. This, no doubt, reflects the relative returns to generic and technical education. Thus degrees and diplomas are rewarded in the clerical and service occupations, but not in sales, transport and labouring occupations. By contrast, certificates III and IV appear to have a premium in sales, transport and labouring occupations, while certificates I and II have virtually no wage premium.
However, we observe a considerable return to experience, even in lower skilled occupations, reflecting skills learnt on the job (Table 9). The point is that skills in many occupations can be learnt on the job. Formal qualifications may well be useful but are not necessary in many jobs.

The contribution of VET to Australia’s skill base
Table 9: Percentage increase in weekly wages due to 10 years’ experience by selected occupations, 2003–2004
5 Advanced Clerical and Service Workers 17.6
61+81 Clerical Workers 25.5
62+82 Sales Workers 36.2
63+83 Service Workers 17.0
71+72 Machine and Plant Operators 19.5
73+79 Transport Workers 26.1
9 Labourers and Related Workers 34.5
Source: Derived from modelling by the author, based on the unit record file, ABS Household Expenditure Survey and Survey of Income and Housing, 2003–04.
Note: Compares expected earning of a 30 year old male with a 20 year old.
Conclusion
While vocational education and training is clearly instrumental in nature, it is a mistake to think that there is a tight deterministic link between it and the labour market. VET is wide in scope and for the majority of people there is a loose relationship between their training and their employment. That is, it is more than a narrow preparation for a particular occupation. In the same vein, the labour market is not static, and there is no predetermined proportion of people in particular occupations who require a VET qualification. We have seen significant increases in the number of people with qualifications across many occupations, and people with degrees moving into occupations not traditionally associated with university training. Finally, it needs to remembered that while formal training – whether VET or university – is important to skills formation, so is on-the-job training. In many cases, there is no substitute for experience.
Dr Tom Karmel is the Managing Director of the National Centre for Vocational Education Research (NCVER).
Table 8: Weekly wages for full-time wage and salary earners, by qualification level and occupation, 2003–2004
5 Advanced Clerical and Service Workers Left school before year 12 0.95Year 12 1.00Certificate I/II 0.73Certificate III/IV 1.02Diploma or degree 1.1361+81 Clerical Workers Left school before year 12 0.97Year 12 1.00Certificate I/II 0.99Certificate III/IV 0.98Diploma or degree 1.1262+82 Sales Workers Left school before year 12 1.03Year 12 1.00Certificate I/II 0.96Certificate III/IV 1.07Diploma or degree 0.9663+83 Service Workers Left school before year 12 0.98Year 12 1.00Certificate I/II 1.04Certificate III/IV 1.18Diploma or degree 1.2671+72 Machine and Plant Operators Left school before year 12 0.93Year 12 1.00Certificate I/II 0.88Certificate III/IV 1.02Diploma or degree 0.9373+79 Transport Workers Left school before year 12 0.95Year 12 1.00Certificate I/II 0.95Certificate III/IV 1.08Diploma or degree 0.999 Labourers and Related Workers Left school before year 12 0.92Year 12 1.00Certificate I/II 1.09Certificate III/IV 1.12Diploma or degree 0.96
Source: Derived from modelling by the author, based on the unit record file, ABS Household Expenditure Survey and Survey of Income and Housing, 2003–04.
46

Insights Melbourne Economics and Commerce 47
an evidence-based approach to developing your careerToday’s working life is quite different from that
of our parents and grandparents. We live in more demanding and less predictable times.
A condensed version of an Alumni Refresher Lecture delivered at the University of Melbourne on16 September 2009. The paper with full references to authors quoted can be found on the Insights website at http://insights.unimelb.edu.au
by leisa d sargent
Social capital – creating value
Social capital is any aspect of the social structure that creates value and facilitates the actions of the individuals within that social structure. Social capital is created when the relations among people change in ways that facilitate instrumental action (Coleman, 1990). Two strategies to build social capital revolve around relationships – mentoring and social networks. Often, careers are viewed as individual projects resulting in individual rewards. However, when reflecting on our careers, what is often seen is not a succession of jobs but a succession of people who we have worked with and who made a big difference, for good or bad (Inkson, 2007).
Consider this story, which highlights how important relationships are in shaping career opportunities. Recently, the Faculty of Economics and Commerce received a very generous one million dollar donation from one of our alumni. It will be used to endow a scholarship for B. Commerce students in need. The donor’s own undergraduate experience was a positive one and he recalls an important introduction made for him by a former Dean to a partner of a leading stock broking firm. In remembering this support, he now wants to provide opportunities for future B. Commerce students.
Are career jobs dead?
Wharton Business Professor Peter Capelli (1999) wrote a provocative piece a decade ago arguing that ‘career jobs are dead’. While I think his proposition is exaggerated, we do work in a more volatile and less stable industrial and economic landscape. We rely less on linear trajectories – where individuals advance up the corporate ladder within a single firm over the course of their lives, and where one can entrust one’s career destiny to a single organisation. Increasingly, workers are experiencing involuntary job loss, career interruptions, and less mobility within organisations. People need to be more adaptable, not be bound to a single organisation and think more carefully about sequences of experiences across both organisations and jobs. What does it mean for you to be part of this new career landscape? It means you have greater responsibility over managing your career capital, and assessing the specificity of your human and social capital – and their transferability.
The primary aim of this paper is to consider what is meant by human and social capital, examine how they develop and what contribution they make to career success – namely, salary, promotion and intrinsic career satisfaction.
47Insights Melbourne Economics and Commerce
alumni refresher lecture series

Article heading here48 An evidence-based approach to developing your career
that different network characteristics were related to different work-related outcomes (Morrison, 2002). For example, informational networks that were large and varied were positively related to greater organisational knowledge. Similarly large, strong, dense informational networks that consisted of higher status contacts were related to being better at doing your job. Strong and large friendship networks led to great social integration at work; and strong, while varied, friendship networks with higher status contacts were positively associated with higher levels of organisational commitment.
Human capital
Human capital refers to the knowledge, skills and competencies held by individuals and accumulated through their education, training and professional experiences (Becker, 1962). Specific, transferable human capital commands a price premium in the executive labour market, especially when job change is to a similar firm (Sturman et al, 2008).
In building human capital, key strategies relate to education, undertaking training and development, and engaging in developmental challenges such as acting positions, secondments, high profile project work that is new and novel, organisational tenure and working longer hours. Developing human capital requires an assessment of the extent to which to engage in firm-specific knowledge accumulation, such as in-house leadership programs, versus more generic types of knowledge accumulation, such as an MBA.
Progressing your career
Recent research evidence on how to progress your own career suggests that you will need to develop both your human capital and your social capital to achieve career success. The term career success means different things to different people. Here, I use it to refer to both extrinsic success, such as salary and promotions, as well as intrinsic career success, the personal sense of satisfaction with your career. How you view success will influence the types of career strategies you undertake to develop your career.
To progress your career, three sets of career capital are relevant. The first two are human and social
Mentoring
Mentoring is a one-to-one relationship with someone who is more senior to you. It generally has two features. First, career-related mentoring relates to sponsorship, visibility and exposure, coaching and feedback, and the provision of developmental assignments that stretch and challenge. It allows you to ‘learn the ropes’ and encourages promotion. Second, psycho-social support is where the mentor provides wise counsel, acceptance, confirmation and acts as a role model. This kind of support develops self-esteem, self-efficacy and work-based identity (Kram, 1985). Salary growth, promotions and compensation are more strongly and positively associated with career-related mentoring than with psycho-social support; while psycho-social support and career-related mentoring are positively related to career and job satisfaction, and satisfaction with a mentor. Psycho-social support is also positively associated with employee retention (Allen et al, 2004).
Interestingly, formal mentoring programs are nearly as beneficial as informally developed mentoring relationships and are certainly better than not having anything at all (Chao et al, 1992). Being mentored also enhances one’s advancement expectations (Singh et al, 2009), and having a portfolio of mentors may be important in providing different social and know-how needs (de Jansz & Sullivan, 2004). It would be remiss not to mention the benefits of being a mentor – there are relational gains as well as identity validation (Ramaswami & Dreher, 2007).
Social networks
The second strategy for building social capital is through social networks. Networking involves reciprocity and is an on-going process, being purpose-built. Building networks is not about schmoozing per se. Networks, such as having social connections with people in different functional areas in organisations as well as having contacts at higher levels, confer benefits because they provide access to information, access to scarce resources and career sponsorship, which is in turn related to positive career outcomes such as salary and promotion (Seibert et al, 2001).
Networks are assessed in a variety of ways. In a study of new recruits, a professional services firm found

Insights Melbourne Economics and Commerce 4949Insights Melbourne Economics and Commerce
capital; while the third I have termed personal characteristics. This category refers to personality, demographic characteristics and IQ. What follows are the key human capital, social capital and personal characteristics that are related to three types of career success – salary, promotion and intrinsic career success – found in a recent meta-analysis (Ng et al, 2005).
Being politically savvy is as important as your educational level in predicting salary. Other human capital factors related to salary are work experience, engaging in training and development, working hours, organisational tenure, willingness to transfer and international experience. Career sponsorship and networking are two career capital factors that also predict salary, while having a higher IQ, being older, extraverted, emotionally stable and proactive are positively related to salary. Interestingly, being agreeable is negatively related to salary, suggesting that kind, gentle, trusting and warm people are less likely to have high salaries. They also may not care (Judd et al, 1999).
A further tangential point is that agreeableness also has been found to be an important predictor in jobs that involve frequent interpersonal interaction such as teamwork (Barrick & Mount, 2005). So all is not lost if you have this attribute.
For promotion up the ranks, valuable human capital factors include engaging in training and development, having international work experience and working longer hours. Similar to salary, career sponsorship and networking are also positively related to promotion, while extraversion, proactivity and emotional stability are all positive predictors of promotion. Extraversion is particularly related to job performance in occupations that are focused on influencing others and gaining power and status (Barrick et al, 2001).
Supervisor support, career sponsorship and networking are strong positive predictors of career satisfaction. This suggests that social relationships are particularly important for career satisfaction. Engaging in training and development, career planning, identifying with the work you do and working longer hours are all human capital factors linked to satisfaction as well. From the perspective of personal characteristics, emotional stability, internal locus of control, proactivity, and
extraversion are also positively associated with being satisfied with one’s career.
One of the consistent findings from these studies is the effect of long work hours on career success. As with most things there are trade offs with long work hours – you may have career success but at what cost? Apparently the negatively spillover effects between work hours and work-life conflict become especially serious at very high levels of work hours. One additional work hour in a jam-packed working week increases work-life conflict exponentially. Furthermore, at very high levels of stress each additional hour of work creates marginally less additional strain and physical health problems (Ng & Feldman, 2008).
We are yet to comprehensively tease out empirically how social capital links to human capital and vice versa. However, theoretically, it appears that social relationships assist us through the knowledge we gain from such relationships and the contacts we make in finding challenging jobs (Ramaswami & Dreher, 2007). Human capital also develops through vicarious learning and direct feedback (role modeling and coaching). This implies that you should make sure you have someone in your working life who provides you with on-the-job coaching and is a positive and effective role model. From a political perspective, mentors and contacts in our networks may also protect and support us, by signalling what is occurring in the organisation in terms of power and politics and providing exposure and visibility to higher-level contacts in the firm. Our relationships at work as well as in developmental assignments allow us to experiment with new roles and posts; and in doing so, allow us to see if we would like to do more of this type of work. This helps us to clarify our values and career trajectories.
Conclusion
It is critical to understand that today’s working life is quite different from that of our parents and grandparents. We live in more demanding and less predictable times. Denise Rousseau is one of the foremost career theorists and she puts it quite succinctly: you can expect ‘a lifetime of employability rather than a lifetime of employment’ (1997, p520).

Article heading here5050 An evidence-based approach to developing your career
This paper sought to provide you with a new framework for thinking about your own career. This includes your social capital – your relationships both at and beyond work, including professional associations, alumni networks, and mentoring relationships; and also your human capital – your political skills, the educational and training investments you make and the developmental challenges you accept at work. Take the opportunity to craft experiments at work and do new projects. Shift connections – develop new contacts, seek out role models and reference groups. And finally make sense of your career – find or create catalysts for change, and use them as occasions to rework your career story (Ibarra, 2002).
Dr Leisa Sargent is Associate Professor in the Department of Management and Marketing at the University of Melbourne

what does economics say about intellectual property?
The issue for the policy maker is: can we craft patent law so it provides the incentive needed for commercialisation while preserving the
best features of the system of open science?
A condensed version of an Alumni Refresher Lecture delivered at the University of Melbourne on 2 September 2009.
by russell thomson and elizabeth webster
Introduction
In the second half of the nineteenth century, a great public debate regarding the merits of intellectual property (IP) laws1 took place.2 Key protagonists, including many of most eminent political economists of the day, essentially argued from one of two basic standpoints. One camp thought patents constituted a state-sanctioned monopoly that should be eliminated, while others regarded them as important tools for encouraging people to invest in new inventions. For a time it appeared that the anti-patent movement would win out, with patent laws even being repealed in Holland in 1869. Ultimately, however, the debate resolved into a victory for the pro-patent camp with a series of national patent laws being passed from the 1870s onwards.
Between the reforms of the late 1800s until the closing decades of the twentieth century, legal analysts dominated the IP policy debate. Rules about the duration of the right, the cost of renewal, examination procedures and the extent of rights have been largely determined by lawyers’ concerns with natural law – moral rights and fair process – and less by economists’ notions of dynamic economic efficiency.
Slowly this has been changing. In the last couple of decades there has been a bourgeoning interest by economists from both academia and government in the efficient function of the patent system. Important themes in the recent economic literature
51Insights Melbourne Economics and Commerce
on IP include: the deleterious consequences of flooding the system with low quality patents, the merits of international IP law harmonisation, the ‘optimal’ inventive step, the role of the IP system in facilitating markets for technology, and the benefits of research exemptions. In this paper we outline an economic perspective on IP policy, and discuss some desirable characteristics of IP policy design suggested by economic analysis. We close with a discussion of one current controversy relating to the provision of research exemptions in patent law.
R&D policy rationale
Economists have long understood that the creation and application of new technology is key to long run economic prosperity. Given that the amount of physical matter in the world is fixed, the only way per capita incomes can keep rising is through either the creation of new knowledge or improvement of workers’ skills. Despite concerns expressed in the nineteenth century that the number of useful inventions would soon ‘run out’, technological stagnation is yet to eventuate.3
The creation of new technology requires investment in research and development (R&D). Unfettered markets will fail to provide socially optimal R&D because it is a public good (being non-rivalrous and having non-excludable properties) and because returns are highly uncertain and long term. Non-rivalness means that, once discovered, the use of a piece of knowledge has no cost to society as one person’s use does not stop another person from

52 What does economics say about intellectual property?
using that knowledge. To maximise well-being of society we should maximise the diffusion of existing knowledge. Technology is also said to be non-excludable in that, in the absence of IP law, it is difficult for firms to prevent others from copying their technology. This inability to exclude others from using their technology undermines firms’ ability to charge a price above marginal cost (zero). Non-excludability therefore reduces the incentive to invest in R&D. Finally, R&D is subject to fundamental uncertainty because it is, by definition, something that is new and distinct from anything that has occurred before. The high level of uncertainty inherent in the innovation process implies private firms may require a rate of return far higher than the social discount rate.4 Problems associated with uncertainty are amplified where time horizons are very long – as is often the case in R&D.
The first-best solution to this market failure is for government to invest in R&D directly and give resulting technology away freely so all who place any value on the generated knowledge are free to use it. This means there are no deadweight losses in the consumption of the knowledge. Public provision simultaneously solves the problems caused by the non-rivalness, non-excludability and the long-time horizon of benefits. Unfortunately, government supply of R&D is subject to enormous information requirements which are, in part, a product of the fundamental uncertainty inherent in technological progress. Efficient allocation requires identifying the most valuable research projects, determining who should tackle them, knowing how much resources are required and how investment should be spread over time. An example of the perils of over-reliance on government R&D is illustrated by the innovation system in the Soviet Union. Despite a disproportionate share of highly educated scientists and engineers, the country was unable to shift from a ‘Marxist’ capital-deepening phase of growth to growth based on broad technological change. Living standards stagnated as a result.
Good innovation policy should therefore supplement public R&D grant schemes with policies that decentralise decision making and harness market forces to allocate resources to research. Tax incentives and matching grants are
two market-oriented approaches that are widely used. Patents, trade marks, copyright and other forms of IP represent other, older, market-oriented R&D policies. By providing legal protection from imitation, IP rights help innovators to extract a (quasi) rent from technology consumers and therefore recoup their initial R&D outlay. The greater is the pecuniary value placed by consumers, the greater is the reward to the investor. However, the privatisation of spillovers is rarely complete or exact and is itself subject to uncertainty. Confidence in the IP system, in this case, is the cornerstone of the ex ante incentive to innovate.
However, while the patent system may furnish a (risk-taking) entrepreneur with the incentive to invest in research and innovation, it also limits the diffusion of valuable technology. Not only does inhibiting the diffusion of technology create a static welfare loss to society, but because technology commonly builds on or extends what has gone before, it can potentially reduce the rate of technological progress.5 By providing legally sanctioned market power associated with IP rights, government have effectively replaced one form of market failure with another. It is incumbent therefore upon the architects of the patent system to shape its specification so that it does more good than harm.
Public research versus the patent system
Ideally, the economic system should fund R&D projects that have a positive net present value evaluated at the social rate of discount6 and subsequently minimise any deadweight7 loss in its consumption. To this end, the patent system and public R&D8 can act as complementary policies. Because of the enormous information requirements outlined above, one single system for allocating investment funds will be unlikely to comprehensively and efficiently identify all opportunities. Each type of investment decision making body, be it an expert grant body or private sector firm, will use different rules and processes to collate and weight information to make their choices – neither of which are inherently more valid than the other.
There will be some cases where useful research will never attract private investment, because it is

53Insights Melbourne Economics and Commerce
simply not possible to make resultant knowledge excludable. Such research must always be funded from the public purse and subsequently dispersed as widely as possible. An example would be the provision of health advice such as the prevention of cot death in newborns or the effects of smoking. Conversely, the value of some technology would be largely destroyed through indiscriminate public disclosure – such as that relating to a firm’s unique competitive strategy. In this case, patents are the clear policy choice. We can also deduce two guiding principles for those prospective research projects that could feasibly be picked up by either government funding or the lure of a prospective patent. First, there is no apparent reason for patenting outputs from public sector grants – patents would override the basic intent of public sector grants which is to avoid deadweight losses. Second, to the extent the size of the public purse is limited, priority for public R&D grants should be given to projects which, if patented, would result in the largest deadweight loss (relative to cost).9 Deadweight losses arise from both static and dynamic spillovers.
While these latter principles are easy to define in theory, and easy to see ex post, it is difficult to find practical criteria that mimic these principles ex ante. Nonetheless, a number of features of patent law and conventions in public research funding have evolved which reflect these sentiments. For instance, to be eligible for patent protection, an invention must reflect a ‘method of manufacture’. This means basic scientific knowledge, such as mathematical formula, cannot be patented as these are considered phenomenon of nature. In economists’ terms, the breadth and life of the use of this type of knowledge is too extensive to be under monopoly control. Additionally, a customary practice has been that public research organisations, such as CSIRO and universities, conduct basic research, rely on public grants and eschew patents, while commercial companies conduct development and commercialisation and patent without the aid of grants. As a quid pro quo, public research organisations conduct ‘open science’ wherein they are motivated to disseminate their knowledge as widely as possible at marginal cost, while commercial companies enjoy the privileges of proprietorial technologies.
However, in recent decades this dichotomy has broken down. Since the mid-1980s, patenting by Australian public research organisations at the Australian patent office has risen by over three per cent per annum. By 2007, one in five scientists from the main eight universities and CSIRO held a patent as the owner or the inventor.10 This rise in public sector patenting follows a world-wide push, spearheaded by the US, to encourage universities to patent – as exemplified by the establishment of university technology transfer offices and inclusion of patents in university performance criteria. It is pertinent therefore to ask why: if the public has funded the R&D, should taxpayers pay a second time to use the technology?
The motive for this emerging policy stance can often be confused. Many public sector scientists have a strong sense that they should not be giving their inventions away ‘free’. Some university officials think public sector patents should be about raising revenue for further research.11 Whatever their origin, neither of these arguments are based on economic principles. The economic argument for encouraging public sector organisations to patent is that a patent facilitates the transfer of technology from public sector ‘research’ to private sector ‘development’. The line of reasoning is that private firms will not be willing to invest in development and commercialisation of nascent technologies without the confidence of IP protection. An upstream monopoly is invoked to protect downstream development work from imitation. Of course, this potential benefit from patenting in the public sector does not negate the deleterious effects of patents limiting diffusion of basic research, discussed above.12 Thus, we have two equally plausible but conflicting theories about the effect of monopoly control on the wider social benefit.
While, to date, there is limited empirical evidence as to the importance of patents in facilitating technology transfer, there has been considerable discussion in the literature of the problems caused by patents impinging on the research community. A patent holder has the right to prevent anyone from replicating their idea even if that use is purely for non-commercial research purposes. For example, if a gene has been patented, a

54 What does economics say about intellectual property?
scientist who wants to find tests for, or effects of, that gene must get the patentee’s permission. Accordingly, public sector scientists going about their daily work are required under law to conduct ‘freedom-to-operate’ searches to ensure they are not trespassing on others’ patents. This requires searching through about 40,000 patent specifications lodged at the Australian patent office and more for scientists working in the US, Japan or Germany. If a relevant patent is found, the scientist must negotiate the right to use the idea with the patentee and possibly pay a royalty. The cost of royalties must therefore be included in funding proposals. A scientist may need to negotiate several permissions and this leads to the possibility that one party may hold up an entire research program if, for a reason only accountable to themselves, the patentee refuses permission. While all these obstacles are surmountable, they clearly cause delay and add to the administrative burden of research staff. More pertinently, they limit the natural tendency of scientists to tinker, wander and explore. The more pervasive patents are, the more compliance checks university administrations will demand of their research staff to pre-empt litigation.
The case for a statutory research exemption
The encroachment by patents on the research community is one area where patent policy needs to be more nuanced. The issue for the policy maker is: can we craft patent law so it provides the incentive needed for commercialisation while preserving the best features of the system of open science? We believe the answer comes from two routes: the first is to exclude fundamental discoveries, such as the identification of a gene sequence, from patentable subject matter – moving the patent threshold (or choke point) further down the science–technology spectrum. The second lies in enacting a statutory research exemption. This permits someone to use a patented idea for non-commercial research applications without the patentee’s permission. An advantage of a non-commercial research exemption is that, at least in principle, it should have little or no dampening effect on the incentive to create new technology afforded by the patent system.
Technologies that represent research tools present a particularly challenging case for IP policy. On one hand, the benefits to further research resulting in widespread adoption of the tools, such as microscopes and genetically modified mice, is anticipated to be particularly great, and restricting their use under a monopolistic market structure may block the production of new technology. On the other hand, if the principal market for a new research tool is the research community, allowing researchers to use it without compensating the original inventor will destroy the incentive to invest in such innovations.
Current Australian patent law does not explicitly allow a researcher to use a patented idea without permission, that is, there is no statutory research exemption.13 Survey evidence reveals that six out of 10 public scientists are unsure or hold false premises about their freedom to conduct research in patented areas. However, it only takes one landmark litigation case with large damages payments for the culture of the research community to become more guarded. Changing the law to include a statutory research exemption will make the situation clear. We believe policy change based on the application of good economic analysis is preferable to leaving policy development to the judiciary and the axioms of legal analysis alone.
Russell Thomson is a Research Fellow and Elizabeth Webster is Associate Professor at the Melbourne Institute of Applied Economic and Social Research at the University of Melbourne.
1 Intellectual property rights include patents, copyright, trade marks, designs and plant breeders’ rights. In this essay we consider only patents.
2 Machlup and Penrose (1950). The Patent Controversy in the Nineteenth Century. Journal of Economic History, 10, 1, 1-29.
3 Charles Duell, the then commissioner of the USPTO, suggested in 1899 that at some point all inventions will have been found. This notion is related to a conjecture that, like low hanging fruit, the best inventions will be made first. However, English economist George Shackle argued that, as there is no way to ordinally rank knowledge discovery according to is value to society we cannot assume the low-hanging fruit is discovered first.

Insights Melbourne Economics and Commerce 55
4 For a number of reasons, private firms (collectively) may employ a discount rate higher than is optimal for society as a whole. For instance, considerations of intergenerational equity suggests a discount rate for evaluating long term research projects should not include pure time preference (impatience). Any difference between private sector interest rates (required rate of return) and societies long term rate of time preference has a larger distortionary effect on present value calculations (which are used to determine the investment decision) the longer the time horizon.
5 Several features of the patent system aim to minimise potential negative side effects. Patents require innovators to publicly disclose technical details of their inventions in exchange for a time-limited monopoly. At least in principle, this ensures that new knowledge is made available to other inventors, who are able to build on the technology in the future.
6 The social rate of discount is the rate is a rate which is welfare optimising for intertemporal allocation decisions for society as a whole, it reflects the rate at which individuals are happy to trade between current and future consumption. The private rate of discount, on the other hand, is the rate of interest businesses pay creditors for financing their investments, is determined by central banks plus commercial banks’ premia for risk.
7 Deadweight losses represent the loss of utility which arises because the market price is above marginal cost.
8 For illustrative purposes, it is best to think about public R&D as a government contract to undertake a specific research project with the results made publically available on completion.
9 The costs of raising public capital through taxation and private capital through retained earnings are similar. A goods and services tax of 10 per cent is no different to an additional company mark-up of 10 per cent. Accordingly, the best policy will be to fund all R&D projects with a known and certain net present value through the public purse.
10 Intellectual Property Research Institute of Australia Survey of Inventors, 2007, University of Melbourne.
11 In fact, few universities make much revenue from licensing royalties.
12 Nor does it solve the double-dipping problem caused by R&D being funded once by taxes and secondly by patent profits. We argue that this problem may be solved by granting domestic firms who pay royalties on public sector patents a large tax concession on these payments.
13 Like many points of law, there exists some doubt about the current legal status. Two common law cases have caused some doubt among legal scholars but essentially the situation does not give the research community the green light to conduct research without approval (see Dent, C. Jensen, P. H. Waller, S. and Webster, E. (2005). ‘Research Use of Patented Knowledge – A Review’, Intellectual Property Research Institute of Australia (IPRIA), The University of Melbourne. Report for the OECD).

What finally shattered the special relationship was Australia’s sudden change of policy to support the independence of East Timor. Indonesia’s repressive rule and periodic atrocities in East Timor were not known to the Indonesian public, who believed their country was generously funding the development of its latest and poorest province. It did not help that at the time Indonesia was in turmoil because of the economic devastation of the Asian crisis and the transition from military dictatorship to parliamentary democracy. When Indonesia was in desperate need, the Australian Government was seen to have turned away.
Then came 9/11. As a predominantly Muslim country, Indonesia was portrayed by the Howard Government as the threat that many Australians had always believed it to be. The deaths of so many Australians in the Bali bombings of October 2002 and October 2005 seemed the ultimate confirmation.
Reconciliation
Fortunately, wiser counsel prevailed. The turning points were President Bambang Susilo Yudhoyono’s election in late 2004 and the Aceh tsunami of December that year. The spontaneous response of the Australian public to the aid appeal and the Government’s pledge of $1 billion in additional aid cast Australia in a generous light for the first time in several years. This paved the way for a good personal relationship between Mr Howard and the incoming President Yudhoyono.
Everyone understands the rise of China, but who talks about the rise of Indonesia? Yet Indonesia is now a G20 member along with the US, the European powers, Japan, China, India and Australia. Indonesia has been a democracy for the past 10 years and this year held its third general election and second presidential election. These 240 million people will influence our future much more than six million Papua New Guineans or four million New Zealanders.
Nevertheless, we still see Indonesia as a problem rather than an opportunity. We are uncomfortable with Islam. We have been spooked by a series of terrorist incidents, most recently the Marriott Hotel bombing. ‘Border security’ translates subliminally into protection against threats from Indonesia. Then there is airline safety. All this negative news makes us unresponsive to a more prosperous, democratic and sophisticated neighbour. We are also squandering our educational and intellectual expertise.
Trust and betrayal
A special relationship between two very dissimilar neighbours was born of strife. Between 1945 and 1949 the Australian Government supported Indonesia’s long and bitter struggle for independence while the Waterside Workers’ Federation refused to load supplies onto Dutch ships. As late as the 1990s, Australians were still treated as special guests.
56 Are we taking Indonesia seriously?
are we taking indonesia seriously?
In 2009 most Australians have not made up their mind whether they want to engage with Indonesia or not. Our hearts, minds and wallets are still elsewhere.
This article forms part of a series of essays commissioned by Asialink at the University of Melbourne exploring Australia’s engagement with Asia. The full referenced version can be found at www.asialink.unimelb.edu.au.
by howard dick

Insights Melbourne Economics and Commerce 57
Investment figures are less encouraging. According to the Australian Bureau of Statistics, the stock of all types of Australian investment in Indonesia had risen quite slowly from $2.9 billion in 2001 to $3.4 billion in 2007. Foreign direct investment (FDI), where the parent company exercises managerial control, may be a better indication of long-term commitment: this figure rose from $0.5 billion in 2001 to $1.8 billion in 2007. Yet the 2007 total was still only 0.6 per cent of outward FDI, compared with 2.5 per cent for China and Hong Kong, and 15 per cent for New Zealand.
Proximity does not seem to encourage Australian firms to invest in Indonesia. Any developing economy of more than 200 million people growing at around six per cent per annum is generating a lot of business opportunities. Indonesia’s investment climate, however, is a real problem, as recognised by the government itself. Investment and labour regulations, weak legal protection and erratic local government policies combine to deter direct investment. Nevertheless, for most Australian firms, Indonesia is simply not on the radar screen.
Challenges
Perhaps the greatest obstacle to closer long-term relations is that the Australian public remains deeply suspicious of Indonesia. This is partly the old bogey of the Threat from the North. There are a lot of people in Indonesia; ergo they must covet expansion to Australia. The fact that most Indonesians are Muslim makes the equation with terrorism. Finally, there are the perceptions that Indonesia is highly corrupt and its judicial system hopeless. The Schapelle Corby case and those of the Bali Nine were grist to that mill. There is little recognition that Indonesia is a country in transition and that such endemic problems will take a long time to overcome.
Growing Australian tourism to Indonesia does not seem to have made much difference. Bali is as far as most Australian tourists get, and this enclave experience of beaches and bars does not improve understanding of the country as a whole.
Education is a more reliable way to improve public understanding in both countries. Here, Australia lags well behind Indonesia. For university-educated Indonesians, proficiency in English has
A comprehensive Framework of Security Cooperation (the Lombok Treaty) was signed in 2006. A key principle is that both countries will ‘refrain from the threat or use of force against the territorial integrity or political independence of the other.’ The Treaty extends to practical forms of bilateral cooperation over defence, law enforcement, counter-terrorism, intelligence, maritime security, aviation security and emergency relief. Because Australia and Indonesia share long and porous borders, such forms of cooperation not only reduce threats but also help Indonesia to build a democratic civil society.
Business as usual?
In 2009 official Australia-Indonesia relations look to be back on a firm footing after the turbulence of the Howard-Bush years. The end of the Bush-Cheney presidency in the US, and the inauguration of Barack Obama with his Indonesian background, have helped create a more relaxed diplomatic climate. The Jakarta embassy is Australia’s largest overseas post, ahead of London and Washington; Indonesia is Australia’s leading aid recipient and its eleventh biggest trading partner. The Australia-ASEAN free-trade agreement has been ratified and an Australia-Indonesia free-trade agreement is well advanced.
Aid is perhaps the clearest Australian commitment to the long-term relationship. Indonesia now ranks ahead of Papua New Guinea as Australia’s number one aid recipient. In June 2008, Mr Rudd and Mr Yudhoyono signed a new Australia Indonesia Partnership agreement for $0.5 billion per annum in aid until 2013. Priorities are education, health and development, especially in the poor eastern provinces.
At first sight, economic relations are also steadily improving. Since the Asian crisis two-way trade has grown steadily to $10 billion in 2007, albeit much less than with Thailand ($14 billion) or Malaysia ($15 billion). Service trade is a fast-growing component. Indonesia has now overtaken Malaysia and Singapore as the main Southeast Asian source of international students with around 15,000 enrolled in Australian schools and universities. Tourism flows, however, have fluctuated wildly in response to terrorist bombings and remain below their 1997 peak.

58 Are we taking Indonesia seriously?
One foot on the brake
The Australian Government’s persistence with a level-4 travel warning to ‘reconsider your need to travel’ to Indonesia is a stumbling block to closer relations. The Philippines and Thailand, which also have local insurgencies, receive only a level-3 warning (‘exercise a high degree of caution’).
The Australian Government claims that the warning is continually reviewed upon expert advice. However, that expert advice is not made available for public scrutiny, while contrary expert advice by Australians who are well informed on Indonesia is ignored. Meanwhile, many Australians exercise their common sense and travel anyway.
Australia’s official position is therefore like that of a bus driver steering with one foot on the brake. When challenged he defends it as a safety measure, adding, ‘Don’t worry, the brake doesn’t work properly.’
A level-3 travel warning as applied to Thailand would be appropriate to Indonesia as long as known terrorists remain at large: ‘exercise a high degree of caution because of the high threat of terrorist attack…against a range of targets, including tourist areas and other places frequented by foreigners.’ This may be combined with warnings to avoid districts or provinces of the greatest danger.
Conclusion
In 2009 most Australians have still not made up their mind whether they want to engage with Indonesia or not. Our hearts, minds and wallets are still elsewhere.
Yet if old prejudices still hold sway, it is not the whole story. Compared with a generation ago, many more Australians have traveled through and even worked in Indonesia, learning Indonesian language and culture, and sometimes intermarrying. There is a body of expertise and experience, albeit largely outside the mainstream of Australian society.
Moreover, it is probably no longer true that educated Australians know more about Indonesia than educated Indonesians about Australia. Elite and middle-class Indonesians, who used to travel to Singapore, now visit Australia in increasing
become essential as a means of access to global networks. English is taught in most secondary schools, though usually not very well.
In Australia, however, enrolments in Indonesian language at schools and universities have been in marked decline, accelerated by the Howard Government’s withdrawal of Federal Government funding under the Asian languages (NALSAS) program. According to an October 2007 report by the Commonwealth Department of Education, between 2001 and 2005 the number of Indonesian language students in government schools fell by 19 per cent, more than double the rate of decline in overall language numbers.
The decline of language study would not matter so much if Asian Studies had continued to be widely taught in Australian schools, but Social Studies and Geography subjects have also been withering. There is no longer a platform for teaching on Indonesia, or indeed any other of our near neighbours.
The Australian Government’s inflexible, high-level Travel Alert does not encourage the study of Indonesia. Parents are given official reason to believe that Indonesia is just too dangerous. For students who do persist, the travel warning leads to an insurance obstacle: Australian secondary students seeking in-country study of Indonesian can get closer than Darwin.1
It gets worse. The flow-on effect is that the number of students studying Indonesian language and society in Australian universities is also in rapid decline – the Asian Studies Association of Australia (ASSAA) reports a 24 per cent fall between 2001 and 2007. Because staff numbers are tied to student enrolments, academics are being retrenched, programs shut down and departments closed. The University of Melbourne program has contracted to a skeleton staff without professor.
Vital research expertise on Indonesia is thereby being whittled away and there is almost no career path for aspiring young academics. Australia had built up an enviable international reputation as the world centre for Indonesian studies. On present trends, this will soon cease to be the case. A vital piece of the nation’s soft infrastructure will thereby be lost.

Insights Melbourne Economics and Commerce 59
numbers for business, tourism, health and education. This includes senior Indonesian figures, often below the radar and not on official visits. Sometimes their children are being educated in Australia. In Melbourne and Perth especially, there are vibrant Indonesian communities. These cities are becoming familiar territory, part of the Indonesian world, and are a tribute to the stability of the relationship. But it is also a missed opportunity if Australians fail to make more of the two-way relationship.
In terms of its architecture, the Australia-Indonesia relationship is falling into place. The ASEAN and Indonesia FTAs will complement the Security Treaty and sit alongside aid, educational and cultural programs.
Nevertheless, there is no sense of urgency that building a common future requires a large investment in Asian education – to create a society that can envisage a shared future. Student interest is collapsing in schools and universities; teaching and research expertise is dissipating. With some notable exceptions, Australian business sees no future in its own region. Hence there are almost no career paths for Indonesia experts outside an attenuated public service.
Moreover, the Australian Government still insists upon an official policy of actively discouraging Australians from visiting Indonesia. This is absurd. Let the travel advisories advise Australians as to the risks, provide information on sensible strategies and, as in the case of most other countries, advise on the provinces or cities or places that are best avoided. The Nanny Australia warnings do us all a disservice.
Professor Howard Dick is Honorary Professorial Fellow in the Department of Management and Marketing at the University of Melbourne and Conjoint Professor in Faculty of Business & Law at the University of Newcastle (NSW).
1 Australian secondary students of Indonesian language go to Darwin as a poor substitute for in-country study.

using good education in times of changeThose features of the world that reflect and shape human civilisation
are changing on a scale and at a pace that has no precedent. Some of the changes threaten human civilisation as we know it. Some have the potential to free humanity from longstanding barriers that have
denied civilisation’s richest fruits to most of humanity.
An edited version of the Occasional Address delivered at the graduation on 8 August 2009.
by ross garnaut
occasional address
60 Using good education in times of change
You are entering upon a new stage of your lives as graduates from a first rate Faculty in a first rate University. A tiny fraction of one per cent of humanity has such a good start. You are entering this new stage of your lives when those features of the world that reflect and shape human civilisation are changing on a scale and at a pace that has no precedent. Some of the changes threaten human civilisation as we know it. Some have the potential to free humanity from longstanding barriers that have denied civilisation’s richest fruits to most of humanity.
Humans have been around for only a tiny fraction of the history of this planet. Human civilisation – the process of building political, social and economic structures that can support large concentrations of population; and the continuous discovery, storage and dissemination of new knowledge, of which the use of agriculture, the wheel, and writing are important parts – is a product of only a small part of the time when humans have been around. Civilisation is a creation of these last ten thousand years or so. And within the years of human civilisation, the last two or three hundred years – the last few decades most of all – stand out as the time of most rapid change.
Economic development over the millennia
In my Climate Change Review, I drew on the story told by economic historian Angus Maddison in the Millennium Report that he wrote for the OECD a bit less than a decade ago.
Economic development in these last two hundred years has taken most of humanity – but certainly not all – from lives that were insecure, ignorant and short, to personal health and security, material comfort and knowledge unknown to the elites of the wealthiest and most powerful societies in earlier times.
In the first millennium after the life of Jesus Christ, global economic output increased hardly at all – by only one sixth. All of the small increase was contributed by population growth, and none by increased output per person. By contrast, output increased 300-fold in the second millennium, with the population increasing 22 times and per capita production 13 times. Most of the extraordinary expansion took place towards the end of the period. From 1820 until the end of the twentieth century, per capita output increased more than eight times and population more than five times.
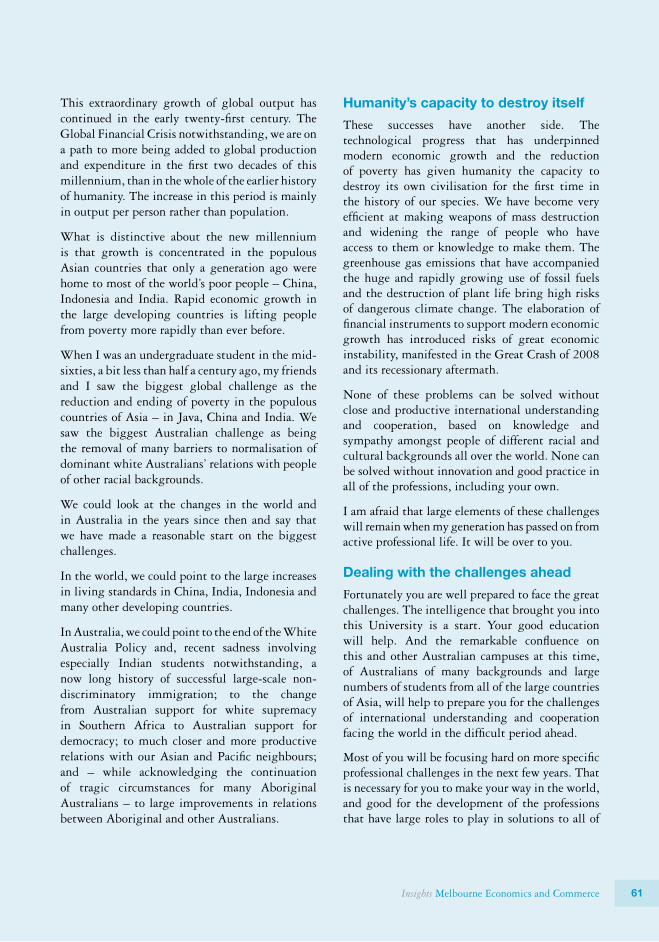
61Insights Melbourne Economics and Commerce
Humanity’s capacity to destroy itself
These successes have another side. The technological progress that has underpinned modern economic growth and the reduction of poverty has given humanity the capacity to destroy its own civilisation for the first time in the history of our species. We have become very efficient at making weapons of mass destruction and widening the range of people who have access to them or knowledge to make them. The greenhouse gas emissions that have accompanied the huge and rapidly growing use of fossil fuels and the destruction of plant life bring high risks of dangerous climate change. The elaboration of financial instruments to support modern economic growth has introduced risks of great economic instability, manifested in the Great Crash of 2008 and its recessionary aftermath.
None of these problems can be solved without close and productive international understanding and cooperation, based on knowledge and sympathy amongst people of different racial and cultural backgrounds all over the world. None can be solved without innovation and good practice in all of the professions, including your own.
I am afraid that large elements of these challenges will remain when my generation has passed on from active professional life. It will be over to you.
Dealing with the challenges ahead
Fortunately you are well prepared to face the great challenges. The intelligence that brought you into this University is a start. Your good education will help. And the remarkable confluence on this and other Australian campuses at this time, of Australians of many backgrounds and large numbers of students from all of the large countries of Asia, will help to prepare you for the challenges of international understanding and cooperation facing the world in the difficult period ahead.
Most of you will be focusing hard on more specific professional challenges in the next few years. That is necessary for you to make your way in the world, and good for the development of the professions that have large roles to play in solutions to all of
This extraordinary growth of global output has continued in the early twenty-first century. The Global Financial Crisis notwithstanding, we are on a path to more being added to global production and expenditure in the first two decades of this millennium, than in the whole of the earlier history of humanity. The increase in this period is mainly in output per person rather than population.
What is distinctive about the new millennium is that growth is concentrated in the populous Asian countries that only a generation ago were home to most of the world’s poor people – China, Indonesia and India. Rapid economic growth in the large developing countries is lifting people from poverty more rapidly than ever before.
When I was an undergraduate student in the mid-sixties, a bit less than half a century ago, my friends and I saw the biggest global challenge as the reduction and ending of poverty in the populous countries of Asia – in Java, China and India. We saw the biggest Australian challenge as being the removal of many barriers to normalisation of dominant white Australians’ relations with people of other racial backgrounds.
We could look at the changes in the world and in Australia in the years since then and say that we have made a reasonable start on the biggest challenges.
In the world, we could point to the large increases in living standards in China, India, Indonesia and many other developing countries.
In Australia, we could point to the end of the White Australia Policy and, recent sadness involving especially Indian students notwithstanding, a now long history of successful large-scale non-discriminatory immigration; to the change from Australian support for white supremacy in Southern Africa to Australian support for democracy; to much closer and more productive relations with our Asian and Pacific neighbours; and – while acknowledging the continuation of tragic circumstances for many Aboriginal Australians – to large improvements in relations between Aboriginal and other Australians.

62 Using good education in times of change
the world’s big problems. But I hope that you will make space for some wider life of the mind – to continue to take an interest in what is being said and written about the broader issues facing humanity. That will improve the chances of humanity meeting the great challenges that we have left to you.
It will also provide some more personal benefits. It will improve your chances of being selected for leadership in the professional or business field in which you choose to specialise. It will help you to understand and to keep in perspective the immense and sometimes worrying change that is bound to remain in the background of your lives. And it will mean that when, like people of my age now, you are moving towards your final appearances on the professional stage, you will be able to do that with joyful anticipation that you will now have more time for the other interesting things that have remained of great interest to you.
Professor Garnaut is Vice-Chancellor’s Fellow and Professorial Fellow at the University of Melbourne. He is also Distinguished Professor at The Australian National University; Chairman, Papua New Guinea Sustainable Development Program Limited; Chairman, International Food Policy Research Institute. He was recently recognised by the award of Distinguished Fellow of the Economic Society of Australia.

Insights Melbourne Economics and Commerce 63

Article heading here64


Mailing Address:The Faculty of Economics and CommerceThe University of MelbourneVictoria 3010 Australia
Telephone: +61 3 8344 2166Email: [email protected]: http://insights.unimelb.edu.au
Published by the Faculty of Economics and Commerce, November 2009© The University of Melbourne
DisclaimerInsights is published by the University of Melbourne for the Faculty of Economics and Commerce. Opinions published are not necessarily those of the publisher, printers or editors. The University of Melbourne does not accept responsibility for the accuracy of information contained in this journal. No part of this journal may be reproduced without the permission of the editors.