inspection and maintenance tools (linux / openstack)
TRANSCRIPT
Inspection and maintenance tools
Inspection and maintenance tools
Gerard Braad
Continued operation
Continued operation of an OpenStack environment is essential to our customers.
However, there are cases in which systems can react in unexpected or unforeseen ways.
The following tools described can help you in pinpointing issues.
Note: This is just a primer.
Divide them into categories
• General tools• Disk• Network• Debug
General tools
These are tools that are used for general inspection, such as
• system state• process monitoring• service control
ps
ps - report process status
The ps program displays the currently-running processes.
ps - Basic examples
By default ps selects all processes with the same user ID and associated with the same terminal as the caller.
$ ps
PID TTY TIME CMD3327 pts/1 00:00:00 bash3328 pts/1 00:00:00 bash5882 pts/1 00:00:00 ps
1
ps - Basic examples
To see every process running on the system, use the standard syntax:
$ ps -e
$ ps -ef
This does
• select all processes• full listing
ps - Command line options
Note that ps -aux is different than ps aux.
• UNIX options, which may be grouped and must be preceded by a dash (-)• BSD options, which may be grouped and must not be used with a dash• GNU long options, which are preceded by two dashes (--)
ps - Basic examples
To see every process on the system, using BSD syntax:
$ ps ax
This lifts the
• “only yourself” restriction• “must have a tty” restriction
Display user-oriented format
$ ps aux
ps - Select the process you want
Combine using a grep
$ ps aux | grep ssh
Note: this will also return the grep command.
2

ps - syntax
Try different options and see what works best for you.
$ man ps
$ info ps
ps - process tree
Process trees show the relationship between commands, by graphing how they are started.
$ ps axjf
$ ps -ejH
Alternative command is pstree.
Alternatives process
top (table of processes) is a task manager program. Several variants exist, like htop.
Especially htop is very detailed. Showing CPU core usage, free memory, etc.
Memory usage
To check if the system has enough memory available to run processes, you can check this with.
$ free -g
to display as gigabytes.
To update by interval
$ free -s 5
If the system is out-of-memory, strange behavior can occur, such as failing commands and unable to startnew processes.
Alternatives free memory
The proc filesystem is a special filesystem in Unix-like operating systems that presents information aboutprocesses and other system information in a hierarchical file-like structure.
$ cat /proc/meminfo
See also: /proc/meminfo
3
Alternatives free memory
vmstat (virtual memory statistics) is a computer system monitoring tool that collects and displays summaryinformation about operating system memory, processes, interrupts, paging and block I/O.
$ vmstat -s
Service management
Processes on Linux/Unix are owned by the init process, which primary role is to start processes accordingto a script from /etc/inittab or /etc/init.d
$ service
is responsible for running a System V init script.
To get an overview of all the services and if they are enabled
$ service --status-all
Restarting a service can be down with
$ service network restart
Enable services
Services are started according to their location in the runlevel folders.
To disable/enable a service
$ chkconfig disable NetworkManager$ chkconfig enable network
It links the scripts in /etc/rc?.d accordingly.
Service management
systemctl is a linux command to control the systemd system and service manager.
To show all services you have to limit to showing the service unit.
$ systemctl list-units -t service --all
Note: omitting --all will only show active services.
4
Service interaction
To look at the details of a specific service
$ systemctl status sshd.service
You can enable and disable with
$ systemctl enable sshd.service
and
$ systemctl disable sshd.service
Service files
The files used by systemd to start a service process are located in /usr/lib/systemd/system.
Below is an example of the neutron-server.service file.
[Unit]Description=OpenStack Neutron ServerAfter=syslog.target network.target
[Service]Type=notifyUser=neutronExecStart=/usr/bin/neutron-server --config-file /usr/share/neutron/neutron-dist.conf --config-dir /usr/share/neutron/server --config-file /etc/neutron/neutron.conf --config-file /etc/neutron/plugin.ini --config-dir /etc/neutron/conf.d/common --config-dir /etc/neutron/conf.d/neutron-server --log-file /var/log/neutron/server.logPrivateTmp=trueNotifyAccess=allKillMode=process
[Install]WantedBy=multi-user.target
Disk commands
• basic commands• preparation tools• mapping• consistency check
Disk free
df - report file system disk space usage
df (disk free) is a standard Unix command used to display the amount of available disk space for file systemson which the invoking user has appropriate read access.
$ df -h
makes the output human-readable.
5
Disk usage
du - estimate file space usage
du (disk usage) is a standard Unix command used to estimate file space usage—space used under a particulardirectory or files on a file system.
$ du -h
makes the output human-readable.
Top 10 disk usage
Often just a few files hog your disk, such as log files or a large disk image.
$ du -a /var | sort -n -r | head -n 10
Hunt for hogs with ducks
$ alias ducks=’du -cks * | sort -rn | head’
• -c produces a grand total• -k same as block-size=1K• -s summarize, total for each argument
fdisk
Hard disks can be divided into one or more logical disks called partitions. This division is described in thepartition table found in sector 0 of the disk.
fdisk is a command-line utility that provides disk partitioning functions. It doesn’t understand GUIDPartition Table (GPT) and it is not designed for large partitions.
Warning: Don’t delete, modify, or add partitions unless you know what youare doing. There is a risk of data loss!
fdisk - Basic usage
With the following command you can list all partitions.
$ fdisk -l
To modify partitions you can use the following command.
$ fdisk [device]
6
Alternatives fdisk
• sfdisk• cfdisk• parted
Note: avoid running different commands while performing edits as they can have differences in the way theywrite/store the data.
List partitions
If you only need to list partitions, just doing
$ cat /proc/partitions
would probably be enough. This is also what we will be using in the remainder of the slides when listingpartitions.
LVM
The Logical Volume Manager (LVM) provides logical volume management for the Linux kernel.It is implemented as a device mapper target.
LVM overview
LVM usecases
• Managing large hard disk farms by allowing disks to be added and replaced without downtime or servicedisruption, in combination with hot swapping.
• On small systems (like a desktop at home), instead of having to estimate at installation time how big apartition might need to be in the future, LVM allows file systems to be easily resized later as needed.
• Performing consistent backups by taking snapshots of the logical volumes.• Creating single logical volumes of multiple physical volumes or entire hard disks, allowing for dynamicvolume resizing.
Basic usage
Volume groups (VGs) can be resized online by absorbing new physical volumes (PVs) or ejecting existingones.Logical volumes (LVs) can be resized online by concatenating extents onto them or truncating extents fromthem. LVs can be moved between PVs.
Scenario
• four SATA disks, each 250G• to be dedicated for storage• separated in fileshare (450G), database (50G), backup (500G)
Note: this is just an example scenario. It is not suggested to deploy this layout in real as it provides no formof redundancy.
7
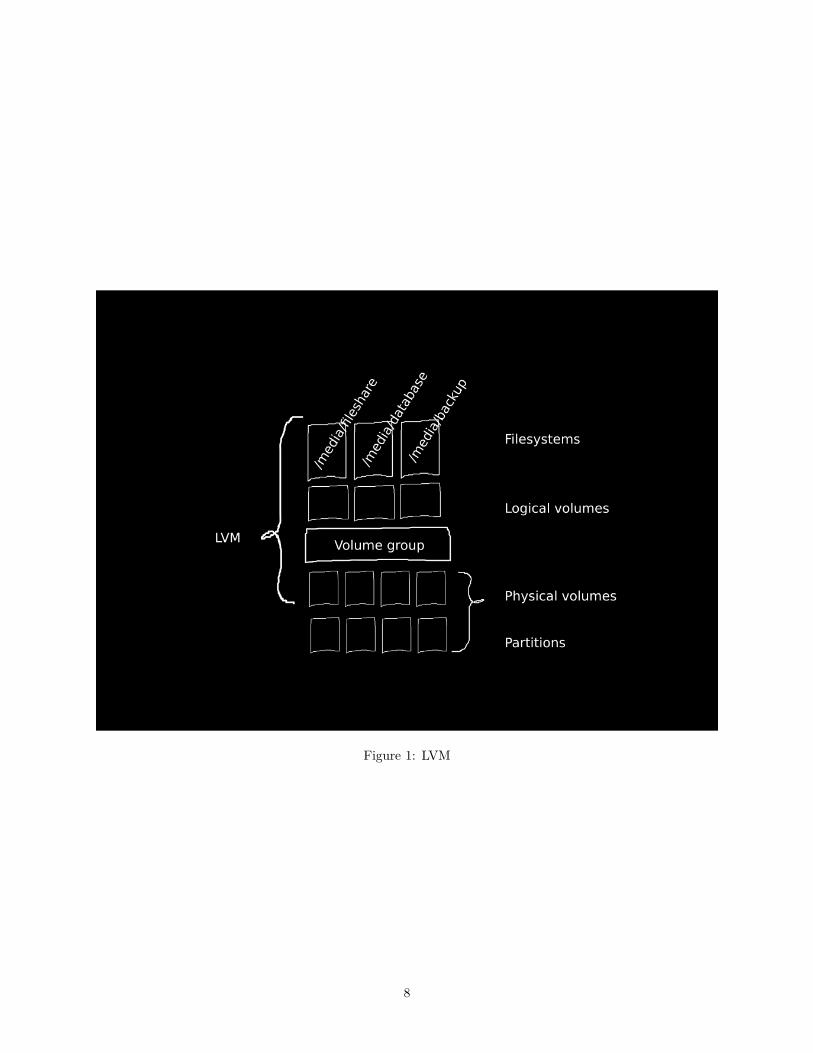
Figure 1: LVM
8
Partition the disks
Using fdisk we will create a new primary partition of type ‘8e’. We do this for each disk.
$ fdisk /dev/sdb$ fdisk /dev/sdc...
Note: we do not have to create partitions, but this is often what happens.
Create physical volumes
And create the Physical Volumes for the partitions we just created
$ pvcreate /dev/sdb1 /dev/sdc1 /dev/sdd1 /dev/sde1
You can check the creation of the physical volumes using pvdisplay.
Another way to learn about the physical volumes is to issue a pvscan.
Note: pvremove /dev/sdb1 will perform the opposite action.
Create Volume Group
After this is done, we will create the Volume Group
$ vgcreate storage /dev/sd[b-e]1
You can check the creation of the volume group using vgdisplay.
Another way to learn about the volume groups is to issue a vgscan.
Create Logical Volumes
Now we can create the actual logical volumes that represent the actual storage locations.
$ lvcreate -n fileshare -L +450G storage$ lvcreate -n database -L +50G storage$ lvcreate -n backup -L +500G storage
You can check the creation of the logical volumes using lvdisplay.
Another way to learn about the logical volumes is to issue a lvscan.
You will see devices mappings such as /dev/storage/fileshare, etc.
Modify Logical Volumes
Logical volumes can be modified using the following commands
• lvremove• lvreduce• lvextend
9
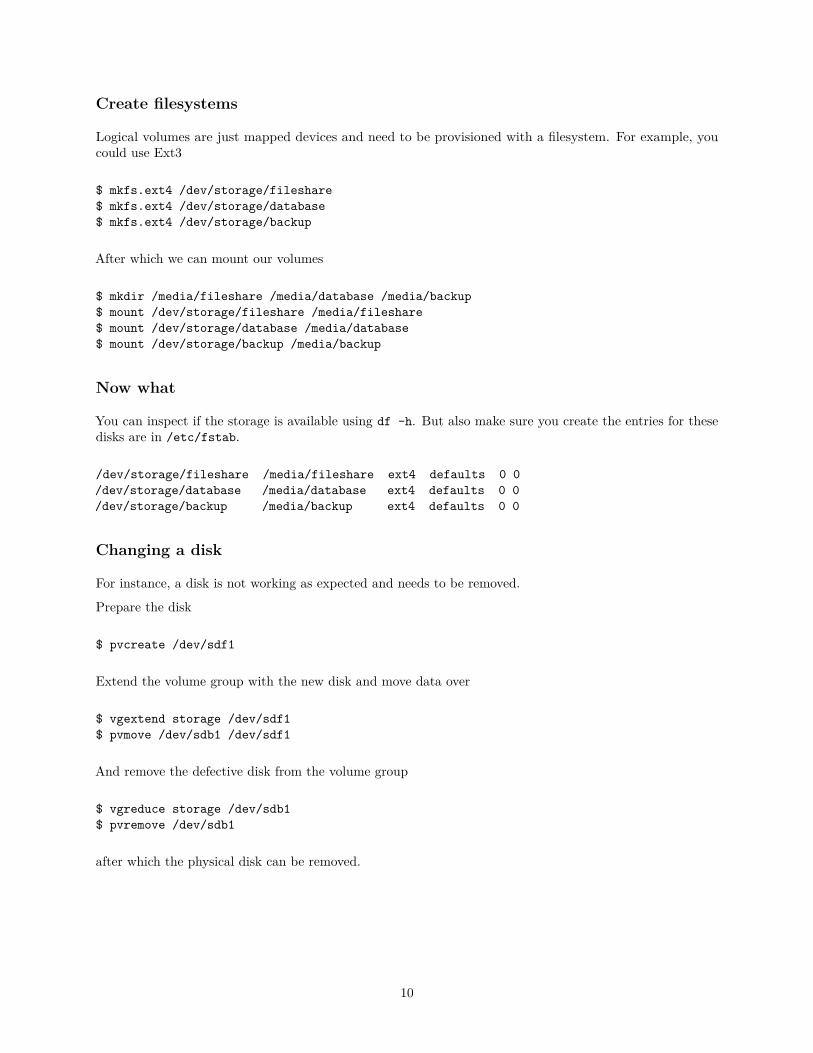
Create filesystems
Logical volumes are just mapped devices and need to be provisioned with a filesystem. For example, youcould use Ext3
$ mkfs.ext4 /dev/storage/fileshare$ mkfs.ext4 /dev/storage/database$ mkfs.ext4 /dev/storage/backup
After which we can mount our volumes
$ mkdir /media/fileshare /media/database /media/backup$ mount /dev/storage/fileshare /media/fileshare$ mount /dev/storage/database /media/database$ mount /dev/storage/backup /media/backup
Now what
You can inspect if the storage is available using df -h. But also make sure you create the entries for thesedisks are in /etc/fstab.
/dev/storage/fileshare /media/fileshare ext4 defaults 0 0/dev/storage/database /media/database ext4 defaults 0 0/dev/storage/backup /media/backup ext4 defaults 0 0
Changing a disk
For instance, a disk is not working as expected and needs to be removed.
Prepare the disk
$ pvcreate /dev/sdf1
Extend the volume group with the new disk and move data over
$ vgextend storage /dev/sdf1$ pvmove /dev/sdb1 /dev/sdf1
And remove the defective disk from the volume group
$ vgreduce storage /dev/sdb1$ pvremove /dev/sdb1
after which the physical disk can be removed.
10
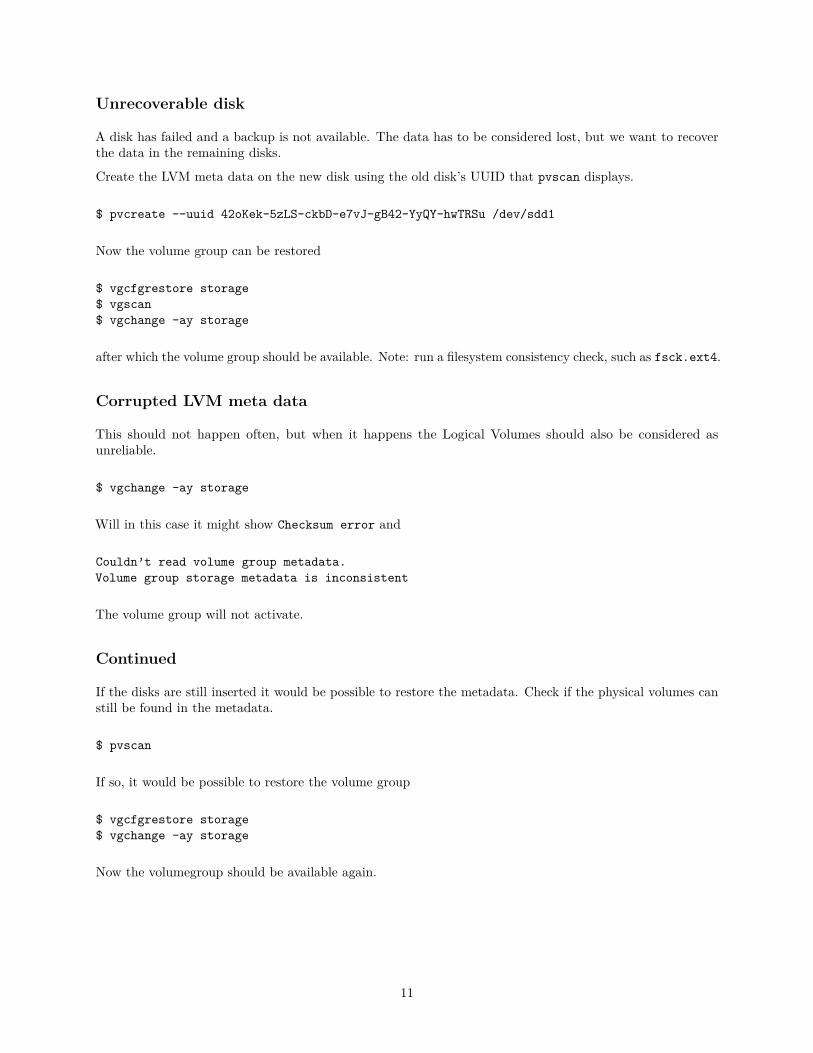
Unrecoverable disk
A disk has failed and a backup is not available. The data has to be considered lost, but we want to recoverthe data in the remaining disks.
Create the LVM meta data on the new disk using the old disk’s UUID that pvscan displays.
$ pvcreate --uuid 42oKek-5zLS-ckbD-e7vJ-gB42-YyQY-hwTRSu /dev/sdd1
Now the volume group can be restored
$ vgcfgrestore storage$ vgscan$ vgchange -ay storage
after which the volume group should be available. Note: run a filesystem consistency check, such as fsck.ext4.
Corrupted LVM meta data
This should not happen often, but when it happens the Logical Volumes should also be considered asunreliable.
$ vgchange -ay storage
Will in this case it might show Checksum error and
Couldn’t read volume group metadata.Volume group storage metadata is inconsistent
The volume group will not activate.
Continued
If the disks are still inserted it would be possible to restore the metadata. Check if the physical volumes canstill be found in the metadata.
$ pvscan
If so, it would be possible to restore the volume group
$ vgcfgrestore storage$ vgchange -ay storage
Now the volumegroup should be available again.
11
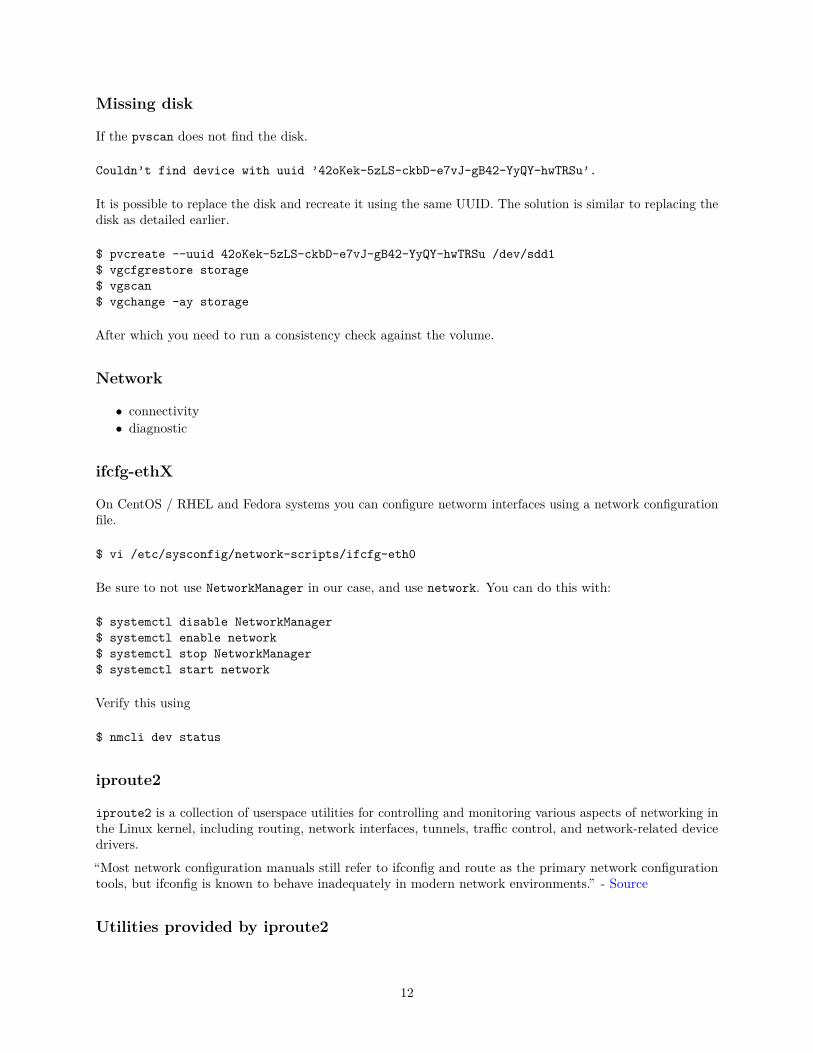
Missing disk
If the pvscan does not find the disk.
Couldn’t find device with uuid ’42oKek-5zLS-ckbD-e7vJ-gB42-YyQY-hwTRSu’.
It is possible to replace the disk and recreate it using the same UUID. The solution is similar to replacing thedisk as detailed earlier.
$ pvcreate --uuid 42oKek-5zLS-ckbD-e7vJ-gB42-YyQY-hwTRSu /dev/sdd1$ vgcfgrestore storage$ vgscan$ vgchange -ay storage
After which you need to run a consistency check against the volume.
Network
• connectivity• diagnostic
ifcfg-ethX
On CentOS / RHEL and Fedora systems you can configure networm interfaces using a network configurationfile.
$ vi /etc/sysconfig/network-scripts/ifcfg-eth0
Be sure to not use NetworkManager in our case, and use network. You can do this with:
$ systemctl disable NetworkManager$ systemctl enable network$ systemctl stop NetworkManager$ systemctl start network
Verify this using
$ nmcli dev status
iproute2
iproute2 is a collection of userspace utilities for controlling and monitoring various aspects of networking inthe Linux kernel, including routing, network interfaces, tunnels, traffic control, and network-related devicedrivers.
“Most network configuration manuals still refer to ifconfig and route as the primary network configurationtools, but ifconfig is known to behave inadequately in modern network environments.” - Source
Utilities provided by iproute2
12
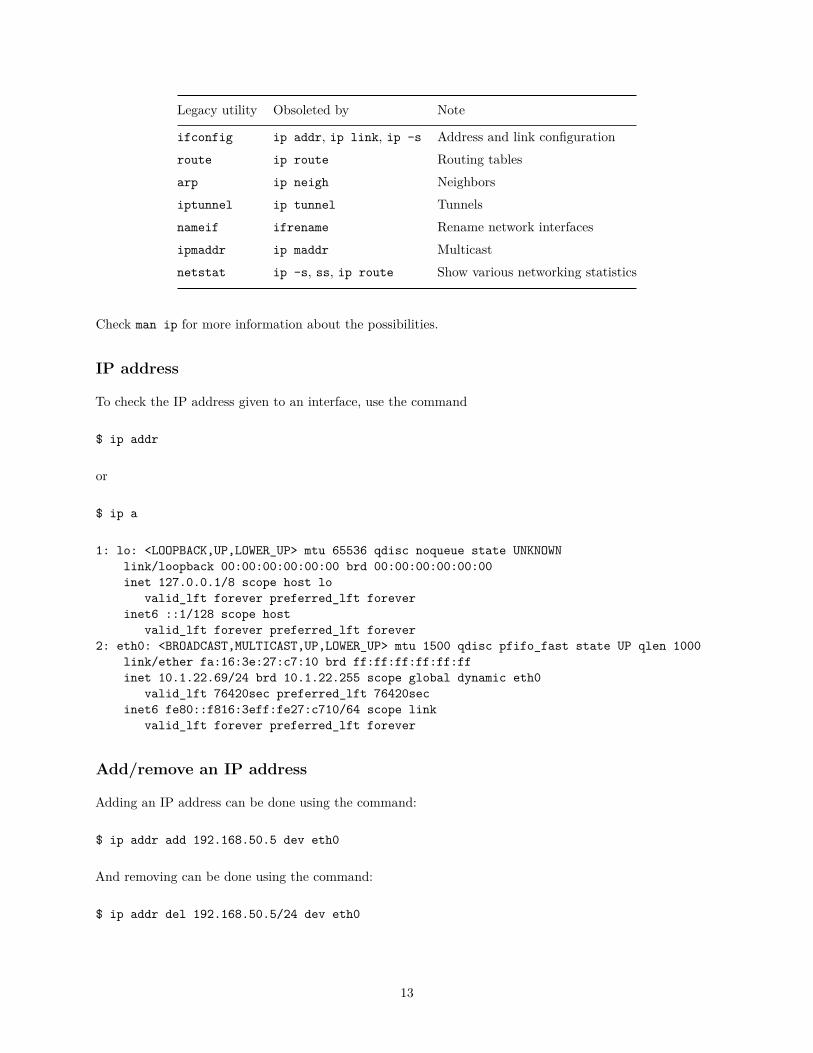
Legacy utility Obsoleted by Note
ifconfig ip addr, ip link, ip -s Address and link configurationroute ip route Routing tablesarp ip neigh Neighborsiptunnel ip tunnel Tunnelsnameif ifrename Rename network interfacesipmaddr ip maddr Multicastnetstat ip -s, ss, ip route Show various networking statistics
Check man ip for more information about the possibilities.
IP address
To check the IP address given to an interface, use the command
$ ip addr
or
$ ip a
1: lo: <LOOPBACK,UP,LOWER_UP> mtu 65536 qdisc noqueue state UNKNOWNlink/loopback 00:00:00:00:00:00 brd 00:00:00:00:00:00inet 127.0.0.1/8 scope host lo
valid_lft forever preferred_lft foreverinet6 ::1/128 scope host
valid_lft forever preferred_lft forever2: eth0: <BROADCAST,MULTICAST,UP,LOWER_UP> mtu 1500 qdisc pfifo_fast state UP qlen 1000
link/ether fa:16:3e:27:c7:10 brd ff:ff:ff:ff:ff:ffinet 10.1.22.69/24 brd 10.1.22.255 scope global dynamic eth0
valid_lft 76420sec preferred_lft 76420secinet6 fe80::f816:3eff:fe27:c710/64 scope link
valid_lft forever preferred_lft forever
Add/remove an IP address
Adding an IP address can be done using the command:
$ ip addr add 192.168.50.5 dev eth0
And removing can be done using the command:
$ ip addr del 192.168.50.5/24 dev eth0
13
Enable/disable a network interface
To enable a network interface use the command:
$ ip link set eth1 up
And disabling can be done using the command:
$ ip link set eth1 down
Manual page:
$ man ip link
Routing table
Routing table management is done using the ip route command.
To see the current routing table use the command:
$ ip route
default via 10.1.22.1 dev eth0 proto static metric 10010.1.22.0/24 dev eth0 proto kernel scope link src 10.1.22.69 metric 100172.24.4.224/28 dev br-ex proto kernel scope link src 172.24.4.225
Add/remove static route
Static routes prevent traffic from passing through the default gateway. This way the best way to reach adestination can be given.
To add a static route:
$ ip route add 10.10.20.0/24 via 192.168.50.100 dev eth0
And to remove a static route:
$ ip route del 10.10.20.0/24
Persistent static routes
For CentOS / RHEL and Fedora a persistent static route can be configured via a network configuration file.
For example:
$ vi /etc/sysconfig/network-scripts/route-eth0
10.10.20.0/24 via 192.168.50.100 dev eth0
14
Default gateway
Default gateways can be configured per interface or globally.
$ ip route add default via 192.168.50.100
and can be removed using:
$ ip route del default
Persistent global gateway is configured in:
$ vi /etc/sysconfig/network
GATEWAY=192.168.50.100
Otherwise specific gateways needs to be specified in the interface configuration file.
See also
• https://www.centos.org/docs/5/html/5.2/Deployment_Guide/s1-networkscripts-static-routes.html
ARP
Address Resolution Protocol is used to find the address of a network neighbor for an IPv4 address.
Whenever you try to ping an IP aadress on the network, your system has to turn that IP address into a MACaddress. This involves using ARP to resolve the address.
If the IP address is not found in the ARP table, the system will then send a broadcast packet to the networkusing the ARP protocol to ask who has 192.168.50.101.
ARP Table
Showing the ARP cache table can be done using the command:
$ ip neigh
or
$ ip n
15
arping
arping is a tool for discovering and probing hosts on a computer network. It probes hosts on the attachednetwork link by sending Link Layer frames using ARP request method addressed to a host identified by itsMAC address of the network interface.
The command
$ arping -c 2 -I eth0 192.168.50.101
will make two requests over interface eth0 for the IP address.
While
$ arping -c 2 00:11:85:4c:de:af
will return the associated IP address for the given MAC address.
ping
ping is a small utitlity to measure the reachability and round-trip time for a message to be sent and echoedback by a destination host. It uses a ICMP Echo Request message for this.
After just adding a default gateway for instance, you can verify whether the route is working properly:
$ ping www.google.com
or using an IP address.
What happened
1. Query the DNS server to obtain the IP address of the destination host. (For example: 74.125.236.34)2. The destination address (74.125.236.34) is not within the network range. In Layer-3 (IP header) the
DESTINATION IP will be set as 74.125.236.34.3. In Layer-2, the DESTINATION MAC address will be the filled in with the MAC address of the default
gateway (192.168.50.100’s MAC).
The network switch (L2) sends the packet to the default gateway since the destination MAC is that of thegateway.
Once the gateway receives the packet, based on its routing table, it will forward the packets further.
Useful options of ping
Limit the count of ping requests
$ ping -c 192.168.50.101
And flood the target with ping requests
$ ping -f 192.168.50.101
16
Useful options of ping
Using -i [number] you can change the interval before sending the next packet.
$ ping -i 10 linux.com
Using -q the command will only print summary statistics:
$ ping -c 4 -q linux.com
The default packetsize is 56, using the -s option you can change the size of the ping packet.
$ ping -s 200 google.com
Pressing CTRL+| will print the statistics summary will the ping is still running.
Route of ping
Using -R you will see the route that is taken for a packet. Many hosts ignore or discard this option.
$ ping -R google.com
traceroute (tracepath)
traceroute is a network diagnostic tool for displaying the route and measuring transit delays of packets onan IP network. This can help identify incorrect routing table definitions.
An alternative tool is tracepath. tracepath uses the sockets API, while traceroute manipulates rawpackages for some of its functionality. Because of this, traceroute needs root privileges.
Note: ping only computes the final round-trip times for the destination.
Example use
$ traceroute google.com
traceroute to google.com (216.58.197.206), 30 hops max, 60 byte packets1 106.187.33.2 (106.187.33.2) 2.604 ms 2.601 ms 2.563 ms
[...]
7 72.14.233.221 (72.14.233.221) 1.969 ms 1.927 ms 1.656 ms8 nrt13s48-in-f14.1e100.net (216.58.197.206) 2.177 ms 1.787 ms 1.677 ms
The first column shows the TTL of the probe.
17
tcpdump
tcpdump is a common command line packet analyzer. It allows the user to display TCP/IP and other packetsbeing transmitted or received.To install
$ yum install -y tcpdump
And run:
$ tcpdump
You will have to terminate with ˆC when you have received enough packets.
Examples of tcpdump
Use the -i parameter to listen on all interfaces
$ tcpdump -i any
or
$ tcpdump -i eth0
to listen on eth0 only.
Examples of tcpdump
In some case you would not want to see resolved hostnames. You can prevent this with -n. Using -nn willalso prevent from resolving port names.
$ tcpdump -nS
Using -S will print absolute sequence numbers.
Examples of tcpdump
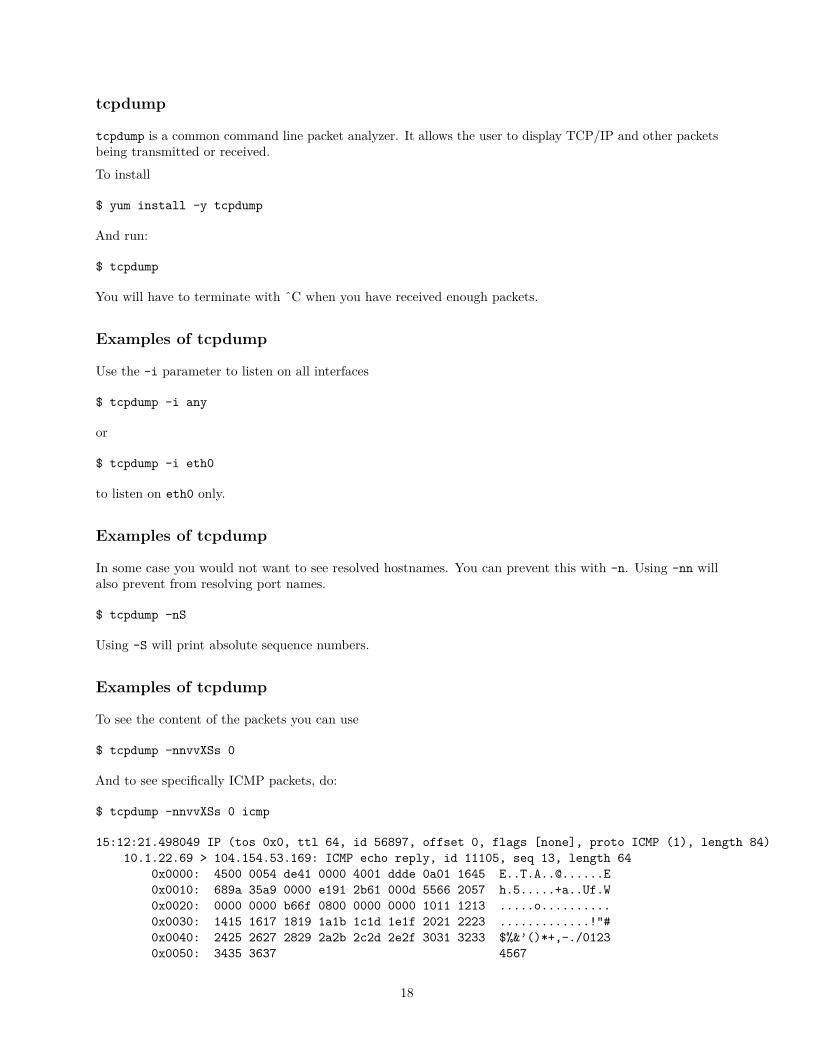
To see the content of the packets you can use
$ tcpdump -nnvvXSs 0
And to see specifically ICMP packets, do:
$ tcpdump -nnvvXSs 0 icmp
15:12:21.498049 IP (tos 0x0, ttl 64, id 56897, offset 0, flags [none], proto ICMP (1), length 84)10.1.22.69 > 104.154.53.169: ICMP echo reply, id 11105, seq 13, length 64
0x0000: 4500 0054 de41 0000 4001 ddde 0a01 1645 [email protected]: 689a 35a9 0000 e191 2b61 000d 5566 2057 h.5.....+a..Uf.W0x0020: 0000 0000 b66f 0800 0000 0000 1011 1213 .....o..........0x0030: 1415 1617 1819 1a1b 1c1d 1e1f 2021 2223 .............!"#0x0040: 2425 2627 2829 2a2b 2c2d 2e2f 3031 3233 $%&’()*+,-./01230x0050: 3435 3637 4567
18
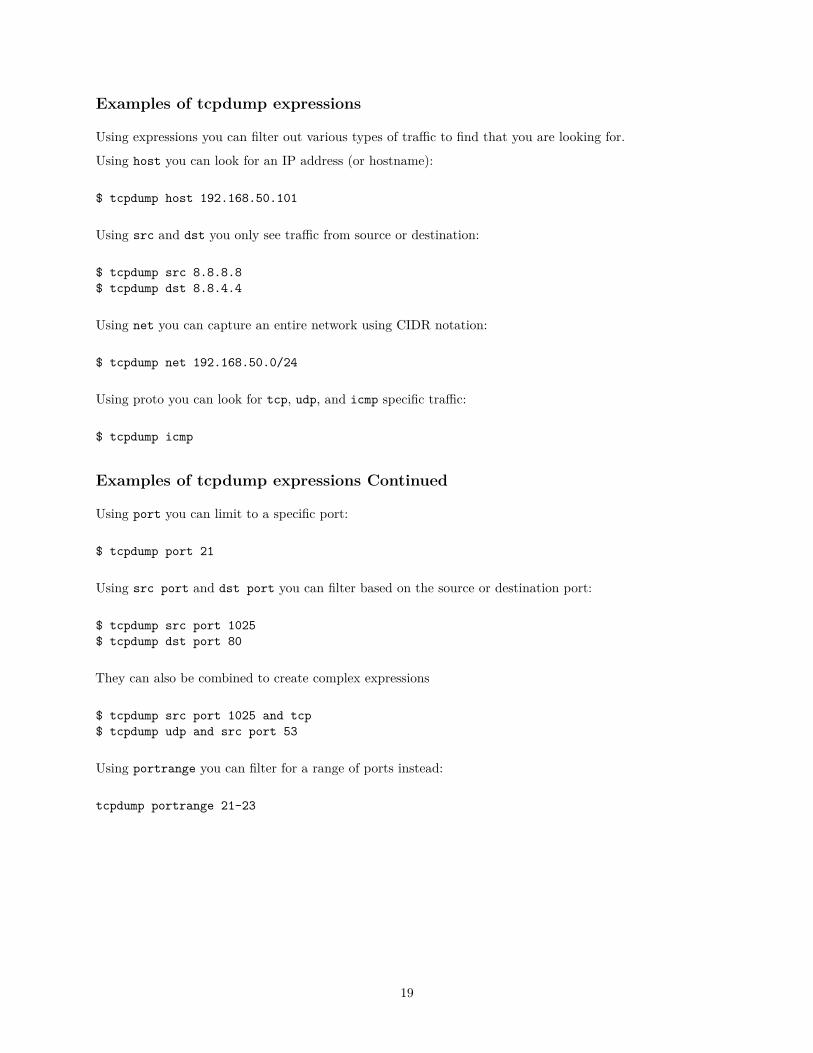
Examples of tcpdump expressions
Using expressions you can filter out various types of traffic to find that you are looking for.
Using host you can look for an IP address (or hostname):
$ tcpdump host 192.168.50.101
Using src and dst you only see traffic from source or destination:
$ tcpdump src 8.8.8.8$ tcpdump dst 8.8.4.4
Using net you can capture an entire network using CIDR notation:
$ tcpdump net 192.168.50.0/24
Using proto you can look for tcp, udp, and icmp specific traffic:
$ tcpdump icmp
Examples of tcpdump expressions Continued
Using port you can limit to a specific port:
$ tcpdump port 21
Using src port and dst port you can filter based on the source or destination port:
$ tcpdump src port 1025$ tcpdump dst port 80
They can also be combined to create complex expressions
$ tcpdump src port 1025 and tcp$ tcpdump udp and src port 53
Using portrange you can filter for a range of ports instead:
tcpdump portrange 21-23
19
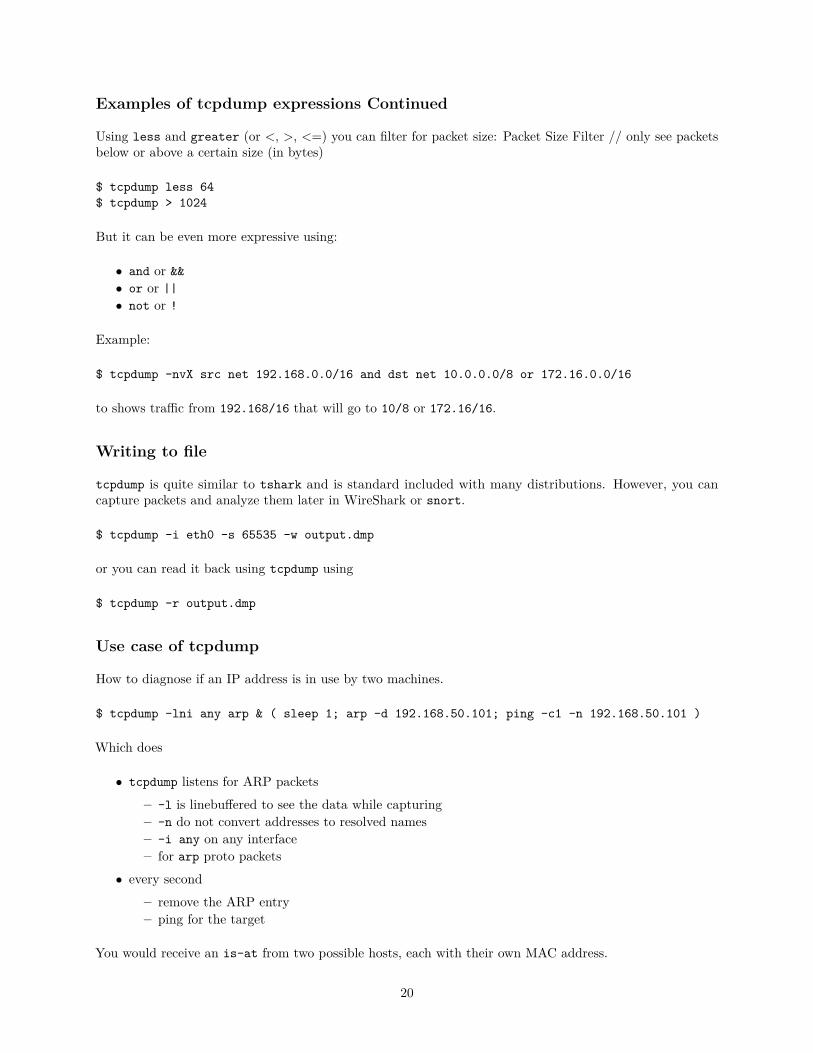
Examples of tcpdump expressions Continued
Using less and greater (or <, >, <=) you can filter for packet size: Packet Size Filter // only see packetsbelow or above a certain size (in bytes)
$ tcpdump less 64$ tcpdump > 1024
But it can be even more expressive using:
• and or &&• or or ||• not or !
Example:
$ tcpdump -nvX src net 192.168.0.0/16 and dst net 10.0.0.0/8 or 172.16.0.0/16
to shows traffic from 192.168/16 that will go to 10/8 or 172.16/16.
Writing to file
tcpdump is quite similar to tshark and is standard included with many distributions. However, you cancapture packets and analyze them later in WireShark or snort.
$ tcpdump -i eth0 -s 65535 -w output.dmp
or you can read it back using tcpdump using
$ tcpdump -r output.dmp
Use case of tcpdump
How to diagnose if an IP address is in use by two machines.
$ tcpdump -lni any arp & ( sleep 1; arp -d 192.168.50.101; ping -c1 -n 192.168.50.101 )
Which does
• tcpdump listens for ARP packets
– -l is linebuffered to see the data while capturing– -n do not convert addresses to resolved names– -i any on any interface– for arp proto packets
• every second
– remove the ARP entry– ping for the target
You would receive an is-at from two possible hosts, each with their own MAC address.
20

iftop
iftop is a command-line monitoring tool that shows a list of network connections and their bandwidth usage.
It is not a standard tool that is available for CentOS 7. However, it can be found in EPEL for EL6.
brctl
brctl is used to set up, maintain, and inspect the ethernet bridge configuration in the linux kernel. A bridgeis used to connect different networks of ethernets together, so that these ethernets will appear as one to theconnected interfaces.
To show all current instances of ethernet bridges use the command:
$ brctl show
Add/remove bridge
$ brctl addbr br0
$ brctl delbr br0
Add/remove interface ports
Traffic coming on any of the ports will be forwarded to the other ports transparently, so that the bridge isinvisible to the rest of the network.
$ brctl addif br0 eth1
$ brctl delif br0 eth1
Netfilter
If you encounter issues with filtered packets on the bridge, verify that you have disabled netfilter.
$ cat /etc/sysctl.conf
net.bridge.bridge-nf-call-ip6tables = 0net.bridge.bridge-nf-call-iptables = 0net.bridge.bridge-nf-call-arptables = 0EOF
Else it is possible that IP firewall rules apply to frames on a bridge, because they will be filtered by theFORWARD rule.
21

lsof
lsof - list open files
Is a tool to report a list of all open files and the processes that opened them.
The command
$ lsof
will list all open files belonging to all active processes.
Examples lsof
Using a filespecifier you can limit this to a single file or a directory.
$ lsof /var/log/
Using -c you can specify a process name and list the opened files by the process starting with that name:
$ lsof -c ssh
Using -u you can list files opened by a specific user (the ˆ prefix excludes this user):
$ lsof -u keystone
And -p shows the files opened by a specific Process ID
$ lsof -p 1
Examples lsof
Using -t you can return the Process ID associated with open files from that process.
$ lsof -t /var/log/glance/api.log
For instance, you can combine this to kill all processes associated with a particular user:
$ kill -9 ‘lsof -t -u glance‘
it will all processes opened by glance which has files opened.
Examples lsof
If you specify more than one options they will be OR-ed.
$ lsof -c ssh -u admin
does not return the expected result for process ssh and user admin. To solve this, you need to add the -aoption to do an AND operation.
$ lsof -c ssh -u admin -a
22
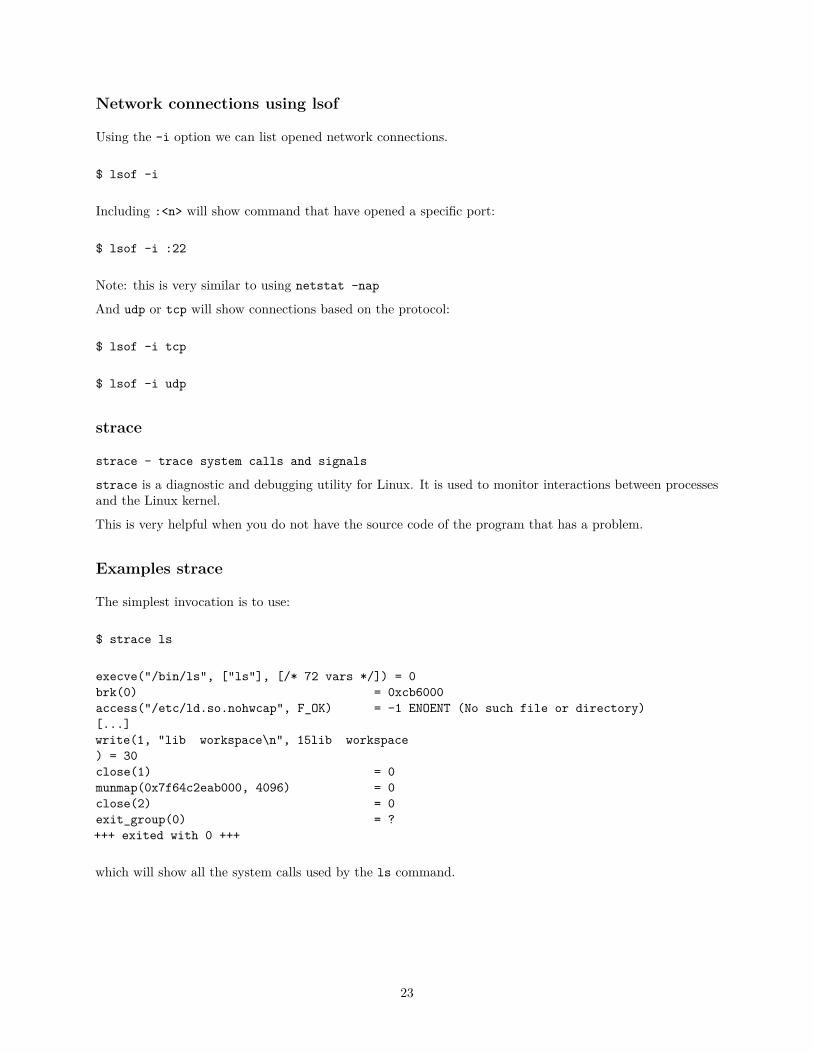
Network connections using lsof
Using the -i option we can list opened network connections.
$ lsof -i
Including :<n> will show command that have opened a specific port:
$ lsof -i :22
Note: this is very similar to using netstat -nap
And udp or tcp will show connections based on the protocol:
$ lsof -i tcp
$ lsof -i udp
strace
strace - trace system calls and signals
strace is a diagnostic and debugging utility for Linux. It is used to monitor interactions between processesand the Linux kernel.
This is very helpful when you do not have the source code of the program that has a problem.
Examples strace
The simplest invocation is to use:
$ strace ls
execve("/bin/ls", ["ls"], [/* 72 vars */]) = 0brk(0) = 0xcb6000access("/etc/ld.so.nohwcap", F_OK) = -1 ENOENT (No such file or directory)[...]write(1, "lib workspace\n", 15lib workspace) = 30close(1) = 0munmap(0x7f64c2eab000, 4096) = 0close(2) = 0exit_group(0) = ?+++ exited with 0 +++
which will show all the system calls used by the ls command.
23

Examples strace
You can also trace for a specific system call:
$ strace -e open ls
It is possible to specify several system calls at once:
$ strace -e open,access,read ls
Examples strace
You can also trace an existing running process. For this you need the Process ID of the program.
$ ps -C mysqld
In this case you will probably see many processes. Attach to the last one for instance.
$ strace -p 8642
or
$ strace -p ‘pidof mysqld‘
The execution will be shown until you break out using ˆC.
Examples strace
Below you will find other useful options.
The -r option which allows you to print relative execution time for each system call:
$ strace -r ls
While the -c option will generate a statistics report:
$ strace -c ls
Important option
Often processes will create a subprocess. To make sure you can trace them use the -f option.
This will trace child processes as they are created by currently traced processes as a result of the fork systemcall.
Saving a trace
Usinf the -o option you can save a trace to a file:
$ strace -o trace.txt ls
This can then be shared or attached to a bug report.
24
Combining strace and lsof
Using strace and lsof it is possible to debug process hangs.There are several ways a proces can be blocked, for instance:
• it is blocked waiting for a resource that isn’t available• or is in an infinite loop
file-descriptors
When you strace a running application, you might see
select(1, [0], NULL, [0], NULL
Which is a system call
select() and pselect() allow a program to monitor multiple file descriptors,waiting until one or more of the file descriptors become "ready"
If you want to know what this file is, run:
$ lsof -p <PID> -ad 1
Debugging
Debugging is a the process of finding and resolving defects that prevent correct operation of a computerprocess.Many different techniques exist and deserve a presentation in itself.
• synchronous• asynchronous (concurrency)
pdb
pdb is an interactive source code debugger for Python programs, offered as a module.
• breakpoints• single stepping• inspection of stack frames• source code listing• evaluation of code
Run pdb
To run the python debugger you can call it on your scriptfile
$ pdb [scriptfile]
or
$ python -m pdb [scriptfile]
25
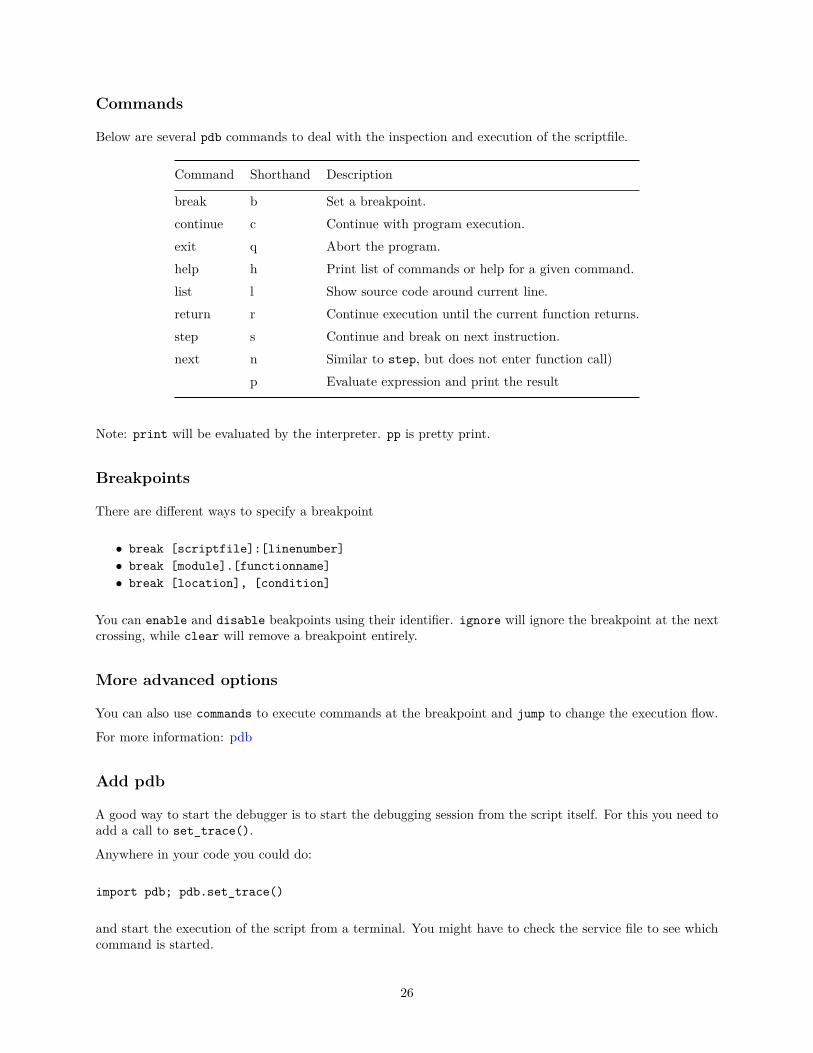
Commands
Below are several pdb commands to deal with the inspection and execution of the scriptfile.
Command Shorthand Description
break b Set a breakpoint.continue c Continue with program execution.exit q Abort the program.help h Print list of commands or help for a given command.list l Show source code around current line.return r Continue execution until the current function returns.step s Continue and break on next instruction.next n Similar to step, but does not enter function call)
p Evaluate expression and print the result
Note: print will be evaluated by the interpreter. pp is pretty print.
Breakpoints
There are different ways to specify a breakpoint
• break [scriptfile]:[linenumber]• break [module].[functionname]• break [location], [condition]
You can enable and disable beakpoints using their identifier. ignore will ignore the breakpoint at the nextcrossing, while clear will remove a breakpoint entirely.
More advanced options
You can also use commands to execute commands at the breakpoint and jump to change the execution flow.
For more information: pdb
Add pdb
A good way to start the debugger is to start the debugging session from the script itself. For this you need toadd a call to set_trace().
Anywhere in your code you could do:
import pdb; pdb.set_trace()
and start the execution of the script from a terminal. You might have to check the service file to see whichcommand is started.
26
gdb
GNU Debugger. The standard debugger for the GNU operating system.
• help• run• step• break [file]:[linenumber], [function]• continue• next (will not enter function call)• print• watch• backtrace• . . .
Attach to running process
$ gdb attach <PID>
Kernel debugging can be done using the ‘crash‘ tool.
Note
If one thread stops for a breakpoint, or for some other reason, and another thread is blocked in a system call,then the system call may return prematurely.
Another useful tool
ss - another utility to investigate sockets
It dump socket statistics. It allows showing information similar to netstat.
• -l show listening sockets• -p show process using socket• -e show exteneded information
27