installation and closed-loop tests of flms & fcls december
TRANSCRIPT

SDRC-9 Installation and Closed-Loop Tests of FLMs & FCLs December 2016

SDRC-9 Closed-Loop Operation FLMs & FLMTs
FL Equipment
Page 2 of 76
Document Control
Name Date
Prepared by: Daniel Hardman
02.12.2016 Neil Murdoch
Ali Kazerooni
Reviewed by: Jonathan Berry 13.12.2016
Approved (WPD): Roger Hey 15.12.2016
Revision History
Date Issue Status
06.12.2016 0.1 DRAFT
13.12.2016 0.2 DRAFT
Report Title : SDRC-9
Report Status : FINAL
Project Ref : WPDT2004 - FlexDGrid
Date : 13.12.2016

SDRC-9 Closed-Loop Operation FLMs & FLMTs
FL Equipment
Page 3 of 76
Contents
1 INTRODUCTION .................................................................................................................... 5 2 FAULT LEVEL MONITOR AND MVA/MVA ANALYSIS ............................................................ 6
Introduction ......................................................................................................................... 6 2.1 Fault Level Definitions ......................................................................................................... 7 2.2 Fault Level Headroom .......................................................................................................... 9 2.3 Average Value Analysis ...................................................................................................... 18 2.4 MVA per MVA analysis and trends .................................................................................... 19 2.5 Estimation of MVA per MVA at other substations ............................................................ 33 2.6
3 FLM DATA IN TO WPD’S SYSTEMS AND OPERATION ......................................................... 34 Data Integration ................................................................................................................. 34 3.1 FLM Control ....................................................................................................................... 35 3.2 Parallel Network Operational Assessment ........................................................................ 36 3.3 Customer Connections using FLM Data ............................................................................. 40 3.4 FLM Data Transfer Reliability ............................................................................................. 46 3.5
4 FCL OPERATIONAL EXPERIENCE ......................................................................................... 47 GridON ............................................................................................................................... 47 4.1 Nexans ............................................................................................................................... 50 4.2 GE ....................................................................................................................................... 59 4.3
5 FCL AVAILABILITY ............................................................................................................... 60 6 FCL PERFORMANCE ........................................................................................................... 61
Overview ............................................................................................................................ 61 6.1 Castle Bromwich Fault Level Comparison ......................................................................... 61 6.2 Chester Street Fault Level Comparison ............................................................................. 63 6.3 Bournville Fault Level Comparison .................................................................................... 65 6.4 Summary ............................................................................................................................ 67 6.5
7 FCL NETWORK SECURITY ................................................................................................... 67 8 LEARNING .......................................................................................................................... 70
Cooling Systems ................................................................................................................. 70 8.1 Installation Type ................................................................................................................ 71 8.2 Fault Limiting Performance ............................................................................................... 73 8.3 Approved policy documents .............................................................................................. 73 8.4 PSCFCL energisation .......................................................................................................... 74 8.5 Technology comparison ..................................................................................................... 74 8.6
DISCLAIMER Neither WPD, nor any person acting on its behalf, makes any warranty, express or implied, with respect to the use of any information, method or process disclosed in this document or that such use may not infringe the rights of any third party or assumes any liabilities with respect to the use of, or for damage resulting in any way from the use of, any information, apparatus, method or process disclosed in the document. © Western Power Distribution 2016 No part of this publication may be reproduced, stored in a retrieval system or transmitted, in any form or by any means electronic, mechanical, photocopying, recording or otherwise, without the written permission of the Future Networks Manager, Western Power Distribution, Herald Way, Pegasus Business Park, Castle Donington. DE74 2TU. Telephone +44 (0) 1332 827446. E-mail [email protected].

SDRC-9 Closed-Loop Operation FLMs & FLMTs
FL Equipment
Page 4 of 76
Glossary
Abbreviation Term
AC Alternating Current
AD Artificial Disturbance
ANM Active Network Management
AVC Automatic Voltage Control
CHP Combined Heat and Power
DC Direct Current
DNO Distribution Network Operator
EHV Extra High Voltage (voltages above 22,000V)
FCL Fault Current Limiter
FL Fault Level
FLM Fault Level Monitor
GSP Grid Supply Point
HMI Human Machine Interface
HV High Voltage (voltages above 1,000V but below 22,000V)
LN2 Liquid Nitrogen
LV Low Voltage
MVA Mega Volt Ampere
MW Mega Watts
ND Natural Disturbance
NMS Network Management System
NOP Normal Open Point
PLC Programmable Logic Control
PSCFCL Pre-Saturated Core Fault Current Limiter
RMS Root Mean Square
RSFCL Resistive Superconducting Fault Current Limiter
RTU Remote Terminal Unit
SDRC Successful Delivery Reward Criteria
UPS Uninterruptible Power Supply
WPD Western Power Distribution

SDRC-9 Closed-Loop Operation FLMs & FLMTs
FL Equipment
Page 5 of 76
1 Introduction
The LCNF Tier 2 project FlexDGrid offers an improved solution to the timely and cost effective integration of customers’ generation and demand within Birmingham’s urban High Voltage (HV) electricity network. Three separate methods have been identified within FlexDGrid to achieve these objectives:
Method Alpha – An enhanced fault level assessment process;
Method Beta – The real time management of fault level; and
Method Gamma – Integration of fault level mitigation technologies. This document fulfils the ninth Successful Delivery Reward Criterion of FlexDGrid “Installation and Closed-Loop Tests of Fault Level Monitors and Fault Level Mitigation Equipment” (SDRC-9) by demonstrating the control of the network and quantification of gains. This report describes how the devices, previously reported in SDRC-7 and 8 relating to their installation and open-loop performance have been used to fundamentally change how the network can be and is operated due to the additional information or performance characteristics provided by each device. The closed-loop operation of the Fault Level Monitors (FLM) focusses on the availability of real-time peak and RMS fault levels to generate historic trends to understand more accurately how site specific fault level detail should be modelled and how real-time data can be used to inform optimal network operation. Fault Level Mitigation Technologies (FLMT) have demonstrated their closed-loop operation by being energised and operational on the live 11kV network, in the Birmingham area, to enable significant elements of the 11kV network to operate in parallel and to actively limit fault current, under fault conditions, to enable over 50MW of additional generation to be connected. The installation of the 10 FLMs, through provision of real-time fault level network data has released over 150MW of generation connection capacity. The term FLMT is used interchangeably with Fault Current Limiter (FCL) throughout this document. A key learning point for the project reported in this document is that the installation of the 10 FLMs has enabled a created an additional 150MVA of generation connection capacity in Birmingham, whilst a further 52MVA has been created due to the installation of the three FLMTs.

SDRC-9 Closed-Loop Operation FLMs & FLMTs
FL Equipment
Page 6 of 76
2 Fault Level Monitor and MVA/MVA Analysis
Introduction 2.1
During 2014 and 2015 Fault Level Monitors (FLMs) were installed at ten Birmingham primary substations as part of FlexDGrid:
KITG Kitts Green;
CASB Castle Bromwich;
CHES Chester Street;
BOVI Bournville;
BARG Bartley Green;
HALG Hall Green;
ELMD Elmdon;
CHAV Chad Valley;
SHIR Shirley; and
NECW Nechells West.
Fault level measurements from these substations, as well as Ladywood (LADW) where an FLM was installed under an earlier LCNF Tier-1 project, are analysed in this report.
SDRC-8 provided a detailed understanding of the FLM technology, how it was tested in an external laboratory and the works required installing an FLM at each of the ten sites. This report looks at the data gathered by the FLMs. The data is analysed in order to:
Compare the accuracy of WPD’s network models with the on-site measurements;
Determine the headroom available for increases in fault level at the primary substations; and
Determine a general load fault level to demand MVA / MVA infeed for different load mixes at substations.
Infeed (upstream) 11kV fault levels through 132/11kV transformers are measured with Outram Research PM7000 power quality analysers. These detect voltage and current natural disturbances (NDs) from which peak make and rms break fault levels are estimated. The frequency at which these NDs occur is not controlled; larger NDs give rise to larger confidences in the estimated data.
S&C Electric Company IntelliRupter® PulseCloser® Fault Interrupters are connected to a particular busbar at each of the primary substations. These are used to create artificial disturbances (ADs), phase to phase faults lasting around 4 to 5 milli-seconds. Dedicated PM7000s are connected to these fault interrupter feeders which measure the peak make and estimate the rms break fault currents. These ADs represent the total fault level at these 11kV busbars. ADs are created and measured four times daily at midnight, 06:00, noon and 18:00.

SDRC-9 Closed-Loop Operation FLMs & FLMTs
FL Equipment
Page 7 of 76
Fault Level Definitions 2.2
With reference to a typical short circuit current, as shown in Figure 2-1, the following definitions can be used to describe how current changes throughout the duration of a fault:
The peak make fault current (ip) is the maximum possible value of the prospective short circuit current and occurs at the first peak (10ms) of the short circuit. This represents the period of highest electromechanical forces and stress on plant. Manufacturers quote a rated peak make fault current for their switchgear which must not be exceeded.
The symmetrical steady state short circuit current (Ik) is the rms value of the short circuit current which remains after the decay of the transient phenomena (including the dc component). This represents the thermal heating effect the short circuit current has. Manufacturers quote a rated value for this that their switchgear can carry for either one or three seconds. The circuit breaker will be rated to break short circuit current below this value and during the short circuit the protection must initiate the break within the time period specified.
The rms break current (Ib) is the symmetrical ac component of the short circuit current at the instance of contact separation of the circuit breaker. The PM7000 quotes this at 90ms. Circuit breakers on distribution networks are normally always slower to operate than 90ms, including protection detection timings, so this represents a conservative value as the decaying ac component will still be decaying and may not be negligible.
The initial symmetrical short circuit current (Ik’’) is the rms value of the ac
symmetrical component of the prospective short circuit current at time zero. Figure 2-1 shows a “near to generator” short circuit current where the effect of a synchronous generator or induction motor causes the symmetrical short circuit current to decay from an initial value of Ik
’’ to a steady state value of Ik. In distribution networks far from sources of synchronous generators or large induction motors then there is minimal decaying symmetrical component and Ik = Ik
’’.
The decaying aperiodic component idc is the mean value between the top and bottom of the envelope, Figure 2-1, and has an initial value A. In distribution networks (with low X/R ratios) this value decays relatively quickly compared to transmission networks (which have high X/R ratios).
The PM7000 records the peak make (ip) and the rms break (Ib) currents.

SDRC-9 Closed-Loop Operation FLMs & FLMTs
FL Equipment
Page 8 of 76
Engineering Recommendation G74 defines a procedure for calculating short circuit currents. One of the problems DNOs face in this calculation is understanding customer contribution to short circuit currents. For new generator connections this information is provided by the customer on the G59 connection application form. However, DNOs might not have detailed information for legacy connections or demand connections which may contain significant source of short circuit infeed from induction motors. For induction motors forming part of the general load where detailed information is not available G74 recommends the following indicative allowances are used for calculating the initial symmetrical rms short circuit current (Ik
’’) at 33kV busbars:
for load connected at LV allow 1 MVA/MVA of aggregate LV network substation winter demand
for load connected at HV allow 2.6 MVA/MVA of aggregate winter demand
One of the aims of this SDRC is to determine what MVA per MVA values are applicable at 11kV busbars at primary substations with different load mixes (domestic /commercial/industrial) based on fault level measurements.
Figure 2-1: Short circuit current of a near to generator short circuit with decaying ac component (extract from IEC 60909)

SDRC-9 Closed-Loop Operation FLMs & FLMTs
FL Equipment
Page 9 of 76
Fault Level Headroom 2.3
In this section we compare measured fault levels against the traditional method of using modelled data and determine what fault level headroom is available at each substation. Following the principles of alternative connections already established, discussed in detail in Section 3, data is required to enable customers to understand their potential capacity for connection to the network. Two methodologies have been employed, the first is to understand the 95th percentile of the highest continuous reading and the second is the average fault level over a specific period of time.
2.3.1 95th Percentile Analysis
More than 12 months of fault level data has been collected and analysed for all sites. Results for ADs are shown in Figure 2-2 to Figure 2-12 (peak make measurements are shown in the left hand graph and rms break measurements in the right hand graph). The following three lines are shown on each graph:
95th percentile. It can be observed that the AD measurements are distributed around a mean value. We take the 95th percentile of the highest continuous reading whilst the substation is operating in split configuration as the measured value. This gives us a conservative figure for the maximum measured fault level.
Modelled. This is the number published in our 2015 Long Term Development Statement. This represents the maximum fault level that we have calculated using the G74 method from our 2015 network model.
Design fault level. These are the fault levels that we design our systems to not exceed and are currently 625MVA (33.4kA) for peak make, and 250MVA (13.1kA) for rms break.
The measured 95th percentile and headroom are summarised in Table 2-1 for peak make and Table 2-2 for rms break values. The headroom is defined as: Headroom (%) = (Design Fault Level (kA) – Measured 95
th percentile (kA)) * 100 / Measured 95
th percentile (kA)
It represents additional capacity for increased fault level at the primary substation. The fault levels shown in Table 2-1 and Table 2-2 are for the situation when the substation is operating in split mode rather than parallel mode. In split mode, the busbar is supplied by a single transformer feeder. In parallel mode, the busbar is supplied by more than one transformer feeder. The measured mean, measured 95th percentile and modelled values are shown in Table 2-3 and Table 2-4.

SDRC-9 Closed-Loop Operation FLMs & FLMTs
FL Equipment
Page 10 of 76
Measured 95
th percentile / kA Headroom / %
Bartley Green 21.3 35.1
Castle Bromwich 28.3 13.7
Chad Valley 23.1 29.6
Chester Street 21.8 33.5
Elmdon 21.6 34.1
Halls Green 21.7 33.8
Kitts Green 32.2 1.8
Ladywood 21.5 34.5
Nechells West 37 -12.8
Shirley 18.9 42.4
Table 2-1: AD Peak Make Headroom per substation
Measured 95
th percentile / kA Headroom / %
Bartley Green 8.4 35.9
Castle Bromwich 11.4 13.0
Chad Valley 9.4 28.2
Chester Street 10.0 23.7
Elmdon 7.8 40.5
Halls Green 8.5 35.1
Kitts Green 12.5 4.6
Ladywood 7.4 43.5
Nechells West 13.4 -2.3
Shirley 9.6 26.7
Table 2-2: AD RMS Break Headroom per substation
Measured Mean / kA Measured 95
th percentile / kA Modelled / kA
Bartley Green 19.3 21.3 21.7
Castle Bromwich 25.3 28.3 28.3
Chad Valley 21.8 23.1 25.8
Chester Street 19.8 21.8 21.4
Elmdon 19.8 21.6 18.4
Halls Green 20.1 21.7 22.6
Kitts Green 29.1 32.2 24.7
Ladywood 19 21.5 18.0
Nechells West 32.9 37 34.8
Shirley 17.9 18.9 17.6
Table 2-3: AD Peak Make Measured and Modelled
Measured Mean / kA Measured 95
th percentile / kA Modelled / kA
Bartley Green 7.7 8.4 7.6
Castle Bromwich 10.0 11.4 9.9
Chad Valley 9.1 9.4 9.0
Chester Street 9.2 10.0 7.9
Elmdon 7.3 7.8 6.5
Halls Green 8.0 8.5 8.0
Kitts Green 11.3 12.5 8.5
Ladywood 6.8 7.4 6.1
Nechells West 12.2 13.4 11.6
Shirley 9.2 9.6 6.2
Table 2-4: AD RMS Break Measured and Modelled

SDRC-9 Closed-Loop Operation FLMs & FLMTs
FL Equipment
Page 11 of 76
Data Observations
Significant headroom is available during split operation at all substations apart from Kitts Green and Nechells West;
At Nechells West the design fault level appears to be exceeded by nearly 13%. However, a customer that has both significant load and generation connected to the system as a historic fault current limiting device (Is Limiter) connected to their device and this only operates under fault conditions to limit the flow of fault current (by 5kA), therefore, the maximum fault level is 32kA;
At Kitts Green, Figure 2-3, the fault level is consistently high except for short periods which coincide with demand dips from a nearby large industrial customer occurring during holiday periods (Christmas / New Year and during and a fortnight in the summer). At these times the actual disturbance drops to a value which coincides closely with the measured natural disturbance and modelled fault level. This relates to the presence of a large load customer, with a significant amount of induction motors connected, which contribute to the total network fault level. The variance in monitored and modelled data suggests that the load connection has not been fully considered. This is examined in more detail in the following sections; and
At Castle Bromwich, Figure 2-4, and Chester Street, Figure 2-5, the substation is operated in either split or parallel mode. Whilst in parallel mode it can be observed that the fault levels exceed the design fault level. This is due to the fact that the parallel network operation has occurred following the connection of Fault Current Limiters (FCL) at each site. The reason that the value is not limited is because the devices are only high impedance during a network fault and therefore the FLM cannot consider their impedance. This has been accounted for in the modelling requirements of these sites, as reported in SDRC-8.
Chad Valley and Hall Green’s 95th percentile data are both less than that of the modelled data. This would suggest that the general modelling principles used to estimate the contribution of load connected to the system are greater than the actuals for these two sites.

SDRC-9 Closed-Loop Operation FLMs & FLMTs
FL Equipment
Page 12 of 76
Figure 2-2: Bartley Green actual disturbance fault levels
Figure 2-3: Kitts Green actual disturbance fault levels

SDRC-9 Closed-Loop Operation FLMs & FLMTs
FL Equipment
Page 13 of 76
Figure 2-4: Castle Bromwich actual disturbance fault levels
Figure 2-5: Chester Street actual disturbance fault levels

SDRC-9 Closed-Loop Operation FLMs & FLMTs
FL Equipment
Page 14 of 76
Figure 2-6: Elmdon actual disturbance fault levels
Figure 2-7: Halls Green actual disturbance fault levels

SDRC-9 Closed-Loop Operation FLMs & FLMTs
FL Equipment
Page 15 of 76
Figure 2-8: Kitts Green actual disturbance fault levels
Figure 2-9: Ladywood actual disturbance fault levels

SDRC-9 Closed-Loop Operation FLMs & FLMTs
FL Equipment
Page 16 of 76
Figure 2-10: Nechells West actual disturbance fault levels
Figure 2-11: Chad Valley actual disturbance fault levels

SDRC-9 Closed-Loop Operation FLMs & FLMTs
FL Equipment
Page 17 of 76
Figure 2-12: Shirley actual disturbance fault level

SDRC-9 Closed-Loop Operation FLMs & FLMTs
FL Equipment
Page 18 of 76
Average Value Analysis 2.4
In order to arrive at a usable fault level it is important to understand the average value of fault level that is seen at a particular, monitored, section of 11kV network. Using the previous six months fault level data at each site the following averages for rms break fault levels have been gathered.
Table 2-5: Average Break Fault Levels
Site Average
Break Values (kA)
Bartley Green 7.41
Bournville 8.00
Castle Bromwich 10.23
Chad Valley 8.98
Chester Street 9.21
Elmdon 7.43
Hall Green 8.83
Kitts Green 11.24
Ladywood 6.81
Nechells West 12.18
Shirley 7.11
Using this data and comparing it to the design fault level of 13.1kA, and a generator infeed value of 4.5MVA/MVA, which is a typical fault infeed for a Combined Heat and Power (CHP) unit, this illustrates that a potential additional 198MVA of generation could be included on the Birmingham 11kV network. This only considers the fault level impact on the network and not the requirements for any thermal or voltage limitations being reached. Taking a conservative approach to the times where the fault level is greater than the average and approaching the 95th percentile values it can be considered that seventy five percent of the generation would be able to connect to the network, which is a value greater than 150MW. During the production of the bid for project funding the projected capacity connection benefits of Method Alpha and Gamma were 11.2MW, it can be seen that a conservative approach to this connection capacity is 15MW per substation. The availability of real-time fault level data enables this capacity to be released, enabling a move away from worst case planning and operational techniques. The flexible connection methodologies, described in Section 3, will enable additional customers to flexibly connect to these specific networks in addition to the 15MW per substation.

SDRC-9 Closed-Loop Operation FLMs & FLMTs
FL Equipment
Page 19 of 76
MVA per MVA analysis and trends 2.5
This section aims to determine what MVA per MVA general load fault infeed values are applicable at 11kV busbars at primary substations with different load mixes (domestic /commercial/industrial) and to examine trends. This enables design engineers to move away from one of two fixed values explained as part of G74, wither 1MVA/MVA or 2.6MVA/MVA dependant on the voltage level and merging of load approach adopted. Moving towards a site specific MVA per MVA general load infeed value will ensure that the network is modelled and managed as appropriately and efficiently as possible. In order to provide appropriate validation two methods have been used to determine MVA per MVA:
Method 1 – The following data sources are used: o Upstream infeed fault levels at the 11kV primary busbars are taken from the
EHV network models; o Total fault levels at 11kV primary busbars are taken from the FLM ADs
measured; and o Current and voltage measurements are taken from the primary substation
that are converted into an MVA demand value; and o A period of time is chosen over which to average the source data that is then
fed into a G74 algorithm which iteratively adjusts an MVA/MVA infeed value until the fault level value calculated matches an averaged AD measurement. These averages are taken over a one month period to yield the following data sets: one month, weekday, weekend, midnight, 06:00, noon and 18:00.
Method 2 – Rather than using our EHV network models, upstream infeed fault levels are taken from the FLM ND measurements. A period of time is chosen over which to average source data (generally a single day where the network is to be in a known switching configuration). The downstream fault level infeed is determined by subtracting the averaged ND value from the AD value. This is divided by the demand in order to determine the MVA/MVA.
2.5.1 Method 1 results
Utilising the enhanced network model, created as part of the project, to understand the MVA per MVA values at each substation, by generating new values on a monthly basis has enabled the graph, Figure 2-13, to be captured. For the first time a historic trend of general load fault level infeed has been able to be gathered, periodically, for a range of 11kV substations. Table 2-6 illustrates the average monthly data along with any change in value at weekends, which would illustrate a heavy industrial and commercial area, or the fault level being higher at night rather than in the day which would indicate resistive load connecting to the network in the day, such as domestic appliances. Where this phenomenon is seen along with a high MVA per MVA fault level infeed it would suggest a single heavy industrial customer surrounded by lighter commercial, such as shops, and domestic loads.

SDRC-9 Closed-Loop Operation FLMs & FLMTs
FL Equipment
Page 20 of 76
Figure 2-13: One month average MVA per MVA
Substation Average 1
month MVA/MVA
Weekend higher than weekday MVA/MVA
00:00 and 06:00 higher than 12:00 and 18:00
Customer Load Distribution
Domestic Small Commercial / Industrial
Large Commercial / Industrial
CASB 1.6
No No 12.75% 8.06% 79.19%
NECW 14.6 Yes Yes 24.85% 22.50% 52.64%
CHES 9.5 Yes Yes 9.79% 30.07% 60.14%
ELMD 3.2 No No 3.86% 20.81% 75.33%
KITG 6.1 No Yes 19.08% 8.91% 72.01%
HALG 1.9 No No 38.08% 15.86% 46.06%
SHIR 9.6 Yes Yes 34.24% 16.82% 48.94%
LADW 2.7 No No 16.36% 17.03% 66.61%
BOVI 0.8 No No 54.26% 31.98% 13.76%
BARG 0.7 No No 61.53% 12.94% 25.53%
CHAV 0.8 No No 51.48% 26.51% 22.01% Table 2-6: MVA per MVA averages compared to load mix
1
It can be seen that if the domestic component of the load connected to a section of substation is greater than fifty percent the MVA per MVA value is between 0.7 and 0.8. Whilst being 20 to 30 percent lower than the G74 recommendations of 1.0MVA/MVA, utilising this as a conservative domestic fault infeed value is appropriate. To investigate the substations with a greater contribution of commercial and industrial loads the consideration of the weekend and day / night data must be included. Considering commercial and industrial sites there is a clear split between substations that have a noticeable difference between night and day data. The substations that do not are; CASB, HALG, LADW and ELMD and the sites that do are; CHES, SHIR, NECW and KITG. The one outlier however is KITG as it doesn’t appear to specifically change between the week and weekend, which on further investigation contained a single heavy industrial (steelworks) site that operated heavy machinery 24 hours a day, hence no considerable reduction in weekend values. The average
1 Load type percentages based on kWh meter readings for each customer type

SDRC-9 Closed-Loop Operation FLMs & FLMTs
FL Equipment
Page 21 of 76
for the industrial sites with no tangible weekend variation is 2.35MVA/MVA and for the ones with is 9.95MVA/MVA. This learning has provided a clear methodology for the production of specific general load infeed values based on the types of load connected to the substation.
Method 1 Learning Points
During the data analysis phase there were instances where the fault level of the upstream network, from the 11kV network to National Grid’s (NG) network, was greater than the combined fault level from the FLM. This is suspected to be due to the granularity of data and operating regimes of the NG network. A recommendation is to more regularly share data between NG and DNOs.
Significant effort was put in to ensuring that all the generation connected to each of the substations’ 11kV networks was gathered to ensure that it did not erroneously contribute to the general load infeed, however, some data, such as NECW (14.6) would suggest that there is some un-modelled generation on the network. Without this value the average infeed value for large commercial sites that vary at the weekend and time of day is 8.4MVA/MVA.
2.5.2 Method 2 Results
Taking the learning from Method 1 it can be seen that there are three clear MVA per MVA sets. To demonstrate Method 2 a substation from each of the three sets were considered:
Elmdon – Largest commercial and industrial load as a percentage in the non-weekend varying industrial set;
Chad Valley – Lowest domestic load as a percentage in the domestic set; and
Kitts Green – Lowest general load infeed in the night greater than day industrial set.
Elmdon Measurements of peak make ND and AD fault levels are shown in Figure 2-14. It can be clearly seen that there is greater precision in the AD data over that of the ND, through the bandwidth of results considered. It can be seen that there is no noticeable variation in fault levels across the seasons.
The demand on the section of the 11kV network with the FLM connected varies between 5 and 12MVA over the period considered. This is shown in Figure 2-15. In order to examine the relationships between demand, fault level and load types the data has been examined in more detail on two specific days: one that is close to winter maximum demand (17 February 2016) and one that is close to summer minimum demand (1 August 2016). Operational switching logs from PowerON were examined to establish that section of network to be considered is operating under its normal running arrangement and that normally open points on the 11kV network are not closed for these days.
With each ND or AD fault level measurement the FLM reports a plus or minus uncertainty value. These are reflected on subsequent graphs as standard deviations error bars.

SDRC-9 Closed-Loop Operation FLMs & FLMTs
FL Equipment
Page 22 of 76
Focusing on the ND data for these two days, left hand plots in Figure 2-17 and Figure 2-18, we can see that the mean ND peak make fault level is slightly higher on the winter day (16.1kA) than the summer day (15.3kA). However, the error bars and standard deviation on both days suggest that these values could be within the same data set due to expected tolerances in the results from the FLM and network data.
The AD data, right hand plots in Figure 2-17 and Figure 2-18, shows an AD peak make fault level on the winter day of 20.3kA and on the summer day of 20.1kA. This data suggest that the days considered are in fact the same in respect of fault level data.
What is noticeably significant is that the difference between the AD and the ND fault levels is up to 5kA. This represents the downstream contribution to fault levels at the substation. Demand on this section of network varies between 7 and 10 MVA on the winter day, left hand plot Figure 2-16, and between 6 and 9MVA on the summer day, right hand plot. However, we do not see the AD fault levels varying significantly over the 24 hour winter or the 24 hour summer period; whatever is causing the 5kA fault level contribution is not contained within the load being switched in and out over these periods (i.e. it must be within the base load). If we consider the base load of 6MVA, the downstream contribution would be equivalent to 5 MVA/MVA to the initial symmetrical rms fault level. The load mix on the feeders monitored by the FLM is dominated by commercial and light industrial customers rather than domestic, and there is minimal embedded generation.
Examining the 90ms rms break fault levels provides further insight, Figure 2-19 to Figure 2-21. At 90ms the contribution to fault currents from induction machines is far smaller than synchronous machines. ND RMS break fault levels fluctuate between 6 and 7kA, although there is an unusual period between January and April 2016 where they suddenly fall to between 5 and 6kA. AD RMS break fault levels fluctuate between 7 and 8kA; no sudden change is seen between January and April 2016. The difference between the measured AD and ND is approximately 2kA (4MVA) on the winter day and 1kA (2MVA) on the summer day. This indicates that there is a small contribution (<0.5MVA/MVA) to the rms break fault level from the downstream network. This information together with the 5MVA/MVA initial symmetrical rms fault level, knowledge of the load mix and embedded generation connected forms a characteristic strongly suggesting this fault level infeed coming from induction motors.
5MVA/MVA represents a maximum infeed value for the initial symmetrical rms fault level. A minimum infeed value can be derived by using the maximum demand value; this would be in the order of 3MVA/MVA. This is slightly higher than the 2.6MVA/MVA of aggregate winter demand given in G74 for HV customers (generally considered to be medium/large industrial and commercial) and correlates with the value produced as part of Method 1, 3.2MVA/MVA.

SDRC-9 Closed-Loop Operation FLMs & FLMTs
FL Equipment
Page 23 of 76
Figure 2-14: Peak Make ND and AD Feb 2015 – July 2016

SDRC-9 Closed-Loop Operation FLMs & FLMTs
FL Equipment
Page 24 of 76
Figure 2-15: Bus Section ‘C’ Demand, Feb 2015 – July 2016
Figure 2-16: Bus Section ‘C’ Demand, 17 February 2016 and 1 August 2016

SDRC-9 Closed-Loop Operation FLMs & FLMTs
FL Equipment
Page 25 of 76
Figure 2-17: Peak Make ND and AD, 17 February 2016
Figure 2-18: Peak Make ND and AD, 1 August 2016

SDRC-9 Closed-Loop Operation FLMs & FLMTs
FL Equipment
Page 26 of 76
Figure 2-19: RMS Break ND and AD Feb 2015 – July 2016

SDRC-9 Closed-Loop Operation FLMs & FLMTs
FL Equipment
Page 27 of 76
Figure 2-20: RMS Break ND and AD, 17 February 2016
Figure 2-21: RMS Break ND and AD, 1 August 2016

SDRC-9 Closed-Loop Operation FLMs & FLMTs
FL Equipment
Page 28 of 76
Chad Valley
At Chad Valley no seasonal variations are seen in fault levels and the increased precision of the AD measurements compared to the ND measurements is clear; demonstrated in Figure 2-22. Focusing on a day of winter maximum demand and summer minimum demand shows a mean ND and AD of 22kA. Demand on the feeders monitored by the FLM varies between 5MVA and 10MVA on the winter day and between 4MVA and 6MVA on the summer day. The close relationship between the ND and AD suggests that the fault level value is dominated by up-feed sources and therefore the MVA per MVA infeed value of the general load on the network is small. The G74 recommendation of an initial three phase symmetrical rms short-circuit contribution of 1.0 MVA per MVA of aggregate low voltage network substation winter demand (a value generally applied to domestic load) is therefore appropriate.

Page 29 of 76
SDRC9 Closed-Loop Operation FLMs & FLMTs
Figure 2-22: Peak Make ND and AD at Chad Valley Feb 2015 – July 2016

Page 30 of 76
SDRC9 Closed-Loop Operation FLMs & FLMTs
Figure 2-23: Peak Make ND and AD at Chad Valley on a winter maximum demand day
Figure 2-24: Peak Make ND and AD at Chad Valley on a summer minimum demand day

Page 31 of 76
SDRC9 Closed-Loop Operation FLMs & FLMTs
Kitts Green
At Kitts Green the mean AD is generally larger than the mean ND by approximately 8kA, as shown in Figure 2-25. However at certain periods in the year the AD dips to a value similar to that of the ND. These periods coincide with large demand dips from a nearby large high voltage (HV) industrial customer generally occurring during holiday periods; Christmas / New Year and a fortnight in the summer. From this we can conclude that the majority of downstream fault level infeed is caused by this one customer. Examining the changes in demand and fault level during and after the holiday period shows very large initial three phase symmetrical rms short-circuit contribution of between 7 and 9 MVA/MVA from this one customer. This would imply that the load causing this fault level contribution is mainly motors.
An additional learning can be taken from Figure 2-25: the precision of ND measurements are much higher when the large industrial customer is consuming load. This is likely to be caused by switching of large loads by the customer causing higher measured voltage step changes leading to higher precision and potentially more accurate ND measurements.

Page 32 of 76
SDRC9 Fault Level and MVA/MVA Analysis
Figure 2-25: Peak Make ND and AD at Kitts Green Feb 2015 – Aug 2016

SDRC-9 Closed-Loop Operation FLMs & FLMTs
FL Equipment
Page 33 of 76
Estimation of MVA per MVA at other substations 2.6
Fault level studies generally concentrate on determining minimum and maximum fault levels. The figures in Table 2-7 can be used to represent fault level infeed from general load and plant in the downstream network. Where large industrial customers are present, the investigation to date suggests a fault level infeed value of 8.4MVA/MVA would be suitable, however, due to the varying nature of a single heavy industrial customer information should be sought as to their motor loads and modelled explicitly, otherwise modelled fault levels could be over or underestimated. The same explicit modelling applies to G59 connected generation.
MVA per MVA contribution to initial three phase symmetrical RMS short circuit contribution
Minimum Maximum
High proportion domestic demand 0.1 1
Industrial / Commercial load non night / day variation
3 5
Industrial / Commercial load night / day variation
8 10
(Model explicitly where possible)
G59 connected generation Model explicitly Table 2-7: Indicative values to be used for contribution of general load to 11kV primary busbar fault levels
As G74 is clear that the recommendations for general load fault level fault infeed are in the absence of site specific data these values are now being implemented in the Birmingham area and to under the requirements to more widely adopt them across WPD.

SDRC-9 Closed-Loop Operation FLMs & FLMTs
FL Equipment
Page 34 of 76
3 FLM Data in to WPD’s Systems and Operation
As well as utilising the FLM data, as discussed in the previous section, to provide more granular MVA/MVA values another key element of the project is to make the real-time FLM data available to PowerON and the control engineers. This data will further enhance the network information available for decision making as well as providing input values for systems capable of autonomously controlling connected customers around network constraints. This section documents the processes taken to provide real-time FLM data to the NMS and the control and operation procedures associated with this.
Data Integration 3.1
During initial commissioning of the FLMs it was determined that the data gathered would be held on an online system; this afforded product suppliers and third parties to have direct, view only, access to the data. In order to enable the FLM data to be viewed in WPD’s standard NMS the data paths had to be transferred to WPD’s standard system. This was carried out in two parts. The FLM data was originally stored on Nortech’s online iHost system so this data was re-routed to WPD’s in house offline iHost server. In order to facilitate the communications facilities had to be updated at each of the 10 sites, which involved FLM device firmware upgrades and SIM card changes. Once the transfer of FLM data in to WPD’s offline iHost server was complete and it was confirmed that the connection was robust and secure the second phase was undertaken, which was to transfer the data to WPD’s iHost server that directly communicates with the NMS and would allow the data to be directly presented on this system.
Figure 3-1 - FLM Control Cubicle

SDRC-9 Closed-Loop Operation FLMs & FLMTs
FL Equipment
Page 35 of 76
FLM Control 3.2
With data from the FLM now available in the WPD NMS connected IHost a standard NMS schematic insert was developed and embedded adjacent to the FLM schematic on the network diagram, see Figure 3-2, which allowed control engineers to view the latest fault level data held within IHost. The insert displayed the latest ‘AD Peak Fault Level’ value and the ‘AD RMS Fault Level’ value together with the last update time as taken from IHost. This detail was added as throughout the project the standard Artificial Disturbance operation time had been set at every six hours therefore it was seen as important that the control engineer understood how up-to-date the information was they had available.
Figure 3-2 - NMS Interface
The ‘AD Update’ was subsequently developed to allow control engineers to undertake a manual update of the fault level values to provide a more real-time view. The AD update function effectively gives the control engineers access to the Intellirupter operation. To develop the ‘AD Update’ functionality, updates to the Envoy, IHost and NMS were required. Nortech were commissioned to carry out the necessary development works to IHost and the Envoy and worked closely with the WPD NMS support team to establish the necessary additional communications links between IHost and NMS. ‘AD update’ developments were first trialled using the NMS test system with Nortech undertaking their development offline. In order to roll-out the developments online to the Nechells West site an outage of the FLM was arranged an on-site attendance with Nortech together with availability of the NMS support team at an office location. The outage was required to isolate the ‘Intellirupter’ from the network to test the ‘on-demand’ functionality without introducing unnecessary disturbances on to the network. This was carried out successfully on the 10th November. In line with the development of the ‘on-demand’ functionality the policy OC1V covering the ‘Operation and Control of 11kV Network Fault Level Monitors (FLMs) for use on the FlexDGrid project’ has been updated. The updates cover the guidance on the displayed data and how to update it.

SDRC-9 Closed-Loop Operation FLMs & FLMTs
FL Equipment
Page 36 of 76
Parallel Network Operational Assessment 3.3
Building on the functionality established in section above for control engineers to gain real-time fault level data a standardised process was then established which can be implemented at FLM enabled 132kV/11kV substations to determine if the site can safely operate in parallel. Parallel operation refers to the operation of two or more primary transformers through a closed bus-section or interconnector. Figure 3-4 illustrates the normal operating arrangement where GT1 and GT2 operate are in split configuration (bus-section A-B open).
Figure 3-3: AD FLM dashboard shown in WPD's PowerON system

SDRC-9 Closed-Loop Operation FLMs & FLMTs
FL Equipment
Page 37 of 76
Figure 3-4: Typical running arrangement of a primary substation in Birmingham
There are a number of advantages when running the system in parallel compared with split configuration. In particular, the security of supply is increased for customers connected to busbar A and B, as parallel configuration ensures that for loss of any incoming supply no supplies are lost. However, due to the low network impedance from source to 11kV busbar, the fault levels during parallel operation can often exceed equipment ratings. Using on-demand FLM data it is possible to obtain a more accurate understanding of real time fault levels with respect to network configuration and load / generation conditions, compared to modelling alone.
3.3.1 Parallel operation fault level assessment using AD FLM
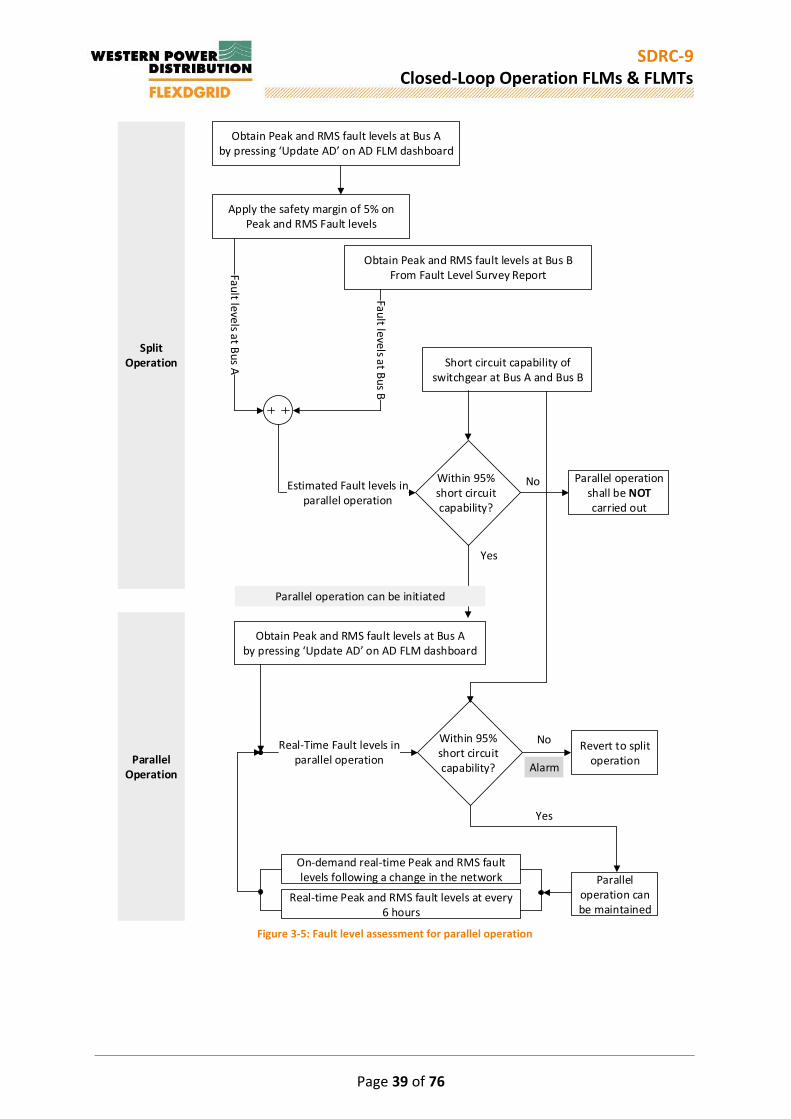
The following process has been created and details what needs to be undertaken to evaluate whether system fault levels remain within switchgear capabilities when bus-section A-B is closed and transformers GT1 and GT2 are in parallel. Stage I: Pre-Parallel Operation (bus-section A-B is open)
Step 1 – Control Engineer operates the AD FLM device by pressing ‘AD Update’ to obtain the real time AD Peak and AD RMS fault levels at Busbar A. Step 2 – Increase the AD Peak and AD RMS fault levels by applying a 5.0% safety margin which represents the accuracy of the AD FLM device. i.e. the FLM fault level values need to be multiplied by a 1.05 factor. Step 3 – Obtain the estimated Peak and RMS Break fault levels at Busbar B from the latest Fault Level Survey Report provided by Primary System Design team (this is produced as part of business as usual activities on a monthly basis).

SDRC-9 Closed-Loop Operation FLMs & FLMTs
FL Equipment
Page 38 of 76
Step 4 – Estimate the Peak fault levels in parallel operation by summing up the Peak fault level at Busbar A (Obtained in Step 2) and Peak fault level at Busbar B (Obtained in Step 3). Step 5 – Estimate the RMS Break fault levels in parallel operation by summing up the RMS Break fault level at Busbar A (Obtained in Step 2) and RMS Break fault level at Busbar B (Obtained in Step 3). Step 6 – Compare the estimated Peak fault level and RMS Break fault level with Peak and Break short circuit capabilities of the switchgear at Busbar A and Busbar B. If the estimated fault levels are within 95% switchgear capabilities then parallel operation can be implemented.
Stage II: Post-Parallel Operation (bus-section A-B closed)
Step 1 – Control Engineer operates the AD FLM device by pressing the ‘AD Update’ to obtain the AD Peak and AD RMS fault levels. Step 2 – Compare the estimated Peak fault level and RMS Break fault level with Peak and Break short circuit capabilities of the switchgears at Busbar A and Busbar B. If the estimated fault levels are within 95% switchgear capabilities then parallel operation can be maintained, otherwise the connection arrangement shall be reverted back to split operation. Step 3 (on going) – The FLM will continue to pulse at a prescribed interval and provide new fault level data based on the network configuration and load/generation conditions. Should the fault level values exceed 95% of the equipment ratings, an alarm shall be generated to inform the control engineer that parallel operation is no longer possible. In addition, the control engineer can also initiate an on-demand operation of the FLM should there be an immediate change in network configuration or load/generation conditions which could have an impact on fault level.
The process for fault level assessment for parallel operation is shown in Figure 3-5.
SDRC-9 Closed-Loop Operation FLMs & FLMTs
FL Equipment
Page 39 of 76
Figure 3-5: Fault level assessment for parallel operation
Split Operation
Parallel Operation
Obtain Peak and RMS fault levels at Bus Aby pressing ‘Update AD’ on AD FLM dashboard
Apply the safety margin of 5% on Peak and RMS Fault levels
Obtain Peak and RMS fault levels at Bus BFrom Fault Level Survey ReportFa
ult le
vels a
t Bu
s A
Fault levels at Bus B
Short circuit capability of switchgear at Bus A and Bus B
Estimated Fault levels in parallel operation
No
Yes
Parallel operation shall be NOT carried out
Obtain Peak and RMS fault levels at Bus Aby pressing ‘Update AD’ on AD FLM dashboard
Within 95% short circuit capability?
NoRevert to split
operation
Within 95% short circuit capability?
Parallel operation can be maintained
Yes
On-demand real-time Peak and RMS fault levels following a change in the network
Alarm
Real-time Peak and RMS fault levels at every 6 hours
Parallel operation can be initiated

SDRC-9 Closed-Loop Operation FLMs & FLMTs
FL Equipment
Page 40 of 76
Customer Connections using FLM Data 3.4
Following the provision of real-time FLM data in to PowerON the opportunity to flexibly connect customers, based on the FLM data, becomes available. Significant work, within WPD, has taken place to make available alternative connections to customers based on voltage and current / thermal issues, the principle of offering connections to customers using FLM data must be consistent with the existing policies and procedures in place. Figure 3-6 shows a signal line diagram of generic piece of network constrained by thermal issues at times of high downstream generation on the two transformers running in parallel at the top of the diagram. Using the current WPD alternative connection policies and procedures, a system could be established in the area which would monitor load through the two transformers in real-time and allow for further generation to be connected downstream provided that the connected generator accepts a certain level of curtailment at times peak transformer reverse power flows.
Figure 3-6: FLM Constrained Network Example
If we now assume that the network is still constrained at that location but for Fault Level issues rather than thermal, it can be seen that, by replacing the real-time power flow data with real-time Fault Level data, very similar principles can used. Customers will benefit from this approach as the customer facing aspect (Application, Offer & On-Site Interface) of the process will remain the same as current offerings. Operationally there are some differences between how thermal and fault level constraints are dealt with and these have been addressed in the appropriate internal policies.

SDRC-9 Closed-Loop Operation FLMs & FLMTs
FL Equipment
Page 41 of 76
WPD’s existing alternative connections offerings consist of four options, Active Network Management, soft-intertrip, timed and export limiting. Following preparatory investigation into the suitable solutions for fault level related customer connections the soft-intertrip solution was selected as the most appropriate to expand in to. It was found that the current data availability from the Fault Level Monitors does not give enough visibility for full Active Network Management operation. Export limiting and timed connections do not have remote monitoring to enable these options to be expanded around fault level constraints. 3.4.1 Soft-Intertrip
Soft-intertrip is a current WPD offering on networks which are constrained due a single upstream asset requiring reinforcement, or a single limit being infringed under certain conditions. Through monitoring these conditions, further capacity can be released when these limits or assets are within normal operating parameters. Once installed, the on-site soft-intertrip RTU will provide two normally open contacts for the customer’s control system to monitor; Stage 1 and Stage 2. When both sets are open, the connection will be free of constraints. The levels of curtailment corresponding to the operation of the Stage 1 and Stage 2 contacts are defined at the planning stage. Fault level constraints fit well with the existing soft-intertrip philosophy and the existing generator constraint panel can be used to control customers’ generators with only a change to the measured thresholds and timers. A significant difference between a thermal soft-intertrip scheme and a fault level scheme is that no Power-On Fusion Sequence switching Scheme is required for a fault level application. Sequence switching scheme code sits internally within Power-On and can be written and updated internally by control support engineers, the code can be written such that it takes simple control actions based the Power-On Fusion analogue values. The sequence scheme is core to a thermal soft-intertrip alternative connection as it is set to monitor, for example, transformer power flow, and will automatically constraint selected customers once a certain threshold value is reached. The reason for the fault level soft-intetrip scheme not requiring a hard coded sequence scheme is due to the control engineer must still have the final say before a parallel is made because the fault level on the network on to which the parallel is being made is unknown. 3.4.2 Customer Actions
A similar approach as described in Section 37 can be used to identify customer applications where fault level monitoring may be more appropriate than conventional reinforcement giving greater customer options over connection types. Using the enhanced network model and incrementally increasing fault levels on the constrained section of network a point is reached where the customers load or generation causes a potentially unsafe parallel operation. Using these values as a marker a table can be included on the NMS detailing what mitigating actions should be undertaken in order to undertake a safe parallel operation based on the real-time Fault Level Monitor Values. Table 3-1 provides an example of the data to be presented.

SDRC-9 Closed-Loop Operation FLMs & FLMTs
FL Equipment
Page 42 of 76
FLM Value (kA) Mitigating Actions
≤10.674 Bus-Section Z-Y Open
10.675 to 12.703 4.7MVA CHP Disconnected
Bus-Section Z-Y Open
12.190 to 12.704 800kVA Gas Generator Disconnected
4.7MVA CHP Disconnected Bus-Section Z-Y Open
≥12.705 No Acceptable Mitigating Actions Available
Table 3-1 - Customer Actions around Fault Level Constraints
In order to facilitate this control on site WPD standard generator constraint panels can be installed at the customer’s site to enable the control engineer to disconnect or isolate the customer’s plant if required.
Figure 3-7: Constraint Panel Schematic

SDRC-9 Closed-Loop Operation FLMs & FLMTs
FL Equipment
Page 43 of 76
Before accepting an alternative connection over a conventional connection the customer must first weigh up the potential risk of curtailment against savings in reinforcement costs and timescales. For the current alternative connection suite a curtailment study is undertaken for every application and the results included within the alternative connection offer. The curtailment study models what impact the proposed connection will have on the existing network and calculates how often the the new connection will potentially need to be curtailed around significant “pinch points” to avoid large scale reinforcement. The study gives an indication of both times of curtailment together with anticipated energy curtailed, it is stressed that the study is an indication only on historical data and the customer must undertake their own due diligence in order to satisfy themselves of the risk, including any future external factors that may change. Using the historically collected fault level values collected by the FLM as part of FlexDGrid together with experience built on previous alternative connection curtailment studies, it is now possible for analysis to be undertaken to give the customer a view of expected times in which they may be curtailed around fault level constraints. An example of the curtailment studies to be provided to customers for flexible FLM connections is shown in Figure 3-8.

SDRC-9 Closed-Loop Operation FLMs & FLMTs
FL Equipment
Page 44 of 76
Figure 3-8: Example Curtailment Study

SDRC-9 Closed-Loop Operation FLMs & FLMTs
FL Equipment
Page 45 of 76
In order to facilitate the customer connection options the existing policies have been reviewed and updated where appropriate, as detailed below. Relating to Soft-Intertrip Schemes – Standard Technique OC9E Standard technique OC9E sets out the process and procedures followed by the Control Centres when creating and managing Soft-Intertrip Control Schemes. This policy was updated to include the principles for managing Fault Levels using the existing WPD Soft-Intertrip philosophy. Relating to Managing Processes for Alternative Connections – Standard Technique SD10/2 Standard Technique SD10/2 covers policy for managing processes directly relating to alternative connections. The policy was updated to include the ‘Smart Mitigation’ available around Fault Level Constraints i.e. Introduce Fault Level Soft Intertrip Scheme. The table containing location suitability for alternative connections has also been updated to cover Soft-Intertrip (Fault Level).
Relating to the Process of Offering a Soft-Intertrip Connection – Standard Technique: SD10B Standard Technique SD10B which relates to the process for offering a Soft-Intertrip Connection has been reviewed and found not to require any updates for the provision of the system around Fault Level Constraints. Application of Generator Constraint Panels – Standard Technique: TP18A Standard Technique TP18A which relates to the Application of Generator Constraint panels was produced during the lifetime of FlexDGrid and therefore considered the future requirements of Fault Level response functionality and therefore did not require any further updates.

SDRC-9 Closed-Loop Operation FLMs & FLMTs
FL Equipment
Page 46 of 76
FLM Data Transfer Reliability 3.5
A key component to being able to utilise the FLM data to actively control customers’ connections and the fault level on the network is the reliability of the data, in terms of it being transferred to PowerON for decision making activities. For the previous six months of operation the average data transfer reliability has been greater than 87%, a detailed breakdown per site is given in Table 3-2.
Sites Reliability
KITG 75.81%
HALG 75.91%
LADW 84.28%
CASB 85.28%
BOVI 85.71%
NECW 88.31%
SHIR 88.71%
BARG 91.54%
CHES 92.34%
CHAV 94.76%
ELMD 98.19% Table 3-2: FLM Data Transfer Reliability
This level of data transfer reliability, for a demonstration project, is considerable; however, to successfully control the network based on these results a greater degree of accuracy is required. This can be easily achieved as the current data transfer process is SIM cards; this decision was made to minimise the infrastructure investment required as part of the project. In order to further increase the data transfer reliability a fibre optic communication cable connection or microwave radio tower will be installed in each substation as required.

SDRC-9 Closed-Loop Operation FLMs & FLMTs
FL Equipment
Page 47 of 76
4 FCL Operational Experience
GridON 4.1
4.1.1 Castle Bromwich
General The GridON PSCFCL was connected to the 11kV network at Castle Bromwich Substation and energised on the 8th April 2016. The graph in Figure 4-1 shows the current flow through the PSCFCL from the energisation date to the present day.
Figure 4-1: Current through PSCFCL since energisation
From energisation until the end of November 2016 there have been no faults on the 11kV network supplied by the PSCFCL and therefore it has not been possible to analyse the performance of the device under network operating conditions. However, the device will remain connected on the network beyond the lifetime of the project and the performance of the device, during a fault, will be reported when it happens. Following the commissioning of the device it has been connected to the network just under 76% of the time, which is discussed in greater detail in Section 5, and has provided significant learning on the operation of the device and its value to enable the network to operate in parallel, securing all connected customers’ supplies. The PSCFCL has had two minor issues that have caused unplanned outages between the 14 July 2015 and 28 August 2015 and between the 14 September 2015 and 17 December 2015. In both cases no customers were lost as the transformers were operating in parallel and manual switching was undertaken to return the network to the pre-FCL configuration. There was one further planned outage between the 3 May 2016 to 6 May 2016 due to routine maintenance being carried out on GT1 requiring the FCL to be switched out.

SDRC-9 Closed-Loop Operation FLMs & FLMTs
FL Equipment
Page 48 of 76
Operational Issues and Solutions One of the basic principles behind the operation of the PSCFCL is that under normal operation a DC current is used to limit the impedance of the device when AC currents are flowing. When the AC current fluctuates due to the demand on the network changing, the DC bias current is adjusted to maintain the PSCFCL in saturation. Table 4-1 shows the levels of 11kV network current and the corresponding DC bias current that is generated by the PSCFCL.
Table 4-1: DC bias current vs. 11kV network current
11kV AC Primary Current (A) DC Bias Current (A)
0 – 400 130
401 – 800 220
801 – 1000 270
1001 – 1250 320
1251 – 1575 365
1576 – 2000 490
If the DC bias current reduces to zero the PSCFCL is required to trip as the increase in impedance of the device would lead to a large voltage drop across the device with the potential to affect other network protection systems to operate. The DC bias current is produced by five power supplies. The system has sufficient redundancy to ensure that the full DC bias current (490A) can be produced should one DC power supply fail. In the event where one DC supply fails an alarm signal is sent to WPD control centre. However, if two or more DC supplies are faulty, the PSCFCL will trip immediately as it is not able to produce the full DC bias current. On 11 June 2015 an alarm was received from the PSCFCL indicating that one of the DC supplies had failed. The PSCFCL did not need to be disconnected from service as full operation can be maintained with only four supplies in service. Following discussions with the manufacturer the decision was made to carry out a detailed investigation and the PSCFCL was taken out of service. The investigation by the manufacturer failed to identify the root cause of the alarm. The DC current sensors were recalibrated and tested and the FCL was re energised on the 28 August 2015. Following 18 days of operation, on the 13 September 2015 at 23:51hrs the FCL protection panel received a trip signal from the PSCFCL causing both circuit breakers to open. The trip signal originated from the “Two DC Power Supply Fail Trip” contact which indicated that two or more DC power supplies had failed. Figure 4-2 shows the operation of the trip alarm relay which resulted in the disconnection of the PSCFCL.

SDRC-9 Closed-Loop Operation FLMs & FLMTs
FL Equipment
Page 49 of 76
Figure 4-2: TDCFT trip alarm relay on PSCFCL protection panel
A download of detailed alarm and information logs from the PSCFCL control system was carried out by the manufacturer so further investigations could be carried out. The logs indicated that the cause of the issue was the DC current sensor, not the DC power supply units. The action taken by the manufacturer was to replace the DC sensor with a new unit. However, following re-energisation of the PSCFCL on the 20 October 2015, the “Two DC Power Supply Fail Trip” contact operated again, disconnecting the FCL after one hour of operation. Further analysis and physical checks of the DC sensor system were carried out by manufacturer. It was found that the supplies and DC sensor were operating normally therefore the decision was taken to re-design the DC sensing circuit to ensure that no external interference would affect it. Following the re-design and implementation of the DC sensing circuit the device was successfully re-energised on the 17 December 2015. Since this date there has been no re-occurrence of the DC supply issue. During the investigations into the DC Supply Failures, the dedicated Uninterruptible Power Supply (UPS) for the PSCFCL was found to have an outdated firmware installed. Despite not impacting on the operation or availability of the device it was decided during discussions with the manufacturer that there was a suitable level of risk to the operation of the PSCFCL that the firmware should be updated. This process was successfully completed by the UPS manufacturer during the GT1 maintenance period in May 2016.

SDRC-9 Closed-Loop Operation FLMs & FLMTs
FL Equipment
Page 50 of 76
Nexans 4.2
The following sections describe the connection and operational performance of the RSFCL since energisation at Chester St and Bournville. The devices at Chester St and Bournville have been operational 46% and 35% of the time, respectively. Whilst these values are far below that of the PSFCL the cause for these, discussed in greater detail below, have been minor manufacturing defects that have caused a significant impact, i.e. to disconnect the devices from the network. From the initial energisation date until November 2016 there have been no faults on the 11kV network supplied by the RSFCL at Chester Street or Bournville and therefore it has not been possible to analyse the performance of the device under fault conditions. As with the PSFCL this device will remain connected to the network beyond the lifetime of the project and when a fault occurs on the network and the device operates, this will be reported and disseminated.
4.2.1 Chester Street
General Chester Street RSFCL successfully passed the type tests at the KEMA laboratory in Arnhem, Netherlands on the 5th October 2015. The RSFCL was energised and connected to the 11kV network on the 25th November 2016. The graph shown in Figure 4-3 shows the current flow through the RSFCL from the energisation date to the present day.
Figure 4-3: Graph of current flow through the Chester Street RSFCL

SDRC-9 Closed-Loop Operation FLMs & FLMTs
FL Equipment
Page 51 of 76
Operational Issues and Solutions A number of cooling system alarms were discovered on the Chester Street RSFCL control system after the reconnection of the device on 5 January 2016. These indicated an over-temperature condition with two of the compressors. Both of the compressors had correctly tripped to avoid damage due to the over-temperature. It should be noted that there are a total of six compressors in the cooling system. The remaining four were fully operational and were able to maintain stable cooling of the cryogenic material due to the redundancy built into the system. This allowed the RSFCL to remain connected to the network during this period. Figure 4-4: Nexans Cooling System Overview provides an overview of the Nexans RSFCL cooling system.
Figure 4-4: Nexans Cooling System Overview
Nexans carried out an investigation and determined that the issues with the compressors were caused by residual air in the compressor water cooling circuit. Work was carried out at site to release the residual air by opening a number of valves on the compressor assembly which resolved the issue. WPD network control centre received an auxiliary system alarm from the RSFCL on 25 June 2016 and took the decision to remove the RSFCL from service. This decision was taken to avoid the further risk of system failures even though the device could have continued to operate. An investigation was carried out at site and a number of alarms relating to the cooling system were present on the RSFCL Human Machine Interface (HMI). These are shown below in Figure 4-5.

SDRC-9 Closed-Loop Operation FLMs & FLMTs
FL Equipment
Page 52 of 76
Figure 4-5: Screenshot from Chester Street RSFCL HMI showing cooling system alarms
WPD issued Nexans with the required information from the RSFCL control system to allow the manufacturer to investigate the source of the issue. Nexans determined that the helium pressure was low in the affected compressors and scheduled a site visit on the 17 July 2016 to investigate and remedy the issues with the RSFCL. The site visit confirmed the existing issues but also identified additional problems with the cooling system that had occurred in the intervening time prior to the site visit. The complete list is as follows:
Over-temperature on compressor M1.
Over-temperature on compressor M2.
Low helium pressure in compressor M3.
Recooler M9 failure.
Compressor M5 and M6 were switched off due to failure of Recooler M9. The RSFCL requires at least three compressors to be running to ensure the stabilisation of the cryogenic material at the required pressure and temperature set-point. Only a single compressor was in operation when Nexans attended site. This caused the pressure in the cryostat vessels to rise, instigating the operation of the electromechanical pressure release valve. The continued release of pressure caused a reduction in the liquid nitrogen level inside the RSFCL below its minimum trip value. This is shown in Figure 4-6.

SDRC-9 Closed-Loop Operation FLMs & FLMTs
FL Equipment
Page 53 of 76
Figure 4-6: Screenshot from Chester Street RSFCL HMI showing low liquid Nitrogen levels
The low helium pressure in compressor M3 was attributed to a loose screw connection on one of the flexible pipes. The connection was tightened and a helium leak test was performed to confirm no further leakage. The issues associated with the recoolers were attributed to the lack of air supply to the heat exchanger due to debris obstructing the condenser. A picture of the debris is shown in Figure 4-7. This caused the temperature of the recooler to increase, leading to the evaporation of cooling water. The recoolers were refilled to the correct level and reset. All compressors were also reset and operational. However, the device was unable to be reconnected to the network until the liquid nitrogen level was restored to its normal value.
Figure 4-7: Photograph of the debris obstructing the air flow to the recooler condenser
Nexans attended the Chester Street site for a second time on the 23 August 2016 to refill the RSFCL cryostats with liquid nitrogen. A liquid nitrogen storage vessel was connected to the RSFCL and the nitrogen level was increased to the nominal value. During the site visit a

SDRC-9 Closed-Loop Operation FLMs & FLMTs
FL Equipment
Page 54 of 76
further issue was identified. The recooler M9 had experienced an over-temperature trip. The unit’s condenser was cleaned and it was reconnected to the cooling system; however, the temperature of the device rose rapidly and disconnected itself for a second time. This indicated that the device had an internal fault. Nexans instructed the recooler manufacturer to repair the faulty unit. The decision was taken to keep Chester Street RSFCL disconnected from the network even though it was possible for reconnection as the liquid nitrogen level had been restored to normal. This decision was taken to avoid further damage to the cooling system and subsequently further loss of nitrogen level. A further WPD site visit to Chester Street on the 6 September 2016 identified that there had been further trip signals received from the RSFCL control system. The temperature and pressure inside the RSFCL cryostats had reached their trip levels. The further exhaust of nitrogen gas had decreased the nitrogen level to below its trip level. The alarms and trips are shown in Figure 4-8. Based on this information Nexans had to schedule the refilling of the device for a second time.
Figure 4-8: Screenshot from Chester Street RSFCL HMI showing liquid nitrogen level, pressure and temperature trips
Nexans visited Chester Street on the 12 September 2016 to assist the recooler manufacturer with carrying out the repairs required to recooler M9. The visit was timed to coincide with the first scheduled maintenance of all recoolers. The technician from the recooler manufacturer repaired the recooler M9 on the 15 September 2016 and also performed routine maintenance on the remaining recoolers. The technician discovered that the fan on the recooler M7 was slow to start during the routine maintenance. The technician advised that the control unit for the fan speed and an associated transmitter needed replacement. The repair of the recooler M7 and the refilling of the liquid nitrogen level were scheduled for another site visit by Nexans in October.

SDRC-9 Closed-Loop Operation FLMs & FLMTs
FL Equipment
Page 55 of 76
Nexans carried out final repairs to the Chester Street device on the 17 October 2016. During their initial investigations at site some additional issues were identified with the RSFCL cooling system. These are as follows:
The compressors M1 and M3 were switched off due to an over-temperature condition in the helium circuit.
The compressor M4 was working but not in operation. It was found that a small amount of oil had leaked from the unit. Nexans informed WPD that the technician from the compressor supplier will perform checks on all compressors at the next scheduled maintenance of the cold heads.
A new alarm was identified on the RSFCL HMI indicating that the burst disc had operated on the L3 cryostat vessel. Nexans performed an investigation and found that the burst disc was intact. The source of the issue was a faulty burst disc indicator.
Nexans implemented the repairs to the recooler M7 by replacing the transmitter and control unit for the fan speed control. The compressors M1 and M3 were switched on without further problems. The burst disc indicator for cryostat L3 was replaced and the nitrogen level in cryostats replenished. All cooling issues were resolved and the Chester Street RSFCL was reconnected to the network on 8 November 2016.
4.2.2 Bournville
General Bournville RSFCL successfully passed the type tests at the KEMA laboratory in Arnhem, Netherlands on 7 December 2015. The device was then successfully transported and installed at site. The RSFCL was energised and connected to the 11kV network on 17 February 2016. The graph shown in Figure 4-9 shows the current flow through the RSFCL from the energisation date to the present day.
Figure 4-9: Graph of current flow through the Bournville RSFCL

SDRC-9 Closed-Loop Operation FLMs & FLMTs
FL Equipment
Page 56 of 76
The RSFCL was disconnected from the network from 23 February 2016 to 15 March 2016 to allow for modifications to the substation AVC scheme. Refer to SDRC-8 for details of the AVC modifications. Since the reconnection of the device in March 2016 the RSFCL sustained operation on the network for approximately four months until being disconnected on 9 June 2016. The following sections describe the reasons for the disconnection of the RSFCL.
Operational Issues and Solutions On the 9 June 2016 the WPD control centre received a “system initialise alarm” from the Bournville RSFCL. The control operator took the decision to remove the device from service. This decision was taken to avoid the further risk of system failures even though the device could have continued to operate. An investigation was carried out at site and a further alarm relating to the cooling system was present on the RSFCL HMI. The alarm indicated a failure of recooler M7 and is shown below in Figure 4-10.
Figure 4-10: Screenshot of the Bournville RSFCL HMI showing the auxiliary system alarm relating to recooler M7 failure
The system initialise alarm was originally designed to indicate to the WPD control operator that the device was ready for reconnection to the network following operation of the RSFCL to limit a network fault. It was agreed with Nexans during the testing of both Chester Street and Bournville devices that the system initialise alarm was not required in the control system. Nexans removed the signal from the software; however, the signal was still wired at site for possible future reconfiguration. The WPD control centre should not have received this alarm and consequently an investigation was carried out to confirm that the signal wiring from the Nexans control panel was wired correctly as per the design schematics. Nexans visited the Bournville site on the 20 July 2016 to investigate and resolve the issue with the recooler M7. During the investigation Nexans discovered an additional alarm on the RSFCL HMI indicating a fault with the serial communication link to the compressor M5. This was initiated on the 9 July 2016 and is shown in the Figure 4-11 below.

SDRC-9 Closed-Loop Operation FLMs & FLMTs
FL Equipment
Page 57 of 76
Figure 4-11: Screenshot of the Bournville RSFCL HMI showing the failure of the serial comms link to compressor M5
It was discovered that the recooler M7 was tripped by an over-temperature condition attributed to a reduction of cooling water caused by residual air in the water cooling circuit. This issue was similar to those experienced at Chester Street. Nexans refilled the recooler water to the correct level and reset the recooler and connected compressors (M1 & M2). It was identified that the failure of the compressor M5 was caused by a faulty power supply unit which would require replacement. It was decided to keep the RSFCL disconnected from the network until all cooling system issues were resolved and the control panel wiring was checked. Nexans scheduled repairs to the Bournville RSFCL on 24 August 2016. WPD received further alarms from the RSFCL on 17 August 2016 prior to Nexans’ arrival at site. The alarms and trips are shown below in Figure 4-12. Nexans investigated the additional alarms on 24 August 2016 and confirmed the following:
The compressor M4 had suffered a power supply unit failure similar to the failure on compressor M5. This required another replacement power supply unit to be sourced.
The compressors M3 and M6 were found to be out of service.
The recooler M9 was not in service due to insufficient cooling water in the cooling circuit. This was likely caused by debris clogging the recooler condenser similar to the problems seen in Chester Street.
A water leak was observed at a connecter to the M5 compressor.

SDRC-9 Closed-Loop Operation FLMs & FLMTs
FL Equipment
Page 58 of 76
Figure 4-12: Screenshot of the Bournville RSFCL HMI showing further alarms and trips during August
Due to the unavailability of the compressors M3, M4, M5 and M6 the temperature and pressure had increased inside the cryostat vessels above their respective trip limits. The RSFCL control system attempted to reduce pressure by venting nitrogen gas causing a reduction of the nitrogen level below its minimum level. Nexans replaced the M4 compressor power supply unit with the spare unit that was designated for compressor M5. Compressor M5 was left switched off and water supply turned off until the water leak could be resolved and another replacement power supply could be sourced. The cooling water was replaced in recooler M9 and the unit was reset and switched on. All the compressor units excluding M5 were reset and switched on. The RSFCL was left disconnected from the network. The reconnection of the RSFCL would only able to take place after repair of compressor M5 and refilling of the liquid nitrogen to the nominal value. The repair of the compressor M5 was scheduled by Nexans to coincide with the routine maintenance of the recoolers in September 2016. WPD carried out a wiring check on the signals between the RSFCL control cabinet and the WPD protection panel on 17 August 2016. The investigation found that the wiring conformed to the design schematics; however, the auxiliary relay attributed to the system initialise alarm was latched in the energised state. Nexans visited Bournville on 13 September 2016 with a technician from the recooler manufacturer. The visit was timed to coincide with the first scheduled maintenance of all recoolers. The technician replaced the defective power unit in the M5 compressor and proceeded with the routine maintenance of the recoolers. The glycol level in the coolant was found to be insufficient. It was concluded that the glycol level would have to be replaced during the site visit to refill the RSFCL with nitrogen. This was organised for October 2016.

SDRC-9 Closed-Loop Operation FLMs & FLMTs
FL Equipment
Page 59 of 76
Nexans attended a final site visit to Bournville on 18 October 2016 to complete the outstanding repairs on the RSFCL cooling system and to refill the cryostat vessels with nitrogen. During the visit Nexans discovered some additional issues. The recooler M8 was found to be tripped off due to low coolant level. This was attributed to debris being present on the recooler condenser causing high temperatures in the equipment leading to evaporation of the coolant. The compressor M4 was also switched off due to overheating of the helium circuit. The recooler M8 was refilled with coolant and restarted. The compressor M4 was restarted without further issue. At this point Nexans investigated the source of the problem with the system initialise alarm. The PLC program and the alarm was correctly disabled in the software, however, the Nexans relay contact was inverted and so the signal was incorrectly present at the WPD protection panel. The software was modified to invert the relay contact output and the issue was resolved. The final step in the repairs was to refill the nitrogen level in the RSFCL cryostat vessels. No further issues with the cooling system have been observed. The Bournville RSFCL was successfully reconnected onto the 11kV network on 8 November 2016.
GE 4.3
Following the successful tendering activities for the five FLMTs two GE (formally Alstom) devices were selected. These two devices were to be installed at Kitts Green and Bartley Green primary substations; however, due to GE design and manufacturing issues, these two devices have been de-scoped as documented in SDRC-8.

SDRC-9 Closed-Loop Operation FLMs & FLMTs
FL Equipment
Page 60 of 76
5 FCL Availability
The availability of the FCLs is defined by the following equation:
Availability (%) =No. of hours in service
Total no. of hours since connected 𝑥 100
The data and the availability for all FCLs is shown in Table 5-1.
Site Technology Number of hours in service
Total number of hours since connected
Availability (%)
Castle Bromwich PSCFCL 9985 13417 75.4*
Chester Street RSFCL 3981 8616 45.8*
Bournville RSFCL 2208 6600 35.3* Table 5-1: FCL availability data
*Figure calculated up to the date 01/12/2016. The issues encountered during the operation of the FCLs have been described in the sections above. The number and severity of the issues at site has had an impact on the overall availability of the FCLs which is reflected in the table. The significant number of cooling system malfunctions at both Chester Street and Bournville show a significant impact on the availability of the RSFCLs compared with the PSCFCL at Castle Bromwich. The cooling system for the PSCFCL is essentially a radiator and fan system that is based on a traditional power transformer design and hence is much simpler with fewer moving parts compared to the RSFCL cooling system. This difference explains the relative difference in the availability figures between the FCL technologies. For each of the technologies and devices the contractual requirements for operation were a value of 98.6%, which equates to a device being disconnected for five days throughout the year. All devices are somewhere short of this value, however, each technology is maturing and significantly through the installation and operation as part of FlexDGrid. Each device will be operated for a further two years following the completion of the project and after this time it’s network availability as well as other key criteria will be considered as to whether the technologies are transferred to business as usual. A further operational report will be published at this time.

SDRC-9 Closed-Loop Operation FLMs & FLMTs
FL Equipment
Page 61 of 76
6 FCL Performance
Overview 6.1
The following sections provide an overview of the fault performance of each technology using laboratory test results and the comparison with the targets in the contract.
Castle Bromwich Fault Level Comparison 6.2
Fault Level Comparison Castle Bromwich 132/11kV Technology: GridON FCL
Location : GT1A||GT1B FL (no FCL): 261MVA
Existing Fault Level Parameters Peak Make: 40.4kA X/R = 23.5
Break: 13.7kA X/R = 23.5
Fault Level Parameters with FCL
Scenario Contract
Requirement Actual
Limitation Margin Over
Contract Peak Make (nom. DC Bias): 10.16kA 10.13kA +0.1% RMS Break (nom. DC Bias): 4.06kA 3.71kA +8.6% RMS Break (min. DC Bias): 4.06kA 3.75kA +7.6%
Overall Break FL Reduction: 20.3 %

SDRC-9 Closed-Loop Operation FLMs & FLMTs
FL Equipment
Page 62 of 76
6.2.1 Castle Bromwich Heat Maps
Figure 6-1 below shows a fault level heat map of the 11kV network supplied by Castle Bromwich with GT1A and GT1B in parallel without the FCL connected.
Figure 6-1: Fault Level Heat Map at Castle Bromwich before FCL
Figure 6-2 below shows the fault level heat map after the installation of the FCL in GT1A transformer leg. It can be seen that the FCL has made a significant reduction in fault level on the 11kV network.
Figure 6-2: Fault Level Heat Map at Castle Bromwich after FCL installation

SDRC-9 Closed-Loop Operation FLMs & FLMTs
FL Equipment
Page 63 of 76
Chester Street Fault Level Comparison 6.3
Fault Level Comparison Chester Street 132/11kV
Technology: Nexans RSFCL Location : GT2||GT3
FL (no FCL): 268MVA Existing Fault Level Parameters
Peak Make: 39.5kA X/R = 18.2 RMS Break: 14.1kA X/R =23.0
Fault Level Parameters with FCL
Scenario Contract
Requirement Actual
Limitation Margin Over
Contract Peak Make: 9.90kA 9.14kA +7.7% RMS Break: 3.68kA 2.87kA +22.0%
Overall Break FL Reduction: 29.8%

SDRC-9 Closed-Loop Operation FLMs & FLMTs
FL Equipment
Page 64 of 76
6.3.1 Chester Street Heat Maps
Figure 6-3 below shows a fault level heat map of the 11kV network supplied by Chester Street with GT2 and GT3 in parallel without the FCL connected.
Figure 6-3: Fault Level Heat Map at Chester Street before FCL
Figure 6-4 below shows the fault level heat map after the installation of the FCL across GT2 and GT3. The areas in the south east with high fault level have been reduced significantly following the installation of the FCL.
Figure 6-4: Fault Level Heat Map at Chester Street after FCL installation

SDRC-9 Closed-Loop Operation FLMs & FLMTs
FL Equipment
Page 65 of 76
Bournville Fault Level Comparison 6.4
Fault Level Comparison Bournville 132/11kV
Technology: Nexans RSFCL Location : GT1||GT3
FL (no FCL): 292MVA Existing Fault Level Parameters
Peak Make: 43.9kA X/R = 15.3 RMS Break: 15.3kA X/R = 20.6
Fault Level Parameters with FCL
Scenario Contract
Requirement Actual
Limitation Margin Over
Contract Peak Make: 7.70kA 6.64kA +13.8% RMS Break: 3.05kA 2.05kA +32.8%
Overall Break FL Reduction: 36.6%

SDRC-9 Closed-Loop Operation FLMs & FLMTs
FL Equipment
Page 66 of 76
6.4.1 Bournville Heat Maps
Figure 6-5 below shows a fault level heat map of the 11kV network supplied by Bournville with GT1 and GT3 in parallel without the FCL connected.
Figure 6-5: Fault Level Heat Map at Bournville before FCL
Figure 6-6 below shows the fault level heat map after the installation of the FCL between GT1 and GT3. The installation of the FCL has reduced the fault levels to well within the equipment limits.
Figure 6-6: Fault Level Heat Map Bournville after FCL installation

SDRC-9 Closed-Loop Operation FLMs & FLMTs
FL Equipment
Page 67 of 76
Summary 6.5
The table below indicates the additional generation, in MVA, that can be connected to the substation due to the installation of the three FCLs, based on a generator’s infeed being 4.5MVA/MVA, which is a typical fault infeed for a Combined Heat and Power (CHP) unit. During the bid submission the same fault level infeed value, 4.5MVA/MVA, was used to assess the potential generation capacity connection headroom; this value was 22MVA. Through the installation of the three FCLs and the analysis of the performance, based on the accredited laboratory test results the actual capacity created is 52MVA, which is over two times greater than the expected (at bid stage) benefits.
Substation Generation Increase (MVA)
Castle Bromwich 13MVA
Chester Street 19MVA
Bournville 20MVA
TOTAL 52MVA Table 6-1: Generation Capacity Release by Substation
7 FCL Network Security
7.1.1 Overview
This section describes the improvements in network security at the sites where an FCL has been installed.
7.1.2 GridON
The ability of the PSCFCL to ride-through fault conditions makes it suitable for installation in series with a transformer. The fault level reduction provided by the PSCFCL allows for two 11kV transformer windings to be operated in parallel at Castle Bromwich. The security of the 11kV network is increased by the device remaining in service throughout a transformer LV winding fault, with no customers lost.
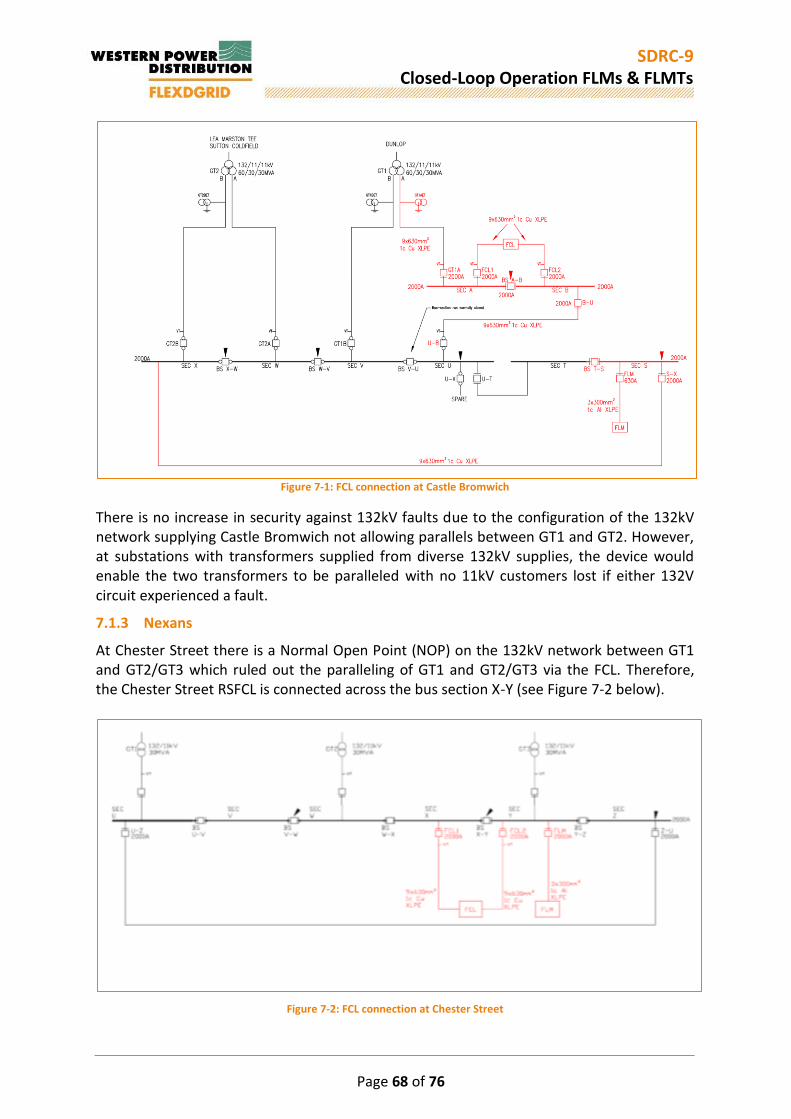
SDRC-9 Closed-Loop Operation FLMs & FLMTs
FL Equipment
Page 68 of 76
Figure 7-1: FCL connection at Castle Bromwich
There is no increase in security against 132kV faults due to the configuration of the 132kV network supplying Castle Bromwich not allowing parallels between GT1 and GT2. However, at substations with transformers supplied from diverse 132kV supplies, the device would enable the two transformers to be paralleled with no 11kV customers lost if either 132V circuit experienced a fault.
7.1.3 Nexans
At Chester Street there is a Normal Open Point (NOP) on the 132kV network between GT1 and GT2/GT3 which ruled out the paralleling of GT1 and GT2/GT3 via the FCL. Therefore, the Chester Street RSFCL is connected across the bus section X-Y (see Figure 7-2 below).
Figure 7-2: FCL connection at Chester Street

SDRC-9 Closed-Loop Operation FLMs & FLMTs
FL Equipment
Page 69 of 76
At Bournville the 132/11kV transformers are fed from the same GSP. It was chosen to install the RSFCL in the existing interconnector between busbar sections A and C. (see Figure 7-3 below).
Figure 7-3: FCL connection at Bournville
The RSFCLs parallel two grid transformers at both Chester Street and Bournville sites. This parallel configuration improves the security of the network. The transformers have to be run in split configuration without the FCL connected due to the existing fault level exceeding the equipment ratings. If there is a network fault on the 132kV network one of these transformers will trip, disconnecting the supply to the customers on the respective bus section until the network is reconfigured. Similarly, one of the transformers will trip in the same scenario with the FCL connected in the circuit; however, in this instance the FCL will back feed the bus section that would have been disconnected from the supply in the split configuration. Therefore, no customers are disconnected for a 132kV network fault in this configuration and hence network security is significantly improved. Whilst these types of faults are rare their impact can be substantial. Specifically considering the Birmingham network, where the average number of customers connected to a substation is 18,000; for a network fed from two transformers that would mean a loss of supply for 9,000 customers.

SDRC-9 Closed-Loop Operation FLMs & FLMTs
FL Equipment
Page 70 of 76
8 Learning
Cooling Systems 8.1
8.1.1 General
The cooling system for the Chester Street and Bournville RSFCLs is critical to allow the continued operation of the device since the superconducting conductor is designed to be kept at cryogenic temperatures. The sections describing the operational experience of the device has presented a multitude of issues with the ancillary cooling equipment and interconnections. This has directly affected the availability of the device.
8.1.2 Complexity
The RSFCLs rely on a cooling system which is formed by two cooling sub-systems or ‘circuits’. The first circuit utilises compressors to compress helium gas to high pressures. This gas is then expanded through a rotating machine called a cold head on the top of the cryostat vessels. This expansion creates very cold temperatures at the surface of the cold head inside the vessel ensuring the correct set-point temperature is maintained for the liquid nitrogen. The compression of Helium generates heat in the compressor. To dissipate this heat a second water cooling ‘circuit’ is required. This circuit consists of external recoolers to extract heat from the water at the compressor outlet and pump recooled water back to the compressors. By its very nature the cooling system is complex due to the fact that there are a large number of rotating machines and pumps. In addition the compressors, recoolers and cold heads require a number of pipework interconnections. In a system where there are a high number of interfaces and rotating machines the likelihood of component malfunction, component failure and coolant leaks is increased. The operational issues associated with the RSFCLs, and which are documented in this report, are directly linked to the complexity of the cooling system.
8.1.3 Alternative Cooling Solution
An alternative cooling system solution is available to overcome the issues described above. This alternative solution does not have any active cooling components. The liquid nitrogen is circulated through the cryostat vessels from a large vacuum insulated liquid nitrogen storage tank external to the RSFCL device. Only a single pump system is required in this instance. In this configuration, the liquid nitrogen naturally evaporates due to the heat losses in the system. The gaseous Nitrogen is vented to ensure that the pressure inside the RSFCL cryostat vessels is maintained. The venting of the nitrogen gas due to natural evaporation leads to a reduction of the liquid nitrogen level inside the system over time. The liquid nitrogen would require refilling at regular intervals to ensure the level does not drop below the minimum setting. The refilling process would take place at the large external storage vessel. The storage vessel is vacuum insulated which means that heat losses to the environment are minimal. This coupled with the large thermal mass of the system would mean the time between refilling periods can be designed appropriately.

SDRC-9 Closed-Loop Operation FLMs & FLMTs
FL Equipment
Page 71 of 76
A key consideration for the installation of a liquid nitrogen tank is the space constraints and the licenses required for the storage of large amounts of liquid nitrogen at a specific site. These were key drives when deciding the cooling solutions for the RSFCL devices. As fault level limitation requirements are generally in dense urban environments, where space is limited, as is the case in the project area, a closed loop cooling system is advantageous due to the space required, however, it is the recommendation of this report that, where space is available, a storage tank cooling solution is utilised for future RSFCL installations. The complexity of the cooling system would be dramatically reduced. There would be no requirement for the compressor and recooler equipment. Instead only a single pump is required to circulate the liquid nitrogen. In addition, the cryostat vessel design would be much simpler, needing only feed and return pipework for the circulating Nitrogen. The sizing of the storage vessel would have to be carefully calculated to ensure that the refilling of nitrogen is not too frequent, whilst also taking space at site into consideration. The refilling would typically be done by a liquid Nitrogen tanker operated by a third party. Therefore, the positioning of the storage vessel is also an important consideration to allow ease of access by the tanker, whilst at the same time maintaining the safety and integrity of the substation.
Installation Type 8.2
8.2.1 General
The FCLs installed as part of this project were able to be installed both outdoors and indoors. The choice of installation type is largely determined by the existing substation. A number of factors are considered such as: substation layout, space, future planned works, access for plant and ease of cabling etc. Both the FCLs at Castle Bromwich and Bournville were installed indoors whilst the FCL at the Chester Street was a modular outdoor installation. The following sections document the learning generated from both of these installation types.
8.2.2 Modular Outdoor
Chester Street 132/11kV substation had an area of spare land adjacent to existing outdoor 132kV compound. This was the main reason why the Chester Street RSFCL was chosen to be installed outdoors. The device was pre-installed in a concrete enclosure at Nexans’ factory in Hanover, Germany. Figure 8-1 shows the Chester Street RSFCL being delivered to site.

SDRC-9 Closed-Loop Operation FLMs & FLMTs
FL Equipment
Page 72 of 76
Figure 8-1: Chester Street FCL being delivered to site
The modular outdoor installation has many advantages over the indoor installation. The equipment is pre-installed in the container and tested as a complete unit during both the factory and type testing. This means that minimal disassembly and reassembly work is required for transportation and delivery to site. In addition, the control system wiring pre- and all cooling pipework connections were already inside the enclosure. This lead to a shorter commissioning time compared to the indoor installations. The interfaces between the FCL and the substation were simplified i.e. the connection of HV and control/signal cables leading to fewer issues and mistakes encountered during the integration of the equipment into the substation.
8.2.3 Indoor
The decision to implement an indoor installation at Castle Bromwich was based on there being insufficient space outside of the substation building. At Bournville there was an outdoor area suitable for the RSFCL in a modular configuration. The decision was taken to install the device indoors due to the possibility of the outdoor area being required for planned asset replacement works in the future. There a number of disadvantages to an indoor installation. The equipment has to be disassembled from testing, transported, delivered, positioned and reassembled. This can lead to damage during transit as well as errors in the reassembly of the various systems at site. In addition, there are a greater number of considerations such the age of the substation building, the state of the existing substation records and the access requirements for the equipment that need to be carefully managed during the design phase of the project to avoid delays during the installation and commissioning. Significant work at both Castle Bromwich and Bournville was required to ensure that the interfacing between the main contractor and the equipment manufacturer was clearly defined and satisfactory to allow the safe sequencing and execution of the works. Figure 8-2 shows the finished indoor FCL installation at Bournville substation.

SDRC-9 Closed-Loop Operation FLMs & FLMTs
FL Equipment
Page 73 of 76
Figure 8-2: Photograph of the complete FCL installation at Bournville
8.2.4 Conclusion
It is the recommendation of this project that the modular outdoor installation is preferred over indoor installations provided that there is sufficient space available in the substation. If an indoor installation is to be implemented it is of greater importance to identify and mitigate site specific risks at the design stage to avoid cost and time implications to the project during the installation stage.
Fault Limiting Performance 8.3
The fault limiting performance of the FCLs has been fully tested in the laboratory. The results of the type testing for the FCLs are discussed in detailed in SDRC-8. It is important to note, however, that the FCLs have not experienced a network fault, and as such, the true performance of the FCLs in the field is unknown at the time of writing this report. Other FCL devices, in the UK and worldwide, have been connected to and operated to limit faults on live 11kV networks, where their results have been comparable to that under a test environment2. As well as this, as discussed in this document, all three devices will remain on the network for a period of two following the end of the project to fully understand their operation and performance.
Approved policy documents 8.4
Each of the FCL technologies has experienced issues since energisation which has resulted in the devices having to be removed from service and modifications made. Prior to energising the FCLs a significant portion of time was set aside to produce policy documentation which described how the devices operated and how they should be controlled. These documents proved to be very useful for WPD operational engineers who
2 http://www.eti.co.uk/news/gridons-fault-current-limiter-successfully-suppresses-multiple-network-faults-
during-first-year-in-service/

SDRC-9 Closed-Loop Operation FLMs & FLMTs
FL Equipment
Page 74 of 76
attended site when any alarm or trip signals were received by control. The documents explain what action should be taken for each alarm and trip signal that has been received. The document also explains the pre-cautionary methods required to energise and de-energise each device. These detailed policies allowed engineers to take the correct action and prevent any damage to the devices. The policy documents have been updated as lessons have been learnt regarding each element of the devices in to their current stage as documented in SDRC-10. In addition to the action that needs to be taken for alarm and trip events, the policy documents also describe the requirements for regular maintenance intervals. These requirements have been uploaded into WPD’s maintenance logging system (CROWN) with maintenance already being implemented, for example the 3 monthly cleaning of the recoolers for the Nexans RSFCL.
PSCFCL energisation 8.5
Prior to the energisation of the PSCFCL on to the 11kV network the operator must first of all ensure that the DC bias is energised and there are no faults with any of the auxiliary systems. There is a defined start-up process for the PSCFCL which involves turning on the main LV supply to the device and then waiting, for up to three minutes, for the system to initialise. During the initialise process the PSCFCL generates a “System Initialise Alarm” which indicates that the device is going through the process of starting up. Once the system has initialised and no faults are apparent, the alarms need to be reset prior to connecting the device to the network. Due to the infancy of the technology it was decided that this process of initialising should be carried out manually on-site by an engineer. Following the experience of operating the PSCFCL at Castle Bromwich, it would be beneficial to consider having an option to remotely initialise the device for any future installations. This option would involve electrical interlocking and sequencing which would provide a Network Control engineer with the ability to energise and de-energise the PSCFCL without the need to send an engineer to site. This will be fully considered following the two years post project operation previously discussed.
Technology comparison 8.6
Table 8-1 below explores how each FCL technology installed as part of FlexDGrid compares with each other on a number of points.
Item Comparison
Physical size The RSFCL and PSCFCL have a very similar footprint, however, the PSCFCL is significantly heavier and requires substantial civil foundations compared with the RSFCL.
Maintenance The advantage of the PSCFCL is that it is based on a traditional transformer design and is therefore well understood and practised by DNOs. The RSFCL has

SDRC-9 Closed-Loop Operation FLMs & FLMTs
FL Equipment
Page 75 of 76
complex cooling system which requires frequent maintenance to ensure that the system is running at optimal efficiency. The cooling system comprises a number of discrete elements which require specialist intervention by third parties if any faults occur.
Fault Level Reduction Both the PSCFCL and RSFCL have similar fault level reduction capabilities. For FlexDGrid, both technologies met the requirements specified by WPD. It is worth noting that for both technologies there is an inherent limit to the fault level reduction that can be achieved. For each technology there has to be a sufficient margin between the trigger level for fault level reduction and the continuous current rating.
Fault Ride Through One of the main features of the PSCFCL is its ability to ride through faults without the need to disconnect. Conversely the RSFCL has to be disconnected from the network following a network fault to avoid overheating. This limits the number of connection configurations that are available (e.g. the RSFCL cannot be installed in a transformer leg or other incoming circuit).
Health, Safety and Environment
A substantial magnetic shield has to be installed around the PSCFCL to contain the high fields generated by the DC bias. This ensures that the field strength at shield boundary is reduced to acceptable levels to avoid harm to personnel with medical implants that are external to the PSCFCL installation area. The RSFCL contains a large volume of liquid Nitrogen. In an emergency, such as a fault internal to the device, it is important that this is safely vented and contained within suitable bund. In the unlikely event that the liquid Nitrogen is not contained within the bund measures must be taken to ensure that leaks into an operational area are detected. Oxygen sensors must be installed with the facility to inform Network Control of a low oxygen state in the operational areas affected.
Table 8-1: FCL technology comparison points
