instant snow lesson - bc's new curriculum snow science, ... a minimum of two or three...
TRANSCRIPT
1
Steps to Inquiry Lesson Outline Instant Snow
Science, Grades 3–6
Background In the Instant Snow investigation, students will observe and test characteristics of a “mystery powder” that,
when water is added, turns into instant snow. The mystery powder is polyacrylate, the same material used in
disposable diapers.
This lesson outline was designed to work with the Steps to Inquiry process (http://smarterscience.youthscience.ca),
for students in Grades 3 to 6. Steps to Inquiry is a framework from Smarter Science, which was an outreach
initiative of Youth Science Canada. Steps to Inquiry is designed to scaffold the experimental design process for
students, leading to eventual ownership of the scientific process. The short-term goal is to make students familiar
with the process scientists go through when developing a question and planning their experiments to explore the
answers to their questions. The long-term goal is for students to apply these steps to their own experiments in an
open inquiry.
The lesson outline follows the stages of inquiry identified in the Science Curricular Competencies:
• Questioning and Predicting
• Planning and Conducting
• Processing and Analyzing Data and Information
• Evaluating
• Applying and Innovating
• Communicating
The four steps in the outline represent steps 1–4 in the Steps to Inquiry framework, which works with
students through the initial Questioning and Predicting stage to the Planning and Conducting stage of the
Curricular Competencies. Once students have planned their experiment, as laid out in this lesson sequence,
they are well on their way to conducting the experiment, collecting the data, analyzing the data, making
conclusions, and so on (i.e., the other stages in the Curricular Competencies).
The lesson was developed not to match specific curricular content (though connections can be made), but to
introduce and focus on the development of specific Curricular Competencies. Students need repeated
exposure to the Steps to Inquiry process before they can move from guided to open inquiry. Once students
know the process, the next step is to take existing demonstration-type experiments with curricular
connections and tweak them for students to use with the Steps to Inquiry.
2
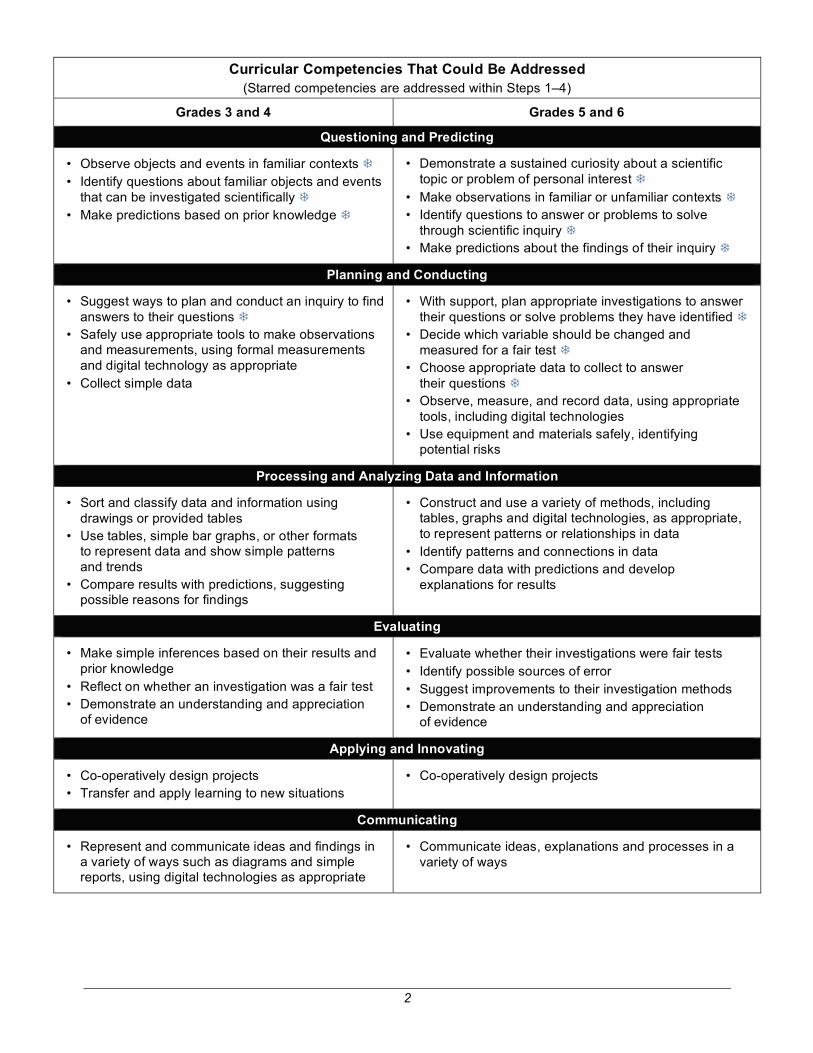
Curricular Competencies That Could Be Addressed
(Starred competencies are addressed within Steps 1–4)
Grades 3 and 4 Grades 5 and 6
Questioning and Predicting
• Observe objects and events in familiar contexts
• Identify questions about familiar objects and events that can be investigated scientifically
• Make predictions based on prior knowledge
• Demonstrate a sustained curiosity about a scientific topic or problem of personal interest
• Make observations in familiar or unfamiliar contexts
• Identify questions to answer or problems to solve through scientific inquiry
• Make predictions about the findings of their inquiry
Planning and Conducting
• Suggest ways to plan and conduct an inquiry to find answers to their questions
• Safely use appropriate tools to make observations and measurements, using formal measurements and digital technology as appropriate
• Collect simple data
• With support, plan appropriate investigations to answer their questions or solve problems they have identified
• Decide which variable should be changed and measured for a fair test
• Choose appropriate data to collect to answer their questions
• Observe, measure, and record data, using appropriate tools, including digital technologies
• Use equipment and materials safely, identifying potential risks
Processing and Analyzing Data and Information
• Sort and classify data and information using drawings or provided tables
• Use tables, simple bar graphs, or other formats to represent data and show simple patterns and trends
• Compare results with predictions, suggesting possible reasons for findings
• Construct and use a variety of methods, including tables, graphs and digital technologies, as appropriate, to represent patterns or relationships in data
• Identify patterns and connections in data
• Compare data with predictions and develop explanations for results
Evaluating
• Make simple inferences based on their results and prior knowledge
• Reflect on whether an investigation was a fair test
• Demonstrate an understanding and appreciation of evidence
• Evaluate whether their investigations were fair tests
• Identify possible sources of error
• Suggest improvements to their investigation methods
• Demonstrate an understanding and appreciation of evidence
Applying and Innovating
• Co-operatively design projects
• Transfer and apply learning to new situations
• Co-operatively design projects
Communicating
• Represent and communicate ideas and findings in a variety of ways such as diagrams and simple reports, using digital technologies as appropriate
• Communicate ideas, explanations and processes in a variety of ways

3
Core Competencies That Are Addressed
Stages of Inquiry
Questioning and Predicting Creative Thinking
2. Generating ideas 3. Developing ideas
Critical Thinking
2. Question and investigate
Planning and Conducting Communication
3. Collaborate to plan, carry out, and review constructions and activities
Creative Thinking
3. Developing ideas
Critical Thinking
2. Develop and design
Processing and Analyzing Data & Information
Critical Thinking
1. Analyze and critique 2. Question and investigate
Evaluating Communication
4. Explain and reflect on experiences and accomplishments
Critical Thinking
1. Analyze and critique Applying and Innovating Critical Thinking
2. Develop and design
Communicating Communication
2. Acquire, interpret, and present information

4
Lesson Organization
Classroom and Group Set-Up
This lesson works best with students in groups of two, three, or four. Groups larger than four are too large.
Tip: If desks are organized into groups of four, they can be covered with a plastic garbage bag that has had the bottom and one side cut open. It is very important to cover the desks with plastic or paper to make cleanup less of a nightmare.
Materials
• 1 rounded spoon of polyacrylate in a paper cup (per group)
• 1 Dixie Cup three-quarters full of water (per group)
• 2 different colours of sticky notes
• Eye protection
• Steps to Inquiry pages (attached)
Reminder: Students should use eye protection when working with polyacrylate. Remind students not to get the powder in their eyes, mouth, nose, and so on.
Reminder: Test the water/powder ratio yourself so you know what to expect from the experiment. Water temperature is a significant variable in this experiment. Water at room temperature is recommended for the best effect.
Time
The Steps to Inquiry framework takes you through the entire process. Even if you are just focused on the
development of questions, or identification of variables, taking students to the end of developing their own
experiment is a worthwhile experience and provides many opportunities for important conversations. Plan for
a minimum of two or three 45–60-minute lessons to take students through the process of making
observations, developing wonder questions, identifying variables, and choosing a testable question.
Guided Inquiry Sequence
DAY 1 (can be split into two days if appropriate)
Learning goals (reworded from Curricular Competencies):
• I am able to make detailed observations. (Questioning and Predicting)
• I am able to ask testable questions based on my observations. (Questioning and Predicting)
Tier 2 and 3 vocabulary: observation, testable question, rapidly, record, description, characteristic
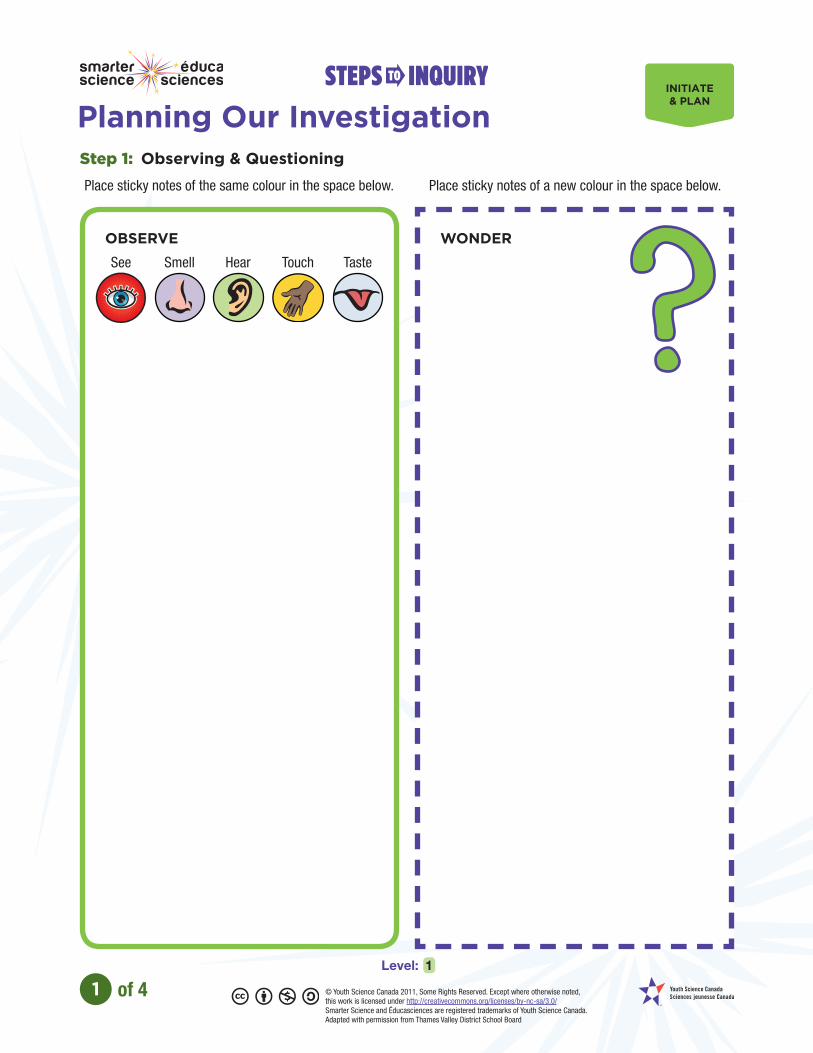
Step 1: Observing and questioning (Use attached Steps to Inquiry: Initiate & Plan page 1)
1. Begin the lesson with a short hook that intrigues students about the concept of being a scientist
(video clip, wearing a lab coat/lab glasses, etc.). Ask students what scientists do. Brainstorm some
skills that scientists need. Explain to students that they will be creating their own experiment based
on the mysterious event they will see today, to practise the skills of a real scientist.
5
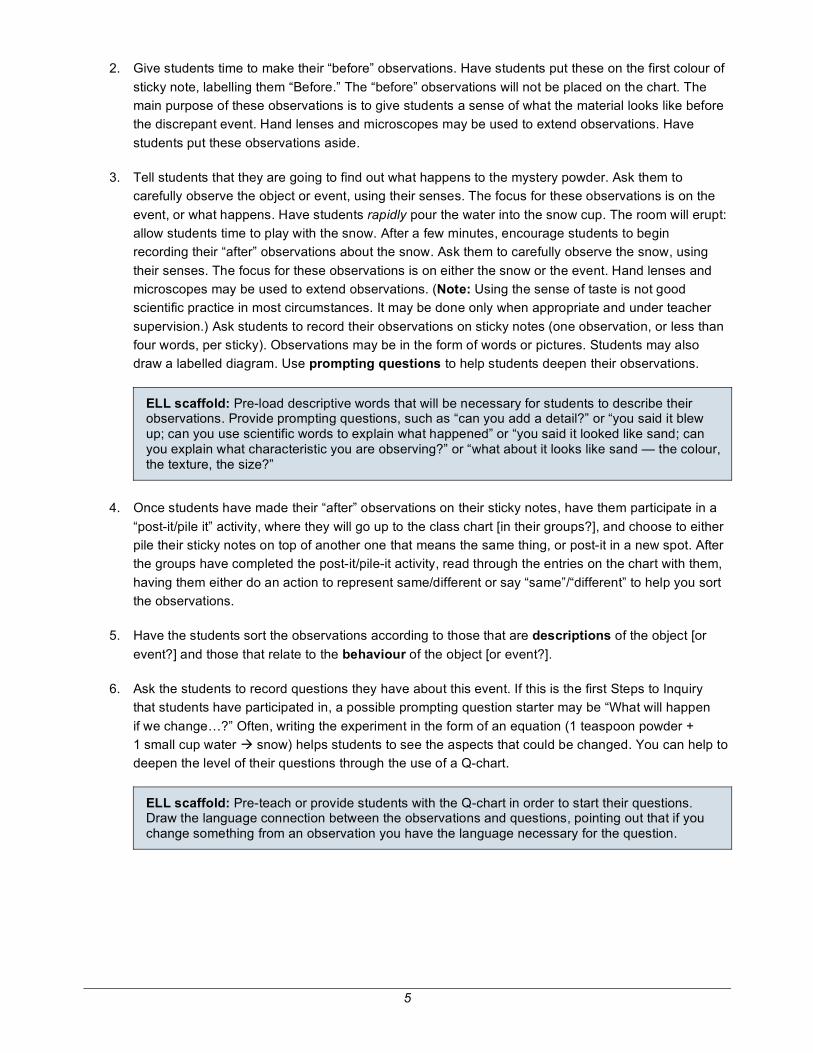
2. Give students time to make their “before” observations. Have students put these on the first colour of
sticky note, labelling them “Before.” The “before” observations will not be placed on the chart. The
main purpose of these observations is to give students a sense of what the material looks like before
the discrepant event. Hand lenses and microscopes may be used to extend observations. Have
students put these observations aside.
3. Tell students that they are going to find out what happens to the mystery powder. Ask them to
carefully observe the object or event, using their senses. The focus for these observations is on the
event, or what happens. Have students rapidly pour the water into the snow cup. The room will erupt:
allow students time to play with the snow. After a few minutes, encourage students to begin
recording their “after” observations about the snow. Ask them to carefully observe the snow, using
their senses. The focus for these observations is on either the snow or the event. Hand lenses and
microscopes may be used to extend observations. (Note: Using the sense of taste is not good
scientific practice in most circumstances. It may be done only when appropriate and under teacher
supervision.) Ask students to record their observations on sticky notes (one observation, or less than
four words, per sticky). Observations may be in the form of words or pictures. Students may also
draw a labelled diagram. Use prompting questions to help students deepen their observations.
ELL scaffold: Pre-load descriptive words that will be necessary for students to describe their observations. Provide prompting questions, such as “can you add a detail?” or “you said it blew up; can you use scientific words to explain what happened” or “you said it looked like sand; can you explain what characteristic you are observing?” or “what about it looks like sand — the colour, the texture, the size?”
4. Once students have made their “after” observations on their sticky notes, have them participate in a
“post-it/pile it” activity, where they will go up to the class chart [in their groups?], and choose to either
pile their sticky notes on top of another one that means the same thing, or post-it in a new spot. After
the groups have completed the post-it/pile-it activity, read through the entries on the chart with them,
having them either do an action to represent same/different or say “same”/“different” to help you sort
the observations.
5. Have the students sort the observations according to those that are descriptions of the object [or
event?] and those that relate to the behaviour of the object [or event?].
6. Ask the students to record questions they have about this event. If this is the first Steps to Inquiry
that students have participated in, a possible prompting question starter may be “What will happen
if we change…?” Often, writing the experiment in the form of an equation (1 teaspoon powder +
1 small cup water snow) helps students to see the aspects that could be changed. You can help to
deepen the level of their questions through the use of a Q-chart.
ELL scaffold: Pre-teach or provide students with the Q-chart in order to start their questions. Draw the language connection between the observations and questions, pointing out that if you change something from an observation you have the language necessary for the question.
6
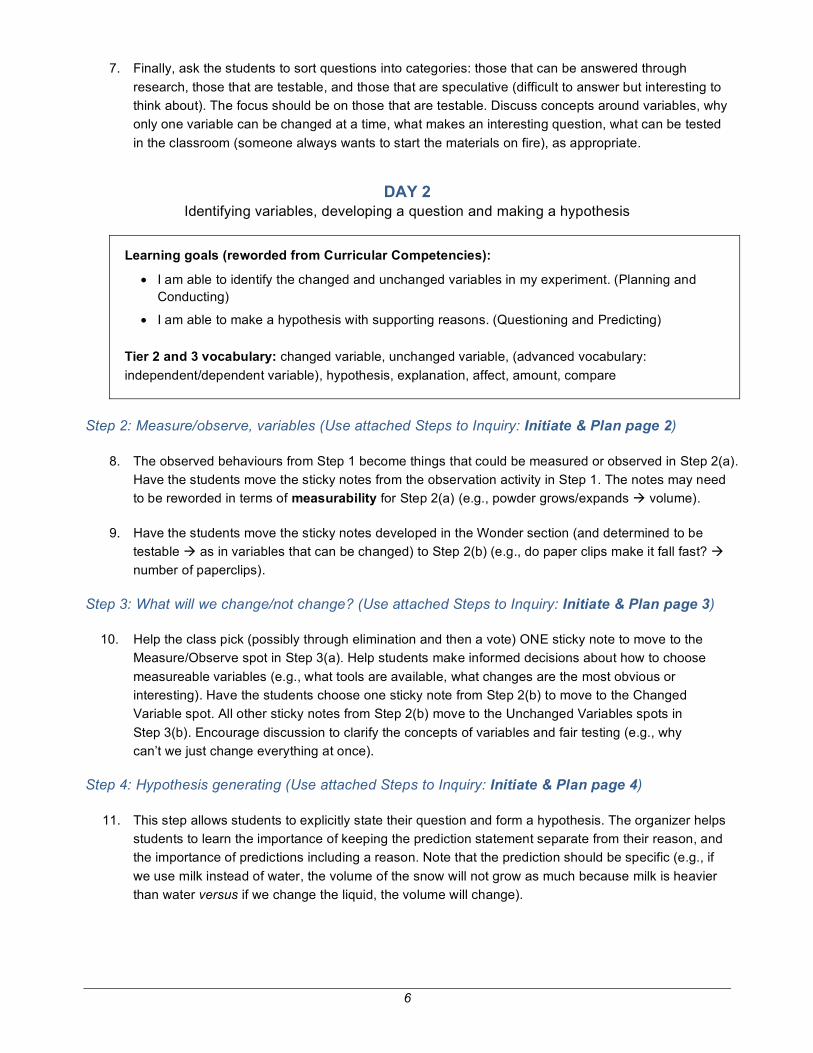
7. Finally, ask the students to sort questions into categories: those that can be answered through
research, those that are testable, and those that are speculative (difficult to answer but interesting to
think about). The focus should be on those that are testable. Discuss concepts around variables, why
only one variable can be changed at a time, what makes an interesting question, what can be tested
in the classroom (someone always wants to start the materials on fire), as appropriate.
DAY 2 Identifying variables, developing a question and making a hypothesis
Learning goals (reworded from Curricular Competencies):
• I am able to identify the changed and unchanged variables in my experiment. (Planning and
Conducting)
• I am able to make a hypothesis with supporting reasons. (Questioning and Predicting)
Tier 2 and 3 vocabulary: changed variable, unchanged variable, (advanced vocabulary:
independent/dependent variable), hypothesis, explanation, affect, amount, compare
Step 2: Measure/observe, variables (Use attached Steps to Inquiry: Initiate & Plan page 2)
8. The observed behaviours from Step 1 become things that could be measured or observed in Step 2(a).
Have the students move the sticky notes from the observation activity in Step 1. The notes may need
to be reworded in terms of measurability for Step 2(a) (e.g., powder grows/expands volume).
9. Have the students move the sticky notes developed in the Wonder section (and determined to be
testable as in variables that can be changed) to Step 2(b) (e.g., do paper clips make it fall fast?
number of paperclips).
Step 3: What will we change/not change? (Use attached Steps to Inquiry: Initiate & Plan page 3)
10. Help the class pick (possibly through elimination and then a vote) ONE sticky note to move to the
Measure/Observe spot in Step 3(a). Help students make informed decisions about how to choose
measureable variables (e.g., what tools are available, what changes are the most obvious or
interesting). Have the students choose one sticky note from Step 2(b) to move to the Changed
Variable spot. All other sticky notes from Step 2(b) move to the Unchanged Variables spots in
Step 3(b). Encourage discussion to clarify the concepts of variables and fair testing (e.g., why
can’t we just change everything at once).
Step 4: Hypothesis generating (Use attached Steps to Inquiry: Initiate & Plan page 4)
11. This step allows students to explicitly state their question and form a hypothesis. The organizer helps
students to learn the importance of keeping the prediction statement separate from their reason, and
the importance of predictions including a reason. Note that the prediction should be specific (e.g., if
we use milk instead of water, the volume of the snow will not grow as much because milk is heavier
than water versus if we change the liquid, the volume will change).

7
ELL scaffold: Sentence frames with or without picture frames will help students generate ideas. See the Level 2 poster (http://smarterscience.youthscience.ca/sites/default/files/documents/ smarterscience/2-1_CDN_EN_Initiate_and_Plan_L2.pdf) for excellent examples. Students may need to have background knowledge built or developed in order to come up with explanations for their hypothesis. Vocabulary such as increase, decrease, and volume will need to be addressed.
Students have now generated an idea for an experiment, as well as a hypothesis. If there is time, have them
create a simple T-chart to record their information and test their hypothesis.
DAY 3
Students complete the experiments they generated on their own. They record their observations and
measurements, and then analyze their findings by comparing their outcome with their hypothesis. (See
attached Steps to Inquiry: Perform & Record, Analyze and Interpret and Communicate pages.)
Learning goals could include, but are not limited to:
• I am able to make detailed observations and measurements. (Planning and Conducting)
• I am able to record my observations in an organized method. (Planning and Conducting)
• I am able to analyze and reflect on the results of my experiment. (Processing and Analyzing)
• I am able to identify and explain patterns in the results. (Processing and Analyzing)
• I am able to identify possible sources of error and analyze the impact on my experiment.
(Evaluating)
Assessment Assessment for, as, and of learning can take place throughout the investigation.
For example, you can assess process skills (observing, explaining), use of vocabulary, and understanding of
concepts behind curricular experiments. Students can reflect on the process, identifying areas of difficulty,
problem-solving strategies, learning that has taken place, and additional questions they have. Criteria for
strong observations, explanations, hypotheses, and so on can be generated with students, and should be
explicit and visible. Generating what it looks like to meet expectations is crucial for both the formative and
summative assessment processes.
If students move on to the testing phases, you can incorporate the PEOE template or data analysis pages
(http://smarterscience.youthscience.ca/peoe-steps). These pages provide opportunities for formative or
summative assessment on data collection, conclusion drawing, and so on.
Remember that during different parts of the year, your focus will likely be on different aspects of the scientific
process (e.g., developing questioning, developing measuring and recording skills, developing communicating
findings). That should be the aspect of the process that you focus your assessment on. That doesn’t mean
students should walk through the rest of the experimental process, but it will help you narrow the scope of
your assessment if necessary.
Bibliography Lesson concept adapted from Smarter Science workshop training, initially presented by Mike Newnham and further developed by Kaylie Rooke.
How can the questions be answered? (Question Sort)
Step 1: Observing & Questioning
OBSERVE See Smell Hear Touch Taste
WONDER
Place sticky notes of the same colour in the space below. Place sticky notes of a new colour in the space below.
Planning Our InvestigationINITIATE& PLAN
1 of 4Level: 1
© Youth Science Canada 2011, Some Rights Reserved. Except where otherwise noted, this work is licensed under http://creativecommons.org/licenses/by-nc-sa/3.0/Smarter Science and Éducasciences are registered trademarks of Youth Science Canada.Adapted with permission from Thames Valley District School Board
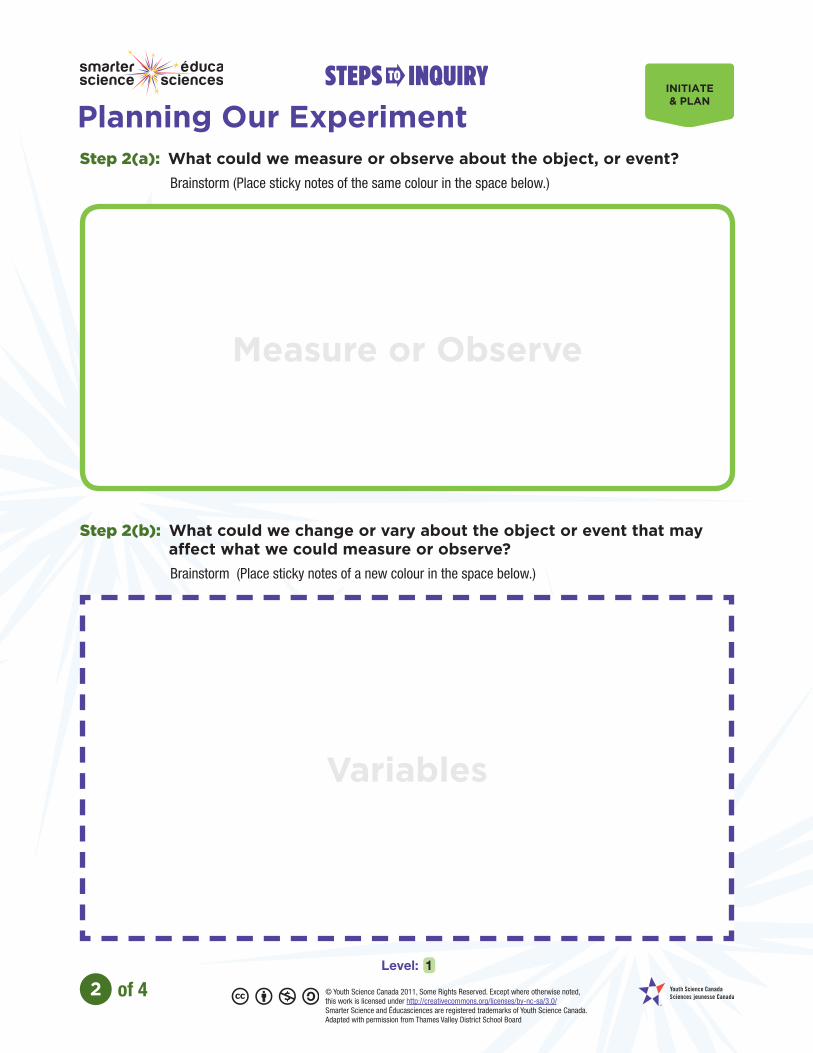
Variables
Measure or Observe
Step 2(b): What could we change or vary about the object or event that may affect what we could measure or observe?
Brainstorm (Place sticky notes of a new colour in the space below.)
INITIATE& PLAN
Planning Our ExperimentStep 2(a): What could we measure or observe about the object, or event? Brainstorm (Place sticky notes of the same colour in the space below.)
2 of 4Level: 1
© Youth Science Canada 2011, Some Rights Reserved. Except where otherwise noted, this work is licensed under http://creativecommons.org/licenses/by-nc-sa/3.0/Smarter Science and Éducasciences are registered trademarks of Youth Science Canada.Adapted with permission from Thames Valley District School Board
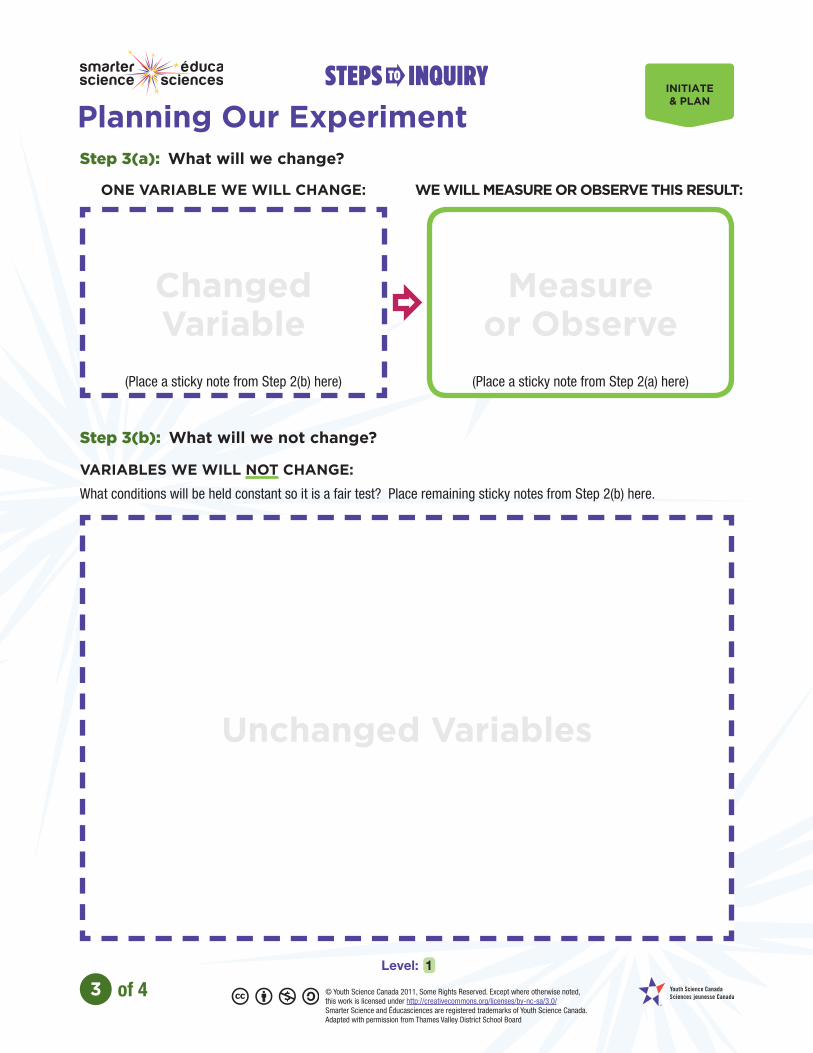
Unchanged Variables
Changed Variable
(Place a sticky note from Step 2(b) here)
Measure or Observe
(Place a sticky note from Step 2(a) here)
Step 3(b): What will we not change?
VARIABLES WE WILL NOT CHANGE: What conditions will be held constant so it is a fair test? Place remaining sticky notes from Step 2(b) here.
Step 3(a): What will we change?
INITIATE& PLAN
Planning Our Experiment
ONE VARIABLE WE WILL CHANGE: WE WILL MEASURE OR OBSERVE THIS RESULT:
3 of 4Level: 1
© Youth Science Canada 2011, Some Rights Reserved. Except where otherwise noted, this work is licensed under http://creativecommons.org/licenses/by-nc-sa/3.0/Smarter Science and Éducasciences are registered trademarks of Youth Science Canada.Adapted with permission from Thames Valley District School Board
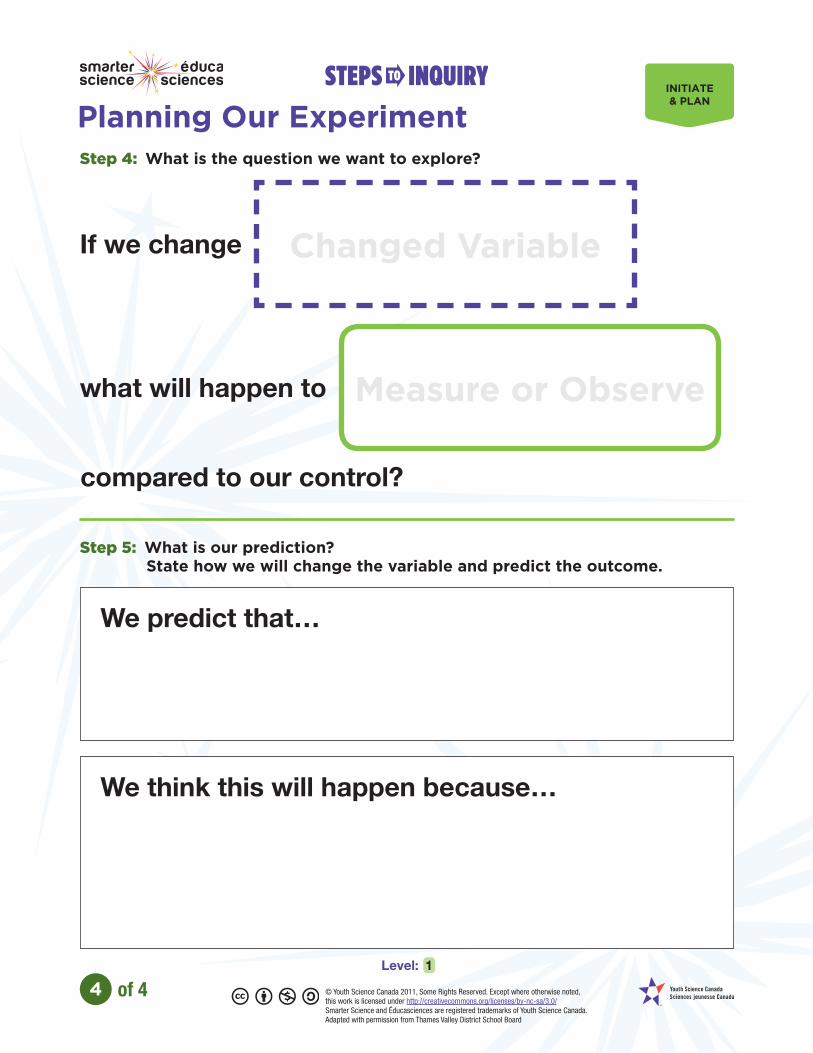
Step 4: What is the question we want to explore?
compared to our control?
INITIATE& PLAN
Planning Our Experiment
If we change Changed Variable
what will happen to Measure or Observe
Step 5: What is our prediction? State how we will change the variable and predict the outcome.
We predict that…
We think this will happen because…
4 of 4Level: 1
© Youth Science Canada 2011, Some Rights Reserved. Except where otherwise noted, this work is licensed under http://creativecommons.org/licenses/by-nc-sa/3.0/Smarter Science and Éducasciences are registered trademarks of Youth Science Canada.Adapted with permission from Thames Valley District School Board

Step 6: How will we test our prediction?
Changed Variable
OUR TEST SET-UP
Here’s how we will change the variable...(What will we do? How will we change the variable?)
OUR CONTROL SET-UP
Here’s how we won’t change this variable...(What will we do? How will we keep the variable the same?)
OUR TEST STEPS: OUR CONTROL STEPS:
Plan, Perform & RecordPERFORM& RECORD
1 of 3Level: 1
© Youth Science Canada 2011, Some Rights Reserved. Except where otherwise noted, this work is licensed under http://creativecommons.org/licenses/by-nc-sa/3.0/Smarter Science and Éducasciences are registered trademarks of Youth Science Canada.Adapted with permission from Thames Valley District School Board
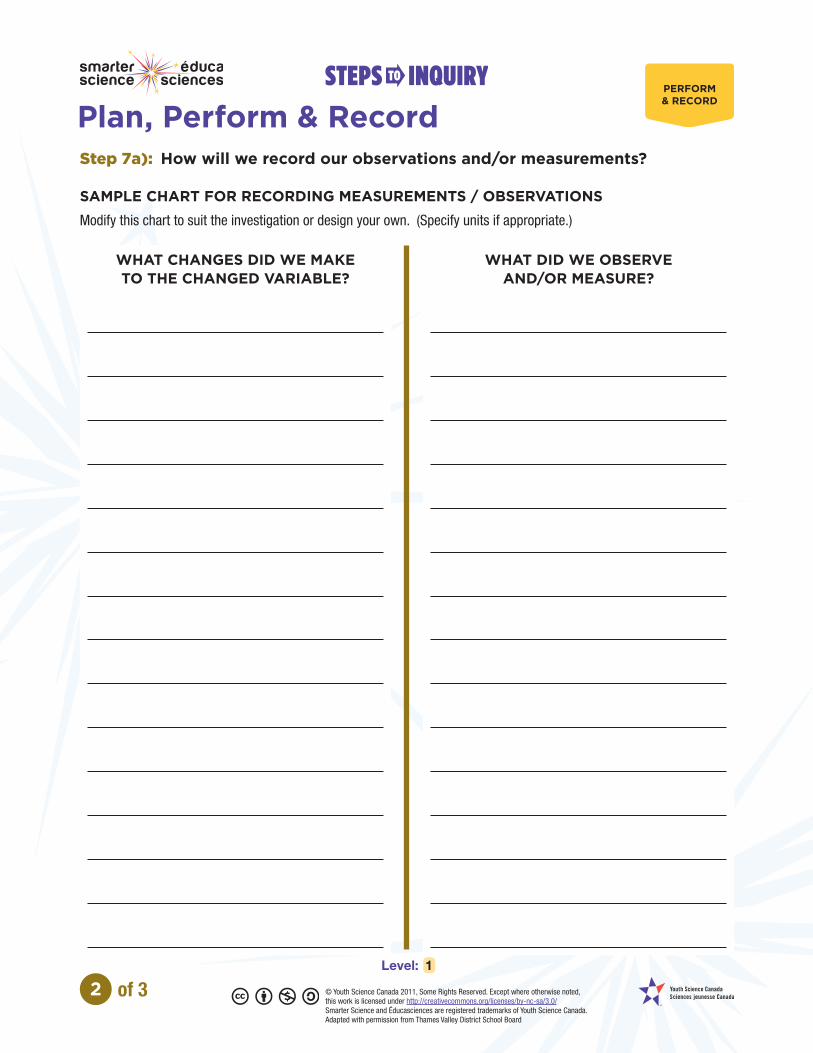
Step 7a): How will we record our observations and/or measurements?
SAMPLE CHART FOR RECORDING MEASUREMENTS / OBSERVATIONSModify this chart to suit the investigation or design your own. (Specify units if appropriate.)
WHAT DID WE OBSERVE AND/OR MEASURE?
WHAT CHANGES DID WE MAKE TO THE CHANGED VARIABLE?
Plan, Perform & RecordPERFORM& RECORD
2 of 3Level: 1
© Youth Science Canada 2011, Some Rights Reserved. Except where otherwise noted, this work is licensed under http://creativecommons.org/licenses/by-nc-sa/3.0/Smarter Science and Éducasciences are registered trademarks of Youth Science Canada.Adapted with permission from Thames Valley District School Board

Step 7b): Equipment Set-Up & Check
Step 7c): Perform Experiment and Collect the Data
Follow the procedure to complete the experiment. Record the data in your chart. (See Step 7a).
Have we ….
collected all of the materials?
organized and/or set-up our equipment properly?
reviewed our procedure and recording chart?
made changes where necessary?
Plan, Perform & RecordPERFORM& RECORD
3 of 3Level: 1
© Youth Science Canada 2011, Some Rights Reserved. Except where otherwise noted, this work is licensed under http://creativecommons.org/licenses/by-nc-sa/3.0/Smarter Science and Éducasciences are registered trademarks of Youth Science Canada.Adapted with permission from Thames Valley District School Board
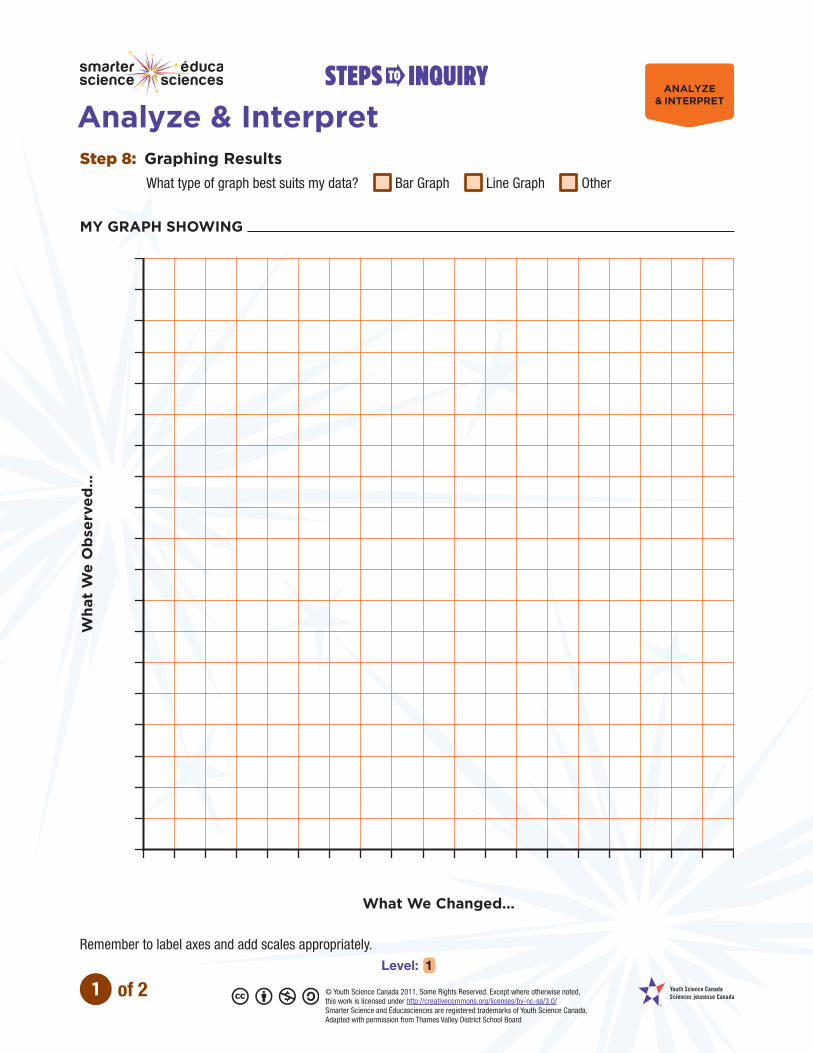
Step 8: Graphing Results What type of graph best suits my data? Bar Graph Line Graph Other
MY GRAPH SHOWING
What We Changed...
Wha
t W
e O
bse
rved
...
Remember to label axes and add scales appropriately.
Analyze & InterpretANALYZE
& INTERPRET
1 of 2Level: 1
© Youth Science Canada 2011, Some Rights Reserved. Except where otherwise noted, this work is licensed under http://creativecommons.org/licenses/by-nc-sa/3.0/Smarter Science and Éducasciences are registered trademarks of Youth Science Canada.Adapted with permission from Thames Valley District School Board
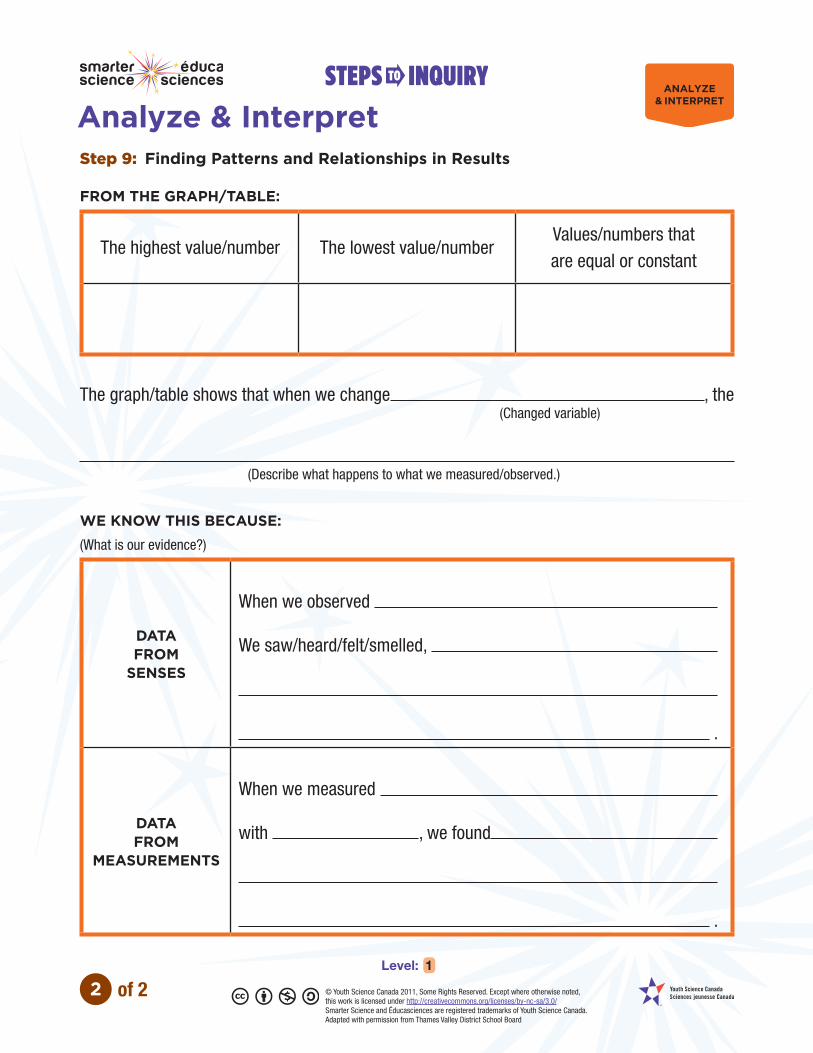
Step 9: Finding Patterns and Relationships in Results
FROM THE GRAPH/TABLE:
The highest value/number The lowest value/number Values/numbers that are equal or constant
The graph/table shows that when we change (Changed variable)
, the
(Describe what happens to what we measured/observed.)
WE KNOW THIS BECAUSE:(What is our evidence?)
DATA FROM
SENSES
When we observed
We saw/heard/felt/smelled,
.
DATA FROM
MEASUREMENTS
When we measured
with , we found
.
Analyze & InterpretANALYZE
& INTERPRET
2 of 2Level: 1
© Youth Science Canada 2011, Some Rights Reserved. Except where otherwise noted, this work is licensed under http://creativecommons.org/licenses/by-nc-sa/3.0/Smarter Science and Éducasciences are registered trademarks of Youth Science Canada.Adapted with permission from Thames Valley District School Board

Step 10(a): Communicating My Results
ANSWER THE QUESTION IN A GENERAL WAY.
When I increased / decreased
the changed variable
the
what I measured/observed
increased / decreased
MAKE A CONCLUDING STATEMENT BASED ON THE EVIDENCE.
Therefore, changing the changed variable
makes
the change in what I measured/observed
CONCEPT MAPDraw a word map that summarizes the idea you started with and what you did during this investigation
IDEA
CommunicateCOMMUNICATE
1 of 4Level: 1
© Youth Science Canada 2011, Some Rights Reserved. Except where otherwise noted, this work is licensed under http://creativecommons.org/licenses/by-nc-sa/3.0/Smarter Science and Éducasciences are registered trademarks of Youth Science Canada.Adapted with permission from Thames Valley District School Board

REFER TO YOUR PREDICTION.
THE DATA DOES SUPPORT MY PREDICTION…
THE DATA DOES NOT SUPPORT MY PREDICTION…
…because I predicted that
change in the changed variable
would make
the change in what I measured/observed .
I thought the changed variable
would cause this change because
.
…because I predicted that
change in the changed variable
would make
the change in what I measured/observed .
I thought the changed variable
would cause this change because
.
Now I know that the changed variable
doesn’t have that effect.
MAKE AN INFERENCE:
CommunicateCOMMUNICATE
2 of 4Level: 1
© Youth Science Canada 2011, Some Rights Reserved. Except where otherwise noted, this work is licensed under http://creativecommons.org/licenses/by-nc-sa/3.0/Smarter Science and Éducasciences are registered trademarks of Youth Science Canada.Adapted with permission from Thames Valley District School Board
CommunicateCOMMUNICATE
3 of 4Level: 1
© Youth Science Canada 2011, Some Rights Reserved. Except where otherwise noted, this work is licensed under http://creativecommons.org/licenses/by-nc-sa/3.0/Smarter Science and Éducasciences are registered trademarks of Youth Science Canada.Adapted with permission from Thames Valley District School Board
I think this happened because
.
CommunicateCOMMUNICATE
4 of 4Level: 1
© Youth Science Canada 2011, Some Rights Reserved. Except where otherwise noted, this work is licensed under http://creativecommons.org/licenses/by-nc-sa/3.0/Smarter Science and Éducasciences are registered trademarks of Youth Science Canada.Adapted with permission from Thames Valley District School Board
Step 10(b): Other Considerations
1. If you had data that was different from other groups (or was inconclusive or
inconsistent), what might have caused these results?
.
2. How might have you improved your investigation?
.
3. What new/additional questions do you now want to investigate?
.