institute for space studies - nasa for space studies ln65-20799 (accession
TRANSCRIPT

INSTITUTE FOR SPACE STUDIES
LN65-20799(ACCESSION<NUMBEIU . (THRU)
£ v
THE ATMOSPHERES OF MARS, VENUS AND JUPITER
S. I. RasoolRobert Jastrow
GPO PRICE $
OTS PRICE(S) $
Hard copy (HC)
Microfiche (MF)
tNASACRORTMX OR AD NUMBER) (CATEGORY)
GODDARD SPACE FLIGHT CENTERNATIONAL AERONAUTICS AND SPACE ADMINISTRATION
https://ntrs.nasa.gov/search.jsp?R=19650011198 2018-07-10T20:18:31+00:00Z

THE ATMOSPHERES OF MARS, VENUS AND JUPITER
S. I. Rasool
and
Robert Jastrow
Goddard Institute for Space StudiesNational Aeronautics and Space Administration
New York, New York
*Presented at the Symposium on "ExtraterrestrialBiology and Organic Chemistry" at IVth COSPARmeeting, Warsaw, Poland - June 3-12, 1963.

Composition, temperature and pressure are the three
parameters which determine the structure of a planetary
atmosphere.
Composition
In order to discuss the composition of a planetary
atmosphere, we shall go quite far back into the history of
our subject and deal first with the processes by which we/
believe the planetary atmospheres have evolved. By this
approach one can hope to gain an understanding of the conditions
which limit the structure and composition of the atmospheres
of different planets.
If we assume that the planets condensed from a contracting
solar nebula, then the initial composition of the planetary
atmospheres would be, in general, governed by the relative
abundances of elements in the sun. These are now fairly well
known and the abundances compiled by Aller (1961) are plotted
in Fig. 1.
-1-

The peaks in the curve reflect the stability of the
respective nuclear species, as one expects for equilibrium
concentrations produced by nucleosynthesis. In addition to
H and He, the C, N, O group is strong; the Mg, Al, Si group
is also strong, with Si the strongest; and Fe is very high.
The heavier-than-iron elements fall off rapidly by 3 or more
orders of magnitude, with fractional concentrations running
about 10~9 or 10~10.
These abundances give us an indication of the composition
to be expected in the contracting cloud which formed the
primitive sun. Apart from hydrogen and helium, which should be
the most abundant constituents, we expect HO, perhaps NH~ and
CH , oxides of C, N, Mg, Si, and Fe, all loosely joined in complex
and irregular chains to make macromolecules and dust particles.
It is presumably aggregates such as these which provided the
original material of the planets. On this basis, it is under-
standable that the composition of the earth should be dominated
by silicon oxides plus oxides and carbonates of Mg and Ca.
From these considerations it also seems very probable that
the initial composition of the planetary atmospheres will be
-2-

dominated by
H2, He, CH4, NH3, H2O, CO2, N2, etc,
Given this primitive composition, the atmospheres will
then have developed with time through four primary processes:
1) The gravitational escape of gases into the inter-
planetary space.
2) The exhalation of gases from the interior of the planets
3) Chemical reactions of gases in the atmosphere with
the solid material of the planet.
4) The photodissociation and ionization of gases by the
solar radiation.
Also contributing secondarily are the capture of gaseous
constituents from the interplanetary medium and radioactive
decay products.
Gravitational Escape of Gases. At any level in an atmosphere
a number of atoms and molecules will be moving upward with
-3-
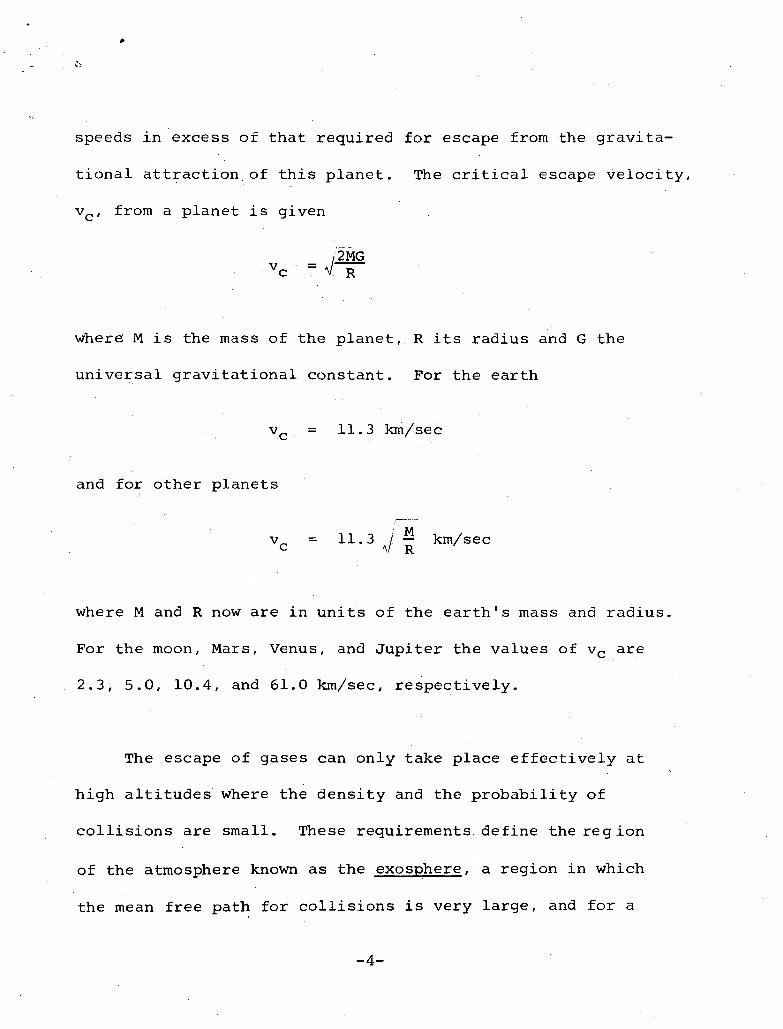
speeds in excess of that required for escape from the gravita-
tional attraction of this planet. The critical escape velocity,
vc, from a planet is given
i2MGvc =V—
where; M is the mass of the planet, R its radius and G the
universal gravitational constant. For the earth
VG = 11.3 km/sec
and for other planets
' Mv^ = 11.3 / — km/secc v R
where M and R now are in units of the earth's mass and radius.
For the moon, Mars, Venus, and Jupiter the values of vc are
2.3, 5.0, 10.4, and 61.0 km/sec, respectively.
The escape of gases can only take place effectively at
high altitudes where the density and the probability of
collisions are small. These requirements define the region
of the atmosphere known as the exosphere, a region in which
the mean free path for collisions is very large, and for a
-4-
particle moving in outward direction the probability of collision
is only half. Atmospheric particles in the exosphere therefore
execute ballistic trajectories in the gravitational field of
the planet.
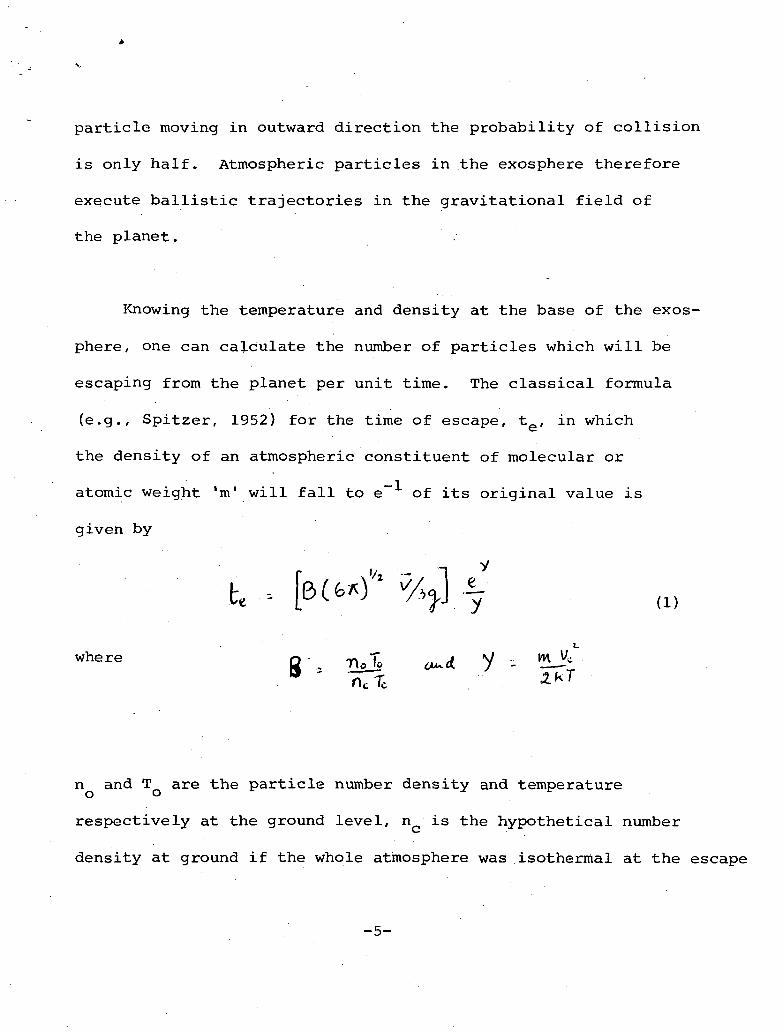
Knowing the temperature and density at the base of the exos-
phere, one can calculate the number of particles which will be
escaping from the planet per unit time. The classical formula
(e.g., Spitzer, 1952) for the time of escape, t , in which
the density of an atmospheric constituent of molecular or
atomic weight 'm1 will fall to e~ of its original value is
given by
t (1)
where
n and T are the particle number density and temperatureo o
respectively at the ground level, n is the hypothetical number
density at ground if the whole atmosphere was isothermal at the escape
-5-

level temperature T , R is the radius of the planet, V is the
root mean square velocity of the escaping particles, and v
is the velocity of escape.
In the case of the earth, the average temperature of the
exosphere has recently been determined to be ~ 1650 °K. For
this value of the exospheric temperature, the time of escape of
hydrogen from earth is ~ 1000 years. As the age of the planets
is about 5 billion years, the abundance of hydrogen in the atmos-
phere of the earth is comprehensible. Such gases as CH and
NH , which are readily dissociated by solar ultraviolet radiation,
would also lose their hydrogen, and their relative scarcity
is therefore understandable.
The case of water is different. Due to the low temperature
of the tropopause, almost all the terrestrial water vapor remains
confined to the troposphere. The extreme ultraviolet which can
dissociate water vapor does not reach the troposphere, being
attenuated by ionizing and dissociative processes at the top
of the atmosphere. An extremely minute amount, corresponding
to the saturated vapor pressure of water at 200 °K, will
-6-
traverse the tropopause and will be susceptible to dissociation
in the upper atmosphere. This special circumstance preserves
the water on our planet.
For helium the time of escape from the earth calculated
from equation (1) will be of the order of 10 years. The
equilibrium amount of helium in the atmosphere at any time will,
however, depend both on the rate of outgassing of helium from the
crust and the rate of its escape from the exosphere. Such
calculations indicate that, the amount of helium in the earth's
atmosphere should be higher than it is observed. This dis-
crepancy is not for the present very well understood
(MacDonald, 1963).
From the above discussion it is clear that atmospheric
constituents of molecular or atomic weight > 6 have probably
been retained by the earth up to the present time, but, as almost
all hydrogen must have escape, the present atmosphere of the
earth should be in a highly oxidized state.
In Fig. 2 are plotted the times of escape of elements for Earth,
Mars and Venus as a function of their atomic weights (Stewart,1963).
-7-

These calculations have been made on the assumption that the
exospheric temperature of Mars is 1100 °K (Chamberlain, IS 62)
and that of Venus is 2600 °K (Walker and Jastrow, 1963).
Venus, according to these considerations, must have also
lost its hydrogen, while still retaining all the heavier
elements. Mars loses its lighter elements at a still
faster rate but the escape calculations suggest that some
atomic oxygen may however be retained on Mars till the
present time.
The curve for Jupiter is not shown in Fig. 2, because
the time of escape, even for hydrogen, is of the order of
10 years. We therefore expect that the atmosphere of
Jupiter and of other giant planets would still have a
composition similar to that of solar atmosphere.
The atmosphere of the earth is composed of 79% nitrogen
and 21% oxygen, with only traces of CO2, HO and argon.
-8-

However, in the atmosphere of another planet, which may have
a similar molecular composition, the relative abundances of
these molecules may be entirely different. On the earth
the presence of free oxygen is probably a special circum-
stance which is connected with the presence of life. The
CO abundance in the atmosphere is limited by the reaction
of the gas with the crust and the formation of carbonates,
while the amount of water vapor is extremely sensitive to
the temperature environment of the planet.
Therefore, although from the considerations of gravita-
tional escape of gases we may expect the same molecular
composition for Mars and Venus, no predictions can be made -
regarding the relative abundances of these gases in these
atmospheres.
The earth's atmosphere is "mixed" up to the altitude
of 90 km, and therefore on an average the composition does not
vary as a function of height. The mean molecular weight is ap-
proximately 29, and the total pressure at the surface is 10° dynes/cm^,
-9-

The number density at the ground is 2 x 10 . mol/cm .
For an isothermal atmosphere in hydrostatic equilibrium,
the variation of density with height is given by the formula
f -
in which j and f are the densities at height h and ho , m
is the average molecular weight per particle, T the tempera-
ture between h and ho , g the acceleration of gravity and
k the Boltzmann constant.
The quantity 'i-i is the scale height, H, of the atmos-
phere; at an altitude of one scale height the density being
reduced by a factor of e. For a mean temperature of 250 °K
in the first 80 km of the atmosphere, the atmospheric scale
height is ~ 8 km.
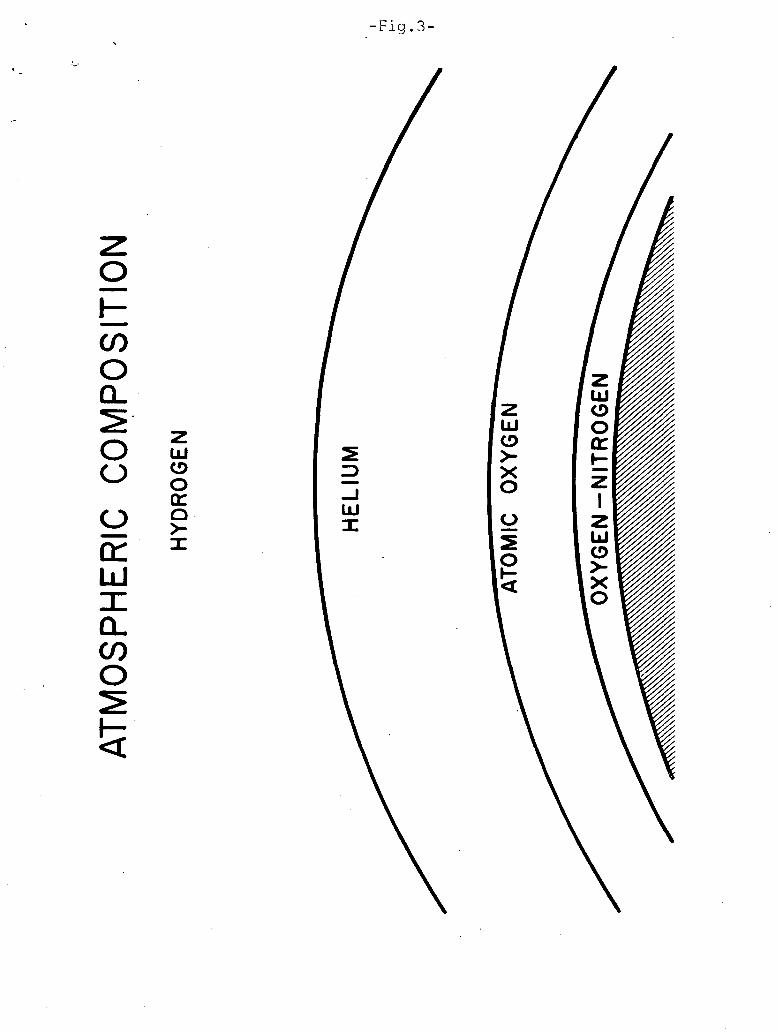
Above 120 km the diffusive separation sets in and the
pressure of each constituent varies in accordance with the
scale height calculated for its own molecular weight.
-10-

Fig. 3 shows the change in composition in the earth's
atmosphere with altitude as deduced from the recent experi-
mental results obtained by means of satellites.
In the case of Mars, Venus and Jupiter, we expect the
lower atmospheres to be "mixed" also while the upper atmos-
pheres of these planets will be in diffusive equilibrium;
the major constituent of the atmosphere at the extremity will,
in each case, be hydrogen.
Temperature
The temperature of a planet depends on its distance from
the sun. In the case of the earth, the solar radiation flux,
with an effective black body temperature of ~ 6000 °K, reaching
the top of the earth's atmosphere, has a value of ~ 1.4 x 10
*y
ergs/cm/sec. Part of this radiation (39%) is immediately
'reflected' back to space by clouds and the atmosphere and does
not play any role in the energy balance of the planet. Most
of the remaining 61% of the solar radiation, mainly composed of
the visible part of the spectrum, penetrates down to the
-11-

ground and heats the surface to a certain temperature denoted as(Te),
the effective temperature of the planet-/ In the case of fast
rotating planets (e.g., Earth, Mars, Jupiter)
TJ1 - -̂ ('-•*)H -or
where S.C. is the solar constant or the radiation flux received
at the top of the atmosphere' and A is the albedo of the planet
over the whole solar spectrum. For the values of S.C. and albedo
given above, the Te for earth is 245 °K.
The surface radiating at this relatively low temperature
emits primarily in the far infrared. A large-fraction of the
radiation emitted by the surface is immediately absorbed by
molecules of C02 and H2O present in the lower layers of the
earth's atmosphere. A part of this absorbed energy in the
infrared is returned to the surface and provides extensive
heating of the ground, raising the surface temperature to the
observed value of ~ 290 °K.
This additional heating of the surface of ~45 °K by the
return of infrared radiation from the atmosphere is referred
-12-

to as the "greenhouse effect" and is an essential element in
understanding the radiation budget of the planet.
The magnitude of the "greenhouse effect" caused by a
planetary atmosphere can be estimated by approximating the
solution to the radiative transfer equation. The ground tempera-
ture TQ is then given by the equation
e ( I +• ̂ * . (2)
where T^ is the effective black.body temperature of the planet
and T is the total optical thickness of the atmosphere in the
infrared. This solution is based on the assumption that the
atmosphere is in radiative equilibrium. In the case of earth
for the observed value of surface temperature of 290 K, the
total optical thickness of the atmosphere from equation (2) is
~ 2, which corresponds to the infrared absorption of ~ 86%.
It is fairly well known that the amount of water vapor and the
CO2 in the earth's atmosphere do actually have an average
opacity of ~ 90% over the whole infrared spectrum.
-13-

In the following table are given the values of the
effective black body temperatures for the other planets and
also the most reliable values of the observed surface tempera-
tures. In the case of Jupiter, TG refers to the cloud top
temperature. The differences give the magnitude of the "green-
house effect" for each planet which in turn provide an estimate
of the optical thickness of the atmosphere in the infrared.
TABLE I,
Mars Earth Venus Jupiter
Te (°K) 209 245 235 105
TG (°K) 230 290 600 170
GoH.E. (°K) 21 45 370 65
Optical thicknessof the atmosphere 0.5 2.0 42 7.8in the infrared
On Mars the "greenhouse effect" is very small which gives
an optical thickness of the atmosphere of only 0.5, indicating
that the atmosphere is optically thin; therefore, we do not
expect excessively large amounts of polyatomic gases like H20,
» etc., which have intense absorption bands in the far
-14-

infrared. On the other hand, for Venus, the magnitude
of the "greenhouse effect" is extremely large compared to the
earth or Mars, and the atmosphere must be almost completely
opaque to the far infrared radiation from the planet. Large
amounts of polyatomic gases should be abundant on Venus.
The atmosphere of Jupiter above the clouds should have an
optical thickness of ~ 8 in order to explain the cloud top
temperature of 170 °K. We therefore also expect polyatomic gases
which absorb in the far infrared at wavelengths greater than
20 »t, where most of the planetary radiation will be confined.
With these considerations in mind, we now turn to the
observed properties of the atmosphere's of these planets.
MARS
The following table summarizes reliable physical data
for Mars.
-J.O-

TABLE II.
Mean Distance from sun
Mean Equatorial daimeter
Length of day
Length of year
Mass
Mean Density
Gravity
Total integrated albedo
Effective black body temperature
1.52 A.U.
6790 km
1.0012 earth day
1.8808 earth year
0.1078 (earth 1)
3.90 gm/cm3
377 cm/sec2
0.26
209 °K
Composition and Surface Pressure
The only gases that have been spectroscopically detected
up to now in the atmosphere of Mars are carbon dioxide and water
vapor. Their abundances have been estimated by several authors,
but generally accepted values of the amounts of these gases in
the atmosphere of Mars are not yet available. The best estimates,
at the present time, vary within the following ranges:
-16-
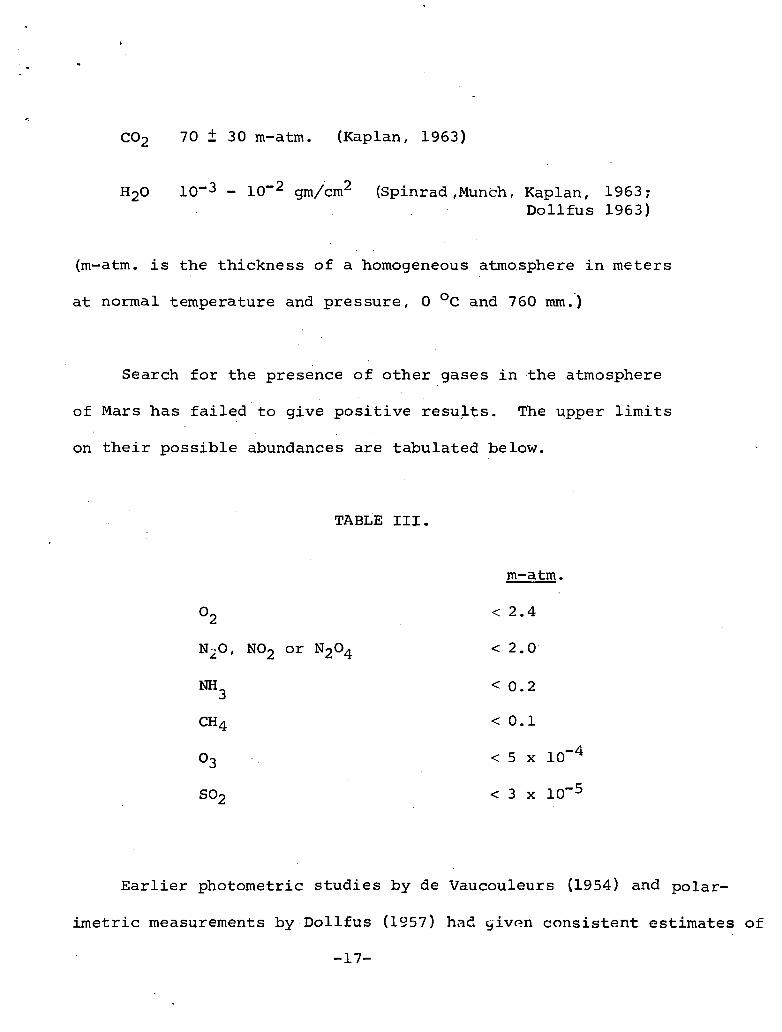
CO2 70 ± 30 m-atm. (Kaplan, 1963)
H2O 10-3 - 10~2 gm/cm2 (Spinrad ,Munch, Kaplan, 1963;Dollfus 1963)
(m-atm. is the thickness of a homogeneous atmosphere in meters
at normal temperature and pressure, 0 °C and 760 mm.)
Search for the presence of other gases in the atmosphere
of Mars has failed to give positive results. The upper limits
on their possible abundances are tabulated below.
TABLE III.
m-atm.
02 < 2.4
N2O, N02 or N2O4 < 2.0
NH3 < 0.2
CH4 < 0.1
03 < 5 x 10~4
SO2 < 3 x 10~5
Earlier photometric studies by de Vaucouleurs (1954) and polar-
imetric measurements by Dollfus (1957) had given consistent estimates of
-17-
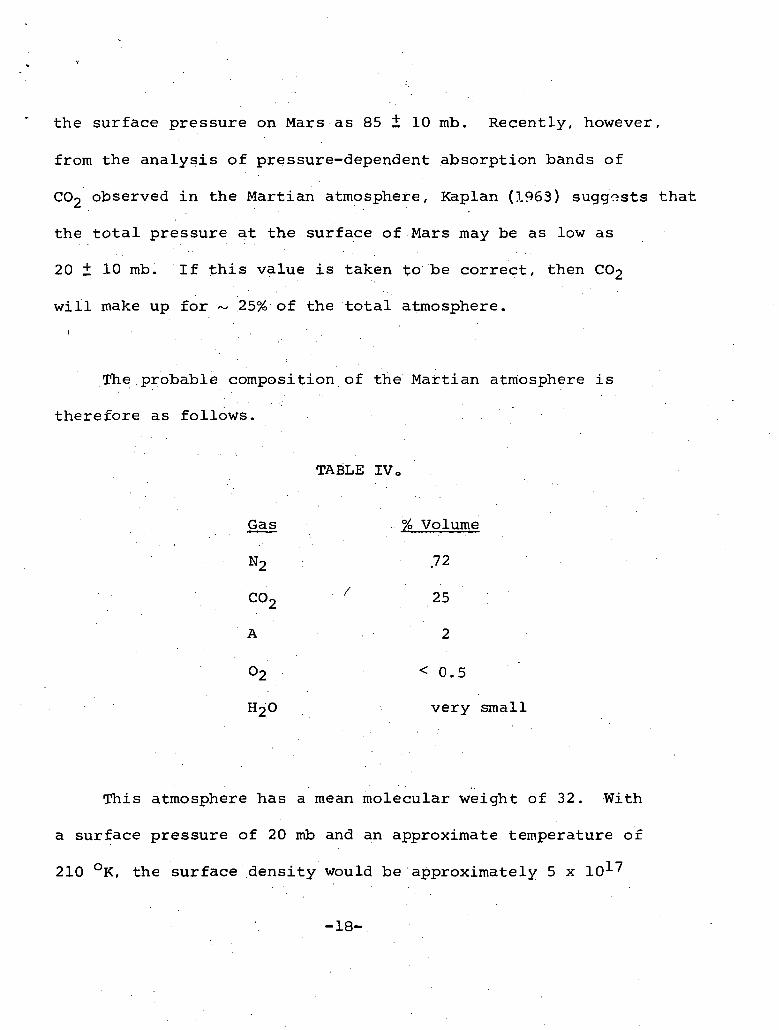
the surface pressure on Mars as 85 i 10 rab. Recently, however,
from the analysis of pressure-dependent absorption bands of
CO2 observed in the Martian atmosphere, Kaplan (1963) suggests that
the total pressure at the surface of Mars may be as low as
20 ± 10 mb. If this value is taken to be correct, then CO2
will make up for ~ 25% of the total atmosphere.
\ • . ' . .
The probable composition of the Martian atmosphere is
therefore as follows.
TABLE IV 0
Gas
N2
co2
A
% Volume
.72
/ 25
2
02 < 0.5
H20 very small
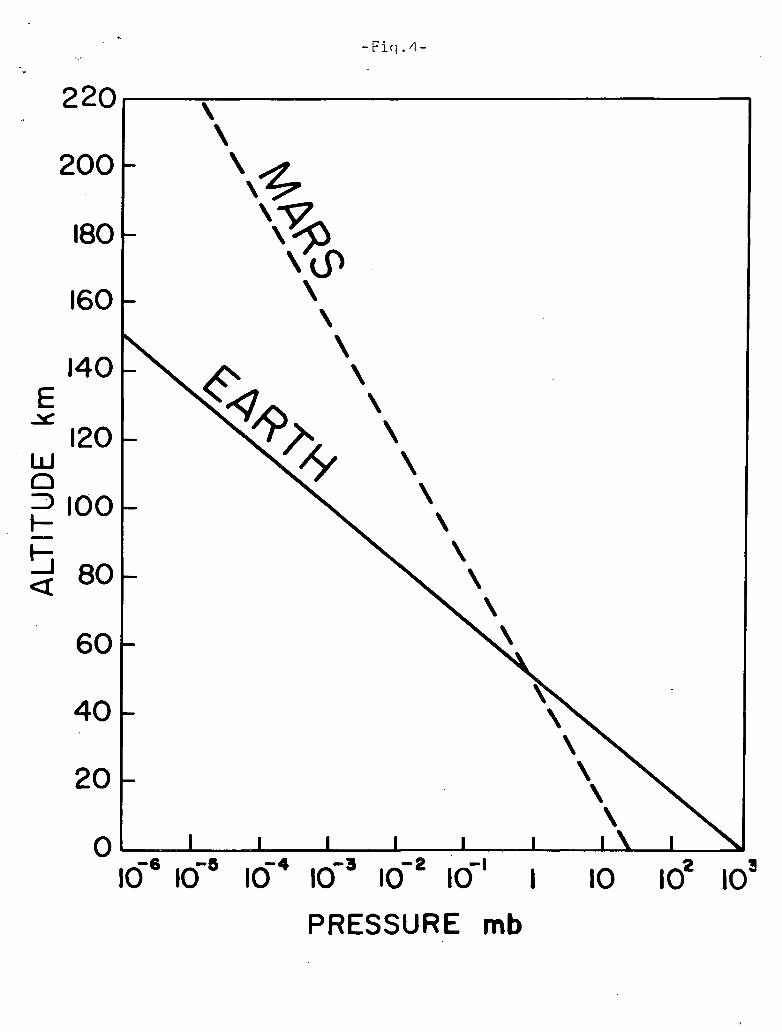
This atmosphere has a mean molecular weight of 32. With
a surface pressure of 20 mb and an approximate temperature of
210 °K, the surface density would be approximately 5 x 10⁻¹-7
-18-

particles/cm which, for an isothermal atmosphere, should
decrease exponentially with altitude with a scale height of
~ 16 km. The vertical distribution of pressure for this model
is shown in Figure 4. Results of a similar computation for earth,
assuming an isothermal atmosphere at 250 °K, are also shown in
the figure and are in accord with recent rocket measurements.
It is interesting to note that although the pressure at the
surface of Mars is about 1/50 of the earth's, at an altitude of ~
60 km the two atmospheres have the same pressure, and above this
height the pressure in the Martian atmosphere is greater than
the pressure at the corresponding height in the earth's
atmosphere. Because the decrease of density with height of
Mars is almost two times slower than in the earth, the levels of
the ionosphere and thermosphere on Mars would be much higher than
on the earth.
Temperature
Planetary temperatures are usually estimated by measuring
the infrared radiation emitted by the planet. Large part of
the infrared spectrum is , however, absorbed by the water vapor
and CO present in the earth's atmosphere. Ground based observations
-19-

of the planets in the infrared are therefore confined to the
8-12 n region where the earth's atmosphere is relatively
transparent. This spectral region in the infrared is
known as the atmospheric "window".
Extensive temperature measurements of Mars by infrared
radiometry in this "window" of the terrestrial atmosphere have
been made since 1926, and the results to date are quite consistent.
Since the Martian atmosphere should also be largely transparent
in the 8-12 u "window", it is assumed that the radiation intensity
measurements in this wavelength region refer to the surface of
the planet.
Some of the earlier investigators were also able to scan
the planetary disc latitudinally and longitudinally so as to
obtain the diurnal and seasonal variation of temperature as a
function of latitude. The up-to-date information can be
summarized as follows:
-20-
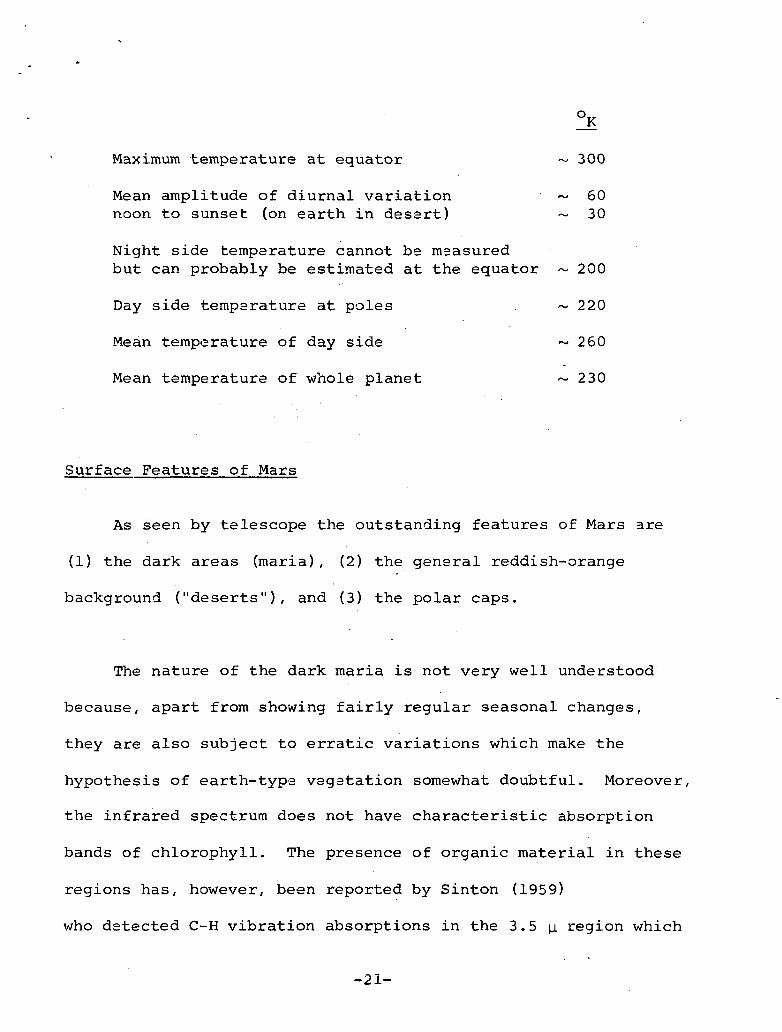
Maximum temperature at equator ~ 300
Mean amplitude of diurnal variation ~ 60noon to sunset (on earth in desert) ~ 30
Night side temperature cannot be measuredbut can probably be estimated at the equator ~ 200
Day side temperature at poles ~ 220
Mean temperature of day side ~ 260
Mean temperature of whole planet ~ 230
Surface Features of Mars
As seen by telescope the outstanding features of Mars are
(1) the dark areas (maria), (2) the general reddish-orange
background ("deserts"), and (3) the polar caps.
The nature of the dark maria is not very well understood
because, apart from showing fairly regular seasonal changes,
they are also subject to erratic variations which make the
hypothesis of earth-type vegetation somewhat doubtful. Moreover,
the infrared spectrum does not have characteristic absorption
bands of chlorophyll. The presence of organic material in these
regions has, however, been reported by Sinton (1959)
who detected C-H vibration absorptions in the 3.5 |j region which
-21-

were absent in the reflection spectrum of the desert areas.
The probability of the existence of life on Mars is
controversial and beyond the scope of this review; but it
will be desirable to see the observations of C-H bands on Mars
repeated and probably substantiated by infrared spectroscopic
measurements of the terrestrial "dark and bright" areas from
an earth satellite.
The large orange areas of Mars are responsible for the
reddish color of the planet seen by the naked eye. According
to Kuiper (1952) they are composed of felsite rhyolite.
The polar caps are rather reliably known to be a layer of
HO frost a few centimeters thick deposited on the surface.
These caps are observed to expand to lower latitudes during
fall and winter and to recede to high latitudes during spring
and summer. The observed evaporation of-the polar caps in
summer and the almost immediate transport of the water vapor
towards the winter pole across the equator is a special meteoro-
logical phenomenon peculiar to Mars. In the earth's atmosphere
-22-

the hemisphere to hemisphere mixing is extremely small.
The average speed of this "humidity wave" across the planet
has been estimated to be about 45 km/day. This pole to pole
circulation can perhaps only be understood by the greater length
of the Martian year and the increased temperature differences
between the cold and warm poles. In the summer the pole is
the warmest region on the planet.
Blue Haze Layer
Photographs of Mars taken through blue filters indicate
no surface features, and it is therefore believed to be covered
with a haze layer known as "blue haze", absorbing at these
wave lengths. Sometimes during the opposition, however, it
clears over certain regions, and surface features become
observable in the blue. These "blue clearings" last usually
a few days. Conflicting arguments have been extended to explain
the nature of the blue haze, but an explanation which satisfies
all the observed features is yet to be found.
-23-
Clouds
Several types of thin clouds have been frequently observed
on Mars. They can be divided into three types:
A) Blue clouds, which are visible only in the blue. They
are in patches and are seen near the poles and near the
terminator. Polarization measurements indicate their particle
size to be approximately 0.1 u. They probably occur at alti-
tudes less than 100 Km. According to Goody (1957), they may be
composed of ice crystals formed on the nuclei fed by the haze
layer, while others believe them to be of the same material as
the blue haze.
B) White clouds, which are visible both in the blue and
yellow light. The polarization studies of these clouds suggest
their nature to be the same as ice crystal clouds of a size of
~ 1 ij.. Being composed of bigger particles, they probably lie
at altitudes less than that of blue clouds.
C) Yellow clouds, visible only in yellow, are very rare
and variable in size. They have been seen drifting several
hundred miles across the planet at a velocity of 60 km/hr.
According to Goody (1957), they are composed of-the same blue
-24-
absorbing material as the blue haze. Hess (1958) estimates their
height to be ~ 6-7 km.
Vertical Distribution of Temperature
The atmosphere of Mars is optically thin in the infrared,
and the probable absorbing gases are CO and HO, which are^ ^
also present in the earth's atmosphere. The vertical temperature
profile in the atmosphere of Mars, therefore, cannot be deter-
mined by observation from the surface of the earth. Only
theoretical estimates exist for the vertical temperature structure
of Mars. The most recent computations of this nature are due to
Arking (1963), Ohring (1963) anc! Chamberlain (1962).
Arking has calculated a model atmosphere for Mars, allowing
for convection and using the exact equation of radiative transfer
for frequency independent absorption. A total optical thickness
of 0.5 was chosen to obtain a surface temperature of 235 K,
consistent with the observed mean surface temperature. Assuming
an effective black body temperature of 217 °K, an adiabatic
gradient of -3.7 K/km in the convection zone and an exponential
-25-

dependence, of absorption on altitude with a scale height of
17 km, the temperature profile shown in Figure 4 (insert) is
obtained. The convection zone is found to extend up to 8 km.
Ohring also has recently investigated the vertical tempera-
ture profile for a model Martian atmosphere containing two
percent CO , ninety-eight percent N and no water vapor. The^ ^
ground temperature was assumed to be 230 °K and the transfer of
radiation in the atmosphere was calculated for frequency dependent
absorption by the CO . The tropopause in this case was found
to be at 9 km at a temperature of 196 °K. In the stratosphere
the temperature keeps on decreasing and reaches a value of as
low as 90 °K at an altitude of 42 km, where the total pressure
is 2.5 mb.
Now that the mixing ratio of CO in the Martian atmosphere
is known to be much higher, new calculations for 'non-grey1
atmosphere are desirable.
The above mentioned results of the temperature distributions
in the Martian atmosphere do not take into account possible
-26-
heating of the lower atmosphere by direct absorption of solar
radiation in the ultraviolet. In the case of the terrestrial
atmosphere, the or-.one heating produces a temperature maximum at
50 km, but on Mars, with much less oxygen compared to earth,
ozone would be confined to lower layers of the atmosphere.
The solar radiation in the region of 2500 A, responsible for
ozone dissociation and atmospheric heating, will therefore pene-
trate to a much lower depth in the Martian atmosphere. Due tot
a higher atmospheric density at this level (compared to the density
in the earth's atmosphere at 50 km) and because of the lower
intensity of the solar radiation at the distance of Mars, the
heating rates will probably not be as important as in the ozono-
sphere on earth. Still they may affect the temperature gradients
substantially and limit the extent of the convection zone.
Assuming an atmospheric composition of 98% N and two percent
oCO , and a Martian stratospheric temperature of 134 K, (Goody, 1957)
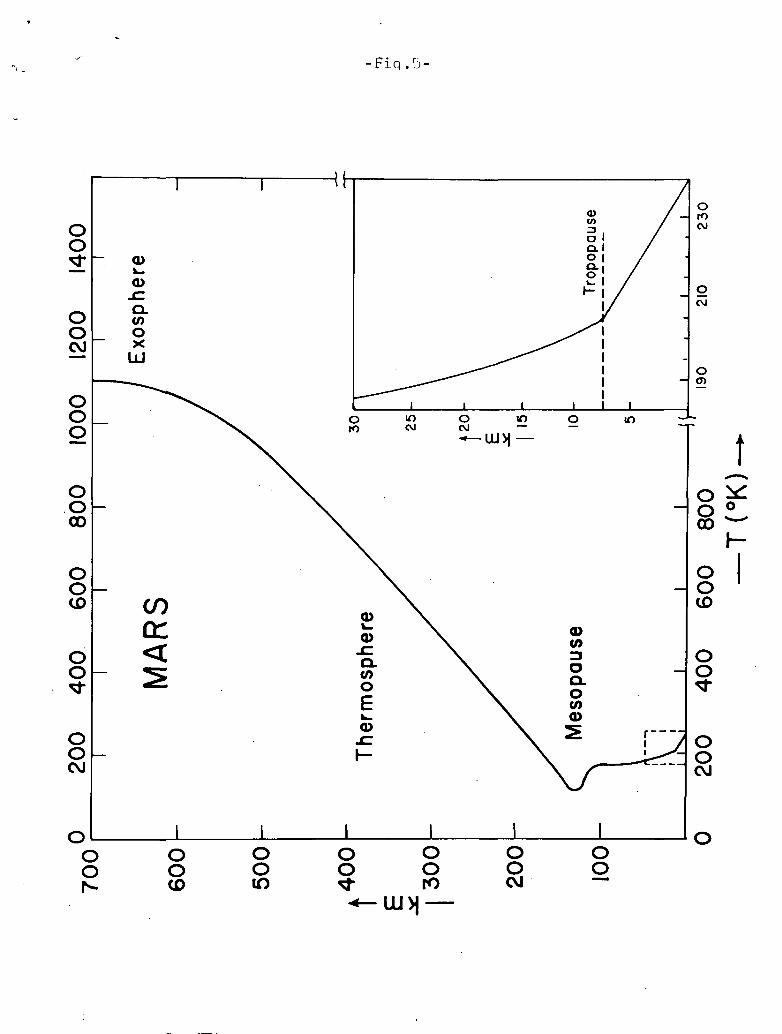
Chamberlain (1962) has recently computed the mesospheric cooling
and thermospheric heating for Mars. With the assumed model atmos-
phere and from the considerations of CO_ dissociation into CO
and O and the consequent CO cooling at the mesopause, Chamberlain
-27-

deduces the height of the mesopause as — 130 km at a temperature
of 75 °K. The considerable CO cooling at the mesopause level
acts as "an effective thermostat, keeping the temperature at
the exospheric or escape level (1500 km) from exceeding 1100 °K."
Fig. 5 shows the vertical distribution of temperature in
the Martian atmosphere. The temperatures up to an altitude of
100 km are based on the results obtained by Arking, while for
above this altitude the upper atmospheric model developed by
Chamberlain has been used.
VENUS
Venus is our nearest planetary neighbor and, after the sun
and moon, the brightest object in the sky. It has therefore
attracted the attention of man since the beginning of civiliza-
tion. Despite the great interest, however, very little is known
about the atmosphere of this planet, especially when compared
with the information we have about Mars. The main reason for
this deficiency is that Venus is covered with a layer of white
-28-
clouds, and the surface remains permanently invisible. Observa-
tions have, however, been made in the infrared and radiofrequency
regions, and new information regarding the composition and tem-
perature distribution in the Venus atmosphere has been obtained
in the last few years. These new results of temperature and
pressure at the various levels in the Venus atmosphere have forced
a complete revision of ideas regarding the atmospheric structure
of this planet. We shall try to summarize our present-day
knowledge regarding the Venus atmosphere by first giving the
physical constants of the planet and then reviewing the current
hypotheses regarding its structure.
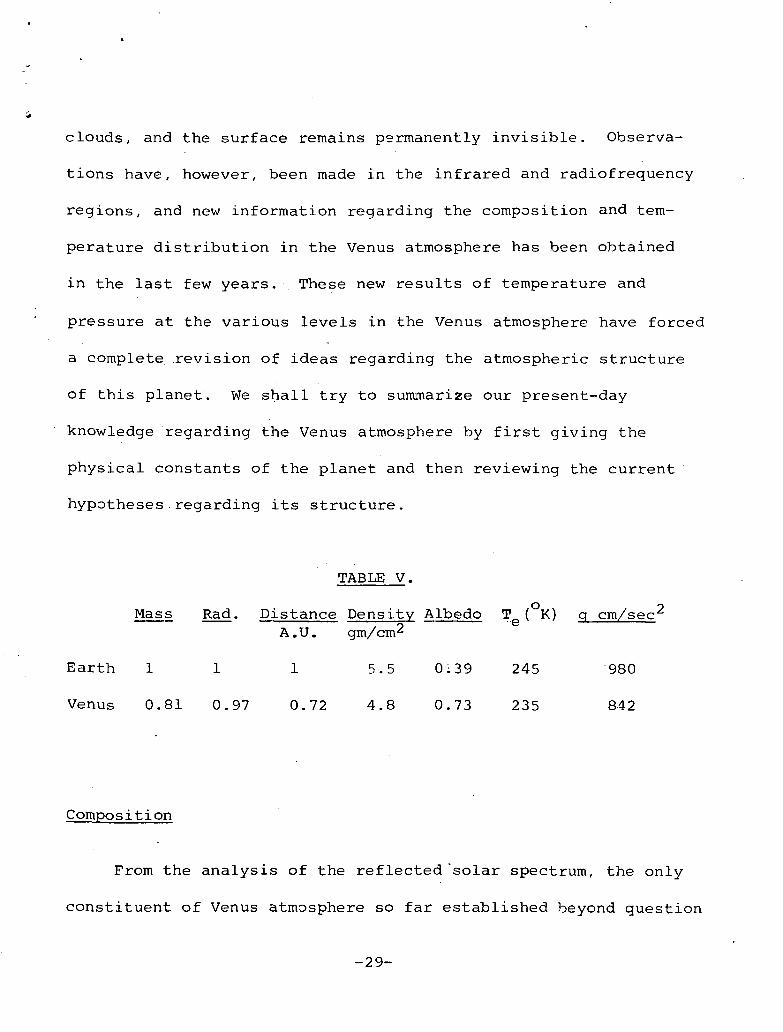
TABLE V.
O 9Mass Rad. Distance Density Albedo T ( K) q cm/sec
A.U. gm/cm^
Earth 1 1 1 5 . 5 0139 2 4 5 9 8 0
Venus 0.81 0.97 0.72 4.8 0.73 235 842
Composition
From the analysis of the reflected "solar spectrum, the only
constituent of Venus atmosphere so far established beyond question
-29-
ris CO . Its abundance above the effective "reflecting level"
of the sunlight has been estimated by several workers. Recent
reinterpretations of the old spectra of Venus by Spinrad (1962)
give a CO /atmosphere ratio of only 5% by mass.
The scattering and polarizing properties of the clouds
correspond to fine droplets of ~ 2 u in diameter with the
refractive index of water. However, Spinrad has carefully
examined a high dispersion spectrogram of Venus taken by Adams
and Dunham (1932) at a time when there were apparently "breaks"
in the clouds, and he has concluded that the mixing ratio of
water vapor down to a pressure of 8 atmospheres was less than
one part in 10 .
At the same time, Dollfus (1963) has identified water
vapor absorption in the upper atmosphere of Venus, and obtains
a mixing ratio of 10 or 10~5 by mass, depending upon the
cloud top pressure.
From the observed equality in the radar reflectivity of
Venus at 68 and 12.5 cm (Muhleman, 1963), Thaddeus (1963) has recently
f\
calculated an upper limit of 3 gm/cnr to the total amount of
-30-

water vapor which could be present in the atmosphere of Venus.
From these results the atmosphere of Venus seems to be extremely
dry, but a generally accepted value for the amount of water
vapor present is not yet available.
Sinton (1963) has presented evidence for the existence of
Co above the reflecting level of two micron photons. However,
Kuiper (1963) has not detected this gas in his recent analysis
of high resolution spectra of Venus.
Urey (1957) has noted that as much as 80 m-atm of oxygen
could exist above the clouds without having been detected. Also
according to Urey, CH and NH cannot be important constituents
of the atmosphere in the presence of CO , and the oxides of
nitrogen cannot be expected in any planetary atmosphere because
they are unstable against decomposition into Np and O . It£
seems likely that the bulk of the atmosphere is composed of NL.
Rare gases may also be present as minor constituents.
The likely composition of the atmosphere of Venus is
therefore as follows:
-31-

TABLE VI.
Gas Percentage by Mass
N2 95
C02 5
H20 < 10~6
Pressure
There is conflicting evidence concerning the pressure at
the cloud top level. A difference in the polarization of red
and green light reflected from the cloud top has been interpreted
by Dollfus (1961) as the result of molecular scattering in an
atmosphere 800 m. thick at STP, which corresponds to a cloud
top pressure of 90 mb. Sagan (1962) has analyzed Spinrad's
results on the temperature-pressure combinations indicated by
C0_ lines on different plates, and he concludes that the cloud
top pressure on the illuminated side lies between 0.53 and 0.83 atm.
This is consistent with Kaplan's (1961) discussion of the pressure
broadening of the 1.6 |_i CO2 bands.
-32-
From other considerations Sagan also derives a cloud top
pressure of 90 mb for the night side of Venus with an uncertainty
of a factor of 3.
Estimates for the pressure at the surface of Venus range
from 7 atm to 200 atm. These will be discussed in more
detail in a later section.
Temperature
Cloud top. Sinton and Strong (1960) have repeatedly
measured the planetary emission from the cloud top in the 8-12 u
region and find a temperature value of 235 - 10 °K. This tempera-
ture probably refers to the cloud top level of the Venus atmosphere.
Recent results from Mariner II seem to confirm this conclusion
(Chase, Kaplan and Neugebauer, 1963).
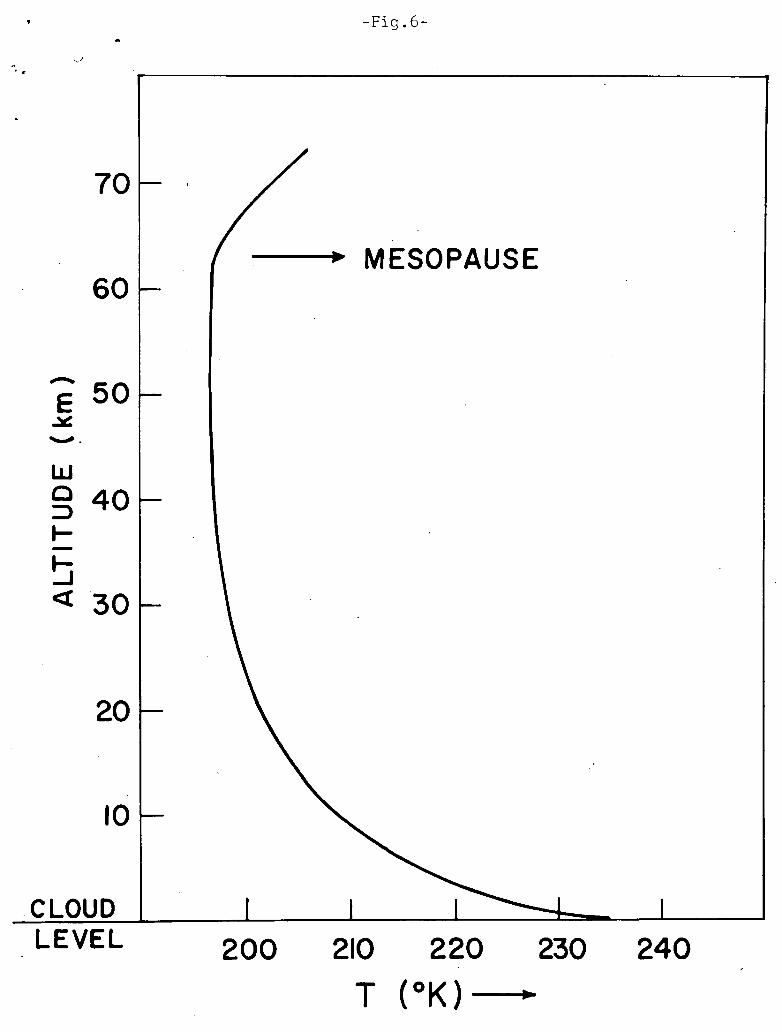
From this value of temperature it is possible to construct
a model for the atmosphere of Venus above the clouds. Fig. 5
shows a temperature profile computed by Rasool (1963) on the as-
sumption that the atmosphere is in radiative equilibrium above the
clouds.
-33- J

oThe temperature should reach an asymptotic value of 197 K
above z ~ 20 km. The mesopause will probably occur above 60 km,
and then the temperature will rise in the thermosphere owing
to heating by photodissociation and photoionization reactions.
Our lack of knowledge of the composition prevents us from
predicting whether heating should occur below the mesopause by
such mechanisms as ultraviolet absorption by ozone.
Surface. Determinations of the surface temperature of Venus
by optical astronomy have been prevented by the cloud cover. How-
ever, the small amount of thermal radiation emitted by the planet
in the centimeter wavelength region would penetrate through thei
clouds without significant attenuation, and therefore can be used
to determine the temperature of the surface of the planet.
First attempts to measure radiation from Venus in the
microwave region were made in 1956 by the radiotelescope of the
Naval Research Laboratory. The temperature inferred from the
measured radiation intensity, was, however, unexpectedly high
— of the order of 600 °K, which is certainly too hot to support
any imaginable form of life. Repeated measurements in the
-34-

following years have confirmed this result. (Mayer, 1961)
The observed temperatures are plotted as a function of wave-
length in Fig. 7. At longer wavelengths the brightness tempera-
ture is observed to increase when the Venus-sun-earth angle
becomes appreciable, indicating that the illuminated hemisphere
is significantly hotter than the dark side (The 10 cm. brightness
temperature may exceed 700 K on the bright side.)
Three models of Venus have been considerably discussed in
connection with these measurements.
Greenhouse. First is the greenhouse model originally dis-
cussed by Sagan (1?60) in which it is assumed that the 600 K
radio-brightness temperature actually exists at the surface of
the planet and is maintained by a very effective "greenhouse
effect." The solar radiation in the visible penetrates up to
the surface; the planet, thereby being heated up to a tempera-
ture T , emits in the infrared; but due to the presence of
triatomic molecules like CO and H^O, which have strong absorption
bands in the infrared region, most of the radiation remains
-35-

trapped in the atmosphere and heats up the surface.
Jastrow and Rasool (1963) have recently pointed out that
in such a model an extremely high infrared opacity of the at-
mosphere (optical thickness of 42, meaning a transmission of
— 1 8only 10 ) will be required in order to obtain a Venus ground
temperature of 600 K.
It is very difficult to understand how the lower Venus
atmosphere can be so opaque in the infrared and still be trans-
parent in the visible. Tri-atomic molecules are good infrared
absorbers, but they have "windows" at certain wavelengths which
must be blocked by other molecules if the opacity is to be
significant. Jastrow and Rasool have also shown that the
combination of CO- and small amounts of HO at pressure of the
order of 3 atm. still contains significant windows.
However, the situation alters if the atmospheric pressure
at ground level is many tens or hundreds of atmospheres. Then
pressure broadening may close all the windows. Plass and Stull
( 1963) have shown that the optical thickness approaches 5 if the
-36-
ground pressure is about 30 atms. and the pressure broadening
of CO2 alone is considered. At the high temperatures on Venus
there may be many trace constituents in the atmosphere that
significantly increase the opacity.
Aeolosphere. The second model, called the aeolosphere
model, is due to Opik (1961) who suggests that the blanketing
must be due to dust, wind friction of the surface being the
main source of energy for the high temperature. The dust is
probably made of calcium and magnesium carbonates and the at-
mosphere is mainly composed of CO^ and N . No water vapor is
necessarily present in the atmosphere. Due to the blanket of
dust there is no sunlight penetrating to the surface. This model
predicts that the microwave brightness temperatures of Venus
should not change with the phase of Venus, which is apparently
contradicted by the observations.
Ionospheric Emission. A third model invokes a dense iono-
sphere of Venus which is assumed to emit the observed microwave
radiation. This model predicts that the radio observations should
show a "brightening" at the limb of Venus, whereas the observations
-37-

made by Mariner II have recently indicated "limb darkening."
(Barath et al, 1963).
JUPITER
Relatively little is known about the structure of the
atmosphere of Jupiter.
Being five times farther removed from the sun than the
earth, but having a comparable albedo of 0.47, the effective
temperature of the planet is only 105 °K. The high surface
gravity and low temperature together suggest that the gravita-
tional escape of gases from the planet should be extremely
inefficient and the chemical composition of the atmosphere should
still be primitive, containing large quantities of hydrogen and
helium.
Composition
The only gases detected spectroscopically in the atmosphere
of Jupiter are. NH , CH and hydrogen. The abundances of these
-38-

gases have been estimated by various authors, and table VII
gives the approximate composition of the atmosphere of Jupiter
(Spinrad and Tr^fton, 1963).
Helium is spectroscopically not observable from the earth
and has been added due to its cosmic abundance and to account
for the estimates of the cloud top pressure of 3 atms.
TABLE VII.
Gas Percentage by Volume
H 602
He 36
Ne 3
CH and NEL < 14 3
This table indicates that the Jovian atmosphere may not
be as rich in hydrogen as expected from the discussion of
gravitational escape.
Measurements of the scale height of the atmosphere of
Jupiter have been made by observing the occultation of
-39-

o-Arietis by Jupiter. These observations yield a scale height
of ~ 8 km. For a mean atmospheric temperature of 120 °K, the
corresponding molecular weight would be ~ 4. This requires
more helium than Table VII indicates. However, according to
Gallet (1963) the relative abundance of H and He given in
Table VII could also account for a mean molecular weight of
4 if the Jovian atmosphere had a substantial amount of neon.
Temperature.
The calculated black body temperature of Jupiter for a
visual albedo of 0.47 is 105 °K. •Spectroscopic measurements
in the infrared indicate a temperature of 130 °K ( Murray and Wildy, 1963)
which probably refers to an intermediate level above the
clouds. The cloud top temperatures have been estimated at
~ 170 °K ( Zabriskie, 1962).
Gallet (1963) has made extensive theoretical analyses of the
atmospheric structure of Jupiter below the clouds. The visible
clouds have been assumed to be made of NH., crystals, which con-
dense at the temperature and density of the cloud top. With
-40-
allowance for the heat released in this condensation, Gallet
calculates a relatively slow increase of temperature going
down from the clouds to the surface and thus arrives at high
densities and pressures at low temperatures. Gallet has also
suggested that the observed cloud layer may be NH of thick-
ness 50 km, below which there is another deck of clouds com-
posed of HO. Between these two clouds is a region where NH
rain storms can occur. In such a model the surface of Jupiter
would be a few hundred km below the clouds, at a temperature of
~ 1000 °K and a pressure of several thousand atmospheres.
-41-

REFERENCES
Adams, W.S. andT. Dunham, Jr.
Aller, L. H.
Arking, A.
Barath, F.T.,A.H. Barrett,J. Copeland,D.E. Jones, andA.E. Lilley
Chamberlain, J..W.
Chase, S.C.,Kaplan, L.D. andNeugebauer, G.
Dollfus, A.
Dollfus, A.
1932
1961
1962
1963
1962
1963
1957
1961
Dollfus, A. 1963
Absorption bands in the infraredspectrum of Venus. Publ. Astron.Soc. Pacific 44, 243.
The Abundance of the Elements.Interscience Publishers, NewYork.
Non-grey Convective PlanetaryAtmospheres, Mem. Soc. Roy. Sci.de Liege, V, Ser., VII, 180.
Mariner II: Preliminary ReportsMeasurements of Venus. Micro-wave Radiometers, Science, 139,908.
"Upper Atmosphere of the planets",Ap. J., 136. 582.
Science 139, p. 909.
Etudes des planetes par la polari-sation de leur lumiere. Ann.d'Astrophisique, Supp. No. 4
Polarization Studies of planets.Solar System III, (Planets andSatellites), edited by G.P. Kuiperand B.N. Middlehurst (University ofChicago Press, 1961), Chap. 9, p. 343
"Mesure de la quantite de vapeurd'eau contenue dans I1atmospherede la planete Mars", C. R., 256,p. 3009.
-42-

Dollfus, A.
Gallet, R.
Goody, R. M.
Hess, S. L.
Jastrow, R., andS. I. Rasool
Kaplan, L. D.
Kaplan, L. D.
Kuiper, G. P.
Kuiper, G. P.
MacDonald, G.J.F.
1963a
inprepara-tion
1957
1958
1963
1961
1963
1952
1963
1963
"Observation de la vapeur d'eau surla planete Venus", C. R., 256, p. 3250,
The Structure of the Cloud Layers andthe Deep Atmosphere of Jupiter, inSmith, H.J. (ed.), Proceedings ofthe Conference on the Planet Jupiter.
The atmosphere of Mars, Weather 12,3.
Blue haze and vertical structureof Martian atmosphere, Ap. J. 127,743.
Radiative Transfer in the Atmospheresof Venus and Mars, in Space ResearchIII. Priester, W. (ed.), NorthHolland, Amsterdam.
A New Interpretation of the Structureand CO2 Content of the Venus At-
mosphere. Planetary Space Sci . , 8.,23.
Private communication.
"Planetary atmospheres and theirorigin," Atmospheres of the Earthand Planets, edited by G. P. Kuiper(University of Chicago Press, Chicago).
Infrared spectra of planets andcool stars. Onzieme Colloque Inter-national d'Astrophysique, LaPhysique des Planetes, Universite.de Liege.
The Escape of Helium from the Earth'sAtmosphere, Revs. Geophys., 1, inpress.
-43-
Mayer, C. H.
Muhleman, D. O.
Murray, B. C. , andWildey, R. L.
Ohring, G.
Opik, E. J.
Plass, G. N., andStull, V.- R.
Rasobl, S. I.
Sagan, C.
Sagan, C.
Sinton, W. M.
Sinton, W. M.
Sinton, W. M. andStrong, J.
Spinrad, H.
1961 Radio emission of the moon andplanets, Solar System III (Planetsand Satellites), edited by G. P.Kuiper and B. N. Middlehurst (Univer-sity of Chicago Press), chap. 12, p. 442
1963
1963
Icarus 1, 5, p. 401.
Observations of Jupiter and theGaliean satellite at 10 microns,Ap. J. (in press).
1963 Icarus 1, 328.
1961 The Aelosphere and Atmosphere ofVenus. J. Geophys. Res. 66. 9, 2807.
1963 Carbon Dioxide Absorption for PathLengths Applicable to the Atmosphereof Venus. J. Geophys. Res.. 68, 1355.
1963 Structure of Planetary Atmospheres,A.I.A.A. Journ. 1, p. 6.
1960 The radiation balance of Venus,JPL Tech. Report No. 32-34, NASAContr. No. NASw-6, Calif. Inst.of Tech., Pasadena, Calif.
1962 Structure of the Lower Atmosphereof Venu^, Icarus, JL, 151.
1959 Further evidence of vegetation onMars. Science 130, 1234.
1963 Infrared Observations of Venus,Mem. Soc. Roy. Sci. de Liege, V,Ser., VII, 300.
1960 Radiometric measurements of Venus,Ap. J. 131, 470.
1962 Spectroscopic temperature andpressure measurements in the Venusatmosphere. Publ. Jvstron. Soc.Pacific 74. 187.
-44-

Spinrad, H.,Munch, G. andKaplan, L.D.
Spinrad, H., andL. M. Trafton
Spitzer, L. Jr.
1963 "The detection of water vapor on
Mars," Ap. J. 137, 4, p. 1319.
Thadcleuu, P.
Urey, H. C.
Vaucouleurs, G. de
Walker, J.C.G., andR. Jastrow
Zabriskie, F.R.
1963
1952
1963
1959
1954
1963
1962
High Dispersion Spectra of theOuter Planets: I. Jupiter in theVisual and Red. Icarus 2, 1, p. 19.
The Terrestrial atmosphere above300 km, in "Atmospheres of theEarth and Planets," edited byG. P. Kuiper (University ofChicago Press), chap. 7, p. 211.
Private communication.
The Atmospheres of the Planets,Handbuch der Physik, Vol. 52(Springer Verlag, Berlin), p. 363.
Physics of the Planet Mars (Faber &Faber, London).
"The Thermospheres of the Planets,"paper presented at the 44th AnnualMeeting of A.G.U., Washington, B.C.
The hydrogen content of Jupiter'satmosphere, Astron. J. 67, 169.
-45-

GENERAL BIBLIOGRAPHY
Cameron, A. G. W., "Physics of the Planets" in Space Physics(in press).
Hess, S. L., "Mars as an astronautical objective," Advances inSpace Science and Technology, edited by F. I. Ordway(Academic Press, New York, 1961), Vol. 3, p. 151.
Jastrow, R., "Results of experiments in space," J. AerospaceSci. 29, 377 (1962).
Kellogg, W. W. and Sagan, C., "The Atmospheres of Mars and Venus,"Panel on Planetary Atmospheres of Space Science Board, Natl.Academy Sci.-Natl. Research Council, Washington, D. C.,Publ. 944 (1961).
Kuiper, G. P., "Planetary atmospheres and their origin," Atmos-pheres of the Earth and Planets, edited by G. P. Kuiper(University of Chicago Press, Chicago, 1952), Chap. 12.
Newburn, R. L., "The exploration of Mercury, the asteroids,the major planets and their satellite systems and Pluto,"Advances in Space Science and Technology, edited by F. I..Ordway (Academic Press, New York, 1961).
Rasool, S. I., "Structure of Planetary Atmospheres," A.I.A.A.Journ. 1, 6 (1963) .
Sagan, C., and Kellogg, W. W., "The Terrestrial Planets," AnnualRev. Astron. Astrophy. JL, 235 (1963).
Urey, H. C., "The atmospheres of the planets," Handbuch derPhysik (Springer Verlag, Berlin, 1959), Vol. 52, p. 363.
Vaucouleurs, G. de, Physics of the Planet Mars (Faber andFaber, London, 1954).
Wildt, R., Smith, H. J. , Salpeter, E. E., and Cameron, A. G. W.,"The Planet Jupiter," Phys. Today 16, 5, p. 19, 1963.
- 46 -
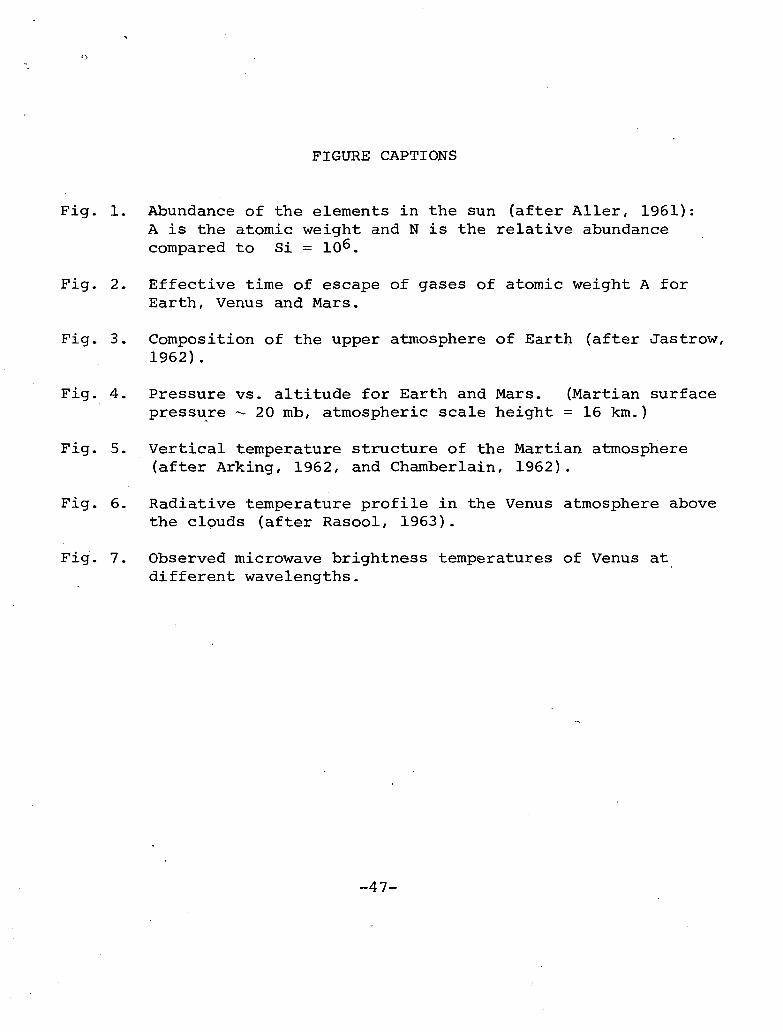
FIGURE CAPTIONS
Fig. 1. Abundance of the elements in the sun (after Aller, 1961):A is the atomic weight and N is the relative abundancecompared to Si = 10̂ .
Fig. 2. Effective time of escape of gases of atomic weight A forEarth, Venus and Mars.
Fig. 3. Composition of the upper atmosphere of Earth (after Jastrow,1962).
Fig. 4. Pressure vs. altitude for Earth and Mars. (Martian surfacepressure ~ 20 mb, atmospheric scale height = 16 km.)
Fig. 5. Vertical temperature structure of the Martian atmosphere(after Arking, 1962, and Chamberlain, 1962).
Fig. 6. Radiative temperature profile in the Venus atmosphere abovethe clouds (after Rasool, 1963).
Fig. 7. Observed microwave brightness temperatures of Venus atdifferent wavelengths.
-47-

-Fig. 1-
OCD
O10
Oro
OCM
co CD 10N
ro CM -

roa>GJo
-Fiq.2-
te( Years)0_
oO_
IN)O_
O)
ro
a>
oo
o
c\5
I-T 00
roOrororo
-o
<DO
-Fig.3-
COaCL
oooa:Ld
a.COo
UJoocro
UJ
X
UJo
LU
UJo>X
-Fiq .4-
220
200
180
160
140
LUQ
120
100
80
60
40
20
010'° IO"4 10"* IO"2 10"' I 10 10'
PRESSURE mb
-Fiq.rj-
-Fig.6-
70
60
50
UJ
40
b< 30
20
10
CLOUDLEVEL 200
•*• MESOPAUSE
1
210
T
220 230 240

-Fig.7-
1 I 1 1 1 I I
•oh. —o>u.O
_lCL~3
H ° _| H
t n 'i — <Zr- . --». ' te-i ' ^. . ,o ' ^ ' o:< z —(T2
O ~"
< —o:2 \_o__, -i ^ -
1 o i Z
i !2 _
-1 i o io: t— o— ^z
^V^ ~1 — *~- - x : « :•° w
. « w —-J -03o: « 3
ZX^-, ^ ~
1 1 1 1 1 1 1o o o oo o o oO O ° O00 (0 ^ CO
0•*
o fn— CO
4 CE
NT
IME
TE
R
v^
X1—e>z
• 1
WA
VE
LEr̂
O
(NIA13>n SS3NlH9ld8