institute of management studies dehradun · institute of management studies dehradun i ms journal...
TRANSCRIPT

Volume 8 : Issue 2. Dec. 2009 Listed in Ulrich's International Periodicals Directory, USA
Institute of Management Studies
Dehradun
ims
Journal of Management
ISSN No. : 0974-5505
Research Papers
A Comparative Study of VAIC, EVA and MVA of Indian Banking Industry Dr. Karam Pal, Ms. Sushila Soriya & Mr. Jasvir S. Sura
The Impact of Political Advertisements Through Print Media- A Case Study Conducted During The Haryana Legislative Assembly Elections'09Dr. Sushil Sharma, Prof. (Dr.) Puja Walia Mann & Ms. Parul Gupta
Consumers Preference of Retail Store Attributes:A Case Study of PunjabDr K C Mittal , Dr Mahesh Arora & Ms. Anupama Prashar
An Analytical Study on Indian Accounting Standard -14Dr. Mohender Kumar Gupta & Ms. Mehak
Application of Earnings Quality Assessment Model on Infosys And TCSDr Ashish Varma & Ms Ishika Varma
Evaluating the Influence of Media on Consumer Purchase Decision-An Exploratory StudyDr. Rajeshwari Panigrahi
Listening to the Listeners' Perception of News Program on a Foreign FM radio channelDr.Lakshmi Jagannathan & Mr. Sai Gunaranjan
Service Quality through mCRM Applications in Indian Courier IndustryDr. Arpita Khare & Dr. Vrijendra Singh
Rise and fall of Dollar and Euro as an alternative Currency in International Financial Market: A DiscussionProf Som Deo & Mr. Navneet Gera
Organisational Culture in Relation to Managerial Effectiveness:A Study of BHEL, Haridwar (UK)Dr. Kamal Pant
Impact of Entrepreneurial Characteristics on Organizational Performance: A Literature ReviewDr. S. P. Singh , Mr. Gaurav Agrawal & Mr. Jitendra Kr. Singh
A Study of India Nepal Trade Relations in the light of WTO RegimeMr. Surendar Singh
Competency Mapping As An Aid To Sustainable Human Resource Management Prof. Kalpana Sahoo , Mr. Debesh Kumar Dutta & Dr. Sasmita Mishra
Forced Entrepreneurship A Recessionary Career CallMs. Madhuri Mahato & Dr. Pranab Kumar

MEMBERS OF EDITORIAL ADVISORY BOARD
Professor Pulin B NayakDelhi School of Economics Delhi
Professor T J KamlanabhanDMS, IIT Madras
Professor P K ChaubeyIndian Institute of Public Administration,New Delhi
Professor M AkbarIndian Institute of ManagementLucknow
Professor D L SunderIndian Institute of ManagementIndore
Copyright @ 2009 Institute of Management Studies, Dehradun.
All rights reserved.
No part of this publication may be reproduced or transmitted in any form or by any means, or stored in any retrieval system of any nature without prior written permission. Application for permission for other use of copyright material including permission to reproduce extracts in other published works shall be made to the publishers. Full acknowledgment of author, publishers and source must be given.
The Editorial Board invites original, unpublished contributions in the form of articles, case studies, research papers, and book reviews.
The views expressed in the articles are those of the contributors and not necessarily of the Editorial Board or the Institute.
Although every care has been taken to avoid errors or omissions, this publication is being sold on the condition and understanding that information given in this journal is merely for reference and must not be taken as having authority of or binding in any way on the authors, editors, publishers and sellers who do not owe any responsibility for any damage or loss to any person, a purchaser of this publication or not, for the result of any action taken on the basis of this work. All disputes are subject to Dehradun jurisdiction only.
Pragyaan : Journal of Management
Volume 7 : Issue 2. Dec 2009
Patron Shri Amit AgarwalSecretaryIMS Society, Dehradun
Chief Editor Dr Pawan K AggarwalDirectorIMS, Dehradun
Editor Dr. Shruti Nagar Senior LecturerIMS, Dehradun
Professor Arun P SinhaDepartment of Industrial & Management Engineering IIT, Kanpur
Professor Narendra K SharmaHead, Department of Industrial & Management Engineering IIT, Kanpur
Professor S P KalaH.N.B. Garhwal University, Srinagar
Professor V. NangiaIndian Institute of Technology, Roorkee
Professor D P GoyalDirector, IMESahibababd
Professor Bhagwati PrasadFormer Director, KIMS, Dharwad
Professor Rudra Prakash PradhanVinod Gupta School of ManagementIndian Institute of Technology, Kharagpur
Professor Himanshu RaiIndian Institute of Management, Lucknow
Professor GeetikaSchool of Management StudiesMotilal Nehru National Institute of Technology,Allahabad
Professor Susmita MukhopadhyayVinod Gupta School of ManagementIndian Institute of Technology, Kharagpur
Professor R K PandeyFMS, Banaras Hindu University,Varanasi
Professor Sita MishraInstitute of Management Technology, GZB.
Professor V NangiaHead, Department of Management StudiesIndian Institute of Technology Roorkee
Professor R C MishraDirector, IPSDRKumaun University, Nainital
Professor Zillur RahmanDepartment of Management StudiesIndian Institute of Technology, Roorkee
Professor Sheeba KapilIndian Institute of Foreign Trade, New Delhi
Professor Ram SinghIndian Institute of Foreign Trade, Kolkata
Professor V P S AroraCollege of Agribusiness Management G B Pant University of Agriculture &Technology, Pantnagar
Panel of Referees

From the Chief EditorWe draw immense pleasure in presenting the Dec 2009 issue of Pragyaan: Journal of Management. Pragyaan : JOM continues to gain appreciation and accolades as it provides a platform that stimulates and guides the intellectual quest of management scholars. Under invulnerable patronage, with invaluable support of panel of referees and propitious contribution by authors , our Journal has attained three major land marks, viz.,
? Award of ISSN No. 0974- 5505 from NISCAIR, New Delhi.? Listing with prestigious Ulrich's International Periodicals Directory, USA.? Review by external referees comprising eminent scholars.
The articles presented in this issue address a variety of contemporary national and international issues. The focus areas include: Divided practices, Knowledge management, Brand building, Selection of bank, Operations of Self Help Groups, Employees perception towards service climate, Welfare and municipality, Insurance products and capital structure.
We would like to express gratitude to esteemed contributors for their scholarly contributions to the Journal. Appreciation is due to the Editorial Advisory Board, the panel of Referees and the Management of the Institute for their constant guidance and support. Many faculty members from the Management Department of the Institute provided the necessary editorial support that resulted in enhanced reader friendliness of various articles. Specifically we would like to acknowledge the contribution by Dr. G.D. Mishra and Prof. Swati Bisht. Dr. Shruti Nagar diligently prepared the manuscript for the press. We are extremely thankful to all of them. We are also thankful to those who facilitated quality printing of this Journal.
We shall continue our endeavour to harness intellectual capital of scholars and practitioners of Management and present the same to our valuable readers.
We have tried our best to put together all the articles, coherently. Suggestions from our readers for adding further value to our Journal are however, solicited.
Dr. Pawan K AggarwalDirector IMS Dehradun
Pragyaan: Journal of Management
Volume 7: Issue 2. Dec 2009
CONTENTS
Research Papers
An Approach towards Building Services' Brands: The Indian Banking Story 1Dr. Arpita Khare & Ms. Roli Agarwal
An Affordable Approach to Knowledge Management (KM) 8Mr. K. Kalaiselvan
Determinants of Capital Structure: A study of Indian Cement Industry 19Dr. Sunil Gupta, Prof. R.K Sharma & Prof. P.K. Aggarwal
Self Help Groups and their Marketing Practices of Livestock Products: 24A Study conducted in West BengalDr. Yashwant Gupta, Mr. Saurabh Singh, & Dr. Poonam Singh
Core Concepts of Knowledge Management for New Generation 32Digital Libraries: An AnalysisMr. Ajay Kumar Sharma & Mr. Omdeep Gupta
Employee's Perception towards Service Climate - Hotel Industry in India: 39An Empirical StudyDr. B.Tamil Mani, Dr. K. Ravichandran & Mr. Arun Kumar
Criteria of Selecting Banks by Teachers: A Factor Analytic Approach 45Dr. Pradeep Mamgain
People, Welfare and Municipality: A case of Mumbai Floods 53Dr. Beena Narayan
Is it Really a Viable Option to Invest in Insurance Products? A study of ICICI 64Prudential Life Insurance in DehradunMr. Amit Adlakha

1
Introduction:
The banking service sector in India has witnessed a drastic transformation in the past decade. The variety of services offered by banks has undergone a change fostered by the use of technology in the daily transactions. Liberalization of the economy has been instrumental in drawing large number of multinational banks to set their branches in India. The Indian customer had been accustomed to traditional banking servicescape, and did not expect much innovation in the banking sector. However, entry of multinational banks has drastically modernized the banking industry and it has led to increased availability of online service models coupled with the traditional banking services. If convenience and customization of services has been the service model of multinational banks, it was but inevitable that Indian banks would have to copy their service delivery model. Competition changed the banking landscape and in order to retain customers, it was imperative to modernize the service settings and improve service transactions. In this purview, the paper examines the factors that determine 'quality service in banks' for the customers. The perception of customers regarding multinational banks and Indian banks was compared to comprehend the gaps perceived between the expectation of the customer and the desired service levels. This comparison was done as it was assumed that multinational or foreign banks have a better perceived quality in the minds of the customers. So if the Indian banking sector wished to retain customers,
they would have to upgrade their service model according to the customers' expectation about quality and the gaps that currently exist in their services.
With multitude of banking companies offering an assortment of benefits and services to lure the customers, banking has become more of convenience and building long term relationships with the customers. Effective customer relationship strategy should address the issues regarding what the customer expects. It may be not only about ambience or infrastructure but also about facilitating smooth transactions without any technological glitches. The difficulty in branding services lies in intangibility. It is much dependent upon the culture of the service organization, the attitudes of the personnel (de Chernatony and Segal-Horn, 2003) and overall trust conveyed by the service model. Thus it is not only difficult to build service brands but also to copy (Albrecht and Zemke, 1985) .To build service brands, not only the delivery model is important but focus should be upon making the processes efficient. Only with improved service performance, the service organization would be able to retain customers. Heskett (1994) posits that not only service operational efficiency is important but also building systems which enhance service personnel's performance.
This paper deals with importance of service delivery in Indian banking sector for long-term trust and loyalty with the customers. Further, it explores the difference in perception of customers regarding the
"Pragyaan : JOM" Volume 7 : Issue 1, June 2009
An Approach towards Building Services' Brands: The Indian Banking Story
Dr. Arpita Khare *Ms. Roli Agarwal**
* Associate Professor, LDCITS, J.L Nehru Road. Allahabad**Research Scholar. LDCITS, J.L Nehru Road. Allahabad
ABSTRACT
This paper is designed with a view to have a second look upon the Indian Banking Industry from service quality perspective and its comparison with foreign banks to assess where the Indian banks fall short of their service expectations. The paper examines the factors that determine 'quality service in banks' for the customers. The SERVQUAL model developed by Parasuraman has been used as the foundation for explaining the service gaps found between the two. Consequently, suggestions and probable measures to enhance upon the service delivery and customer satisfaction have also been provided.
Keywords: Branding , Quality Services, Tangibility, Competency, Convenience, Reliability, Special Attention.
"Pragyaan : JOM" Volume 7 : Issue 2, Dec 2009 2
Indian and multinational banks. We have used the SERVQUAL model for assessing the brand perceptions of the customers related to Indian and multinational banks. The SERVQUAL scale was modified for assessing banking service quality and a questionnaire developed by Kumar et al, (2009) was used for data collection. Kumar et al. (2009) had conducted a research to comprehend the service quality dimensions in Malaysian banks. We used the same instrument for administering it on customers to understand their perception regarding quality of services offered by Indian and foreign banking brands. From the analysis, we have recommended the steps that may be taken up by Indian banks to improve their customer perceptions and brand image. Since the service sector is primarily driven by relationships, we feel that building service brands would entail fostering an environment of trust and congruence with the customers' personality. The more the customers feel comfortable with the bank's environment and employees' behavior, the better would be their assessment about the banking brand.
Literature Review:
Intangibility is the key factor in services (Cowell, 1984; Wolak, et al, 1998), thus the customer perceptions regarding its quality are bound to be dependent more on the interactions rather than only on the physical evidence. A customer oriented strategy in services would have to be chalked out according to customers' needs and purchase intentions (Gilmore, 1997). Services by nature are intangibles, thus personal contact (Kandampully, 1997) with the customer becomes vital in differentiating the service. Most service companies want to provide good quality service, but do not understand the customers' expectations, because of the intangible element in the services (Kandampully, 1997). Thus service quality may be perceived as the judgment customer does about service attributes and how it relates to the needs. It implies that quality is a cognitive evaluation of the service (Cronin and Taylor, 1994) and thus service quality is an organizational asset helping service firms earn profits (Yasin et al., 2004).
In the last few years services offered by banks have undergone a sea change. The provision of online services along with the traditional banking facilities has gained wide acceptance amongst both the service provider as well as the customers (Herington and Weaven, 2007). Multinational banks with better facilities and infrastructure have entered the Indian
market, thus increasing the competition on quality and service delivery options. Parasuraman et al. (1985) posit that customer's perception regarding service quality depends upon the gap that exists between what the customer expects and what he receives in the service. Thus, for most companies it is of foremost importance to understand the expectation levels of the customers, and design service delivery according to his needs. Banks that provide good quality service to their customers definitely would be able to increase their profits and revenues by being paid in terms of customer retention (Bennett and Higgins, 1988) and loyalty. Oliva et al. (1992) suggest when service satisfaction increases above a certain level, customer loyalty will increase rapidly. Thus for banks to retain customers and to develop loyalty it would be imperative to enhance the service encounter. The difference in the perception of the customer related to the quality of the services provided by different banks is dependent upon customers' perceptual construct and their earlier experiences with the banks.
The introduction of Internet models in banking have drastically changed the way business is being conducted by banks (Yang, et al. 2001) and have provided an interactive medium for the customers to access information (Rowley, 2006). The technology's role in improving the quality of banking services is being recognized and is being adopted by banks in improving the company-customer interface. The role of e-service is supposed to improve the customer-firm communications (Roland and Lemon, 2001). “Banking organizations have progressed a long way in the use of the internet, with most banks offering transaction” (Sohail and Shaikh, 2008). Use of internet banking, ATM, online transactions, current account accessibility, and credit cards all add to the plethora of services offered by banks for improved customer interactions. This not only increases the convenience and accessibility for the customers but also assists him/her in using any transaction channel he/she is comfortable with. Some researchers are of the opinion that reducing the human element in the banking transactions would have an impact on the customer satisfaction level (Cox and Dale, 2001; Jabnoun and Al-Tamimi, 2003). To be able to serve customers need better, it becomes imperative for banks to combine promptness with convenience, and mixing technology with human element. The technology based models may be used to address the growing competition and increasing demands of the customers, but it has to be coupled with appropriate
An Approach towards Building Services' Brands: The Indian Banking Story

"Pragyaan : JOM" Volume 7 : Issue 2, Dec 2009 3
Institute of Management Studies, Dehradun
marketing strategy which builds the credibility of the bank in the eyes of the customers. In services, the very nature of tangibility requires instilling confidence and trust through the service encounter and servicescape. The multinational banks with their superior image and quality servicescape have put a pressure on Indian banking sector to renovate their product and service levels. It is not about mixing technology in the service delivery processes, it is about building an image or brand in the market. The general perception of customers' regarding Indian banks is that they have inadequate service and are not efficient.
Manufacturers and service firms try to instill confidence amongst customers towards their products/ services by giving them an identity and image. Giving an identity to the product/service makes it more relevant to the consumer, wherein the consumer searches for brands which match his self image (Sirgy, 1982). According to the self-congruency theory, Sirgy (1982) has emphasized that consumers prefer brands which match their self-concept. If the brand's personality is in tandem with the self-concept of the consumer, the brand will be preferred for purchase and consumption. Research has supported this self-congruency and brand congruency theory (Dolich, 1969; Grubb and Hupp, 1968; Malhotra, 1988; Ericksen and Sirgy, 1989; Hong and Zinkhan, 1995) and it was asserted that brands were used by consumers to enhance their self-image.
In this purview, our paper focuses on understanding the expectation of the consumers' perception regarding service quality dimensions in both Indian and foreign banks, and recommending Indian banks to upgrade their service quality model, so as to build a powerful brand equity in the minds of the Indian customers. Competition has made it imperative for the banks to not only redefine their value delivery process vis-à-vis the foreign banks, but also to build brand credibility in the customers' perception. The diffusion of new technologies with user friendly service models are supposed to improve the banking services (Akinci et al. 2004). The general tendency towards adoption of Internet based models for transactions is leading to “virtualization” leading to transforming the bank and customer relationships (Harden, 2002). Loveman (1998) suggests that implementing technology is not the end goal, but to identify the information which is really relevant for the service firm so that it may be strategically used for creating value for customers. In India, the past decade
has witnessed incremental growth of financial services and banking sector. Liberalization has not only made it easy for multinational banks to make a foray into Indian banking industry, but has increased the competition in the stagnant Indian banking industry.
Research Methodology:
The research design was descriptive in nature wherein we have explored the service quality dimensions in Indian banks and in foreign banks. The questionnaire developed and used by Kumar et al. (2009) for their study on Malaysian banks was used for our study. The items used were adapted from the SERVQUAL model. The objective of the research was to assess the service quality perception of customers' related to Indian banks and foreign banks. Based upon the customer perceptions, we hoped to understand the quality gaps which existed and how they may be removed for building a strong brand image for the Indian banks.
The sample size was 75 for each category of banks, Indian and foreign. Out of 75 questionnaires filled by the respondents, we were able to use only 60 in each category. The rest of the questionnaires were incomplete, illegible, or not returned. Thus, we had only 120 complete questionnaires; 60 for foreign banks and 60 for Indian banks.
Findings and Discussion:
Method of Analysis
The methods of analysis include mean and standard deviation calculation for each attribute of the four dimensions. On the basis of these values, standard error of mean difference is calculated and finally, t-test scores are evaluated. In the light of Gap score, we are able to analyze the drawbacks and advantageous position of every dimension along each and every attribute. Hence, we are able to judge which attributes are working for the Indian banks and which of them need revamping.
Empirical findings
The sample comprises 40 % males and 60 % females.
The majority of the respondents belong to the age group 21-30.
Most of the respondents are post graduates with graduates accounting for only 37% of the sample.
Dimension Q Attribute Mean Standard deviation Gap t-Value Standard Indian Foreign Indian Foreign Score error ofBank Bank Bank Bank (Foreign - difference
Indian)
Tangibility 1 Modern looking equipment 2.933 4.233 1.257 1.400 1.300 3.784 0.344
2 Appealing physical facilities 2.967 3.833 0.964 1.367 0.866 2.836 0.305
3 Neat appearance of bank staff 2.933 4.033 1.257 1.377 1.100 3.231 0.340
4 Materials associated with service 2.700 3.833 1.263 1.315 1.133 3.404 0.333are visually appealing
Reliability 5 Bank staff keeps promises 2.633 3.533 1.273 1.137 0.900 2.888 0.312
6 Bank shows sincere interest in 2.667 3.467 1.241 1.106 0.800 2.636 0.303 solving customers' problems
7 Staff performs service right the 2.633 3.467 1.273 1.224 0.834 2.587 0.322first time
8 Provide services at the time they 2.367 3.667 1.067 1.213 1.300 4.407 0.295promise to do so
9 Insists on error free records 3.267 3.533 1.285 1.074 0.266 0.87 0.306
Competence 10 Staff telling customers exactly when 2.767 3.633 1.165 1.067 0.866 3.002 0.288services will be performed
11 Service is on time and prompt 2.700 3.667 1.343 1.295 0.967 2.839 0.341
12 Staff shows willingness to help 2.800 3.533 1.157 1.479 0.733 2.138 0.343
13 Prompt response from staff 2.567 3.467 1.104 1.383 0.900 2.786 0.323
14 Behaviour of staff instills 2.667 3.700 1.213 1.236 1.033 3.267 0.316confidence
15 Customers feel safe in their 3.233 3.800 1.406 1.323 0.567 1.609 0.352 transactions
16 Friendliness and courtesy of staff 2.500 3.733 1.137 1.337 1.233 3.848 0.320
17 Staff having knowledge to 3.133 3.433 1.166 1.356 0.300 0.919 0.327answer questions
18 Individual attention given 2.400 3.600 1.220 1.302 1.200 3.683 0.326
19 Convenient operating hours 3.000 3.833 1.414 1.416 0.833 2.280 0.365
20 Staff places customers' interest first 2.433 3.667 1.305 1.184 1.234 3.836 0.322
21 Personal attention given 2.367 3.467 1.159 1.358 1.100 3.375 0.326
22 Understands the specific needs 2.800 3.600 1.031 1.354 0.800 2.575 0.311 of customers
23 Able to conduct transaction 2.600 3.800 1.276 1.270 1.200 3.651 0.329immediately or in a short waiting period
Convenience 24 ATM conveniently located 3.300 3.500 1.535 1.432 0.200 0.522 0.383
25 Special services/counters for 2.467 3.067 1.306 1.201 0.600 1.852 0.324elderly/disabled
26 Clear guidance and information 3.100 3.600 1.348 1.276 0.500 1.475 0.339 sign on how to use the banks' services and facilities
Overall 2.767 3.642 - - 0.875 - - Service Quality
Table1. A comparison of Characteristic of Indian and Foreign Banks
"Pragyaan : JOM" Volume 7 : Issue 2, Dec 2009 4
An Approach towards Building Services' Brands: The Indian Banking Story

Discussion
Service Quality Gap
The overall perception for Indian banks is 2.767, whereas that for foreign banks is 3.642. Thus, there is an overall service quality gap of 0.875 which shows that Indian banks fall short of expectations against foreign banks. The brand image of foreign banks is more prominent as compared to Indian banks.
Though, Indian banks have fared low in all the four dimensions against foreign banks, yet there are instances where these are not significantly different.
Tangibility
Tangibility refers to the visually appealing facilities of the bank. The t-test scores suggest that all the attributes related to tangibility dimension in service are lagging behind in case of Indian banks. Equipments, appearance of bank staff, physical facilities and associated materials, all of which grab the first attention of the customer, are not up to the mark in comparison to the foreign banks.
Reliability
It is a measure of the responsiveness and the service delivery of the bank. Here also, the Indian banks have failed to create a brand value when compared to foreign banks. Only in maintaining the error free records, they are at par with Foreign Banks, and in terms of keeping promises and problem solving, they lag behind.
Competence
Competence provides an edge over the competitors in terms of different attributes. Service providers failing in this aspect normally would not be able to carve a niche for them. In case of Indian banks, the only competence with it is the staff has the required knowledge to answer customers' queries. Otherwise, rest all attributes are being taken over by foreign banks.
Convenience
It is the measure of being able to easily locate or find the service. ATMs are supposed to be the exceptional attribute here. However, this is the sole dimension which fares well in t-test score gaps when
compared to the other three dimensions.
If we were to rank the four dimensions in increasing order of attention that would be:
[Convenience < reliability < competence < tangibility]
Special attention
There are certain aspects or functions of Indian banks which require immediate attention from service improvement and brand formation point of view. They are:
1. Equipments.
2. Friendliness and courtesy of the staff.
3. Individual attention paid to customers.
4. Placing customer's interest first.
5. Conducting transactions immediately.
Conclusion
The disparity in Indian and foreign banks' quality perceptions clearly indicate that Indian banks do not have a good brand image amongst Indian customers. Increased use of technology to facilitate efficient transactions does not appear to be enough. Customers expect efficient service and good infrastructural support for service delivery. The general perception regarding service levels is that it is not fast or does not take into consideration customer needs. The delay on part of the Indian banks in attending to the clients poses a serious challenge in service quality. The Indian banks need to improve their services by improving the systems and transaction processes. Improving the quality levels would improve the credibility of the banks and help in improving customer relationship. This would improve the banks' image and consequently its brand. We feel that as brand name is an intangible asset for the banks, if appropriate standards of services were understood and followed, the banks could build a brand for themselves. The stigma of poor quality services, inappropriate ambience, and poor quality staff can be removed by addressing these service gaps and realizing the effective brand building that requires building trust amongst clients.
"Pragyaan : JOM" Volume 7 : Issue 2, Dec 2009 5
Institute of Management Studies, Dehradun
References:
Albrecht, K. and Zemke, R. (1985), Service America, Dow Jones, Irwin, Homewood, IL.
Akinci, S., Aksoy, S., Atilgan, E. (2004). “Adoption of Internet banking among sophisticated consumer segments in an advanced developing country”. The International Journal of Bank Marketing, Vol. 22 No. 3, pp. 212-232.
Belk, R.W. (1988), “Possessions and the extended self ”, Journal of Consumer Research, Vol. 15 No. 2, pp. 139-68.
Bennett, D. and Higgins, M. (1988), “Quality means more than smiles”, ABA Banking Journal, June, p. 46.
Cowell, D. (1984). “Marketing of Services”, Macmillan Heinemann, London.
Cox, J. and Dale, B. (2001), “Service quality and e-commerce: an exploratory analysis”, Managing Service Quality, Vol. 11 No. 2, pp. 121-31.
Cronin, J.J. and Taylor, S.A. (1994), “SERVPERF versus SERVQUAL: reconciling performance-based and perceptions-minus-expectations measurement of service quality”, Journal of Marketing, Vol. 58, January, pp. 125-31.
de Chernatony, L. and Segal-Horn, S. (2003), “The criteria for successful service brands”. European Journal of Marketing, Vol. 37 No. 7/8, 2003, pp. 1095-1118
Dolich, I.J. (1969), “Congruence relationship between self image and product brands”, Journal of Marketing Research, Vol. 6 No. 1, pp. 80-4.
Ericksen, M.K. and Sirgy, M.J. (1989), “Achievement motivation and clothing behavior: a self-image congruence analysis”, Journal of Social Behavior and Personality, Vol. 4, No. 4, pp. 307-26.
Gilmore, A. (1997), “Implementing quality in a services marketing context”, Marketing Intelligence & Planning, Vol. 15 No. 4, pp. 185-9.
Gosling, S.D., Ko, S.J., Morris, M.E. and Mannarelli, T. (2002), “A room with a cue: personality judgements based on offices and bedrooms”,
Journal of Personality and Social Psychology, Vol. 82 No. 3, pp. 379-89.
Grubb, E.L. and Hupp, G. (1968), “Perception of self, generalized stereotypes and brand selection”, Journal of Marketing Research, Vol. 5 No. 1, pp. 58-63.
Harden, G. (2002), “E-banking comes to town: exploring how traditional UK banks are meeting the challenge of technology and virtual relationships”, Journal of Financial Services Marketing, Vol. 6 No. 4, pp. 323-32.
Herington, C. and Weaven, S. (2007). “Can banks improve customer relationship with high quality online services”? Managing Service Quality, Vol. 17 No. 4; pp. 404-427
Heskett, J.L. (1994), “Putting the service profit chain to work”, Harvard Business Review, March-April, pp. 164-74.
Hirschman, E.C. (1981), “Comprehending symbolic consumption: three theoretical issues”, in Hirschman, E.C. and Holbrook, M.B. (Eds), Symbolic Consumer Behaviour, Proceedings of the Conference on Consumer Esthetics and Symbolic Consumption, New York University, New York, NY, pp. 4-6.
Holman, R. (1981), “Product use as communication: a fresh appraisal of a venerable topic”, in Enis, B.M. and Roering, K.J. (Eds), Review of Marketing, American Marketing Association, Chicago, IL, pp. 106-19.
Hong, J.W. and Zinkhan, G.M. (1995), “Self-concept and advertising effectiveness: the influence of congruency, conspicuousness, and response mode”, Psychology and Marketing, Vol. 12 No. 1, pp. 53-77.
Jabnoun, N. and Al-Tamimi, H. (2003), “Measuring perceived service quality at UAE commercial banks”, International Journal of Commerce and Management, Vol. 13 No. 2, pp. 29-53.
Kandampully, J. (1997) “Firms should give loyalty before they expect it from customers”. Managing Service Quality, Vol. 7, No. 2 pp 92-94.
Keller, K.L. (2004), “Strategic Brand Management- building, measuring, and managing brand
"Pragyaan : JOM" Volume 7 : Issue 2, Dec 2009 6
An Approach towards Building Services' Brands: The Indian Banking Story

equity”. Pearson Education, New Delhi, India.
Kumar, M.; Kee, F.T., and Manshor, A.T (2009). “Determining the relative importance of critical factors in delivering service quality of banks- an application of dominance analysis in SERVQUAL model”. Managing Service Quality, Vol. 19 No. 2, pp. 211-228
Loveman, G.W. (1998), “Employee satisfaction, customer loyalty and financial performance”, Journal of Service Research, Vol. 1 No. 1, pp. 18-31.
Malhotra, N.K. (1988), “Self-concept and product choice: an integrated perspective”, Journal of Economic Psychology, Vol. 9 No. 1, pp. 1-28.
McCracken, G. (1986), “Culture and consumption: a theoretical account of the structure and movement of cultural meaning of consumer goods”, Journal of Consumer Research, Vol. 13 No. 1, pp. 71-84.
Oliva, T.A., Oliver, R.L. and MacMillan, I.C. (1992), ``A catastrophe model for developing service satisfaction strategies'', Journal of Marketing, Vol. 56, pp. 83-95.
Parasuraman, A., Zeithaml, V.A. and Berry, L.L. (1985), “A conceptual model of service quality and its implications for future research”, Journal of Marketing, Vol. 49, pp. 41-50.
Prentice, D.A. (1987), “Psychological correspondence of possessions, attitudes and values”, Journal of Personality and Social Psychology, Vol. 53 No. 6, pp. 993-1003.
Roland, R.T. and Lemon, K.N. (2001), “E-Service and the Consumer”, International Journal of Electronic Commerce, Vol. 5 No. 3, pp. 85-101.
Rowley, J. (2006), “An analysis of the e-service literature: towards a research agenda”, Internet Research, Vol. 16 No. 3, pp. 339-59.
Sirgy, M.J. (1982), “Self-concept in consumer behavior: a critical review”, Journal of Consumer Research, Vol. 9 No. 3, pp. 287-300.
Sohail, M.S. and Shaikh, N.M (2008). “Internet banking and quality of service-Perspectives from a developing nation in the Middle East”, Online Information Review Vol. 32 No. 1, pp. 58-72
Solomon, M.R. (1983), “The role of products as social stimuli: a symbolic interactionism perspective”, Journal of Consumer Research, Vol. 10 No. 3, pp. 319-29.
Wolak, R.; Kalafatis, S. and Harris, P. (1998). “An investigation into four characteristics of services”. Journal of Empirical Generalization in Marketing Science, Vol. 3; pp 22-41.
Yang, Z., Peterson, R. and Huang, L. (2001), “Taking the pulse of internet pharmacies”, Marketing Health Services, Summer, pp. 5-10.
Yasin, M., Correia, E. and Lisboa, J. (2004), “The profitability of customer-targeted quality improvement e f fo r t s : an empi r i ca l examination”, The TQM Magazine, Vol. 16 No. 1, pp. 45-9.
"Pragyaan : JOM" Volume 7 : Issue 2, Dec 2009 7
Institute of Management Studies, Dehradun
An Affordable Approach to Knowledge Management (KM)
Introduction
In this age of information and competition, knowledge is the key asset for sustainable success of any individual and/or organization. According to Chalmers (1991) “the goal of science is to produce / provide knowledge about the world”. Therefore it's an activity that increases “the stock of useful knowledge”, which could be used to leverage the business needs.
Our senses are triggered by many stimuli and the perception of these stimuli involves cognitive process, which in turn become the inputs for our memories and these memories form the base for current and/or future perceptions and actions (physical and mental). The interactional effect of perception and action results in what can be called the individual knowledge.
Organizations need to connect the individual knowledge of their members and apply it in their business value chain to create a value proportion to their core business in terms of revenue, good will and what not. So the combining of individual knowledge leads to the collective and/or organizational knowledge. Creating such a knowledge hub or knowledge base in an organization is a challenging task. Research says that 'Learning Organizations' are effectively managing their knowledge base (individual and organizational) through a systematic process.
*HR Trainee, SABMiller India (Unit: SICA Breweries), Pondicherry
K. Kalaiselvan*
ABSTRACT
Knowledge plays a key role in competitive success in any business today. Creation and effective utilization of knowledge is the only differentiation strategy through which an organization can achieve cost based competitive advantage. Organizations have started viewing their existing knowledge, which can be used and reused (Green Knowledge) as their key asset /capital.This paper tries to identify some key factors using a scientific methodology and attempts to propose a cost effective Knowledge flow / model through which companies can capture and customize their intangible assets or green knowledge and leverage them in an efficient and strategic way.
Keywords : Individual Knowledge, Organizational Knowledge, Declarative knowledge, Procedural Knowledge, Working Knowledge, Knowledge Management Units, KML, KMC, ESQ, CIQ, KMU, KMP, KMW.
The Concept of KM
The term Knowledge Management (KM) was first coined by Karl Wiig and his fellow research group during the year 1986. There are many definitions for KM, some of them are
“…….the activities to create, capture, transform, and use ……” - Wiig. K.M (1997)
“…..documentation of best practices, success stories, failures, customer information, and like ….” - Greco. J (1999)
“…..human and technological networks capable of harnessing a company's collective expertise and audience …..” Greengard. S (1998)
“….strategies and processes of acquiring, c o n v e r t i n g , a p p l y i n g , a n d p r o t e c t i n g knowledge……” - Hsiu-Fen Lin (2007)
“…..process of creating, capturing, and using knowledge to improve organizational performance …” Bassi (1997)
“….process through which organizations generate value from their intellectual and knowledge-based assets …..” Gordon and Smith (1998)
“…the process by which an organization creates, captures, acquires, and uses knowledge …” Kinney (1998)
The above definitions are insufficient, because they restrict Knowledge Management (KM) only to a
"Pragyaan : JOM" Volume 7 : Issue 2, Dec 2009 8

set of process. The term knowledge can be split and deciphered as:
Putting all these components together, “... Knowledge Management can thus be defined as a business philosophy, principle and/or guidelines which help an organization to understand their business process (value chain) and ethically and legally leveraging on their existing knowledge (knowledge which can be used and reused) to meet their business goals.… ”
Knowledge is a Potential
Davenport.T.H and Prusak (2000) in their article “Working Knowledge” states that, knowledge has been described as information combined with experience, context, interpretation and reflection. The risky task before all business firms is to capture and manage the diverse set of knowledge (assets) in a productive way. Many organizations (including non profit organizations) had started to view Knowledge Management (KM) in a strategic way (Addicott, McGivern & Ferlie 2006).
A common issue faced by every organization is 'Resistance in sharing / disseminating / distribution of knowledge.' Knowledge sharing depends upon the interests / willingness of people. Wilson, T. D. (2002) in his book “The nonsense of knowledge management” asks: 'If getting promotion, or holding your job, or finding a new one is based on the knowledge you possesswhat incentive is there to reveal that knowledge and share it?'. Francis Bacon observed back in 1597 that 'knowledge is power' and Foucault (1980) argued that 'the production of knowledge and the exercise of administrative power interlink, need to be balanced ….' Since sharing of knowledge actually requires time, effort and cost, knowledge resistance has to be approached with that perspective.
A recent study from Sessi, CIS3 (December, 2002) identified that over the past years, companies had rolled out different aspects of knowledge management practices like Knowledge Sharing Culture, Incentives Policy to Keep Employees, Partnerships for
Knowledge Acquisition & Written KM Policy to sustain the knowledge and to improve the company's productivity in long run in terms of competitive advantage. Further the study reveals that, Knowledge sharing was in the lead (28%) for the manufacturing companies and it is stated that they had a culture to promote knowledge sharing. Many companies had implemented incentives policy to keep the executives and employees stay in the firm (27%), thereby avoiding knowledge loss. Likewise, it can be seen that 23% of the companies forged partnerships or alliances for knowledge acquisition. The details of the study are shown in Figure 1.
Figure 1 Sessi, CIS3 Survey
INFOSYS Approach to Cost Reduction:-
Faced with one of the economic downturns in recent times, organizations are focusing on cost reductions as never before in all areas. Infosys did a study to find a strategic way how to reduce the overall IT Budget cost. After analyzing different verticals on March 2009, Infosys identified a strategic model and proposed the possible outcome of the model along
Know What are the business goals, Strengths, Weaknesses, Opportunities and Threats
Ledge- What and how we need to shelf Ourselves / organization
Edge- what is the boundary within which we will be operating
Knowledge
"Pragyaan : JOM" Volume 7 : Issue 2, Dec 2009 9
Institute of Management Studies, Dehradun
Strategic Cost saving
Opportunities
Asset and People Reorganization
Optimizing through an efficient Operating Model
Reducee
Reorganize
Optimize
with the percentage wise cost savings. Infosys revealed that there has been a reduction of IT budgets by around 1520 percent significantly in some specific cases. Infosys also believe that companies can reduce their overall operating cost by reusing the existing information or Knowledge which they have already used in some of their RFI (Request For Information), RFP (Request For Proposal), RFQ (Request For Quotation), etc. The proposed three stage model across verticals is shown in Figure 2.
Figure 2 Infosys Cost Saving Model
The above model deals with the effective usage of existing information across the verticals and horizontals. This information can be retrieved only when the organizations implement a Centralized Knowledge Hub / Knowledge Management Portal. From this model it can be quite clear that 20-30 percent of cost can be saved by avoiding Redevelopment Operating Cost, 25-40 percent of cost can be saved in terms of New Infrastructure & Management Cost, 15-45 percent of cost can be saved in terms of the Quality Assurance and 10-30 percent of cost can be saved in terms Overall IT Cost.
Further from the above facts, it can be inferred that on an average 15-30 percent of the overall cost can be saved by just developing a Knowledge repository or Knowledge Hub. A.K Balyan, Director (HR), Oil and Natural Gas Corporation (ONGC) said to Business Standard on June 24, 2009 that they are planning to rope in Infosys, for setting up a Knowledge Management System (KMS). He also added that the initial investment will be around Rs. 50 Cr and the total project cost could be around Rs. 100 Cr.
Literature Review
According to Michael Polanyi's (1891-1976) the concept of knowledge is based on three main theses. Firstly, new knowledge cannot be accounted or discovered by a set of expressed rules or algorithms, secondly, knowledge is public and also to a very great extent personal, and thirdly, knowledge can be either Tacit or Explicit.
? Tacit knowledge is highly personal and hard to formalize and very difficult to share with others. Tacit Knowledge is deeply rooted in an individual's action and experience as well as in the ideals, values or emotions he or she embraces. Many Japanese view knowledge as being primarily tacit, something not easily visible and expressible (Ikujirio Nonaka & Noboru Konno, 1998).
? Explicit Knowledge or Codified Knowledge can be expressed in words, numbers and shared in the form of data, reports, books, scientific formulas, manuals, etc. This kind of knowledge can be readily transmitted between individuals either formally or systematically. Knowledge that can be expressed in words and numbers only represent the tip of the iceberg of the entire body of the possible knowledge (Ikujirio Nonaka, 1994)
Adaptive Control of Thoughts - Rational (ACT - R) is a general theory of cognition developed by John Anderson et.al and it is an elaboration of the original ACT theory (Anderson, 1976) and builds upon Human Associate Memory (HAM), a model of semantic memory proposed by Anderson & Bower (1973). ACT distinguishes among three types of Knowledge structures: Declarative Knowledge, Procedural Knowledge, and Working Knowledge.
? Declarative Knowledge corresponds to the things which we are aware, we know and usually describes to others (John R. Anderson, Michael Matessa and Christian Lebiere, 1997). Example: New Delhi is the capital of India; India got independence on August 15, 1947, “Three plus Four is Seven”, etc.
? Procedural Knowledge is the knowledge that is displayed in human behavior but of which we are not conscious. Procedural Knowledge basically specifies how to bring declarative
"Pragyaan : JOM" Volume 7 : Issue 2, Dec 2009 10
An Affordable Approach to Knowledge Management (KM)

knowledge to bear in solving the problems (John R. Anderson, Michael Matessa and Christian Lebiere, 1997). In simple terms, it is the knowledge about how we do things such as cycling, how to drive a car etc.
? Working Knowledge is a long term knowledge which helps us to interact with the outside world. Working knowledge can be obtained through a cognitive process of both declarative and procedural knowledge.
NONAKA SECI MODEL
Ikujiro Nonaka and Hirotaka Takeuchi (1994) proposed a model of the knowledge creation process to understand the dynamic nature of knowledge creation and to manage such process effectively.
Figure 3 SECI Model
Source: Ikujiro Nonaka, 1994
Nonaka had developed four modes of knowledge conversion model from Polanyi's theory of knowledge creation. The four modes are:
1. Tacit Vs Tacit Social ization (e .g . Apprenticeship)
2. Explicit Vs Explicit Combination (e.g. Telephonic Conversation)
3. Tacit Vs Explicit - Externalization (e.g. Developing Concepts)
4. Explicit Vs Tacit Internalization (e.g. Mental Models)
From the above models it can be understood
that the process of knowledge creation and different modes of knowledge and the ground at which the transition or process of knowledge take place. But in organizations Knowledge Creation or Knowledge Sharing depends on several internal and external factors.
Moreover, in an existing system, to retain the existing knowledge and/or to create a new knowledge, companies need to look into some critical factors which contribute to their KM success. This paper had put forth a dynamic model and identified some key factors which act as a place (Ba) for knowledge creation or knowledge sharing in a sequence and with a proven methodology.
Need for a New KM Theory
Theory provides a means for identifying the problem and approaching it in a strategic way. Theory provides a base line to align all factors or variables towards the business goals and objectives. According to Campbell (1990) there are three factors for knowledge management theory. They are:
? Defining Applied Problems
? Evaluating Solutions
? Responding to New Problems
Dubin's Methodology for Theory Building
Dubin's methodology has eight stages in which first four stages deals with the “Conceptual study” and the last four stages deals with the “Empirical or Research” of the theory. The stages are
1. Units
2. Laws of interaction
3. Boundaries
4. System States
5. Propositions
6. Empirical indicators of key terms
7. Hypotheses
8. Testing
The units of a theory are sometimes described as the concepts of the theory, or the basic ideas that make up the theory (Cohen, 1991; Dubin, 1978; Reynolds, 1971). The relationships among units of a theory are
The theory development side of the Theory –
Research cycle
The research
development side of the
Theory – Research cycle
"Pragyaan : JOM" Volume 7 : Issue 2, Dec 2009 11
Institute of Management Studies, Dehradun
described in the theory's laws of interaction. Dubin emphasizes that all the units and their variables in the theory should at least follow any one of the three laws given below:
1. Categoric Laws of Interaction: This law relates variables of unit Vs variables of another unit.
2. Sequential Laws of Interaction: This law relates time dimension of unit Vs time dimension of another unit.
3. Determinant Laws of Interaction: This law relates determinate variables of unit Vs determinate variables of another unit.
Based on the Dubin's methodology the critical factors (Units) in KM are identified and explained in Table -1.
The boundaries of a theory are established to determine and clarify the domain or area within which
the theory is expected to operate and apply (Dubin, 1978). The fourth step in the theory development was to specify the system states of the theory. The system states represent conditions under which the theory operates. Three criteria identified by Dubin (1978), when identifying the system states of a theory are
1. Inclusiveness Refers to the need for all the units of the system to be included in the system state of the theory.
2. Persistence - Requires that the system states persist through a meaningful period of time.
3. Distinctiveness - Requires that all units take on measurable and distinctive values for the system states.
In an organiza t ion the Knowledge Management Flow / model (Figure-4) exists and/or operates within the open boundary and closed boundary, and in both these boundaries the variables
Table 1. KM Units
Knowledge KMLLeadership is a self-driven factor for all initiatives in the firm. The firm'sManagement business strategies and goals need to be aligned with the KM process and KMLLeadership - plays the major role to bypass the things.
Knowledge KMC means an organization that offers opportunities to create knowledge andManagement Culture one that encourages learning and the sharing of what is learned.
KMC
Existing Information quality of various kinds, including the relevance, applicability,Information accuracy and so on. Quality EIQ
Existing System System Quality includes accessibility of relevant information's from anywhere, at Quality ESQ any time to leverage the business needs.
Current Information The improved version of EIQ which deals with the updated information's,Quality CIQ applicability and so on. The gap between EIQ and CIQ will be bridged by KMP
Knowledge Assessing the knowledge sharing within the relevant / peer group and satisfactionManagement Users with the access thereof.
KMU
Knowledge Process is composed of several steps to clearly identify what should be measured,Management how to measure it, and how to use the measures in an efficient and productiveProcess KMP way.
Knowledge Each & Every individual of an organization who involve themselves in KMP.Management
Workers KMW
"Pragyaan : JOM" Volume 7 : Issue 2, Dec 2009 12
An Affordable Approach to Knowledge Management (KM)

Figure 4 Knowledge Management Flow
KMP
Value Chain
KMP
KMP
KMP
CSQ
In Bound Logistic Operations
Outbound Logistic
Marketing & Sales
Service
Support functions - Supply chain, HR, Tech Development, and Infrastructure
PAT
Internal Customer Satisfactions
Knowledge HUB
KU KU
KU
KU
KU
ESQ
CIQ
EIQ
KML KMW KMC
Organization Initiatives – Closed Boundary
Trust, Co-operation, Incentives, involvement, etc.
Open Boundary - Trust, Co-operation, Incentives, involvement, etc.
KML – Knowledge Management Leadership
KMC – Knowledge Management Culture
KMI –Knowledge Management Workers
KMP – Knowledge Management Process
KU – Knowledge Users
EIQ / CIQ – Existing & Current Information Quality
ESQ / CSQ – Existing & Current System Quality
Creat
ion
Stage
Process
Stage
Usage
Stage
"Pragyaan : JOM" Volume 7 : Issue 2, Dec 2009 13
Institute of Management Studies, Dehradun
like trust, co-operation, involvement, incentives (appreciation), are considered to be the base variables. The organizations while operating need to give importance to these variables and should incorporate these in their value system. This shared value systems becomes the base / input for a better culture in an organization. In an organization leaders create culture and inspire others to follow it and sometimes culture can also create leaders. When this firm platform for a culture to develop efficacious leaders and/or leaders building in a strong culture would enable learning and sharing in an organization and thus will create a synergistic system which is ready to transform itself into a knowledge based system.
Stage 1 First Stage or Creation stage
The effect of culture & leadership creates a transparency in the process and this transparency is the initial success for converting the normal workers to knowledge workers. The ideas generated by the employees either from within the company or from outside, needs to undergo a process, and this is done in order to standardize the ideas generation / ideation and conceptualization process. This is the stage where the organization as a whole acts as a Brahma (one of the trinity in Hindu mythology responsible for creation) in synthesizing information to become raw knowledge that needs refinement and further to be made actionable.
Stage 2- Second Stage or Process stage
The processed information from the first stage are captured, processed and customized as per the requirements and needs of the organizations. The process should be followed throughout the organization, so that all existing information is utilized effectively and also to ensure that there is no loss of information and the main purpose is to align the entire process / system with the vision and value system of the organization. Once when this knowledge process is standardized then it's left to the user group to utilize it effectively. In this stage the standardized and value driven process / system is in place and it remains the responsibility of the users in keeping it integral by following the system conscientiously / to make it more better by using and re-using the existing knowledge in different places. This stage is almost like the function of Vishnu (one of the trinity in Hindu mythology responsible for preserving / protection).
Stage 3 Third Stage or Utilization stage.
This stage can be viewed under two levels: Internal and External. Here the knowledge utilization and value creation process involves both the push and pull mechanism. The new knowledge generated within the company is translated to satisfy customer requirements and/or bring in customer delight. On the other hand the available data on customer requirements are decoded / converted to information followed by making it actionable (converting into knowledge) resulting in business activities focused on customer satisfaction /delight, throughout the entire value chain. This stage can be equated to the function of Shiva (one of the trinity in Hindu mythology responsible for destruction). Destruction here is about letting go of the older knowledge and /or creating a completely new one or by reusing the older knowledge and creating a new one by looking it with a new perspective. So here, the creation process (Brahma) comes in as a finish-to-start with the utilization / destruction stage (Shiva).
Knowledge Management Culture KMC
Culture is the first unit in this model and it can be defined as “desires, end goals, and customary practices of the Industry or organization”. In addition, culture is the set of commonly-held beliefs and assumptions within an organization (Balogun & Jenkins, 2003).
Every company or organization has its own specific culture and therefore it's their unique practices (Schein, 1984). Just as organizational culture influences the actions and communications of everyone in a company, KMC can also be a powerful tool to influence on how companies can manage their used knowledge in an effective way. The proposed KMC is represented in the Figure 5.
Figure 5 Proposed Knowledge Management Culture
Key Result Area (KRA) Key Process Area (KPA)
People System
KRA KRA
KRA
KPA
Process
Knowledge Management Culture - KMC
"Pragyaan : JOM" Volume 7 : Issue 2, Dec 2009 14
An Affordable Approach to Knowledge Management (KM)
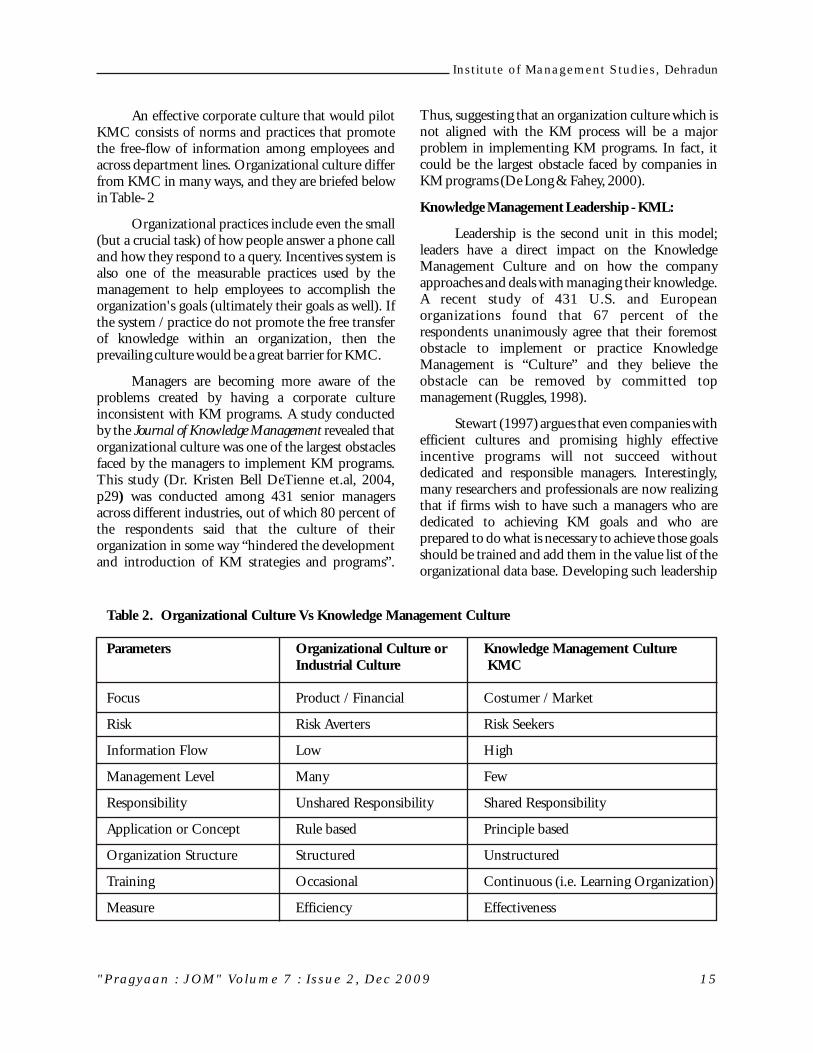
An effective corporate culture that would pilot KMC consists of norms and practices that promote the free-flow of information among employees and across department lines. Organizational culture differ from KMC in many ways, and they are briefed below in Table- 2
Organizational practices include even the small (but a crucial task) of how people answer a phone call and how they respond to a query. Incentives system is also one of the measurable practices used by the management to help employees to accomplish the organization's goals (ultimately their goals as well). If the system / practice do not promote the free transfer of knowledge within an organization, then the prevailing culture would be a great barrier for KMC.
Managers are becoming more aware of the problems created by having a corporate culture inconsistent with KM programs. A study conducted by the Journal of Knowledge Management revealed that organizational culture was one of the largest obstacles faced by the managers to implement KM programs. This study (Dr. Kristen Bell DeTienne et.al, 2004, p29) was conducted among 431 senior managers across different industries, out of which 80 percent of the respondents said that the culture of their organization in some way “hindered the development and introduction of KM strategies and programs”.
Thus, suggesting that an organization culture which is not aligned with the KM process will be a major problem in implementing KM programs. In fact, it could be the largest obstacle faced by companies in KM programs (De Long & Fahey, 2000).
Knowledge Management Leadership - KML:
Leadership is the second unit in this model; leaders have a direct impact on the Knowledge Management Culture and on how the company approaches and deals with managing their knowledge. A recent study of 431 U.S. and European organizations found that 67 percent of the respondents unanimously agree that their foremost obstacle to implement or practice Knowledge Management is “Culture” and they believe the obstacle can be removed by committed top management (Ruggles, 1998).
Stewart (1997) argues that even companies with efficient cultures and promising highly effective incentive programs will not succeed without dedicated and responsible managers. Interestingly, many researchers and professionals are now realizing that if firms wish to have such a managers who are dedicated to achieving KM goals and who are prepared to do what is necessary to achieve those goals should be trained and add them in the value list of the organizational data base. Developing such leadership
Table 2. Organizational Culture Vs Knowledge Management Culture
Parameters Organizational Culture or Knowledge Management Culture Industrial Culture KMC
Focus Product / Financial Costumer / Market
Risk Risk Averters Risk Seekers
Information Flow Low High
Management Level Many Few
Responsibility Unshared Responsibility Shared Responsibility
Application or Concept Rule based Principle based
Organization Structure Structured Unstructured
Training Occasional Continuous (i.e. Learning Organization)
Measure Efficiency Effectiveness
"Pragyaan : JOM" Volume 7 : Issue 2, Dec 2009 15
Institute of Management Studies, Dehradun
will certainly requires investment of both time and resources but the benefits or ROI will be marginally high .One such investment that companies have found beneficial is appointing Chief Knowledge Officer (CKO) or Chief Information Officer (CIO).
Kluge, Stein, and Licht (2001) points out that leaders across all levels of the organization have unique role to play in managing knowledge, particularly the CEOs since they set the boundaries (Policies, Procedures, Values, etc) for an organization. Therefore, he or she decides whether the KM should be a companywide or not. If the top management looks at KM as a strategic tool for business growth, the importance of KM cascades down to all levels.
Takeuchi (1995) in his work describes three way process by which the organization's top management can provide a clear direction about KM.
? First, CEO should give his stand on companies Business Process and top managers must articulate a 'grand theory' of what the company as a whole.
? Second, top management must incorporate its vision for knowledge management into the company's corporate objectives or policy statement.
? Third, top managers must strategically decide which KM efforts to support and develop and then must follow that strategy.
By performing these actions, Takeuchi argues, the organization's leadership will not only link different activities of the organization but also brings a single focus point on the objectives and carryout thereof for the next level.
Knowledge Management Process (KMP):
There are many strategies and techniques to capture the scattered knowledge and make it readily accessible to all. A KMP may look simple in principle but the effectiveness of the process can be judged in three ways:
1. Depth of Analysis or depth of the content
2. Time constrain or Lead time
3. Degree of accessibility
Basic Knowledge Management Cycle - 8 Stage
Process model:
The transforming of information into knowledge involves a synergic effect and this effect should be developed by the top management with the work team. New knowledge should be rapidly developed and made accessible to the focus group. In order to patch up the time constraints, companies need to follow a cyclic process as shown in the Fig.6
TF- Task Force Team RCA-Root Cause analysis
Figure 6 Basic Knowledge Management Cycle or 8 Stage Process model
Thus, KM process represents a collection of initiatives rather than a single project. An organization can succeed by developing capabilities continuously and transforming it to a useful or re-useful material which can be used for other projects. But important strategies of KM process are
? What knowledge to acquire?
? How to acquire it?
? What is to be created out of it?
? How it can be an internal valuable asset?
Conclusion
“Men who cannot communicate their knowledge to others;
Resemble a bouquet of unfragrant flowers in full bloom” (Thirukkural - Verse 650).
Form a TF
Document & make a constant review
Sensing the Problem
Reviewing the Existing
system
Collect the Explicit / Implicit
information
Assimilate the
information
Carry out RCA
Find or KPA & KRA
8-Stage Model
"Pragyaan : JOM" Volume 7 : Issue 2, Dec 2009 16
An Affordable Approach to Knowledge Management (KM)

So, to stay competitive, companies must find effective ways to leverage the knowledge that exists within their own organization. This paper has tried to highlight the importance of knowledge and the process to handle that knowledge in an effective way.
Secondly, this paper has identified and applied scientific process and/or a proven methodology (Dubin's theory building methodology) to find out the factors or variables or units which affects the knowledge Management and this effort would be furthered in the future towards building a new KM theory.
References:
? Addicott, Rachael; McGivern, Gerry; Ferlie, Ewan (2006). "Networks, Organizational Learning and Knowledge Management: NHS Cancer Networks". Public Money & Management, Vol.26, Issue.2, pp. 87-94.
? Anneloes M. L. Raes, Ursula Glunk, Mariëlle G. Heijltjes & Robert A. Roe, “Top Management Team and Middle Managers: Making Sense of Leadership”, Sage Publications on behalf of Academy of Human Resource D e v e l o p m e n t , h t t p : / / s g r . s a g e p u b . com/cgi/content/abstract/38/3/360.
? Anonymous, A White Paper on Knowledge Management and Corporate Culture, “Creating the right company culture in your organization, so that KM Management can work” http://www.providersedge.com/ docs/km_articles/KM_and_Corporate_Culture.pdf.
? Astrid Jaime, Mickael Gardoni & Joel Mosca, “From Quality Management to Knowledge Management in Research Organizations”, In t e rna t iona l Journa l o f Innova t ion Management, Vol. 10, No. 2 (June 2006) pp. 197215.
? Baiyin Yang, Wei Zheng & Chris Viere , “Holistic Views of Knowledge Management Models” , Sage Publications on behalf of Academy o f H u m a n R e s o u r c e D e v e l o p m e n t , http://adh.sagepub.com/cgi/content/abstract/11/3/273.
? Curtis A. Conley & Wei Zheng, “Factors Critical to Knowledge Management Success” ,
Sage Publications on behalf of Academy of Human R e s o u r c e D e v e l o p m e n t , http://adh.sagepub.com/cgi/content/abstract/11/3/334.
? Daryl Green, “Knowledge Management for a Postmodern Workforce: Rethinking Leadership Styles in the Public Sector”, Journal of Strategic Leadership, Vol. 1, Issue 1(2008), pp. 16-24.
? Davenport, T., Prusak, L. (1998), “Working Knowledge: How organizations Manage What They Know”, Harvard Business School Press, Boston, MA.
? David Gurteen, “Creating a knowledge Sharing Culture”, Knowledge Management Magazine, Vol.2, Issue 5 (Feb 1999), pp 1-4.
? Hsiu-Fen Lin, “A stage model of knowledge management: an empirical investigation of process and effectiveness”, Sage Publications on behalf of Chartered Institute of Library and In f o rmat i on Pro f e s s i ona l s , h t t p : / / j i s . sagepub.com/cgi/content/abstract/33/6/643
? Ikujiro Nonaka, “A Dynamic Theory of Organization Knowledge Creation”, The Institute of Management Science, Vol.5, No.1, Feb. 1994, pp 14 -37.
? Ikujiro Nonaka & Noboru Konno, “The concept of Ba Building a foundation for Knowledge creation”, California Management Review, Vol.40, No.3, spring 1998, pp 40 54.
? Infosys White paper on “Cost Reduction for Fi n a n c i a l Se r v i c e s Or g a n i z a t i o n s” , http://www.infosys.com/industries/banking-capital-markets/white-papers/cost-reduction-financial.pdf
? Jia Wang, “Developing Organizational Learning Capacity in Crisis Management”, Sage Publications on behalf of Academy of Human Resource Development, http://adh.sagepu b.com/cgi/content/abstract/10/3/425
? John R. Anderson , Michael Matessa & Christian Lebiere , “ACT-R : A Theory of Higher Level Cognition and Its Relation to Visual Attention” , Human Computer Interaction , vol.12 , 1997 , pp 439 462.
? Naachimuthu, K.P.(2007) “We are from
"Pragyaan : JOM" Volume 7 : Issue 2, Dec 2009 17
Institute of Management Studies, Dehradun
Knowledge sharing culture”, Management & Labour Studies, Vol.32, No.3 (August 2007), pp.369-374.
? Kristen Bell DeTienne, Gibb Dyer, Charlotte Hoopes & Stephen Harris , “Toward a Model of Effective Knowledge Management and Directions for Future Research - Culture, Leadership, and CKOs” , Sage Publications on behalf of Academy of Midwest Academy of Management, http:// j lo.sagepub.com/ cgi/content/abstract/10/4/2.
? Maulik Pathak, “ONGC to rope in Infosys for K M ” , h t t p : / / w w w . b u s i n e s s -standard.com/india/news/ongc-to-rope-in-infosys-for-knowledge-mgmt/361880/.
? Monica Marie Tuttle, “Towards a theory of continuous socialization for organizational renewal”, a thesis submitted to the faculty of the Graduate School of the University of Minnesota for the degree of Doctor of Philosophy, May 2003.
? Oscar A. Aliaga, “Knowledge Management and Strategic Planning”, Sage Publications on behalf of Academy of Human Resource Development, V o l . 2 , Y e a r : 2 0 0 0 , http://adh.sagepub.com/cgi/content/abstract/2/1/91.
? Pimpimon Kongpichayanond, “Knowledge Management for Sustained Competitive Advantage in Mergers and Acquisitions”, Sage Publications on behalf of Academy of Human Resource Development, http://adh.sagep ub.com/cgi/content/abstract/11/3/375
? Richard J. Torraco, A theory of Knowledge Management, Sage Publications on behalf of Academy of Human Resource Development http://adh.sagepub.com/cgi/content/abstract/2/1/38
? Richard Yu-Yuan Hung, Bella Ya-Hui Lien & Gary N. McLean, “Knowledge Management Initiatives, Organizational Process Alignment Social Capital, and Dynamic Capabilities”, Sage Publications on behalf of Academy of Human Resource Development, h t t p : / / a d h . s a g e p u b . c o m / cgi/content/abstract/11/3/320
? Someswar Kesh & Pauline Ratnasingam, “A Knowledge Architecture for IT Security”,
Communications of the ACM, Vol. 50, No. 7(July 2007), pp103 108.
? Steve Bundred, “Solutions to Silos: Joining Up Knowledge”, Journal Compilation, Public Money & Management, April 2006, pp 125 130.
? T.D. Wilson, “The Nonsense of 'Knowledge Management”, Journal of Information Research, Vo l . 8 , N o . 1 , p p 1 - 5 3 h t t p : / / InformationR.net/ir/8-1/paper144.html.
? Thomas James Chermack , A theory of scenario planning , A thesis submitted to the faculty of the Graduate School of the University of Minnesota for the degree of Doctor of Philosophy , May 2003
? Tracy A. Hurley & Carolyn W. Green, “Knowledge Management And The Nonprofit Industry: A Within And Between Approach”, Journal of Knowledge Management Practice, January 2005 http://www.tlainc.com/ articl79.htm
? Uday R. Kulkarani , Sury Ravindran & Ronald Freeze, “ A Knowledge Management Success Model Theoretical Development and Empirical Validation”, Journal of Management Information Systems, Vol. 23, No.3(winter 2006 -07) , pp 309 347.
? Zoë Dann and Ian Barclay, “Complexity Theory and Knowledge Management Application”, The Electronic Journal of Knowledge Management, Vol. 4, Issue 1, 2006, pp 11-20. http://www.12manage.com /description_tacit_knowledge.html
? http://tip.psychology.org/anderson.html ? h t t p : / / w w w. l i n k e d i n . c o m / a n s w e r s /
m a n a g e m e n t / c h a n g e - m a n a g e m e n t / MGM_CMG/ 94271-10490247
? http://en.wikipedia.org/wiki/ACT-R ?h t t p : / / e n . w i k i p e d i a . o r g / w i k i / Knowledge_management
? http://www.sveiby.com/articles/Polanyi.html ? ht tp : / /www.12manage .com/methods_
nonaka_seci.html# ? h t tp : / /www. indus t r i e . gouv. f r / index_
portail.php ? h t t p : / / w w w. k r i i . c o m / d o w n l o a d s /
wiig_km_interview.pdf
"Pragyaan : JOM" Volume 7 : Issue 2, Dec 2009 18
An Affordable Approach to Knowledge Management (KM)

Introduction
One of the fundamental questions in the corporate finance for a firm is to decide on a financing grid ranging from issuing equity or raising debt or mix of two. Capital structure decision of the firm is a significant managerial decision, which influences the shareholders return and risk. The market value of the share may be affected by the capital structure decision. Capital is a limited productive resource in developing economies and proper utilization of this resource promotes the rate of growth, cuts down the cost of production and above all improves the efficiency of the productive system. Capital is life blood of a business organization and can be broadly categorized into fixed capital and working capital. All fixed assets, intangible assets, investments and 'other assets' which are retained permanently in the business are financed by fixed capital, which consists of long term liabilities. In other words, fixed capital is a part of capital which is invested in land and building, plant and machinery, furniture and fittings, goodwill and patents etc. The working capital refers to short term funds required for financing the duration of the operating cycle normally
Determinants of Capital Structure : A study of Indian Cement Industry
*Asstt. Prof., SOMS, IGNOU, Maidan Garhi, N. D-68 **IITM, Institutional Area, JanakPuri, N. D-58 ***IILM, Noida (UP)
Dr. Sunil Gupta*Prof. R.K Sharma**
Prof. P.K. Aggarwal***
ABSTRACT
A proper blend of debt and equity is a significant financial decision of the corporate firm from the perspective of its shareholders and other stakeholders. The excessive use of debt may endanger the survival of a corporate firm while the conservative policy may deprive the advantage of cheaper debt. An appropriate capital mix influences both the return and risk of the shareholders. The proper and efficient management of capital structure yields two advantages: (i) maximization of profit and wealth of shareholders, and (ii) minimization of cost of capital. Therefore, the financial manager is confronted with the task of determining determinants of a capital structure of the firm, which on the one hand maximizes the wealth of the owners and on the other hand minimizes the cost of funds. The present study examines the fixed capital structure of companies with a view to identify the factors determining their capital structure. The study is related to the selected companies in the cement industry. The present study covers a period of 14 years based on annual study from 1991-92 to 2004-05. The study is confined to cement industry pertaining to Large Public Limited Companies in Private Sector in India.
Key words: Capital Structure, Profit, Cost of capital, Wealth, Fixed assets, Working capital, Intangible assets.
an accounting year in a business unit. The efficient management of fixed capital and working capital is of strategic importance as the success of the enterprise greatly depends upon its optimum utilization. The issue of efficient financial management is of crucial importance to corporate world since it is linked with profitability and financial soundness of the business. In order to achieve the two objectives of high profit and financial soundness, the financial manager must be careful in managing the capital structure of a firm.
Review of the literature
Titman (1984) suggests that customers avoid purchasing a firm's product if they think that the firm might go out of business and therefore not stand behind its product especially if the products are unique. Consequently firms that produce unique products might avoid using debt.
Brennan & Schwartz (1988) argue that the call or conversion feature makes convertible debt relatively insensitive to asymmetric information (between management and investors) about the risk of the firm.
"Pragyaan : JOM" Volume 7 : Issue 2, Dec 2009 19
Stein (1992) argues that if the firms privately know that their stock is undervalued they prefer to avoid issuing equity.
Demirguc-Kunt and Maskimovic (1996) investigate empirically the effects of stock market development on the financing choice of the firms and find that firms in country with an underdeveloped stock market first increase their debt-equity ratios as their stock markets develop and that the debt equity finance are complimentary.
Bhole & Mahakud (2004) in their study of trends and determinants of capital structure in respect of public and private companies developed the panel data model. They conclude that two variables, size and liquidity, are the significant determinants of corporate capital structure.
Seetanah, Padachi & Ronoowah (2007) in their study of 38 firms of stock exchange of Mauritius for the period of 1994-2004 showed that the most important factor influencing the capital structure choice are profitability, size, tangibility and liquidity. Other factors like business risk, non debt tax shield effects and growth opportunities do not seem to affect the capital structure.
Methodology
The study is based on the secondary sources of information. The relevant data for the measurement of variables was taken from the Bombay stock exchange Directory and supplemented with other published sources. The study is related to the selected companies in the cement industry. The present study covers a period of 14 years based on annual study from 1991-92 to 2004-05. The study is confined to cement industry pertaining to Large Public Limited Companies in Private Sector in India. In order to examine the objectives of the study, several statistical techniques such as ratios, percentage, and standard deviation, co-efficient of variation have been used. Further, multiple regression technique was also employed to estimate fixed capital models. The overall fitness of the model was verified by the estimated
2values of R , t, F and Durbin Watson statistics. The multiple regression analysis was performed with the help of statistical package of social science (SPSS).
Structure of Gross Fixed Capital
The structure of various components of gross fixed capital is studied to obtain a deep insight into the
configuration of fixed assets of the industry. This will be useful in knowing the comparative and distinctive features that characterize the assets held by the cement industry of large public limited companies. Table 1 displays the structure of gross fixed capital of cement industry during the study period.
Table 1. Structure of Gross Fixed Capital in Cement Industry (1991-05)
S.No Gross Fixed Mean Standard Co-Capital Devia- efficient
tion ofVariation
1 Share of Land & 12.60 1.46 11.62Building
2. Share of Plant and 72.12 4.96 6.88Machinery
3. Share of Capital 8.72 3.69 42.28work-in progress
4. Share of Furniture 1.56 4.22 270.51& office Equipments
5. Share of other assets 5.00 1.61 32.06
It is evident from the Table 1 that plant and machinery occupies a major share in the total value of gross fixed assets in respect of cement industry during the review period. This is the single largest component of fixed assets in all cement units. Being a capital intensive industry, cement industry showed the maximum of 72.12 per cent of gross fixed capital in the form of plant and machinery with reasonable stability since their co-efficient of variation was 6.88 per cent only. The average proportion of capital invested on Land and buildings was 12.60 per cent of gross fixed capital, followed by capital work-in-progress (8.72 per cent), other fixed assets (5 per cent) and furniture office equipments (1.56 per cent). The erratic fluctuations were noticed in the share of components of work in progress, Furniture's office equipments and other fixed assets during the study period.
Model on Fixed Capital
In order to determine the time series estimation of the effects of various determinants of fixed capital viz., Net sales, Lagged accumulated depreciation, Borrowing, Capital-Output ratio, Accumulated depreciation, Lagged net fixed capital and Lagged net sales on net fixed capital stocks of cement industry.
"Pragyaan : JOM" Volume 7 : Issue 2, Dec 2009 20
Determinants of Capital Structure : A study of Indian Cement Industry

GFC =b +b S +b AD +u ............. (1)t 0 1 t 2 t-1 t
GFC =b +b S +b B +u ............. (2)t 0 1 t 2 t t
NFC =b +b S +b (K/Q) +u ............. (3)t 0 1 t 2 t t
NFC =b +b S +b AD +u ............. (4)t 0 1 t-1 2 t t
NFC =b +b S +b NFC +u ............. (5)t 0 1 t 2 t-1 t
Where GFC = Gross Fixed Capital
NFC = Net Fixed Capital
S = Net Sales
AD Lagged accumulated Depreciationt-1 =
B = Borrowing
(K/Q) = Capital Output Ratio
AD = Fixed Accumulated Depreciation
NFC = Lagged Net Fixed Capitalt-1
S = Lagged Net Salest-1
b , b and b = Relevant Regression Co-efficients0 1 2
u = Error Term.
Theoretically, the parameter with respect to net sales (b ) is expected to be specified as non-negative 1
value i.e. b >0 in model (1). It indicates that the 1
increase in sales would justify the need for expansion of gross block. The parameter of lagged accumulated depreciation is expected to have non negative value i.e. b > 0 in model (1). In model (2), the parameter 2
associated with the borrowing (b ) is predicted to 2
obtain positive sign implying that an increase in borrowings could bring some positive additions to gross fixed capital. In model (3), the parameter associated with the net sales (b ) is expected to be 1
positive, i.e. b >0. It refers to the fact thatan increase in 1
sales would justify the need for expansion of net block. Further it is measured on “a priori” basis that the functional relationship between net block and capital-output ratio is positive, the expected sign of the co-efficient of (K/Q) is to be positive, i.e. b >0 in model 2
(3).
As regarded the Co-efficient of lagged net sales ,theoretically it is expected to assume positive value, i.e., b >0. This sign property reveals that there is an 'a 1
priori' reason to believe that increase in accumulated
depreciation would tend be reduce net block. Therefore, the co-efficient associated with accumulated depreciation is predicated to possess negative sign (b <0) in model (4). It also suggests that 2
the net fixed capital is positively dependent upon lagged net fixed capital in model (5).
Results
Model 1: The co-efficient of multiple 2determinations (R ) reveals that Net Sales and lagged
accumulated depreciation would explain 96 per cent of variability in the gross fixed capital of cement industry during the reference period. The overall significance of the regression depicted by F value is 182.03 considered to be highly significant. The co-efficient of net sales (b ) obtains positive sign as 1
expected and emerges statistically significant. It is observed that increase in sales would contribute an equal increase in capital invested on fixed assets. The co-efficient associated with lagged accumulated depreciation is statistically invalid. It implies that lagged accumulated depreciation has no impact on gross fixed capital during the reference period.
Model - 1: GFCt = b + b S + b AD + u0 1 t 2 t-1 t
GFCt= -210.87 + 1.24 S + 0.22 ADt t-1
(7.90)* (0.58)
2R = 0.96, F= 182.04, DW= 0.47* Significant at 5% level
Model 2: The explanatory power of the model 2of gross fixed capital is good (measure by R and F
2ratio). The R statistic values exhibit 99 per cent of variation in gross fixed capital which could be determined by the explanatory variables viz. Net sales and borrowing during the study period. It is evident from the results that the impact of net sales turns outs to be insignificant on gross fixed capital stock. The value of co-efficient of net sales (b ) is less than unity in 1
cement industry. It indicates that increase in gross fixed capital stocks was lower than increase in net sales with respect to borrowing; its co-efficient value (b ) 2
obtains positive sign in cement industry and being significant. The value of b is greater than unity which 2
implies that cement industry experienced more than proportionate increase in gross block as a result of increase in gross block as a result of increase in borrowing.
"Pragyaan : JOM" Volume 7 : Issue 2, Dec 2009 21
Institute of Management Studies, Dehradun
Model - 2: GFC = b + b S + b B + ut 0 1 t 2 t t
GFC = 155.21 + 0.03S +1.67Bt t t
(0.14) (6.28)*
2 R =0.99, F=612.19, DW=1.05,
* Significant at 5% level
Model 3: The impact of net sales turns out to be more significant on net fixed capital stocks. The value of the co-efficient of net-sales (b1) is less than unity in cement industry. It indicates that increase in net fixed capital stock was lower than the increase in net sales. Another co-efficient associated with (K/Q) i.e., b 2
appears with positive sign and it is highly significant. A greater positive impact of (K/Q) variable on net fixed capital was noticed in the case of cement industry. This was due to capital intensive nature of this industry. The explanatory power of independent variables would be 97 percent in net fixed capital stock by the cement industry and the model has a goodness of fit as the calculated value of F-ratio is found to be greater than the critical table value of F ratio.
Model - 3: NFC = b + b S + b (K / Q) + ut 0 1 t 2 t t
NFC = -3285.54 + 0.75 S + 2051(K/Q) t t t
13.55 (3.28)*
2R = 0.97, F=236.83, DW = 0.251
* Significant at 5% level
Model 4: The explanatory power of the model 2of net fixed capital is good. The R statistic value
highlights 97 per cent of variations in net fixed capital which could be determined by the explanatory variables viz. lagged net sales and accumulated depreciation during the study period with respect to lagged net sales, its co-efficient value (b ) possesses 1
positive sign in cement industry during the reference period and being insignificant. As regards accumulated depreciation, the value of its co-efficient (b ) is positive as expected theoretically and significant 2
statistically in case of cement industry. This indicates that accumulated depreciation exerted a positive impact on net fixed capital, i.e., increase in accumulated depreciation fund to replace the fixed assets would tend to increase net fixed capital.
Model - 4: NFC = b + b S + b AD + u t 0 1 t-1 2 t t
NFC -56.93 + 0.06 S + 1.861 ADt= t-1 t
0.83 (12.03)*
2R = 0.97, F=259.16, DW=1.127
* Significant at 5% level
Model 5: The co-efficient of multiple 2determinations (R ) of the model reveals the net sales
and lagged net fixed capital stock would cause 95 percent of variability in the net fixed capital of this industry during the study period. The overall significance of the model fitted well for this industry and it is supported by the estimated value of F-Ratio. The co-efficient of net sales (b ) obtains positive sign as 1
expected and emerges significant statistically in the case of cement industry. The magnitude of b is less 1
than unity, showing that increase in net sales would tend to expand the investment on fixed assets at less than proportionate rate. As in the case of influence of lagged net fixed capital on net fixed capital, it is not significant in terms of 'a priori' and statistical specifications.
Model - 5: NFC = b + b S + b NFC + ut 0 1 t 2 t-1 t
NFC -157.21+ 0.76 S + 0.16 NFCt= t t-1
(7.91)* 1.42
2 R = 0.95, F= 159.38, DW= 0.783
* Significant at 5% level
Conclusion
The regression results of the models on gross fixed capital shows that net sales has turned out to be significant variable and it was related positively with the gross fixed capital. Similarly, borrowings, capital-output ratio (K/Q), and accumulated depreciation had been largely influencing growth of fixed capital stocks in the cement industry during the study period. All these factors affect the capital structure decision in some or the other ways and help the management in arriving at an optimal capital structure. The results of this study will be useful to the financial decision-makers to plan their capital structure. This will help in maximizing the value of a firm and achieving the main objectives of the business. So it is suggested that while
"Pragyaan : JOM" Volume 7 : Issue 2, Dec 2009 22
Determinants of Capital Structure : A study of Indian Cement Industry

raising finance for companies, management of the company should give due importance to capital structure decision by considering various determinants of capital structure.
References:
? Bansal, Anand. (1994). The EBIT-EPS approach to capital structure. The Management Accountant. pp. 78-82.
? Chandrasekhar. (1989). Aspect of growth structure change in Indian industry. Economic and political weekly, XIII (45): 72-100.
? Jitendra Mahkud and Bhole. (2004). Determinants of corporate capital structure in India a dynamic panel data analysis. ICFAI Journal of Applied Finance, 9(6):41.
? Kakani, R. (1999) “The determinants of Capital Structure: An Econometric Analysis” Finance India Vol. 13, pp.54-60
? Myers, Stewart (2001) “Capital Structure” Journal of Economic perspectives, Vol.15, pp.87-95
? Mahesh Chand Grag and Chander. (2002). Determination of capital structure in India. The Management Accountant, 37(2): 16-20.
? Mall. (1987). Trends in capital structure of medium and large private limited companies. The Chartered Accountant, pp. 14-17.
? Stein, J. (1992) “Convertible Bonds as Backdoor Equity Finance” Journal of Financial Economics Vol.32pp.7-12
? Siddhartha Sinha.(1993). Inter-industry variations in capital structure. Economic and Political Weekly, XXVIII (35): M93-M94.
? Titman, S. (1984) “The effect of Capital structure on a Firm's Liquidation Decision” Journal of Financial Economics, Vol.13pp.138-140
"Pragyaan : JOM" Volume 7 : Issue 2, Dec 2009 23
Institute of Management Studies, Dehradun
Introduction
Presently the Self-Help Group (SHG) mode of generating Self-employment in the rural areas has been an accepted mode of operating Poverty Alleviation and Social Intermediation Programs, administered by different Departments of the State Government and Central Government. SHGs comprise homogeneous groups of poor people who have voluntarily come together mainly with the idea of overcoming their common problems of low social and economic status. SHGs enable the poor, especially the women from the poor households, to collectively identify, prioritize and tackle the problems they face in their socio economic environment.
By pooling their meager resources and using them for lending among themselves, they develop the habit of thrift and the skill of credit appraisal, before getting mature enough to access a loan from banks, which is called credit linkage. Starting with small loans for consumption they soon graduate to bigger loans for setting up of income generating micro-enterprises. Today, NABARD's SHG Bank Linkage Programme boasts of over 26 lakh SHGs and 3.9 crore households influencing the lives of over 16 crore poor population (Ministry of Rural Development, Govt. of India, Annual
Self Help Groups and their Marketing Practices of Livestock Products: A Study conducted in West Bengal
Saurabh Singh* Poonam Singh**
Yashwant Gupta***
ABSTRACT
The self-employment program of Self Help Groups (SHGs) formed under Swarnajayanti Gram Swarojgar Yojana (SGSY) guidelines, is mainly concentrated on the inputs, rather than concentrating on outputs, and their marketing. To study the marketing practices of livestock products by SHGs the data was collected with the help of structured questionnaires, and analytical tools like factor analysis, cross tabulation and chi square test were applied. Marketing problems are more frequently faced by SHGs mainly due to failure in establishing market linkages rather than lack of market opportunities. Therefore this study aims to recommend suitable sales and marketing strategies for enhanced profitability of the Self Help groups of Raina-I and II block”.
Keywords: Marketing, Live Stock Products, Self Help Groups
* MBA, AMT, MIMA, Fellow ISM, Assistant Professor College of Agribusiness Management, G. B. Pant University of Agriculture & Technology Pantnagar
** Subject Matter Specialist, Department of FRM, College of Home Science, Chandra Shekhar Azad Krishi Evam Prodyogik Vishwa Vidyalaya, Rawatpur, Kanpur, Uttar - Pradesh
*** Department of Finance & Accounts, Institute of Management Studies, Himachal Pradesh University, Shimla, H.P.
Report, 2007). During the year 2006-07 alone, as many as 458591 groups were credit linked. The Swarnjayanti Gram Swarozgar Yojana (SGSY) is a major on-going programme for self-employment of rural poor by putting emphasis on mobilization of the rural poor to enable them to organize into Self Help Group (SHG). The basic objective of the SGSY is to bring the assisted poor families (Swarozgaris) above the Poverty Line by providing them income-generating assets through a mix of bank credit and governmental subsidy. The programme aims at establishing a large number of micro enterprises in rural areas. A few issues regarding marketing of products of SHG are discussed.
Problem Statement And Objectives
Traditionally, the self-employment programme, concentrated on the inputs rather than the outputs and their marketing. Most of the SHGs in the area of study are practicing mixed type of farming related to livestock and animal husbandry. Mixed type of farming is fetching them higher returns as compared to other activities like dairy, poultry and goatary. SHG members are mainly facing the problems of distress sale, transportation of products to specific markets and lack of market information. Low volume of
"Pragyaan : JOM" Volume 7 : Issue 2, Dec 2009 24

production coupled with transportation related problems forces them to sell their products at lower prices through intermediaries. Distress-sale is also forced because of disease conditions, less bargaining power and false market information. Their profit margins too, get affected by the unproductive animals. In some cases Rhode Island Rhode (RIR) breed of poultry which they rear, is not accepted by the local customers. Improved transportation facility to specific local markets can enhance the profitability of the SHG members.
A study of the local markets might reveal that what the villagers purchase can as well be produced locally. The opportunities must be fully explored. At the same time, it must be remembered that it is neither feasible nor desirable to produce all goods in all places. Marketing problems are more frequently faced by SHGs mainly due to failure in establishing market linkages rather than lack of market opportunities. Therefore this study with the following objective was undertaken:
“To recommend suitable sales and marketing strategies for enhanced profitability of the Self Help groups of Raina-I and II block”.
Literature Review
Studies on evaluation of existing marketing practices by SHG members are limited. The important ones amongst them having a direct relationship with the subject of study have been detailed below.
Prakash R. and Nehru, SM, (1998) found that the major problems faced by farmers were marketing of their produce. In case of horticultural produce processing and marketing of the products through a well-planned and better-managed horticulture enterprise was recommended by the authors. They suggested a shift from 'what it is possible to produce: to producing what is marketable'. This change demands better understanding of the markets and the changing consumer needs. Through group marketing, farmers are able to fetch fair and reasonable price.
Jhunjhunwala Bharat (2005) worked on turning SHGs into sustainable business enterprises. He suggested it should work with the government to increase the demand for labour-intensive goods made by the SHGs. The increased demand will lead to higher prices and incomes for the workers. SHGs
should work with individual micro-entrepreneurs who have the business ability and it should not place the burden of social management on the SHG members.
Malarvizhi J. (2005) studied the home marketing skills of Self-Help Groups. Encouragingly, the SHGs have sharpened their marketing skills. The Women Development Corporation too shifted focus to marketing from production and local sales. The groups are encouraged to come to urban centers and there is increased public awareness of the fact that products are competitive both in quality and price.
Gupta Subrata (2007) studied the impact of women Self Help group programme in West Bengal. Under this study he covered financial upliftment of the women Self Help groups who were associated with self employment activities and credit linked with banks.
Singh Awadhesh Kumar (2007) under the sponsorship of Planning Commission, Govt. of India, studied the functioning of SHG members and utilization of micro credit by performance of Swashakti and Shyamshiddha projects in India.
Annual Report (2007) Ministry of Rural Development, Govt. of India depicts current picture of SHG movement in rural India under SGSY guidelines.
Research Methodology
The study was conducted in Raina-I and II blocks of Burdwan District of West Bengal. These two blocks were selected on the basis of spread (increase in the number of newly formed SHGs) of the SHG movement. Raina-I and II were the very two model blocks where first SHG in West Bengal was formed in 1999 under the SGSY guidelines. These two blocks have maximum concentration of SHGs' as compared to other block in West Bengal. Therefore, these two blocks were covered under this study programme. Again from each block four Gram Panchayats (GP) were selected based on the same criterion. From Raina-I, GPs namely, Shyamsundar, Mugura, Palasan and Narugram were selected. From Raina-II, GPs namely, Gotan, Barabainan, Paita-I and Arui were selected. The universe for this study were all the SHGs formed under SGSY guidelines. Self Help Group members who are associated with micro or small scale enterprises related with
"Pragyaan : JOM" Volume 7 : Issue 2, Dec 2009 25
Institute of Management Studies, Dehradun
livestock and animal husbandry formed the sampling units for this study. Number of Self Help Groups selected was 24 where as number of Self Help Group members were 72 (3 from each group. Among the 3 members one is office bearer and the other two are general members).
A two stage stratified judgemental and purposive sampling technique was adopted. In the first stage, blocks were selected. The major consideration for block selection was the spread of the SHG movement. Raina-I and II block of Burdwan district were the model blocks where SHG movement under SGSY guidelines was launched in 1999. Now these two blocks have more number of SHGs as compared to any other block in West Bengal. In the second stage Gram Panchyats (GP) were selected from each block. On the basis of more number of SHGs four GPs were selected from each block. Now three groups from each GP were randomly selected. While selecting the groups three strata were formed like below.
I) SHGs, which have been working for less than 2 years
II) SHGs which have been working for 2 to 4 years
III) SHGs which have been working for more than 4 years
Now among the three groups from a GP one from each stratum was selected.
Research Instrument: Well structured questionnaire containing both open and close ended questions were prepared for taking interviews of SHG members.
To measure the psychometric properties, the method used is a common one that is ranking or rating scale method. The scale had a spread ranging from 1 to 5, where point 1 = Least Important Factor and point 5 = the factor commanding highest consideration in decision making.
The total factors that emerged as a part of study were nine in number and can be listed as (i) Size of Market, (ii) Price Differential, (iii) Demand for Product, (iv) Gathering or Footfall of the market, (v) Distance from the place of the residence, (vi) Transportation cost, (vii) Ease of Transport, (viii) Bulk Sale; and (ix) Rapport with whole seller. Besides all the factors listed above, all the factors were
supported by various sub factors or sub parts and reverse check measure for accuracy and validation of data collected.
Data Analysis: Collected data were coded, classified, tabulated and interpreted. Based on the response received from respondents, appropriate statistical tools like Factor analysis, Cross tabulation and Chi-square test along with average, percentage, and ranking were used and inferences drawn. Data was analyzed by using the SPSS (version 14) software package. The variance amongst the factors is reported in the Annexure.
Results and Discussion
At the outset ,types of enterprises, owned by the respondents were identified and the same has been shown in Exhibit: 1. The most common type of enterprise is mixed farms (29 respondents). In case of mixed farms different types of livestock like poultry, dairy, goatary and calf rearing were practiced simultaneously. The next common enterprise is livestock along with other activities (cultivation, handicraft, paddy processing etc.). It is followed by poultry, dairy and goatary consecutively.
Exhibit: 1 Type enterprises related to livestock
For evaluating the financial status and profitability of the SHG members, information about average annual income was collected. Exhibit 2 shows that 51percent of the total respondents are earning on an average of Rs. 5000- Rs. 10,000 annually, 24 percent of the total respondents are earning on an average of more than Rs. 10,000 annually and 25 percent of the total respondents are earning on an average of less than 5000 annually. The income of the respondents from the micro enterprises highly fluctuates due to unproductive animals. 37 percent of
"Pragyaan : JOM" Volume 7 : Issue 2, Dec 2009 26
Self Help Groups and their Marketing Practices of Livestock Products...

the respondents have unproductive animals which increase the cost of production and thus reduce the level of income.
Exhibit: 2 Average annual income of respondents
Whether the types of enterprises (independent variable) have any impact on the level of income (dependent variable), was determined by applying a Chi-square test of the cross-tabulated data with the help of SPSS 14 software packages. Initially whole data
was coded as shown in Table 1 and fitted into the spread sheet. From the cross- tabulation as shown in Table 2, it can be inferred easily that, maximum income was earned from the mixed type enterprises. Table 3 depicts that the level of significance (Pearson's) is 0.045, meaning there by that Chi-square Test is showing a significant association between the types of enterprises and level of income at (100-4.5=95.5) 95.5 percent confidence level. So it can be concluded that at 95 percent confidence level, type of enterprises and level of income are associated significantly with each other. The Lambda value, as shown in Table 4 is a measure of reduction in error on predicting the association between the two variables. The asymmetric lambda value (the type of enterprise dependent) 0.116 means that 11.6 percent error is reduced in predicting the level of income. Therefore it can be concluded that there is a moderate but significant relationship between the two variables.
Table 1. Code of parameters during analysis
Type of enterprise Code Level of income(Rs)
Dairy 1 Below 5000
Goatary 2 5000-10,000
Poultry 3 More than 10,000
Mixed 4 ----------------
Livestock and Others 5 ----------------
Table 2. Cross tabulation between type of enterprises and annual income
Annual income Total
1.00 2.00 3.00
Type of 1.00 Count 1 2 0 3enterprise % within Annual income 5.6% 5.4% .0% 4.2%
2.00 Count 0 3 0 3% within Annual income .0% 8.1% .0% 4.2%
3.00 Count 2 8 6 16% within Annual income 11.1% 21.6% 35.3% 22.2%
4.00 Count 5 14 10 29% within Annual income 27.8% 37.8% 58.8% 40.3%
5.00 Count 10 10 1 21% within Annual income 55.6% 27.0% 5.9% 29.2%
Total Count 18 37 17 72% within Annual income 100.0% 100.0% 100.0% 100.0%
"Pragyaan : JOM" Volume 7 : Issue 2, Dec 2009 27
Institute of Management Studies, Dehradun
Table 3. Chi-Square Test
Description Value Degree of Asymmmetric. freedom Significance. (2-sided)
(a)Pearson Chi-Square 15.799 8 .045
Likelihood Ratio 18.222 8 .020
Linear-by-Linear Association 2.796 1 .094
No of Valid Cases 72
a 9 cells (60.0%) have expected count less than 5. The minimum expected count is 71.
Table 5. Symertic Measures
Value Approx. Sig.
Nominal by Nominal Phi .468 .045Cramer's V .331 .045Contingency Coefficient .424 .045
No. of Valid Cases 72
a Not assuming the null hypothesis.b Using the asymptotic standard error assuming the null hypothesis
The value of contingency coefficient which establishes strength of the output, is shown in Table 5 to be 0.424 which lies between 0- 0.5. This means there is a moderate correlation existing between two variables
under consideration. Thus from the discussion it can be fairly concluded that, the level of income can be increased by adopting mixed type of farming.
Table 4. Directional Measures
Description Value Asymp. Approx. Approx. (a) (b)Std. Error T Sig.
Nominal by Lambda Symmetric .064 .093 .676 .499
Nominal Type of enterprise .116 .085 1.306 .191Dependent
Annual income .000 .128 .000 1.000Dependent
Goodman and Type of enterprise .074 .035 .007(c)Kruskal tau Dependent
Annual income .096 .036 .091(c)Dependent
a Not assuming the null hypothesis.b Using the asymptotic standard error assuming the null hypothesis.c Based on chi-square approximation
"Pragyaan : JOM" Volume 7 : Issue 2, Dec 2009 28
Self Help Groups and their Marketing Practices of Livestock Products...

In case of marketing the respondents are selling their products through different channels as depicted in Exhibit 3 forty seven percent of the respondents who have a very small scale of production sell their products directly from their home. Local customers come to their home for purchasing products like egg, meat, milk etc. Those who have a bit larger scale of operation, generally sell through intermediaries, wholesalers or retailers. Thirty three percent of the respondents sell through intermediaries. There are a fairly good number of respondents who are getting their profit margin reduced due to the involvement of intermediaries. Sixteen percent of the respondents sell through retailers and only four percent through wholesalers.
Exhibit 3. Selling pattern of respondents.
The common problems in marketing of livestock products are shown in Exhibit: 4. The common problem is distress sale. Twenty eight percent of the respondents faced the problem of distress sale. Twenty one percent of the respondents reported that their product was not accepted by the customers. The reason is, they are producing RIR breed of poultry birds which is not as acceptable as broilers for meat purpose. For meat purpose customers preference is broiler and desi breed but RIR breed is not so popular among them.
Exhibit 4. Common problems in marketing livestock products.
Eighteen percent of the respondents got less price for their products due to the presence of intermediaries in the marketing channel and lack of bargaining power. Fourteen percent of the respondents faced the problem of high transportation cost followed by twelve percent who faced the problem of distance of market from their locality. The remaining seven percent of the respondents don't have proper market intelligence for selling their products.
The major cause of the distress sale is diseases and mortality of animals. 64 percent of the respondents reported that diseased conditions of the animals are the cause of distress sale of livestock products whereas 22 percent of the respondents said that the lack of bargaining power is the root cause of distress sale. Remaining 14 percent of the respondents have to undergo distress sale because of false market information.
The main problem in transportation lies with low volume of production level. 46 respondents reported that they have too low production level to transport it to organized markets. Low volume of production level ultimately makes the cost of transportation dearer. 23 respondents reported that the cost of transportation is very high. They prefer that sell the products from their home instead of carrying it to local markets. 17 respondents reported carrying the products to local markets was a time consuming affair. They used to do other works (cultivation) during that time. 5 respondents reported that lack of market information was a major constraint for transportation.
For removing the above problems, a demographic profile of the target markets was prepared to know the preference of the SHG members for selling their products in the best market of that
Exhibit 5. Preferential ranking of the local market
"Pragyaan : JOM" Volume 7 : Issue 2, Dec 2009 29
Institute of Management Studies, Dehradun
�a�r�e�a�.� �A� �p�r�e�f�e�r�e�n�t�i�a�l� �r�a�n�k�i�n�g� �o�f� �t�h�e� �l�o�c�a�l� �m�a�r�k�e�t�s� �w�e�r�e� �t�a�k�e�n� �f�r�o�m� �t�h�e� �S�H�G� �m�e�m�b�e�r�s�.� �I�t� �s�h�o�w�s� �t�h�e� �m�a�r�k�e�t� �w�h�i�c�h� �i�s� �p�r�e�f�e�r�r�e�d� �m�o�s�t� �b�y� �t�h�e� �r�e�s�p�o�n�d�e�n�t�s� �f�o�r� �s�e�l�l�i�n�g� �t�h�e�i�r� �p�r�o�d�u�c�t�s�.� �I�n� �E�x�h�i�b�i�t� �5�.� �S�e�h�e�r�a�B�a�z�a�r� �H�a�a�t� �w�a�s� �r�a�n�k�e�d� �f�i�r�s�t� �b�y� �m�o�s�t� �o�f� �t�h�e� �r�e�s�p�o�n�d�e�n�t�s� �f�o�l�l�o�w�e�d� �b�y� �J�a�m�a�l�p�u�r� �H�a�a�t� �a�n�d� �P�a�l�a�s�a�n�.� �S�o� �i�t� �c�a�n� �b�e� �i�n�f�e�r�r�e�d� �t�h�a�t� �S�e�h�e�r�a�B�a�z�a�r� �H�a�a�t� �i�s� �t�h�e� �m�o�s�t� �p�r�e�f�e�r�r�e�d� �m�a�r�k�e�t� �w�h�e�r�e� �t�h�e� �S�H�G� �m�e�m�b�e�r�s� �a�r�e� �w�i�l�l�i�n�g� �t�o� �s�e�l�l� �t�h�e�i�r� �l�i�v�e�s�t�o�c�k� �p�r�o�d�u�c�t�s�.�
�R�e�c�o�m�m�e�n�d�a�t�i�o�n�s
�S�e�h�e�r�a� �B�a�z�a�r� �h�a�a�t� �w�h�i�c�h� �i�s� �r�a�n�k�e�d� �f�i�r�s�t� �b�y� �t�h�e� �r�e�s�p�o�n�d�e�n�t�s�,� �i�s� �t�h�e� �b�e�s�t� �m�a�r�k�e�t� �f�o�r� �s�e�l�l�i�n�g� �t�h�e� �l�i�v�e�s�t�o�c�k� �p�r�o�d�u�c�t�s�,� �p�r�o�d�u�c�e�d� �b�y� �t�h�e� �S�H�G� �m�e�m�b�e�r�s� �i�n� �R�a�i�n�a�-�I� �a�n�d� �I�I� �b�l�o�c�k� �o�f� �B�u�r�d�w�a�n� �d�i�s�t�r�i�c�t� �o�f� �W�e�s�t� �B�e�n�g�a�l�.� �S�o�,� �a�l�l� �t�h�e� �S�H�G� �m�e�m�b�e�r�s� �a�r�e� �s�u�g�g�e�s�t�e�d� �t�o� �s�e�l�l� �t�h�e�i�r� �p�r�o�d�u�c�t�s� �i�n� �S�e�h�e�r�a� �B�a�z�a�r� �h�a�a�t� �f�o�r� �g�e�t�t�i�n�g� �m�o�r�e� �p�r�o�f�i�t�.�
�S�p�e�c�i�a�l� �u�p� �a�n�d� �d�o�w�n� �s�h�u�t�t�l�e�s� �o�f� �l�o�r�r�y� �o�r� �b�u�s� �s�h�o�u�l�d� �b�e� �r�o�l�l�e�d� �o�n� �f�r�o�m� �e�a�c�h� �G�P� �t�o� �t�h�e� �S�e�h�e�r�a� �B�a�z�a�r� �h�a�a�t� �s�p�e�c�i�a�l�l�y� �o�n� �h�a�a�t�-�d�a�y�s�.� �I�t� �w�i�l�l� �r�e�m�o�v�e� �t�h�e� �t�r�a�n�s�p�o�r�t�a�t�i�o�n� �p�r�o�b�l�e�m� �a�n�d� �m�o�t�i�v�a�t�e� �t�h�e� �S�H�G� �m�e�m�b�e�r�s� �t�o� �s�e�l�l� �t�h�e�i�r� �p�r�o�d�u�c�t�s� �i�n� �o�r�g�a�n�i�z�e�d� �m�a�r�k�e�t�s�.� �U�l�t�i�m�a�t�e�l�y� �t�h�e� �m�a�r�k�e�t�i�n�g� �c�h�a�n�n�e�l� �w�i�l�l� �b�e� �s�h�o�r�t�e�n�e�d� �b�y� �a�v�o�i�d�i�n�g� �t�h�e� �i�n�t�e�r�m�e�d�i�a�r�i�e�s� �a�n�d� �t�h�e� �S�H�G� �m�e�m�b�e�r�s� �w�i�l�l� �g�e�t� �a� �f�a�i�r� �s�h�a�r�e� �o�f� �t�h�e� �p�r�o�f�i�t�.
�R�I�R� �b�r�e�e�d� �o�f� �p�o�u�l�t�r�y� �s�h�o�u�l�d� �b�e� �p�r�o�m�o�t�e�d� �f�o�r� �m�a�k�i�n�g� �i�t� �p�o�p�u�l�a�r� �a�n�d� �a�c�c�e�p�t�a�b�l�e� �t�o� �t�h�e� �c�u�s�t�o�m�e�r�s�.� �B�u�l�k� �s�u�p�p�l�i�e�s� �c�a�n� �b�e� �m�a�d�e� �t�o� �t�h�e� �g�o�v�e�r�n�m�e�n�t� �o�r�g�a�n�i�z�a�t�i�o�n�s�.� � �L�o�c�a�l� �f�e�s�t�i�v�a�l�s� �c�a�n� �b�e� �t�a�r�g�e�t�e�d� �f�o�r� �s�a�l�e� �t�o� �a�c�h�i�e�v�e� �m�a�s�s� �p�e�n�e�t�r�a�t�i�o�n�.� �T�h�u�s� �p�r�o�m�o�t�i�o�n� �o�f� �R�I�R� �b�r�e�e�d� �o�f� �p�o�u�l�t�r�y� �t�o� �t�h�e� �c�u�s�t�o�m�e�r�s� �t�h�o�s�e� �w�h�o� �h�a�v�e� �d�e�e�p� �p�o�c�k�e�t�s� �w�i�l�l� �i�n�c�r�e�a�s�e� �t�h�e� �s�a�l�e�s� �a�s� �w�e�l�l� �a�s� �p�r�o�f�i�t� �o�f� �t�h�e� �S�H�G� �m�e�m�b�e�r�s�.
�A�s� �t�h�e� �l�e�v�e�l� �o�f� �i�n�c�o�m�e� �i�s� �s�i�g�n�i�f�i�c�a�n�t�l�y� �r�e�l�a�t�e�d� �t�o� �t�h�e� �t�y�p�e� �o�f� �e�n�t�e�r�p�r�i�s�e�s�,� � �a� �m�i�x�e�d� �t�y�p�e� �o�f� �f�a�r�m�i�n�g� �s�h�o�u�l�d� �b�e� �p�r�a�c�t�i�c�e�d� �t�o� �g�e�t� �m�o�r�e� �r�e�t�u�r�n�s�.
�P�r�e�v�e�n�t�i�v�e� �c�a�r�e� �s�h�o�u�l�d� �b�e� �t�a�k�e�n� �d�u�r�i�n�g� �r�e�a�r�i�n�g� �o�f� �a�n�i�m�a�l�s� �t�o� �a�v�o�i�d� �d�i�s�t�r�e�s�s� �s�a�l�e�.
Unproductive animals should immediately be culled to reduce the cost of production.
Steps should be taken to make animals disease free – health care .
References:
District Committee Report on SGSY movement (2007), Published by Burdwan Zilla Parisad, Govt. of West Bengal.
Gupta, S (2007). “A silent revolution: Impact of women Self Help group program in West Bengal, Thesis of MBA in public service”, International Development Department School of Public Policy, University of Birmingham, September,2007.
Jhunjhunwala, B (2005). “Turning SHGs into sustainable business enterprises”, Hindu Business Line, Tuesday, Jul 12, 2005.
Ministry of Rural Development, Govt. of India, Annual Report, 2007
Malarvizhi, J (2005). “Self-Help Groups hone marketing skills”, Hindu Business Line, Wednesday, Oct 19, 2005.
Prakash, R and Nehru, S M, (1998). “Marketing produce through self help groups in Kerala”, ILEIA Newsletter, December 1998, Cochin 16, India.
Singh, A K (2007). “Functioning and performance of Swashakti and Shyamshiddha projects in India”, A report submitted to Planning Commission, Government of India.
Dipin, D (2008). “Evaluation of Existing Marketing Practices of Livestock Products By Self Help Groups in Raina I and II of Burdwan District”; MBA Project report, Central Library, Govind Ballabh Pant Krishi Evam Prodyogik Vishwa Vidyalaya, Pantnagar, Uttarakhand, India.
www.rural.nic.in as retrieved
"Pragyaan : JOM" Volume 7 : Issue 2, Dec 2009 30
Self Help Groups and their Marketing Practices of Livestock Products...

"Pragyaan : JOM" Volume 7 : Issue 2, Dec 2009 31
Institute of Management Studies, Dehradun
Ann
exur
e
Tota
l Var
ianc
e E
xpla
ined
by
Dif
fere
nt F
acto
rs
Com
pone
nt
Init
ial E
igen
Val
ues
E
xtra
ctio
n Su
ms
of S
quar
e Lo
adin
g
Tota
l%
of V
aria
nce
Cum
ulat
ive
%To
tal
% V
aria
nce
Cum
ulat
ive
%To
tal
% V
aria
nce
Cum
ulat
ive
%
12.
667
26.6
6926
.669
2.66
726
.669
26.6
692.
026
20.2
6520
.265
21.
601
16.0
1042
.680
1.60
116
.010
42.6
801.
999
19.9
9140
.255
31.
289
12.8
8655
.565
1.28
912
.886
55.5
651.
384
13.8
4154
.096
41.
144
11.4
3667
.002
1.14
411
.436
67.0
021.
291
12.9
0667
.002
50.
997
9.99
676
.968
60.
675
6.75
383
.021
70.
519
5.18
988
.910
80.
484
4.84
393
.753
90.
323
3.22
996
.982
100.
302
3.01
810
0.00
0
Introduction
Knowledge Management arises from many different areas, concerns multiple disciplines, is fast-changing, and has a most frustrating habit of branching off into a myriad of directions. The deeper one delves into this area the more complex it seems to become. The paper is intended to give an overview to assist LIS professionals in grasping the essence of this subject and to suggest ways in which knowledge management may continue to affect the LIS field in the near future.
Data, Information & Knowledge
Data are simple, discrete, facts and figures, such as names, characteristics, and amounts. Data might be a table of circulation statistics, but once those statistics are arranged, charted, annotated, or organized in a meaningful way to describe say trends in library use, you have information.
Core Concepts of Knowledge Management for New Generation Digital Libraries: An Analysis
ABSTRACT
The library will play a crucial role in the extension and modification of knowledge. The growing need for knowledge management has influenced every component and operation of a library. Knowledge Management requires more effective methods of information handling, speedy transfer of information and linking of information with individuals and their activities. It demands development of information systems and services and customization of information at the individual level. Libraries have been thought of as being expert at collecting and organizing published information.
This paper is intended to give an overview to assist library and information science( LIS) professionals in grasping the essence of this subject and to suggest ways in which knowledge management may continue to affect the LIS field in the near future. First, a brief overview of the origins of the field and some suggestions of why it persists in the face of numerous challenges will be provided. Development of Information Technology (IT) and its applications in Library and Information Centers, the concept of document management has been changed to information management and again the entire scenario of information management has started its change to Knowledge Management (KM). This paper mainly focuses on the concept of Knowledge Management and the role of library and information professionals in managing the knowledge and information in the digital environment. It also highlights the importance of library and information professionals in the organizations for various functions such as knowledge creation, acquisition, preservation and sharing knowledge and information.
Keywords: Data, Information, Knowledge, Knowledge management, online public access catalogue , Online resources catalogue, ICT.
Ajay Kumar Sharma* Omdeep Gupta**
Information is a bit more complex, for it organizes data for a meaningful purpose. Marc Porat states that “Information is data that has been organized and communicated”. Stehen Abram sees the process for knowledge creation and use as a continuum where data transforms into information, information transforms into knowledge and knowledge drives and undergoing behavior and decision making. Information is visible, independent from action and decision, different in format after processing, physical product, independent from existing environment, easily transferable and duplicate. Knowledge is invisible, closely related to action and decision, different in thought after processing, spiritual product, identified with existing environment, transferable through learning and not duplicate.
Knowledge is an intellectual capital when people out of creation, add value to information, it is
* Librarian, Institute of Management Studies, Dehradun.** Assistant Professor(Management), Institute of Management Studies, Dehradun.
"Pragyaan : JOM" Volume 7 : Issue 2, Dec 2009 32

generated. Knowledge is classified and modified. It may be indexing. It is shared. Sharing of knowledge is a core element of knowledge management. IT has provided with number of possible solutions for sharing via e-mail, internet etc. Knowledge is much more complex, and a working definition of it was given by Davenport and Prusak in their book on knowledge management entitled Working Knowledge. According to Davenport and Prusak, “Knowledge is a fluid mix of framed experience, values, contextual information, and expert insight that provides a framework for evaluating and incorporating new experience and information. It originates in the minds of knower. In organizations, it often becomes embedded not only in documents and repositories but also in organizational routines, processes, practices, and norms.” While data and information are in a sense bound objects, knowledge is much more a process, a dynamic, or an ability to understand and to share understanding.
Knowledge is classified into three types.
1. Explicit knowledge. 2 . Ta c i t k n ow l e d g e .3. Cultural knowledge
Explicit knowledge: It is formal and easy to communicate to others. It is the knowledge of rationality. That is, policies, rules, specifications and formulae. It is also known as declarative knowledge.
Tacit knowledge: It is complex form of knowledge. It has two dimensions namely technical and cognitive. This is personal knowledge, which is in human mind and difficult to formalize and also difficult to communicate.
Cultural knowledge: B.B.Chand describes the cultural knowledge as knowledge which includes assumptions and beliefs. It is used to understand, describe and explain the reality as well as conventions. It is also useful to form the framework among organizational members, recognize the new information and evaluate alternative interpretations and actions.
Evolution of Knowledge Management
The most current and usable definitions of KM adamantly state that it is not simply a technology (McInerney 2002; Koenig 2002; Lang 2001; St. Clair 2001; DiMattia and Oder 1997). So, while technological applications in the form of simple software programs, and more complex elaborate
systems of integrated software and hardware, are often included as part of a definition of KM, they are clearly considered to be only one component of the picture. Over time, knowledge management in organizations has come to refer to a number of integrated components. These components in successful KM programs encompass the creation, codification and application of both information and knowledge. As discussed above, information is what LIS professionals have always dealt so expertly with, those data and opinions that are captured in some fashion, primarily text, and stored for later use. Information is retrievable, storable and documented. From a KM standpoint though, the crucial distinction is that “knowledge is seen as richer than data and information” (Wright 2001). There is some uncertainty whether knowledge exists only within the one who knows, or whether it can be embedded in a process as well; the key point is that people are critical. As Blair (2002) describes it, the essential difference between data, information and knowledge [is] that when we lose data or information, we often lose something that we can physically possess, something tangible. But when we lose knowledge, what we lose is an ability to do something. Within the KM field, knowledge is often further broken down into tacit knowledge (or implicit) and explicit knowledge. The knowledge of any game say cricket would be tacit; it is lost in the attempt to express it, it resides within the knower, and is difficult or impossible to capture. Explicit knowledge is that which can be expressed and captured, at which point it becomes information. Dealing with the transition of explicit knowledge to information is a rather grey area. This results in too much of a confusion surrounding the difference between the management of information and knowledge. It is useful to note that the terms explicit
Figure 1
"Pragyaan : JOM" Volume 7 : Issue 2, Dec 2009 33
Institute of Management Studies, Dehradun
knowledge and information are often used interchangeably.
The key issue that separates KM from other similar concepts, such as information management, is the fundamental belief that people, as opposed to electronic or print materials, are essentially at the core of the development, implementation and success of KM initiatives (Blair 2002; Cheng 2001; Alavi and Tiwana 2002; Lang 2001).
So the need to deal with information persists, but is complicated by the need to also address that people carry tacit knowledge with them. Many initiatives seek to make codifying tacit knowledge a core part of any KM plan, but the recognition is prevalent that this is not always possible and that direct human contact is necessary in order for people to attempt to share some kinds of tacit knowledge effectively. Figure 1 depicts the various components or sub factors of knowledge management and their contributions.
The origins of knowledge management (KM) explain a great deal about its current condition. Prusak (2001) looks at the multi-disciplinary contributions that gave rise to an increasing interest in knowledge including the fields of economics, sociology, philosophy, and psychology, as well as information science. Core reasons for the development of a need and desire to manage knowledge are outlined by a number of researchers and writers in the field. There are several factors that are regularly described. The first of these is the shift from an industrial model of business, one where an organization's assets were primarily tangible and financial (e.g. production facilities, machinery, land and ever cheaper labor costs), to one where assets are primarily intangible and tied up in the knowledge, expertise and capacity for innovation of its people (Blair 2002; Prusak 1997; Lang 2001), software companies and KPO firms are some examples. Where once a business valued itself based on what it owned and how it controlled costs, we have moved into an era where competitive advantage is based on the creation of knowledge and its effective use. Over time the ability of a company to differentiate itself from the competition by streamlining production and reducing costs has evaporated. Now, in order to compete in a market where the gains from managing these tangible assets have shrunk, successful competing requires innovation the creation of new ways to do things through the creation of new
knowledge. For the foreseeable future, this will be the way in which corporations thrive or disappear. Another factor is the dramatic increase in the volume of information, its electronic storage, and increased access to information in general. (Nobody would have thought of 100 TB of data in 1970's) This has increased the value of knowledge, because it is only by knowledge that this information can be evaluated (Prusak 2001). This increased value of knowledge is exemplified by shifts in the LIS field. Once it was sufficient to help people find information; now, because there is so much more information and such wide access to this huge volume, both good and bad, it has become increasingly important that people know how to evaluate what they find, giving rise to new discipline such as Data Mining. Knowledge is also valued highly because it is closer to action (McInerney 2002). Information on its own does not make decisions; it is the transfer of information into people's knowledge base that leads to decision-making and thereby to action. The increase in the value of what people know, especially that which is difficult to capture or express, is a common theme in the literature (Alavi and Tiwana 2002; Wright 2001; McInerney 2002; Blair 2002; Prusak 2001).
Evolution of KM can be characterized as a movement from “collection development,” to “collection management,” to present day “knowledge management.”
The Collection Development Era: Libraries across the globe expanded rapidly in the post World War II and post sputnik era of 1950 to 1975. Major portion of time was spent on acquiring material to build collections as quickly as possible. It was the era of scouring in-print and out-of-print book vendor catalogue, clearing out the inventories of book stores, raiding foreign libraries, and international book buying trips. Print material, in the form of books, journals, and manuscripts, was pretty much the exclusive, or at least the predominant, medium for library acquisitions during this “collection development” period.
The Collection Management Era: Over the next twenty-five years, from roughly 1975 to 2000, the conditions for and nature of collection development changed. The money flowed less freely; the cost of library material, particularly the cost of journal subscriptions in science and technology, rose more quickly than library budgets; and, of course,
"Pragyaan : JOM" Volume 7 : Issue 2, Dec 2009 34
Core Concepts of Knowledge Management for New Generation Digital Libraries...

something of an information technology revolution occurred. We can characterize this period as one that emphasized “management” over “development” in the collections field of librarianship. 1979 was a banner year for the emerging collection management field. The American Library Association (ALA) first issued Guidelines for Collection Development, which began to codify the practice of collection development and management, and the two most important and influential studies of resource development and use in research libraries were published: Charles Osburn's Academic Research and Libraries Resources: Changing Patterns in America and Allen Kent's Use of Library Materials: The University of Pittsburgh Study. Essentially, what Osburn and Kent told us was that we had to pay more attention to the changing information needs and habits of American scholars and scientist as we built research library collections. In 1981, the American Library Association sponsored its first institute on collection development and management at Stanford University Collection management emerged as a more complete and balanced approach to the collections arena of librarianship. Not only did collection development officers and bibliographers select and acquire new resources, they also conducted use and user studies, prepared careful collection policies to guide their work, and they participated in preservation and cooperation to extend the life and scope of collections.
The Knowledge Management Era: At the beginning of the 21st century “knowledge Management” was largely focused on the concept and meaning of “collection.” A collection, while still vitally important to a research library, is too static and too limited a concept to fully describe the range of information resources now offered to users. As we all know by now, digital information resources offered by our libraries to our users may or may not be actually owned by or housed in our libraries. In a new information universe characterized by multiple and changing formats and by networked access, does the term “collection” really convey what research librarians do today? Are the databases and electronic texts we lease and the Internet sites we link to really our “collections”? And beyond digital surrogates for print formats online reference tools, full text electronic articles, and e-books do World Wide Web sites, preprint archives, learning objects, and the burgeoning array of unpublished digital assets being created on our campuses qualify as “collections”? This
new situation where the boundaries seemed to be expanding well beyond traditional “collections,” is the “knowledge management.”
KM in Library-Information Centers and its need for LIS professionals
As a learning organization, libraries should provide a strong leadership in knowledge management. Libraries should improve their knowledge management in all the key areas of library services. To cope with the exponential growth in human knowledge, libraries need to develop their resources, access and sharing strategies from printed to electronic and digital resources. Limited by funding, technology, staff and space, libraries must carefully analyze the needs of their users and seek to develop cooperative acquisition plans to meet the needs of users. Libraries should be developed and maintained an integrated online public access catalogue (OPAC) with both internal and external resources as well as printed and other formats of knowledge. Useful websites and knowledge sources should be regularly searched and selected from the internet and included in OPACs. In the current digital and networked knowledge age, the size of information sources on the web is growing exponentially. No one really knows exactly how many web pages are on the internet, because new web pages are added every second. Universities and research organizations are knowledge reservoirs. These highly valued intellectual assets, regardless of whether they are explicit or tacit, should be inventoried, archived, indexed, frequently updated and made accessible in digital form, Libraries should use the new approach to capture web information by cooperative efforts such as Dublin core metadata and the cooperative online resources catalogue (CORC). Other new methods such as data mining, text mining, content management, search engines, spidering programs, natural language searching, linguistic analysis, semantic networks, knowledge extraction, concept of yellow pages, and such technologies in information visualization as two dimensional or three dimensional knowledge mapping etc., have been a part of recent developments in knowledge management systems.
Blair (2002) states that successful KM requires both the ability to access stored information and the knowledge among workers to “evaluate the validity and reliability of information obtained from unfamiliar sources.” this may be an opportunity for
"Pragyaan : JOM" Volume 7 : Issue 2, Dec 2009 35
Institute of Management Studies, Dehradun
LIS professionals to implement their expertise in information literacy instruction. Other familiar territory for LIS professionals exists in the KM field as well; this includes a continuing need for expertise in information management, and high levels of support for teams engaged in innovative pursuits (Cheng 2001; St. Clair 2001). Additionally, LIS professionals bring to KM a client-focused viewpoint, where technology is important but not dominant.
The implications for the LIS profession to make a contribution in the area of content management is likely obvious to those within the profession; Koenig urges us to make sure that it is also known outside of it. He cites a 2001 conference session that detailed a highly successful KM initiative. It was later discovered that the program involved the input of a number of librarians. When asked after the presentation whether this was considered to have a significant impact on the project's success, the session presenters admitted that it had. Koenig (2002) points out that the truly remarkable part of the story is not that librarians were useful and critical staff for project success, but that the presenters chose not to mention it in the formal presentation. The LIS profession has a responsibility to market its skills to those who could make good use of them.
Importance of I.T., HRM, User Services in Knowledge Management for LIS
To facilitate the implementation of knowledge management, a well-defined and operational knowledge management system should be in place. Latest information technology should be used in the libraries. In this regard, the library director / librarian should consider himself as the chief knowledge officer of the entire organization and should work together with the chief information officer, heads of the planning department, the computer and information technology center, the human resource management department, the finance department etc., to design and develop such a system. Such knowledge management system should be built on the existing computer and information technology infrastructure including upgraded intranet, extranet, internet and available software programs to facilitate the capture, analysis, organization, storage and sharing of internal and external information resources for effective knowledge exchange among users, resource persons (faculty, researchers, subject experts etc.), publishers, government agencies, business and industries and
other organizations via multiple channels. In recent years, many of the newly developed information technology for databases and information / document management can be utilized in knowledge management such as data warehousing, data mining, text mining etc.
Library and information centers should be developed/modified based on the perfect environment for new media applications. Due to impact of globalization, economic competition and revolution of ICT, the libraries are under going a tremendous change in their environment. ICT tools and techniques, knowledge management systems, internet, web resources, digital libraries have made a significant change in the existing library systems and services. Knowledge acquisition is the starting point of knowledge management in Libraries. The application of IT, enlarges the scope of knowledge acquisition, raises knowledge acquit ion, speed and reduces knowledge acquisition cost. It is impossible to accomplish such important tasks by using man's brain only in the modern society in which the knowledge changes with each passing day.
Figure 2 Highlights data wise technologies for knowledge management.
The most important resource in the knowledge economy system is the talent that grasps knowledge. The talent competition has become the focus of market competition in the knowledge economy era. In the knowledge economy era, the libraries will attach importance to vocational training and lifelong education of library staff to raise their scientific knowledge level and ability of acquiring and innovative knowledge. They also will respect the human value, guide and bring into play wisdom potentialities of library staffs. It is an important way
"Pragyaan : JOM" Volume 7 : Issue 2, Dec 2009 36
Core Concepts of Knowledge Management for New Generation Digital Libraries...

for raising work efficiency of library staff. An all round improvement of library staff's quality and positioning of the human value will become important objectives of knowledge management in Library and Information centers. The library staff members of Universities and research committees should be inventoried, indexed regularly and be made searchable and accessible through electronic databases created and maintained by libraries. The expertise should be appreciated with appropriate rewards and incentives. As a learning organization, libraries should allocate annual funding to provide continuing education and staff training to all staff members. Knowledge must be renewed and expanded to prevent it from becoming stagnant. Libraries should also encourage the transfer of knowledge and experience from experienced staff to new staff members. A mentoring system should be in place to help new comers to learn from experienced library staff. Informal seminars, discussion sessions for staff can interact and exchange “lessons learned” “best practices” and other experiences should be scheduled at regular intervals and at convenient times sit and chat rooms can be created through intranet libraries should be attending to favorable working conditions and environment, which will contribute to better staff retention.
The utmost goal of knowledge management is to provide users with a variety of quality services in order to improve the communication, use and creation of knowledge. Information about each user can be obtained by analyzing the records of user registration, surveys, circulation and inter library loan, frequently asked reference questions and the use of e-journals and digital resources etc., User satisfaction and needs should be collected through periodical user's surveys. The findings should be used for the planning and redesign of the existing library services. Some of the manual services of the library such as “new publication alert” and “dissemination of information” should be done automatically by employing the “push technology” with great efficiency and convenience. Each library user can also set up his virtual “my library / portal” for new information / resources provided by the library.
Conclusion
KM is an emerging field, much talked about since late 1990s. The nature of knowledge and its management is difficult to estimate. Knowledge management has been regarded as strategically
important for organizations to gain a competitive advantage over their competitors, to add value to their products, to win greater satisfaction from their customers. In the library world, there is a lesson to be learned from the business world. For any library to succeed in implementing knowledge management will require a strong leadership and vision from the top administration. Information Technology and systems can provide effective support in implementing knowledge management. Libraries should work together with Information Technology Professionals and others to develop the appropriate knowledge management systems. Libraries, with limited budget and human resources, should utilize the current management structure and technology to implement KM, either bottom-up or top-down. KM will help to increase operational efficiency of our libraries to meet ever increasing needs of our clientele. It is significantly more likely that LIS professionals will move into KM initiatives while involved in more conventional roles that already exist in organizations. It is important to realize that KM is more than technical systems and software; it also refers to the requirements of receptive organizational culture and supportive upper management needed to succeed. There is an opportunity for LIS professionals to help shape the future of knowledge management, if we are willing to become members of broader organizational communities and embrace the inherent challenges in this highly complex field.
References
Blair, David C. (2002). Knowledge management: hype, hope or help? Journal of the American Society for Information Science and Technology 53(12): 101928.
Bock, Gee Woo and Young-Gul Kim.( 2002). Breaking the myths of rewards: an exploratory study of attitudes about knowledge sharing. Information resources management journal 15(2): 1421.
Branin, Joseph et all. (2000). “The Changing Nature of Collection Management in Research Libraries.” Library Resources & Technical Services 44: 23-32.
Cheng, Grace. (2001). The shifting information landscape: re-inventing the wheel or a whole new frontier for librarians. New library world 102(1160/1161): 2633.
"Pragyaan : JOM" Volume 7 : Issue 2, Dec 2009 37
Institute of Management Studies, Dehradun
Davenport,Thomas H. & Prusak, Laurence. (1998). Working knowledge: How Organizations Manage What They Know. Boston: Harvard Business School Press, 5.
Dearstyne, B.W.(2000). Greeting and shaping the future: Information professionals as strategists and leaders. Information Outlook. Aug 2000
De Long, David and Liam Fahey.( 2000). Diagnosing cultural barriers to knowledge management. The Academy of Management executive 14(4): 11327.
DiMattia, Susan and Norman Oder. 1997. Knowledge management: hope, hype or harbinger? Library journal (Sept. 15): 3335.
Drucker, Peter. (1998). “The Coming of the New Organization.” Harvard Business Review on Knowledge Management. Cambridge, MA: Harvard Business School Press.
Ellis, Kristine. 2001. Dare to share. Knowledge management 38(2): 7480.
Gold, Andrew H., Arvind Malhorta and Albert H. Segars.2001. Knowledge management: an organizational capabilities perspective. Journal of management information systems 18(1): 185214.
Hawkins, Brian L. & Battin, Patricia, eds. 1998. The Mirage of Continuity: Reconfiguring Academic
stInformation Resources for the 21 Century. Washington, D.C.: Council on Library and Information Resources and Association of American Universities, 7.
Koenig, Michael E. D. and T. Kanti Srikantaiah. (2002).The business world discovers the assets of librarianship.Information outlook 6(4): 14-18.
Lang, Josephine Chinying. (2001). Managerial Concerns in Knowledge Management. Journal of knowledge management 5(1): 4357.
McDermott, Richard and Carla O'Dell.( 2001). Overcoming cultural barriers to sharing
knowledge. Journal of knowledge management 5(1): 7685.
McInerney, Claire. (2002). Knowledge management and the dynamic nature of knowledge. Journal of the American Society for Information Science and Technology 53(12): 10091018.
Peacock, J and Middleton, M (1999). Mixed mode education: Implication for library user services. New Library World. 100(1146) 11-19pp
Prusak, L. (2001). Where did knowledge management come from? Systems journal 40(4): 10021007.
Rylatt, Alastair. (2003). Measuring know-how. T&D 57(7): 3739.
Rogers, Sally A. (2003) “Developing an Institutional Knowledge Bank at Ohio State University: From Concept to Action Plan.” portal: Libraries and the Academy, 3 (1): 125-136
Schick, Shane. (2001). KM does the job but ROI remains vague survey finds. Knowledge management 27(7):1&8.
Scwarzwalder, Robert.(1999). Librarians as knowledge management agents. Econtent (Aug./Sept.): 6365.
St. Clair, Guy. (2002). Knowledge services: your company's key to performance excellence. Informationoutlook 6(6): 26-33.
Tischelle, George. (2003). Educational advantage. Information week 930: 5758.
Udell, Jon. (2003). Trends bode well for KM. Knowledgemanagement 25(11): 3435.
Wag Yunbua(1999). Knowledge Economy and the development of the Library.
Library work and Research.1999 (6) 17-19pp.
Wilson, T. D. (2002). The Nonsense of knowledge management. Information Research 8.1, paper no.144.
"Pragyaan : JOM" Volume 7 : Issue 2, Dec 2009 38
Core Concepts of Knowledge Management for New Generation Digital Libraries...

Introduction
Hotel Industry in India has witnessed tremendous boom in recent years. Hotel Industry is inextricably linked to the tourism industry and the growth in the Indian tourism industry has fuelled the growth of Indian hotel industry. The thriving economy and increased business opportunities in India have acted as a boon for Indian hotel industry. The arrival of low cost airlines and the associated price wars have given domestic tourists a host of options. The 'Incredible India' destination campaign and the recently launched 'Atithi Devo Bhavah' (ADB) campaign have also helped in the growth of domestic and international tourism and consequently the hotel industry.
In recent years, government has taken several steps to boost travel & tourism which have benefitted the hotel industry in India. These include the abolishment of the inland air travel tax of 15%; reduction in excise duty on aviation turbine fuel to 8%; and removal of a number of restrictions on outbound chartered flights, including those relating to frequency and size of aircraft. The government's recent decision to treat convention centers as part of core infrastructure, allowing the government to provide critical funding for the large capital investment that may be required has also fuelled the demand for hotel rooms.
The opening up of the aviation industry in
Employee's Perception towards Service Climate - Hotel Industry in India: An Empirical Study
*Reader, Gandhigram University, Dindugul.**Assistant Professor, King Saud University, Saudi Arabia. ***Assistant Professor, Saranathan Engineering College, Trichy.
Dr. B.Tamil Mani* Dr. K. Ravichandran**
Mr. Arun Kumar***
ABSTRACT
The purpose of the study is to examine the perception of employees about the service climate in various dimensions like service leadership, service encounter, service systems, human resource management, customer satisfaction, etc in hotel industry (Tamilnadu). It suggests that hotel industry must take steps to improve the employee morale in order to enhance the value of the employee, designing an effective service performance linked compensation system and also it should provide customer focused training and development program to develop the service quality.
Keywords: Hotel Industry , Employee's perception , Service Climate
India has provided exciting opportunities for hotel industry as it relies on airlines to transport 80% of international arrivals. The government's decision to substantially upgrade 28 regional airports in smaller towns, and the privatization & expansion of Delhi and Mumbai airport will improve the business prospects of hotel industry in India. Substantial investments in tourism infrastructure are essential for Indian hotel industry to achieve its potential. The upgrading of national highways connecting various parts of India has opened new avenues for the development of budget hotels in India. Taking advantage of this opportunity Tata group and another hotel chain called 'Homotel' have entered this business segment.
According to a report, demand exceeds supply in the Hotel Industry in India. Five-star hotels in metro cities allot same room, more than once a day to different guests, receiving almost 24-hour rates from both guests against 6 -8 hours usage. With demand-supply disparity, hotel rates in India are likely to rise by 25% annually. This will affect the competitiveness of India as a cost-effective tourist destination. The hotel industry in India is at $17 billion (Rs 87,601 crore) currently. Thirty per cent of the sector is organised. An additional 20 international brands are expected to come to India in the next two years. About $12 billion (Rs 61,836 crore) is the expected investment in this sector by 2011. Within the sector that is organised, the 5-star hotel segment contributes 58 per cent.
"Pragyaan : JOM" Volume 7 : Issue 2, Dec 2009 39
Hotel industry in Tamil Nadu
Tamil Nadu is a flourishing state both in terms of economy and tourism and draws scores of tourists round the year. The things to watch in Tamil Nadu are almost endless and whether you are an adventure lover or a pilgrim, this amazing state has a lot in store for its visitors. Here, you can come across beautiful beaches, wildlife sanctuaries, historic landmarks, monuments and grand festivals. Almost all the important tourist destinations of Tamil Nadu offer a range of fine lodging facilities to itstourists depending on their interest and preferences. You can select from the five star to the three star or the budget category of the Tamil Nadu hotels.
Chennai, the capital city, offers top-notch accommodation facilities to its visitors. The city has some of the finest five star hotels that offer world-class facilities and are acclaimed for their high standard of facilities and services coupled with traditional south Indian hospitality. The five star hotels have lavishly done up guestrooms with guest amenities such as speakerphones with international direct dialing facility, Internet connectivity, mini-bar, personal safe, channel music and colour television with satellite programs.
The accommodations in Tamil Nadu are also ideal for the business guests as they provide the facilities for business centre and conferencing with state-of-the-art audio-visual facilities. Le Royal Meredien and Park Sheraton & Towers in Chennai, The Carlton Hotel in Kodaikanal and Taj Garden Retreat in Coonoor are some of the notable ones.
The three star hotels in Tamil Nadu also occupy an important place in the hospitality industry of the state and ensure a rewarding stay. These hotels are also strategically located and are ideal for the tourists who want a mix of economic tariffs and luxury. The services and facilities extended by these hotels include 24 hours room services, satellite channels, direct dialing telephones with STD/ISD, safe deposit locker, money exchange, laundry, travel desk, doctor on call, round the clock hot/cold water supply, and multi-cuisine restaurant. Holiday Inn Gem Park and Hotel Sinclairs in Ooty, Hotel Singaar International in Kanyakumari, Madurai Ashok and Madura Park Inn in Madurai are some of the noteworthy ones from this category.
There is another important category among the Tamil Nadu hotels and it is the budget hotels. These
hotels are located in the key tourist destinations of Tamil Nadu and are perfect for those who are travelling on a shoe stringed budget and cannot afford the luxury of the five and four star hotels. These hotels have carved a niche in the entire hotel industry of Tamil Nadu and are especially acknowledged for their unmatched services and comprehensive range of facilities.
Review of Literature:
According to Schneider et al., 1998 Service climate is defined as “the shared perceptions of employees concerning the practices, procedures, and kinds of behaviours' that get rewarded and supported with respect to customer service and service quality”. Much service climate research has attempted to identify antecedents of a positive service climate in service Hotels. This exists when employees' perceive that management regards quality service as important, and supports and rewards employees who deliver such service (Schneider et al., 1998). A number of key prerequisites for a positive service climate have been proposed in the literature. These include mutual support among departments and colleagues and facilitative conditions such as sharing information with staff, providing feedback, appropriate manager behaviours, training, and the removal of obstacles to the provision of excellent service. A measure of service climate quality would be based on employees' perceptions of how elements such as these were operationalised as practices or behaviours resulting in the delivery of superior service.
Service climate can be investigated in terms of global service climate (GSC), or its dimensions. GSC is distinguished from the dimensions of service climate by drawing on the explanation and scale development work of Schneider et al. (1998, p. 153). They describe global service climate (GSC) as a “summary measure of the Hotels's climate for service” and state that GSC is “not a composite of the three scales” (discussed below), but rather “it is its own distinct scale designed to tap the 'molar' aspect of service climate”.
Figure 1 Dimensions of Service Climate
"Pragyaan : JOM" Volume 7 : Issue 2, Dec 2009 40
Employee's Perception towards Service Climate - Hotel Industry in India...

Health.
Gronroos (1984) divided service quality in to three components
Technical
Functional
Image.
Research Methodology:
The primary objective of the study is to find out the employees perception towards the service climate. The entire 3, 4 & 5 star hotels in 4 major cities (Chennai, Coimbatore, Madurai, Tiruchirapalli) were taken into consideration and the top 50 hotels in each city has been taken into consideration.
In sampling design convenient sampling methodology is chosen by the researcher to identify the samples. 5 frontline employees (Front Office, House Keeping, Food& Beverage and Production) from each hotel were considered for the study to a total of 250. A structured questionnaire which has been validated (a = 0.896) has been used to collect the data from the respondents. The researcher has used SPSS 13.5 version to analyze the data.
Empirical findings:
From the Demographic profile analysis of the respondents, it is found that about 42% of respondents were in the age group of 21-25 and 89% of respondents are male. About 59% of respondents are unmarried and 57 % of respondents are under graduates. About 35% of respondents are in Housekeeping department and 51% of respondents are having the work experience of only 3 to 5 years.
Employees' responses to service climate are presented in Table 1. It reveals that the focus on all the parameters impacting quality of services (such as service leadership, service systems, human resource management and customer satisfaction) is only moderate and could be rates as below average. This suggests that a substantial improvement is required in services climate to improve quality of service in hotel industry.
One Way ANOVA using Post Hoc Multiple Comparisons Bonferroni test reveals that there is significant difference between age groups and internal service quality where the mean difference is significant
�L�e�w�i�n� �(�1�9�5�1�)� �h�a�s� �d�e�s�c�r�i�b�e�d� �b�y� �m�e�a�n�s� �o�f� �p�s�y�c�h�o�l�o�g�i�c�a�l� �c�l�i�m�a�t�e� �m�o�d�e�l� �t�h�a�t� � �c�l�i�m�a�t�e �� �w�a�s� �a�n� �e�s�s�e�n�t�i�a�l� �f�u�n�c�t�i�o�n�a�l� �l�i�n�k� �b�e�t�w�e�e�n� �t�h�e� �p�e�o�p�l�e� �a�n�d� �t�h�e� �e�n�v�i�r�o�n�m�e�n�t� �a�n�d� �s�t�a�t�e�d� �t�h�a�t� �p�s�y�c�h�o�l�o�g�i�c�a�l� �c�l�i�m�a�t�e�s� �w�e�r�e� � �s�c�i�e�n�t�i�f�i�c�a�l�l�y� �d�e�s�c�r�i�b�a�b�l�e� �f�a�c�t�s ��.� �R�o�g�g� �e�t� �a�l�.� �(�2�0�0�1�)� �f�o�u�n�d� �t�h�a�t� �s�e�r�v�i�c�e� �c�l�i�m�a�t�e� �m�e�d�i�a�t�e�s� �t�h�e� �r�e�l�a�t�i�o�n�s�h�i�p� �b�e�t�w�e�e�n� �h�u�m�a�n� �r�e�s�o�u�r�c�e� �p�r�a�c�t�i�c�e�s� �a�n�d� �c�u�s�t�o�m�e�r� �s�a�t�i�s�f�a�c�t�i�o�n� �i�n� �s�m�a�l�l� �b�u�s�i�n�e�s�s� �f�r�a�n�c�h�i�s�e�s� �b�u�t� �h�a�s� �n�o� �d�i�r�e�c�t� �e�f�f�e�c�t�s� �o�n� �c�u�s�t�o�m�e�r� �s�a�t�i�s�f�a�c�t�i�o�n�.� �A�c�c�o�r�d�i�n�g� �t�o� �G�l�i�c�k� �(�1�9�8�5�)�,� �c�l�i�m�a�t�e� �c�a�n�n�o�t� �b�e� �s�a�i�d� �t�o� �e�x�i�s�t� �i�n� �a�n� �H�o�t�e�l� �u�n�l�e�s�s� �t�h�e�r�e� �i�s� �e�m�p�l�o�y�e�e� �c�o�n�s�e�n�s�u�s� �o�f� �a�n� �a�c�c�e�p�t�a�b�l�e� �l�e�v�e�l� �o�n� �c�l�i�m�a�t�e� �p�e�r�c�e�p�t�i�o�n�s�.
�G�u�i�o�n� �(�1�9�7�3�)� �a�r�g�u�e�d� �t�h�a�t� �a� �p�e�r�c�e�i�v�e�d� �c�l�i�m�a�t�e� �c�o�n�c�e�r�n�e�d� �b�o�t�h� �t�h�e� �a�t�t�r�i�b�u�t�e�s� �o�f� �a�n� �H�o�t�e�l� �a�n�d� �t�h�o�s�e� �o�f� �t�h�e� �p�e�r�c�e�i�v�i�n�g� �i�n�d�i�v�i�d�u�a�l�.�
�J�a �m�e�s � �a �n�d� �J�o �n�e�s � �( �1�9�7�4�) � �s �u�g�g�e�s �t �e �d� �t �h�e� �p�s�y�c�h�o�l�o�g�i�c�a�l� �c�l�i�m�a�t�e� �b�e� �u�s�e�d� �t�o� �e�m�p�h�a�s�i�s�e� �t�h�e� �f�a�c�t� �t�h�a�t� �i�t� �i�s� �t�h�e� �a�g�g�r�e�g�a�t�e�d� �c�o�g�n�i�t�i�v�e� �i�n�t�e�r�p�r�e�t�a�t�i�o�n�s� �o�f� �a�n� �H�o�t�e�l�s�a�l� �w�o�r�k�f�o�r�c�e� �w�h�i�c�h� �a�r�i�s�e� �f�r�o�m� �e�x�p�e�r�i�e�n�c�e� �i�n� �t�h�e� �H�o�t�e�l�s� �a�n�d� �p�r�o�v�i�d�e� �a� �r�e�p�r�e�s�e�n�t�a�t�i�o�n� �o�f� �t�h�e� �m�e�a�n�i�n�g� �i�n�h�e�r�e�n�t� �i�n� �t�h�e� �H�o�t�e�l�s�a�l� �f�e�a�t�u�r�e�s�,� �e�v�e�n�t�s� �a�n�d� �p�r�o�c�e�s�s� �(�S�c�h�n�e�i �d�e�r�, � �1�9�8�3�;� �K�o�z�l �o�w�s�k�i� �a�n�d� �F�a�r�r�. �1�9�8�8�)�. � �H�o�s�p�i�t�a�l�i�t�y� �i�n�d�u�s�t�r�y� �i�s� �o�n�e� �o�f� �t�h�e� �l�a�r�g�e�s�t� �s�e�r�v�i�c�e� �s�e�c�t�o�r�s� �t�h�a�t� �h�a�s� �e�x�p�e�r�i�e�n�c�e�d� �e�x�t�e�n�s�i�v�e� �i�n�f�o�r�m�a�t�i�o�n� �s�u�r�p�l�u�s� �i�n� �t�h�e� �m�a�r�k�e�t�p�l�a�c�e� �t�o�g�e�t�h�e�r� �w�i�t�h� �i�n�c�r�e�a�s�e�d� �c�o�m�p�e�t�i�t�i�o�n�.� �H�o�p�i�t�a�l�i�t�y� �i�n� �t�h�i�s� �s�e�n�s�e� �i�s� �d�e�s�c�r�i�b�e�d� �b�y� �K�o�t�l�e�r�,� �B�o�w�e�n� �a�n�d� �m�a�k�e�n�s� �(�1�9�9�6�)� �a�s� �� �t�h�o�s�e� �b�u�s�i�n�e�s�s�e�s� �t�h�a�t� �p�r�o�v�i�d�e� �o�n�e� �o�r� �m�o�r�e� �o�f� �t�h�e� �f�o�l�l�o�w�i�n�g�:
�A�c�c�o�m�m�o�d�a�t�i�o�n�.
�F�o�o�d� �a�n�d� �b�e�v�e�r�a�g�e�s�.
�E�n�t�e�r�t�a�i�n�m�e�n�t�.
�Z�e�i�t�h�a�m�l� �a�n�d� �B�i�t�n�e�r� �(�2�0�0�0�)� �s�t�a�t�e�d� �t�h�a�t� �r�e�l�i�a�b�i�l�i�t�y� �h�a�s� �b�e�e�n� �c�o�n�s�i�s�t�e�n�t�l�y� �s�h�o�w�n� �t�o� �b�e� �t�h�e� �m�o�s�t� �i�m�p�o�r�t�a�n�t� �d�i�m�e�n�s�i�o�n� �i�n� �s�e�r�v�i�c�e� �q�u�a�l�i�t�y�.� �Q�u�i�n�n� �e�t� �a�l� �(�1�9�8�7�)�,� �i�n� �a� �d�e�f�i�n�i�t�i�o�n� �a�l�s�o� �a�d�o�p�t�e�d� �b�y� �Z�e�i�t�h�a�m�l� �a�n�d� �B�i�t�n�e�r� �(�1�9�9�6�)�, � �d�e�s�c�r�i�b�e�d� �s�e�r�v�i�c�e�s� �a�s� �i�n�c�l�u�d�i�n�g� �:� �� �a�l�l� �e�c�o�n�o�m�i�c� �a�c�t�i�v�i�t�i�e�s� �w�h�o�s�e� �o�u�t�p�u�t� �i�s � �n�o�t� �a � �p�h�y�s�i�c�a�l� �p�r�o�d�u�c�t� �o�r� �c�o�n�s�t�r�u�c�t�i�o�n�,� �i�s� �g�e�n�e�r�a�l�l�y� �c�o�n�s�u�m�e�d� �a�t� �t�h�e� �t�i�m�e� �i�t� �i�s� �p�r�o�d�u�c�e�d�,� �a�n�d� �p�r�o�v�i�d�e�s� �a�d�d�e�d� �v�a�l�u�e� �i�n� �f�o�r�m�s� �t�h�a�t� �a�r�e� �e�s�s�e�n�t�i�a�l�l�y� �i�n�t�a�n�g�i�b�l�e� �o�f� �i�t�s� �f�i�r�s�t� �p�u�r�c�h�a�s�e�r�.� �S�u�c�h� �a�s
�C�o�n�v�e�n�i�e�n�c�e�,�
�A�m�u�s�e�m�e�n�t�,�
�T�i�m�e�l�i�n�e�s�s�,�
�C�o�m�f�o�r�t�,� �o�r�
"Pragyaan : JOM" Volume 7 : Issue 2, Dec 2009 41
Institute of Management Studies, Dehradun
at the 0.05 level, similarly age groups and customer loyalty & profit, work experience and customer loyalty & profit, work experience and understanding the specific needs of customers are found to be positively associated.
There is significant difference between work experience and delivering high quality service, age and customer satisfaction through their service performance, age and needs of customer, age and great job of the employee, educational qualification and customer satisfaction, lastly educational qualification and effectiveness of cutting edge technology.
Chi-Square test reveals, there is a significant association between educational qualification and delivering product on time. Similarly, marital status and customer loyalty & profit, work experience and system design, work experience and human relations skills, finally work experience and delivering high quality service are all significantly associated.
Correlation analysis highlights that the two variables: internal service quality and delivering high quality service are linearly related with positive relationship. Similarly, clear and effective vision and
Table 1. Perception of employees towards Service climate
(All in %)F1- Service Leadership 1 2 3 4 5
1. Management setting the example and providing excellent service 2 28 69 1 0internally (Internal service Quality)
2. Clear and effective articulation of the vision for service excellence 0 39 61 0 0has been taught to the employees
F2. Service Encounter3. Our ability to enhance customer satisfaction through quality 12 34 51 3 0
service4. The Hotel builds positive customer perceptions of service, enhance 7 43 50 0 0
customer satisfaction, loyalty and profits
5. I have the responsibility and the authority to meet customer needs and 10 26 64 0 0to please customers.
F3. Service Systems6. My Hotel organization systems designed to prevent failure 2 28 56 12 27. My Hotel systems respond to failure immediately and able to 3 14 67 15 1
avoid double disappointment8. We as employees use cutting edge technology designed to 5 33 49 13 0
enhance service quality9. Service standards are communicated and understood by all the 10 35 35 17 3
employees of the HotelF4. Human Resource Management10 Human relations skills are emphasized in the organization 8 31 51 2 511 Investment is made into training and developing the workforce 3 22 48 20 712 The employer link service performance and compensation 5 21 45 21 813 The employer link between reward for service and customer 0 21 45 27 7
Satisfaction
F5- Customer Satisfaction14 We understand the specific needs of our customers. 17 33 49 1 0
15 We are focused on delivering high-quality products/services. 12 52 36 0 0
16 Our products/services meet our customers' expectations. 15 21 63 1 017 We deliver product and service on time 16 28 36 19 118 Customers regularly tell us that we are doing a great job 16 22 61 1 019 The overall service climate of the organization is good 14 40 45 1 0
"Pragyaan : JOM" Volume 7 : Issue 2, Dec 2009 42
Employee's Perception towards Service Climate - Hotel Industry in India...

Health.
Gronroos (1984) divided service quality in to three components
Technical
Functional
Image.
Research Methodology:
The primary objective of the study is to find out the employees perception towards the service climate. The entire 3, 4 & 5 star hotels in 4 major cities (Chennai, Coimbatore, Madurai, Tiruchirapalli) were taken into consideration and the top 50 hotels in each city has been taken into consideration.
In sampling design convenient sampling methodology is chosen by the researcher to identify the samples. 5 frontline employees (Front Office, House Keeping, Food& Beverage and Production) from each hotel were considered for the study to a total of 250. A structured questionnaire which has been validated (a = 0.896) has been used to collect the data from the respondents. The researcher has used SPSS 13.5 version to analyze the data.
Empirical findings:
From the Demographic profile analysis of the respondents, it is found that about 42% of respondents were in the age group of 21-25 and 89% of respondents are male. About 59% of respondents are unmarried and 57 % of respondents are under graduates. About 35% of respondents are in Housekeeping department and 51% of respondents are having the work experience of only 3 to 5 years.
Employees' responses to service climate are presented in Table 1. It reveals that the focus on all the parameters impacting quality of services (such as service leadership, service systems, human resource management and customer satisfaction) is only moderate and could be rates as below average. This suggests that a substantial improvement is required in services climate to improve quality of service in hotel industry.
One Way ANOVA using Post Hoc Multiple Comparisons Bonferroni test reveals that there is significant difference between age groups and internal service quality where the mean difference is significant
�L�e�w�i�n� �(�1�9�5�1�)� �h�a�s� �d�e�s�c�r�i�b�e�d� �b�y� �m�e�a�n�s� �o�f� �p�s�y�c�h�o�l�o�g�i�c�a�l� �c�l�i�m�a�t�e� �m�o�d�e�l� �t�h�a�t� � �c�l�i�m�a�t�e �� �w�a�s� �a�n� �e�s�s�e�n�t�i�a�l� �f�u�n�c�t�i�o�n�a�l� �l�i�n�k� �b�e�t�w�e�e�n� �t�h�e� �p�e�o�p�l�e� �a�n�d� �t�h�e� �e�n�v�i�r�o�n�m�e�n�t� �a�n�d� �s�t�a�t�e�d� �t�h�a�t� �p�s�y�c�h�o�l�o�g�i�c�a�l� �c�l�i�m�a�t�e�s� �w�e�r�e� � �s�c�i�e�n�t�i�f�i�c�a�l�l�y� �d�e�s�c�r�i�b�a�b�l�e� �f�a�c�t�s ��.� �R�o�g�g� �e�t� �a�l�.� �(�2�0�0�1�)� �f�o�u�n�d� �t�h�a�t� �s�e�r�v�i�c�e� �c�l�i�m�a�t�e� �m�e�d�i�a�t�e�s� �t�h�e� �r�e�l�a�t�i�o�n�s�h�i�p� �b�e�t�w�e�e�n� �h�u�m�a�n� �r�e�s�o�u�r�c�e� �p�r�a�c�t�i�c�e�s� �a�n�d� �c�u�s�t�o�m�e�r� �s�a�t�i�s�f�a�c�t�i�o�n� �i�n� �s�m�a�l�l� �b�u�s�i�n�e�s�s� �f�r�a�n�c�h�i�s�e�s� �b�u�t� �h�a�s� �n�o� �d�i�r�e�c�t� �e�f�f�e�c�t�s� �o�n� �c�u�s�t�o�m�e�r� �s�a�t�i�s�f�a�c�t�i�o�n�.� �A�c�c�o�r�d�i�n�g� �t�o� �G�l�i�c�k� �(�1�9�8�5�)�,� �c�l�i�m�a�t�e� �c�a�n�n�o�t� �b�e� �s�a�i�d� �t�o� �e�x�i�s�t� �i�n� �a�n� �H�o�t�e�l� �u�n�l�e�s�s� �t�h�e�r�e� �i�s� �e�m�p�l�o�y�e�e� �c�o�n�s�e�n�s�u�s� �o�f� �a�n� �a�c�c�e�p�t�a�b�l�e� �l�e�v�e�l� �o�n� �c�l�i�m�a�t�e� �p�e�r�c�e�p�t�i�o�n�s�.
�G�u�i�o�n� �(�1�9�7�3�)� �a�r�g�u�e�d� �t�h�a�t� �a� �p�e�r�c�e�i�v�e�d� �c�l�i�m�a�t�e� �c�o�n�c�e�r�n�e�d� �b�o�t�h� �t�h�e� �a�t�t�r�i�b�u�t�e�s� �o�f� �a�n� �H�o�t�e�l� �a�n�d� �t�h�o�s�e� �o�f� �t�h�e� �p�e�r�c�e�i�v�i�n�g� �i�n�d�i�v�i�d�u�a�l�.�
�J�a �m�e�s � �a �n�d� �J�o �n�e�s � �( �1�9�7�4�) � �s �u�g�g�e�s �t �e �d� �t �h�e� �p�s�y�c�h�o�l�o�g�i�c�a�l� �c�l�i�m�a�t�e� �b�e� �u�s�e�d� �t�o� �e�m�p�h�a�s�i�s�e� �t�h�e� �f�a�c�t� �t�h�a�t� �i�t� �i�s� �t�h�e� �a�g�g�r�e�g�a�t�e�d� �c�o�g�n�i�t�i�v�e� �i�n�t�e�r�p�r�e�t�a�t�i�o�n�s� �o�f� �a�n� �H�o�t�e�l�s�a�l� �w�o�r�k�f�o�r�c�e� �w�h�i�c�h� �a�r�i�s�e� �f�r�o�m� �e�x�p�e�r�i�e�n�c�e� �i�n� �t�h�e� �H�o�t�e�l�s� �a�n�d� �p�r�o�v�i�d�e� �a� �r�e�p�r�e�s�e�n�t�a�t�i�o�n� �o�f� �t�h�e� �m�e�a�n�i�n�g� �i�n�h�e�r�e�n�t� �i�n� �t�h�e� �H�o�t�e�l�s�a�l� �f�e�a�t�u�r�e�s�,� �e�v�e�n�t�s� �a�n�d� �p�r�o�c�e�s�s� �(�S�c�h�n�e�i �d�e�r�, � �1�9�8�3�;� �K�o�z�l �o�w�s�k�i� �a�n�d� �F�a�r�r�. �1�9�8�8�)�. � �H�o�s�p�i�t�a�l�i�t�y� �i�n�d�u�s�t�r�y� �i�s� �o�n�e� �o�f� �t�h�e� �l�a�r�g�e�s�t� �s�e�r�v�i�c�e� �s�e�c�t�o�r�s� �t�h�a�t� �h�a�s� �e�x�p�e�r�i�e�n�c�e�d� �e�x�t�e�n�s�i�v�e� �i�n�f�o�r�m�a�t�i�o�n� �s�u�r�p�l�u�s� �i�n� �t�h�e� �m�a�r�k�e�t�p�l�a�c�e� �t�o�g�e�t�h�e�r� �w�i�t�h� �i�n�c�r�e�a�s�e�d� �c�o�m�p�e�t�i�t�i�o�n�.� �H�o�p�i�t�a�l�i�t�y� �i�n� �t�h�i�s� �s�e�n�s�e� �i�s� �d�e�s�c�r�i�b�e�d� �b�y� �K�o�t�l�e�r�,� �B�o�w�e�n� �a�n�d� �m�a�k�e�n�s� �(�1�9�9�6�)� �a�s� �� �t�h�o�s�e� �b�u�s�i�n�e�s�s�e�s� �t�h�a�t� �p�r�o�v�i�d�e� �o�n�e� �o�r� �m�o�r�e� �o�f� �t�h�e� �f�o�l�l�o�w�i�n�g�:
�A�c�c�o�m�m�o�d�a�t�i�o�n�.
�F�o�o�d� �a�n�d� �b�e�v�e�r�a�g�e�s�.
�E�n�t�e�r�t�a�i�n�m�e�n�t�.
�Z�e�i�t�h�a�m�l� �a�n�d� �B�i�t�n�e�r� �(�2�0�0�0�)� �s�t�a�t�e�d� �t�h�a�t� �r�e�l�i�a�b�i�l�i�t�y� �h�a�s� �b�e�e�n� �c�o�n�s�i�s�t�e�n�t�l�y� �s�h�o�w�n� �t�o� �b�e� �t�h�e� �m�o�s�t� �i�m�p�o�r�t�a�n�t� �d�i�m�e�n�s�i�o�n� �i�n� �s�e�r�v�i�c�e� �q�u�a�l�i�t�y�.� �Q�u�i�n�n� �e�t� �a�l� �(�1�9�8�7�)�,� �i�n� �a� �d�e�f�i�n�i�t�i�o�n� �a�l�s�o� �a�d�o�p�t�e�d� �b�y� �Z�e�i�t�h�a�m�l� �a�n�d� �B�i�t�n�e�r� �(�1�9�9�6�)�, � �d�e�s�c�r�i�b�e�d� �s�e�r�v�i�c�e�s� �a�s� �i�n�c�l�u�d�i�n�g� �:� �� �a�l�l� �e�c�o�n�o�m�i�c� �a�c�t�i�v�i�t�i�e�s� �w�h�o�s�e� �o�u�t�p�u�t� �i�s� �n�o�t� �a� �p�h�y�s�i�c�a�l� �p�r�o�d�u�c�t� �o�r� �c�o�n�s�t�r�u�c�t�i�o�n�,� �i�s� �g�e�n�e�r�a�l�l�y� �c�o�n�s�u�m�e�d� �a�t� �t�h�e� �t�i�m�e� �i�t� �i�s� �p�r�o�d�u�c�e�d�,� �a�n�d� �p�r�o�v�i�d�e�s� �a�d�d�e�d� �v�a�l�u�e� �i�n� �f�o�r�m�s� �t�h�a�t� �a�r�e� �e�s�s�e�n�t�i�a�l�l�y� �i�n�t�a�n�g�i�b�l�e� �o�f� �i�t�s� �f�i�r�s�t� �p�u�r�c�h�a�s�e�r�.� �S�u�c�h� �a�s
�C�o�n�v�e�n�i�e�n�c�e�,�
�A�m�u�s�e�m�e�n�t�,�
�T�i�m�e�l�i�n�e�s�s�,�
�C�o�m�f�o�r�t�,� �o�r�
"Pragyaan : JOM" Volume 7 : Issue 2, Dec 2009 41
Institute of Management Studies, Dehradun
at the 0.05 level, similarly age groups and customer loyalty & profit, work experience and customer loyalty & profit, work experience and understanding the specific needs of customers are found to be positively associated.
There is significant difference between work experience and delivering high quality service, age and customer satisfaction through their service performance, age and needs of customer, age and great job of the employee, educational qualification and customer satisfaction, lastly educational qualification and effectiveness of cutting edge technology.
Chi-Square test reveals, there is a significant association between educational qualification and delivering product on time. Similarly, marital status and customer loyalty & profit, work experience and system design, work experience and human relations skills, finally work experience and delivering high quality service are all significantly associated.
Correlation analysis highlights that the two variables: internal service quality and delivering high quality service are linearly related with positive relationship. Similarly, clear and effective vision and
Table 1. Perception of employees towards Service climate
(All in %)F1- Service Leadership 1 2 3 4 5
1. Management setting the example and providing excellent service 2 28 69 1 0internally (Internal service Quality)
2. Clear and effective articulation of the vision for service excellence 0 39 61 0 0has been taught to the employees
F2. Service Encounter3. Our ability to enhance customer satisfaction through quality 12 34 51 3 0
service4. The Hotel builds positive customer perceptions of service, enhance 7 43 50 0 0
customer satisfaction, loyalty and profits
5. I have the responsibility and the authority to meet customer needs and 10 26 64 0 0to please customers.
F3. Service Systems6. My Hotel organization systems designed to prevent failure 2 28 56 12 27. My Hotel systems respond to failure immediately and able to 3 14 67 15 1
avoid double disappointment8. We as employees use cutting edge technology designed to 5 33 49 13 0
enhance service quality9. Service standards are communicated and understood by all the 10 35 35 17 3
employees of the HotelF4. Human Resource Management10 Human relations skills are emphasized in the organization 8 31 51 2 511 Investment is made into training and developing the workforce 3 22 48 20 712 The employer link service performance and compensation 5 21 45 21 813 The employer link between reward for service and customer 0 21 45 27 7
Satisfaction
F5- Customer Satisfaction14 We understand the specific needs of our customers. 17 33 49 1 0
15 We are focused on delivering high-quality products/services. 12 52 36 0 0
16 Our products/services meet our customers' expectations. 15 21 63 1 017 We deliver product and service on time 16 28 36 19 118 Customers regularly tell us that we are doing a great job 16 22 61 1 019 The overall service climate of the organization is good 14 40 45 1 0
"Pragyaan : JOM" Volume 7 : Issue 2, Dec 2009 42
Employee's Perception towards Service Climate - Hotel Industry in India...

service standards, responsibility and needs of customer, Customer loyalty & profit and Cutting edge technology, Customer satisfaction and Customer expectation, Training & development and Avoidance of failure & disappointment in the organisation, and Delivering products on time and Reward for service are linearly related. Hence a change in one factor will affect the other.
Conclusion
From this study, it follows that the service system needs attention on various factors such as : organisation systems designed to provide quality servies, failure handling system, use of cutting edge technology and communication of service standards to employees. Service managers need to design a service recovery strategy that reflects the context of the situation. Since the current industry practices do not “bond” the customer to the service provider, doing it right the first time would the optimum strategy for the hotel industry.
The compensation strategies should be effective. All the employees should be aware of the organizational goals and objectives. The methods used for evaluating employees' performance should be fair enough and easy to understand. The performance standards established should be achievable. Deserving employees should receive significant rewards. There should always be scope for improvements. Employees' performance should be evaluated on the basis of their productivity linked with service quality and customer satisfaction. Incentives account for employees' high productivity. Today's workforce believes in performance based pay, thus incentives will help to motivate them to produce more. In the hotel industry, it is the incentive that accounts for the overall package of the employee. In today's strategic compensation systems, incentives form an integral part of the performance based compensation packages. It is a challenge for hotel management to formulate strategies to maintain internal equity and external equity and provide the most competitive compensation packages to attract and retain the talented empathetic workforce. So developing effective incentive programs must be a part of management strategy to enhance service quality and customer satisfaction. Hence, Human resource Department needs to educate, train and develop the work force to achieve this optimum strategy by inculcating the sole practice of empowerment,
continuous improvement and self-realization of employees on sustained service quality enhancement which promotes positive service climate.
References:
Schnider, B. (1990), “The climate for service: an application of the climate construct”, in Schneider, B. (Ed.)
Schnider, B. and Bowen, D.E. (1993),”The service Hotels human resource management is crucial”, Hotelsal Dynamics, Vol. 21.
Borucki, C.C. and Burke, M.J. (1999), “An examination of service-related antecedents to retail store performance”, Journal of Hotels Behaviour, Vol.20.
Jones, A.P. and James, L.R.(1979),”Psychological climate: Dimensions and relationships of individual and aggregated work environment perceptions”, Hotelsal Behavior and Human Performance, Vol. 23.
Burke, M.J., Borucki, C.C. nd Hurley, A.E. (1992),”Reconceptualizing psychology climate in a retail service environment: a multiple-stakeholders perspective”, Journal of Applied Psychology, Vol. 12.
Parasuraman, A., Zeithaml, V.A. and Berry, L.L. (1985),”A conceptual model of service quality and its implications for future research”, Journal of Marketing, Vol. 49.
Schnider, B., Wheeler,J.K. and Cox, J.F. (1992),”Climate strength: a new direction for climate research”, Journal of Applied Psychology, Vol. 87.
Schnider, B., White, S.S. and Paul, M.C. (1998),”Linking service climate and customer perceptions of service quality:test of a casual model”, Journal of Applied Psychology, Vol. 83.
Davidson, M.C.G., Manning, M., Timo, N. and Ryder, P. (2001),”The Dimensions of Hotelsal climate in four and five Australian hotels”, Journal of Hospitality and Tourism Research, Vol. 25.
Denison, D.R.(1996),”What is the difference between Hotelsal culture and Hotelsal climate? A native's point of view on a decade of paradigm
"Pragyaan : JOM" Volume 7 : Issue 2, Dec 2009 43
Institute of Management Studies, Dehradun
wars”, Academy of Management Review, 21.
Rogg, K.L., Schmidt, D.B., Shull, C. and Schmitt, N. (2001), “Human resource practices, Hotelsal climate and customer satisfaction”, Journal of Management, Vol. 27.
Schlesinger, L.A. and Zornitsky, J. (1991), “Job satisfaction, service capability and customer satisfaction: an examination of linkages and management implications”, Human Resource Planning, Vol. 14.
Yagil, D. and Gal, I. (2002),”The role of Hotelsal service climate in generating control and empowerment among workers and customers”, Journal of Retailing and Consumer Service, Vol. 9.
Yoon, M.H., Beatty, S.E. and Suh, J. (2001),”The effect of work climate on critical employee and customer outcomes: an employee-level analysis”, International Journal of Service Industry Management, Vol.12.
"Pragyaan : JOM" Volume 7 : Issue 2, Dec 2009 44
Employee's Perception towards Service Climate - Hotel Industry in India...

Introduction
The paper is focusing the priorities of the customers of the bank specially the teachers, how they select the bank? What are the parameters on the basis of which they evaluate various banks available in the locality? The different factors identified to start with for the research are Safety of Deposits, Size and Strength, Responsiveness to the Problem, Bank Ownership (Public /Private), Accuracy in computation, Security in area where bank is located , Price and Service Charges, Number of branches in city , General Service Quality, Convenient Location, Number of ATM's in city, Parking Facility, Bank Size, Cordiality of Staff, Proximity, Infrastructure of Bank, Product Packaging, Technology, Peer Group Impression, Advertisement & Publicity, Online Facility etc. By using SPSS for Factor analysis we identify the important factor that makes the way to achieve Bank's Corporate mission through customer orientation . Results of the Factor Analysis for the total sample Indicate that the bank selection decision by customers is based primarily on six selection criteria.
Factor Analysis is a data reduction technique used to reduce a large number of variables to a smaller set of underlying factors that summarize the essential information contained in the variables.
The technique in using factor analysis is grouping the variables by their correlation in such a
Criteria of Selecting Banks by Teachers: A Factor Analytic Approach
Dr.Pradeep Mamgain*
ABSTRACT
This paper attempts to analyze the factors that affect the choice of customers about their bankers. The customers choose their bank after considering number of factors. So from the bank's point of view it becomes important to understand the relative importance of these factors. This paper has tried to determine the criteria that teaching professionals consider important while selecting a bank and how these criteria are prioritized according to their importance and examine whether teaching professionals constitute a homogeneous group in relation to the way they select a bank. In nutshell, the paper aims to study and rank the factors responsible for the selection of bank by teaching professionals. The study involves a survey of 50 bank customers using questionnaire as the research instrument along with the formal interviews. In the study, the author has tried to analyze as to which factors exert the Highest, Moderate, Low, Neutral and Negative influence as choice criteria among individual customer.
Key words: Customers Choice for Bank, Factor analysis, Principal Component analysis, SPSS
* Lecturer, Deptt of Business Management, H.N.B.Garhwal University, Srinagar, Uttarakhand.
way that a particular group is highly correlated among them but relatively smaller correlation with the variables in other group. Each group thus constructs a factor. So the data reduction is possible with the identification of smaller number of factors that explains most of the variance observed in much larger number of variables. We can also generate hypothesis on the basis of these construct.
Objectives
The objectives in this study are two-fold:
1. To determine the criteria that teaching professionals consider important when selecting a bank and how these criteria are prioritized according to their importance
2. To examine whether teaching professionals constitute a homogeneous group in relation to the way they select a bank.
3. To study and rank the factors responsible for the selection of bank by teaching professionals.
Literature Review
A limited number of studies dealing with the topic of bank selection criteria of teachers have been conducted.
A study by Thwaites and Vere (1995), conducted in a British setting, showed that proximity
"Pragyaan : JOM" Volume 7 : Issue 2, Dec 2009 45
of an ATM to college, free banking service and overall student offer were the top three selection criteria employed by college students in selecting which banks to patronize.
Poh (in Gerard and Cunningham, 2001), in a study which sampled Singapore's university and polytechnic students, found that factors relating to ATMs and speed of service were of the most important criteria affecting their bank selection. Criteria relating to third party influences were found to be so unimportant during the pilot test and therefore were excluded from the actual study.
Huu and Karr (2000) sampled 198 undergraduate students in Singapore to identify factors which influence their bank selection decisions. Using “analytical hierarchy process” they found that undergraduates place high emphasis on the pricing and product dimensions of bank services. The third party influences were found to be the least important selection criteria.
Almossawi (2001) conducted a study in Bahrain to examine the bank selection criteria employed by college students. A total sample of 1000 students from five colleges of the University of Bahrain was surveyed in the study. He found that the key factors determining college students' bank selection were: bank's reputation, availability of parking space near the bank, friendliness of bank personnel and availability and location of automated teller machines (ATM).
More recently, Pass (2006) surveyed 373 students from four community colleges and universities located in a large metropolitan area of the Western United States to obtain information about the reasons for students switching banks and selecting new banks.
Pricing and convenience were found to be the principal reasons for selecting a new bank and 'hypothetically' switching banks. The finding that price is a chief reason for switching to another bank and selecting a new one.
A perusal of the literature presented above revealed that research studies conducted on bank selection decisions examined a variety of attributes as determinants of the bank selection process and unearthed a variance in the nature and importance of these attributes.
The present study attempts to partially fill the gap in the literature through an empirical analysis of bank
selection criteria by teaching professionals employed in various colleges and universities of Uttarakhand, U.P. and nearby region.
It is worth noting from the review that no relevant published work to date has appeared concerning the banking behavior of teachers in market. Far less is known about the relative homogeneity of teachers in relation to their bank choice criteria.
Research Methodology
A comprehensive questionnaire was designed based on the variable identified through the relevant literatures. The questionnaire designed was also tested for its validity and used as the survey tool in the selected sample identified as a part of this work. The responses obtained were coded and analyzed with appropriate statistical tools. The statistical analysis was performed with the help of SPSS software package.
In order to conduct this study, 50 customers of teaching professionals working in various colleges and universities of Uttarakhand, U.P. and nearby states have been surveyed. The questionnaire and Direct Interview is used for Data Collection. All the data required for this study has been obtained mainly from primary sources, but at times, a secondary source of data has also been referred.
Statistical tools and Techniques
For measuring various phenomena and analyzing the collected data effectively and efficiently to draw sound conclusions, a number of statistical techniques including Descriptive analysis, Pie chart, Chi-square test and Factor analysis have been used.
Analysis and Discussion
A structured questionnaire was prepared for use in the survey based on literature review and objectives of the study. The questions were organized into two sections as follows:
The first section contains the information required to obtain personal background of the respondents. Questions regarding their Name, age, Education and Salary were included in this section of the questionnaire. The Number of Bank Accounts that customers have in various banks was also considered.
The second section of the questionnaire asked respondents to rate the importance of 21 attributes of the banks when choosing the commercial banks for
"Pragyaan : JOM" Volume 7 : Issue 2, Dec 2009 46
Criteria of Selecting Banks by Teachers: A Factor Analytic approach

doing transactions. They were measured on a five point Likert-type scale of importance ranging from 1 (negative influence) to 5 (high influence). The list was based on previous similar studies (Thwaites and Vere, 1995; Almossawi, 2001; Gerrard and Cunningham, 2001; Shikha, 2008).
The questionnaire sought to obtain information on the banking behavior of respondents.
To determine the potential effectiveness of the questionnaire and whether further revision is needed prior to conducting the survey, the questionnaire was pilot tested. The researcher distributed the questionnaire to 15 persons as a sample group. The subjects were asked if they had any problems understanding the questionnaire or have specific comments regarding the questionnaire. The format for responding was through open-ended questions. The subjects were encouraged to be very free with their responses, make suggestions for improvement and delineate any difficulties they found.
After each questionnaire was completed, each subject was asked what he/she meant in checking various answers. Comments were solicited on the clarity of the questions and what changes should be done in order to make the questions simpler. These respondents also gave their comments on understanding the instructions about the scaling and the time taken to answer the questions. The test found no serious problems and minor amendments were made to the survey questions based on the verbal feedback received from the interview. The final result of the pilot test indicated that the questions had face validity.
Sample and Data Collection
The sample for this study was selected among teaching professionals employed in various colleges and universities of Uttarakhand, U.P. and nearby region, teaching degree courses ranging from Management programs to Technical Engineering Programs. Given the nature of the study, a non-probability (convenience) sample was chosen. To get a representative cross-section of the population, the sample was drawn from a wide range of teachers from all disciplines.
Since this is an exploratory study, a sample size of 50 has been considered to be adequate. Self-administered surveys were distributed in June 2009. The survey was taken in a controlled classroom environment; allowing for a stronger research design.
Specifically, the researcher read a standard set of instructions to the class, informing them of the survey purpose and conditions and encouraged their participation in the study. Respondents were assured of the confidentiality of their responses and their names were not solicited.
Respondents were given approximately 30 minutes to complete the questionnaire. They were prevented from communicating with each other while the survey was in progress. From a total of 60 questionnaires distributed, 54 were returned, out of which 4 were deemed unusable (invalid and incomplete), thereby yielding a response rate of about 83 percent.
Such a response rate was considered sufficient for statistical reliability and generalisability (Tabachnick and Fidell, 2001) and most satisfactory especially when compared with earlier research works on bank selection decisions (Khazeh and Decker, 1992-93; Huu and Karr,2000; Gerrard and Cunningham, 2001). This relatively high response rate was attributed to the self-administered approach undertaken in distributing questionnaires.
Demographics of the Respondents
Examination of the respondents (N=50) indicated that about 24 teachers attached high value to online facilities of the banks in their criteria of choosing a bank.
All analyses were conducted using SPSS statistical software version 16 for Windows. As a preliminary step, evaluative criteria items were Factor analysed to reduce the variables to a manageable number of components. Factoring ceased when all Eigen values of greater than one were obtained and when a set of factors explained a large percentage of the total variance.
Responsiveness to Online Facility of Banks
"Pragyaan : JOM" Volume 7 : Issue 2, Dec 2009 47
Institute of Management Studies, Dehradun
Now our first step is to check whether the data we consider is fit for factor analysis. First we prepare correlation matrix with 21 variables that we have started with. We checked the determinant of the correlation matrix thus produced. The calculated determinant for raw data containing 21 variables is 7.46E-06 which is less than .00001 showing the problem of multicollinearity. Thus by carefully eliminating 6 variables before finally proceeding, it comes out to be .004 and thereby removing this problem.
For that there must be significant correlation among the variables. Here we observe from the correlation matrix that few correlations are small so we can go for analysis.
Table 1. KMO and Bartlett's Test
Kaiser-Meyer-Olkin Measure of .511Sampling Adequacy.
Bartlett's Test of Approx. 234.966Sphericity Chi-Square
Df 105
Sig. .0001
Factor Analysis was deemed appropriate for the items because the Keiser-Meyer-Olkin (KMO) measure of sampling adequacy test index equaled 0.511 (Table 1). Further Kaiser (1974) recommends accepting values greater than 0.5 as acceptable.
Bartlett's measure tests the null hypothesis that original correlation matrix is an identity matrix. Bartlett's test gives a significance level of less than 0.0001 confirming the appropriateness of the factor model (Table 2). A significant test tells us that the matrix is not an identity matrix; therefore, there are some relationships between the variables we included in the analysis. Bartlett's Test is highly significant (p<0.001) and therefore factor analysis is appropriate.
Factor Extraction
Further analysis, therefore was carried out. In the final results, total six factors out of 15 have Eigen values more than 1.00 (Table 3).
The eigen values associated with each linear component (Factor) before extraction, after extraction and after rotation. Before extraction, SPSS has identified 15 linear components within the data set
aTable 2. Correlation Matrix
SOD RTP BOS AIC SIB PSC NOB CoL NOA PaF COS IOB P AdP OLFPack
SOD 1.000 -.025 -.196 .074 .216 -.073 -.067 .010 .004 -.044 .146 .372 .276 -.160 -.199
RTP -.025 1.000 .121 .235 .048 .367 .055 .392 .273 -.180 .085 .198 -.136 -.132 .332
BOS -.196 .121 1.000 -.010 .291 .266 -.207 .025 -.104 -.080 .053 -.089 .262 .013 -.070
AIC .074 .235 -.010 1.000 .057 .021 .304 .243 .107 .000 .195 .301 .086 .048 .150
SIB .216 .048 .291 .057 1.000 .161 -.197 .353 -.304 .366 .316 .095 .499 .143 -.346
PSC -.073 .367 .266 .021 .161 1.000 -.161 .009 .185 .076 -.252 .179 .039 -.163 .149
NOB -.067 .055 -.207 .304 -.197 -.161 1.000 .084 .357 .254 -.025 .200 -.050 -.080 .089
CoL .010 .392 .025 .243 .353 .009 .084 1.000 .134 .112 .185 .319 .278 .373 .167
NOA .004 .273 -.104 .107 -.304 .185 .357 .134 1.000 .095 .023 .213 -.205 .033 .620
PaF -.044 -.180 -.080 .000 .366 .076 .254 .112 .095 1.000 .165 .178 .336 .235 -.124
COS .146 .085 .053 .195 .316 -.252 -.025 .185 .023 .165 1.000 .177 .278 .389 .059
IOB .372 .198 -.089 .301 .095 .179 .200 .319 .213 .178 .177 1.000 .433 .199 -.004
PPack .276 -.136 .262 .086 .499 .039 -.050 .278 -.205 .336 .278 .433 1.000 .419 -.218
AdP -.160 -.132 .013 .048 .143 -.163 -.080 .373 .033 .235 .389 .199 .419 1.000 .203
OLF -.199 .332 -.070 .150 -.346 .149 .089 .167 .620 -.124 .059 -.004 -.218 .203 1.000
a. Determinant = .004
"Pragyaan : JOM" Volume 7 : Issue 2, Dec 2009 48
Criteria of Selecting Banks by Teachers: A Factor Analytic approach

(we know that there should be as many eigen vectors as there are variables and so there will be as many eigen vectors as there are variables and so there will be as many factors as variables). So factor 1 explains 19.1715% of total variance. It is clear from the table that first few factors explain relatively large amounts of variance whereas subsequent factors explain only small amount of variance. SPSS then extracts all factors with Eigen values greater than 1, which leaves us with six factors. The Eigen values associated with these factors are again displayed (and the percentage of variance explained) in the columns labeled Extracted Sums of Squared Loadings. The values in this part of the table are the same as the values before extraction, except that the values for the discarded factors are ignored (hence, the table is blank after the Sixth factor). In the final part of the Table 3 (labeled Rotation Sums of Squared Loadings), the Eigen values of the factor after rotation are displayed.
Hence, total six factors are to be considered for interpretation. The results also show that these six factors account for 72.955 percent of the total variance. Rotation has the effect of optimizing the factor structure and so for the data the relative importance of the six factors is equalized. Before rotation, factor 1 accounted for considerably more variance (19.171%) than remaining five however after extraction it accounts for only (12.903%).
Tab le 4 o f communa l i t i e s shows communalities before and after extraction. The communalities in the column labeled extraction reflect the common variance in data structure. So we can say that 79.1% of the variance associated with safety of deposit is common or shared variance.
Table 3. Total Variance Explained : Extraction Method: Principal Axis Factoring.
Factor Initial Eigen values Extraction Sums of Squared Rotation Sums of Squared Loadings Loadings
Total % of Cumulative Total % of Cumulative Total % of CumulativeVariance % Variance % Variance %
1 2.876 19.171 19.171 2.443 16.288 16.288 1.935 12.903 12.903
2 2.490 16.601 35.772 2.133 14.221 30.508 1.794 11.961 24.864
3 1.767 11.783 47.556 1.487 9.913 40.421 1.367 9.116 33.980
4 1.504 10.027 57.582 1.198 7.984 48.406 1.359 9.057 43.037
5 1.252 8.344 65.926 .883 5.887 54.293 1.239 8.260 51.297
6 1.054 7.028 72.955 .695 4.631 58.924 1.144 7.627 58.924
7 .848 5.655 78.610
8 .824 5.496 84.106
9 .641 4.273 88.379
10 .528 3.522 91.900
11 .338 2.251 94.151
12 .280 1.864 96.015
13 .235 1.570 97.585
14 .191 1.271 98.855
15 .172 1.145 100.000
"Pragyaan : JOM" Volume 7 : Issue 2, Dec 2009 49
Institute of Management Studies, Dehradun
Table 4. Communalities: Extraction Method: Principal Axis Factoring.
Component Initial Extraction
Safety Of Deposit (SOD) .485 .791
Responsiveness To Problem (RTP) .514 .755
Bank Ownership (BOS) .382 .245
Accuracy In Computation (AIC) .261 .230
Security In Bank (SIB) .651 .661
Price and Service Charges (PSC) .509 .948
No Of Branches (NOB) .441 .810
Convenient Location (COL) .531 .453
No of ATM (NOA) .607 .596
Parking Facility (PaF) .464 .422
Cordiality Of Staff (COS) .424 .308
Infrastructure Of Bank (IOB) .536 .506
Product Packaging (PPack) .620 .648
Advertising and Publicity (AdP) .555 .760
Online Facility (OLF) .592 .706
The six selection criteria revealed by the preferences of the teachers are online facility, Responsiveness to problem, Advertising and publicity, safety of deposit, Number of branches of bank and lastly the Price and services charges by the bank
The Factor matrix and Rotated factor matrix is same. But the RFM contains the same information as the component matrix except that it is calculated after rotation.
Factor loading less than 0.4 have not been displayed because we asked for these to be suppressed. An accepted method of interpretation of Factor loadings is to regard as significant any variable with a
a Table 5. Factor Matrix :Extraction Method: Principal Axis Factoring.Factor
1 2 3 4 5 6
Product Packaging .776Security In Bank .686Infrastructure Of Bank .502Convenient Location .487Cordiality Of Staff .449No of ATM .710Online Facility .706Responsiveness To Problem .609 .436Accuracy In ComputationPrice and Service Charges .803No Of Branches .432 -.486 .463Bank OwnershipSafety Of Deposit .674Advertising and Publicity .523 -.576Parking Facility .410 .468
a. Attempted to extract 6 factors. More than 25 iterations required. (Convergence=.006). Extraction was terminated.
"Pragyaan : JOM" Volume 7 : Issue 2, Dec 2009 50
Criteria of Selecting Banks by Teachers: A Factor Analytic approach

loading of 0.4 or greater as associated with the appropriate factor (Hair, Anderson, Tatham and Black, 1998).
Conclusion
The factors that significantly influence choice of bank by the teachers, in decreasing order of importance are: online services, responsiveness to problems, advertising and publicity, safety of deposit, number of branches of a bank, and service charges.
References
Almossawi, M. (2001). 'Bank selection criteria employed by college students in Bahrain: an empirical analysis ', International Journal of Bank Marketing, 19, pp. 115-25.
Anderson, W.T., Cox, E.P. and Fulcher, D.G. (1976). 'Bank selection decision and market segmentation', Journal of Marketing, 40, pp. 40-5.
Boyd, W.L., Leonard, M. and White, C. (1994). 'Customer preferences for financial services: an
analysis', International Journal of Bank Marketing, 12, pp. 9-15.
Denton, L. and Chan, A.K.K. (1991). 'Bank selection criteria of multiple Bank users in Hong Kong', International Journal of Bank Marketing, 9, pp. 23-34.
Duncan, G.J., Smeeding, T.M. and Rodgers, W. (1992), 'The incredible shrinking middle class', American Demographics, 14, pp. 34-38.
Evans, R.H. (1979). 'Bank selection: it all depends on the situation', Journal of BankResearch, 12, pp. 242-245.
Gerrard, P. and Cunningham, J.B. (2001). 'Singapore undergraduates: how they choose which Bank to patronise', International Journal of Bank Marketing, 19, pp. 104-14.
Government of Malaysia (2001). Third Outline Perspective Plan 2000-2010. Government Printing.
Gray, A.D. (1977). Students Attitudes toward
a Table 6. Rotated Factor Matrix :Extraction Method: Principal Axis Factoring.
Factor
1 2 3 4 5 6
Advertising and Publicity .844Product Packaging .611Cordiality Of Staff .470Online Facility .778No of ATM .698Security In Bank .402 -.600Responsiveness To Problem .784Convenient Location .423 .515Accuracy In Computation .402Price and Service Charges .946Bank OwnershipSafety Of Deposit .868Infrastructure Of Bank .518No Of Branches .803Parking Facility .499
Rotation Method: Varimax with Kaiser Normalization.a. Rotation converged in 15 iterations.
"Pragyaan : JOM" Volume 7 : Issue 2, Dec 2009 51
Institute of Management Studies, Dehradun
Banking, unpublished B.Sc. dissertation. University of Strathclyde.
Gupta, Y.P. and Torkzadeh, G. (1988). 'Re-designing Bank service: systems for effective marketing', Long Range Planning, 21, pp. 38-43.
Hair, J.F., Anderson, R.E., Tatham, R.L. and Black, W.C. (1998). Multivariate Data Analysis, 5th Ed. Upper Saddle River, NJ: Prentice Hall.
Holstius, K. and Kaynak, E. (1995). 'Retail banking in Nordic countries: the case of Finland', International Journal of Bank Marketing, 13, pp. 10-20.
Hon, K.Y. and Tom, G. (1995). 'How the Chinese select their banks', Journal of Retail Banking, XVI, pp. 36-39.
Huu, P.T. and Karr, Y.H.( 2000). 'A study of Bank selection decisions in Singapore using the analytical hierarchy process', International Journal of Bank Marketing, 18, pp. 170-80.
Kaufman, G.G. (1967). A Survey of Business Firms and Households View of a Commercial Bank, Report to the Federal Reserve Bank of Chicago, Appleton, University of Wisconsin, Madison.
Kaynak, E. (1986). 'How to measure your bank's personality: some insights from Canada', International Journal of Bank Marketing, 4, pp. 54-68.
Kerlinger, F.M. and Lee, H. (2000). Foundations of Behavioral Research, 4th ed., Stamford: Wadsworth.
Khazeh, K. and Decker, W.H. (1993). 'How customers choose banks', Journal of Retail Banking, 14, pp. 41-44.
Lewis, B.R. (1982). 'Student accounts a profitable segment', European Journal of Marketing, 16, pp. 63-72.
Lewis, B.R. and Bingham, G. (1991). 'Service quality: an international comparison of Bank customers' expectations and perceptions', Journal of Marketing Management, 7, pp. 3-11.
Mason, J.B. and Mayer, M.L. (1974). 'Differences between high-and-low-income savings and checking account customers', The Magazine of Bank Administration, 65, pp. 48-52.
Schram, J. (1991). 'How student choose their banks', US Banker, 110, pp. 75-78.
Tabachnick, B.G. and Fidell, L.S. (1996). Using Multivariate Statistics, HarperCollins, New York.
Thwaites, D. and Vere, L.( 1995). 'Bank selection criteria: a student perspective', Journal of Marketing Management, 11, pp. 133-49.
Zineldin, M. (1996). 'Bank strategic positioning and some determinants of Bank selection', International Journal of Bank Marketing, 14, pp. 12-22.
"Pragyaan : JOM" Volume 7 : Issue 2, Dec 2009 52
Criteria of Selecting Banks by Teachers: A Factor Analytic approach

Introduction
The Mumbai region with a population of some 13 million, is one of the largest metropolis of South Asia, processes a dominant share in financial transaction and generates a larger share of national tax revenue. With its swelling population, deteriorating environment, income disparities, scarcity of land resources and limited availability of funds needs to be substantially supported to develop its infrastructure to support the economic growth. Rains play a spoilsport year after another.
Growing urbanization across the state and swelling urban population creates high pressure on municipality. The city of Mumbai has acted as a magnet in attracting migrants from all over the country and has emerged as a hub of industrial, commercial, entertainment and financial activity. There has been a phenomenal increase in the number of mechanical vehicles in the city over the years. Inadequacy and ongoing repairing work has resulted in poor quality of roads in the state. Lack of efforts from municipal authorities to educate people to manage their waste. Lack of awareness and education among masses about the environmental issues is the main reason for deteriorating conditions. Facilities for proper treatment and disposal of solid waste are lacking.
People, Welfare and Municipality: A case of Mumbai Floods
* Assistant Professor (Economics), Indian Education Society's, Management College & Research Centre, Bandra, Mumbai
Dr. Beena Narayan*
ABSTRACT
The Mumbai region is one of the largest metropolises of South Asia, possesses a dominant share in financial transaction and generates a larger share of national tax revenue. With its swelling population, deteriorating environment, income disparities, and scarcity of land resources and limited availability of funds needs to be substantially supported to develop its infrastructure to support the economic growth. Rains play a spoilsport year after another. Municipality of Mumbai faces failure of controlling the situation in excessive rainfall. Even if rainfall is normal, some regions in Mumbai always suffer from serious deficiency of shelter, transport, food and medical facilities. The study aims at throwing light on the factors like satisfaction level of public regarding municipality work , reasons of local governments inability to provide help to victims at the disastrous situation, the factors which are responsible for demand-supply gap and to suggest a policy for public awareness towards maintaining a link between public and municipality.
Keywords: Municipality, Physical capital, Human capital, Natural capital, Social capital, Economic implications, BMC.
Statement of the Problem
With growing responsibilities, municipality of Mumbai faces challenge in identifying and addressing the consumer concerns about cleaning the roads, identifying areas of exposure where water logging or flood situation occurs or vulnerability due to insufficient measures, resources, building and sustaining the confidence of public, persuading public to become aware about the situation and extend their co-operation. However within the context of this drive to solve inconvenience of public, municipality appears to recognize that their ongoing efforts are also dependent upon developing relationships with the public. Municipality has adopted a plethora of safety measures designed to support people to trust their service infrastructure. There is a suggestion that educating people about disaster management may impact positively in reducing losses during rainy season and help in developing a long lasting relationships with public. The remedy for this is to design a programme reachable to public so as to not only satisfy a segment of population but all masses. However on the issue of ensuring the quality of services of municipality, a review of public survey reveals that municipality has not taken any initiative to measure their service quality.
"Pragyaan : JOM" Volume 7 : Issue 2, Dec 2009 53
Objectives of the Study
There is need to fully understand public encounters and interactions within the context of providing better civic amenities. In particular, this research will examine the following question:
How do public judge the quality of municipality services? The objectives of this research are :
1. To estimate the satisfaction of public regarding municipality work.
2. To trace the reasons of local government's inability to provide help to victims at the disastrous situation.
3. To study the factors which are responsible for demand-supply gap.
4. To suggest a policy for public awareness towards maintaining a link between public and municipality.
Literature Review
Alterkawi (2005) studied that Riyadh Municipality must support this substantial growth with effective and efficient infrastructure related facilities and public services by integrating people, business strategies and technology. Certain uses of geographical information systems may be one approach to provide this support. Figueiredo (2009) presented disparity between the proposals and technical perspectives regarding the management and mitigation of flood risk and the perception of local population.(Grinberg) focused on the negative consequences of coastal developments and major cities as a result of global warming and rising sea levels. Johnson (1971) focused on problems related to governance of municipality. Mongkolnchaiarunya (2005) focused on promoting a community based solid-waste management in local government in Thailand.
Moss (1997) explored both the evolution and the current role of federal disaster policy against the backdrop of the Great Mississippi flood of 1993.Robinson (2004) studied various alternatives to mitigate the barriers that villages of Alaska faces in qualifying for federal assistance. Sakai (2004) discussed that rainfall brings urban residents both
benefits of water resources and adverse risk such as flooding which causes deterioration of water quality but also environmental pollution risk. It is deemed necessary to ensure public participation in risk management. Swartz (2005) studied at the flood prevention efforts in Cuyahoga falls.
Takahasi (2004) studied public-private partnership as an example of flood control measures in Japan. Waal (2006) offered a case study at a Dutch Municipality and offered a clear insight to municipality that needed attention. It suggests several performance management improvement projects. White (2002) highlighted on some important questions about the extent to which planning to fostering and environment susceptible to flooding.
Research Methodology
The present study was based on both primary and secondary data. The primary data were collected from people of different areas in Mumbai's most prominent water logging areas. The resident and shopkeepers were choosen from Wadala, Kalina, Bandra and Worli Nakain Mumbai.
A fact finding study was carried out for this survey and structured questionnaire was used. A survey was conducted to measure welfare via service quality of municipality in Mumbai City. The total sample size was 202. The duration of the research was June 2009 to September 2009.
The secondary information were obtained from various published sources, government reports and websites.
Economic Implications
This research is useful for municipality to improve service quality and retain public faith. The findings are important to enable municipality officers and decision makers to have a better understanding of public perception of service quality of municipality services and consequently of how to improve welfare services and public satisfaction.
About the Respondents
The age of the respondents indicates the experience and use of services. Table 1 shows the age-wise classification of the respondents.
"Pragyaan : JOM" Volume 7 : Issue 2, Dec 2009 54
People, Welfare and Municipality: A case of Mumbai Floods

Table 1. Age-Wise Classification of Respondents
Age No. of %Classification Respondents
20-24 28 14%
25-30 26 13%
31-35 24 12%
36-40 30 15%
41-45 35 17%
46-50 28 14%
51-55 11 5%
56-60 10 5%
61-ABOVE 10 5%
TOTAL 202 100%
It could be seen from Table 1 that 35(17%) respondents are in the age groups of 41-45 years. 30(15%) respondents are in the age group of 36-40 years. 28(14%) respondents are in the age group of 20-24 years and 46-50 years respectively. 26(13%) respondents are in the age group of 25-30 years. 24(12%) respondents are in the age group of 31-35 years. 31 respondents (15%) are in the age group of 51 to 60 and above.
It is deduced from Table 2 that 142(70%) respondents are males and 60(30%) respondents are females. This indicates substantial use of civic services by males as well as females.
Table 2. Sex Ratio of Respondents
Category No. of %Respondents
MALE 142 70%
FEMALE 60 30%
TOTAL 202 100%
The level of education plays an important role in the analysis of facilities provided by the municipality. To find out the education level of the respondents data on education level of the respondents were collected, and are tabulated in Table 3.
Table 3. Educational level of Respondents
Category No. of %Respondents
BELOW SSC 25 12%
SSC 64 32%
HSC 18 9%
GRADUATES 71 35%
POST-GRADUATES 24 12%
TOTAL 202 100%
It is inferred from Table 3 that 71 (35%) respondents are graduates and 64 (32%) respondents have SSC level of education. 25 (12%) respondents are below SSC level and 24 (12%) are post graduates. 18(9%) respondent are having HSC level education.
People engaged in different occupations are expected to have a better idea about use of civic services. Information on Occupation of Respondents is given in Table 4.
Table 4. Occupation of Respondents
Category No. of %Respondents
SERVICE CLASS 100 50%
BUSINESS CLASS 38 19%
STUDENT 24 12%
HOUSEWIVES 40 20%
TOTAL 202 100%
It is evident from Table 4 that 100(50%) respondents belongs to service class category. 40(20%) respondents are housewives. 38(19%) respondents belongs to business class and 24(12%) respondents belong to students category. Thus the respondents represent various occupations.
"Pragyaan : JOM" Volume 7 : Issue 2, Dec 2009 55
Institute of Management Studies, Dehradun
Representation of different income categories is an important feature.
Table 5. Monthly Income of Respondents
Category No. of %Respondents
5000-10000 07 3%
11000-20000 10 5%
21000-30000 25 12%
31000-40000 17 8%
41000-50000 13 6%
51000-ABOVE 18 9%
NOT ANSWERED 112 55%
TOTAL 202 100%
It is evident from Table 5 that 25(12%) respondents are earning 21-30 thousand rupees per month, 18(9%) respondents are earning more than 50 thousand rupees per month, 17(8%) respondents are earning 31-40 thousand rupees per month, 13(6%) respondents are earning between 41-50 thousand rupees per month, 10(5%) respondents are earning 11-20 thousand rupees per month, 7(3%) respondents are earning 5-10 thousand rupees per month and 112(55%) respondents did not reveal their income status.
Longer duration of stay in a location by a respondents adds stability to information.
Table 6. Duration of Stay of Respondents in a Locality
Number of Years No. of %Respondents
FIVE 22 11%
TEN 27 13%
FIFTEEN 40 20%
TWENTY 37 18%
TWENTY FIVE 71 35%
MORE THAN 05 2%TWENTY FIVE
TOTAL 202 100%
It is inferred from the Table 6 that 71(35%) respondents are staying in their locality for twenty five years, 40(20%) respondents staying in their locality for past fifteen years, 37(18%) respondents are staying in their locality for past twenty years, 27(13%) respondents are staying in their locality for past ten years, 22(11%) respondents are staying in their locality for past five years, and 5(2%) respondents are staying in their locality for more than twenty five years. This suggests that the responses could be taken as reliable.
The role of municipality becomes more important in rainy season during the water logging or flood. Municipality uses various flood control devices on high frequency flooding areas.
Table 7. Areas of Respondents Getting Flooded Every Year
Category No. of %Respondents
YES 201 100%
NO 01 0%
TOTAL 202 100%
It is evident from the Table 7 that 201(99.99%) respondents accepted that their area gets flooded every year. Only 1 (.01%) respondents replied that his area does not get flooded every year.
Table 8(a). Awareness of Respondents to Reasons of Flood
Category No. of %Respondents
YES 170 84%
NO 32 16%
TOTAL 202 100%
If the respondents are aware of factors causing flood like situations, they would be able to give quality responses. Table 8a reveals that 170 (84%) respondents are aware about the reasons of water-logging or flooding in their area, and 32(16%) respondents are not aware about the reasons of water logging in their area.
"Pragyaan : JOM" Volume 7 : Issue 2, Dec 2009 56
People, Welfare and Municipality: A case of Mumbai Floods

Table 8(b). Reasons of Flooding / Water Logging
Category No. of %Respondents
CHOKKING PIPES/GUTTERS 41 20%
CONSTRUCTION 17 8%WORK
HEAVY RAINS 64 32%
INCOMPLETE 80 40%BMC WORK
TOTAL 202 100%
It is inferred from Table 8b that 41 (20%) respondents feel that water logging is due to chocking of pipes and gutters, 17 (8%) respondents feel that water logging is due to incomplete BMC work, 64 (32%) respondents feel that the sudden increasing extent of rains is the cause of water logging. 80 (40%) respondents feel that vast construction work is the cause of water logging in the city.
Is the situation getting worse every year?
With growing urbanization, role & responsibility of municipality increases. Due to demand and supply gap, the civic facilities do not reach the people in time, and situation gets worse.
It is deduced from Table 9 that 165 (82%) respondents feel that water logging situation is getting worse every year, and 37(18%) respondents feel that it is not getting worse every year.
Table 9. Is the Flood Situation Worsening?
Category No. of %Respondents
YES 165 82%
NO 37 18%
TOTAL 202 100%
Municipality Compensation
It is evident from Table 10 that 196 (97%) respondents replied that they are not provided any compensation from the government, and 6 (3%) respondents agreed that they are provided compensation from the government.
Table 10. Does the Government Provide Adequate Compensation?
Category No. of %Respondents
YES 06 3%
NO 196 97%
TOTAL 202 100%
During the disaster, compensation for loss is another support to the victims. Timely help and providing financial support to revive life back is welfare measure important for the government..
Insurance Status
Preparedness is the key element to survival in a water logging prone area. Individuals, families, business people can be financially secured if they opt for insurance.
It is inferred from Table 11 that 137(68%) respondents have not insured themselves or their valuables, and 65(32%) respondents have insured themselves and their valuables.
Table 11. Is the Respondent Insured?
Category No. of %Respondents
YES 65 32%
NO 137 68%
TOTAL 202 100%
Status of Loss of Life
After the occurrence of the disastrous water logging the worst situation observed is an atmosphere of destruction i.e. loss of life.
"Pragyaan : JOM" Volume 7 : Issue 2, Dec 2009 57
Institute of Management Studies, Dehradun
Table 12. Has the Respondent Experienced Incidents of loss of Life?
Category No. of %Respondents
YES 28 14%NO 174 86%TOTAL 202 100%
It is evident from Table 12 that 28(14%) respondents have experienced incidents of loss of life in their locality, 174(86%) respondents have not experienced loss of life incidents in their locality.
Cleaning of Gutters & Nullahas ( Drains) before Rainy Season
Mumbai is known as a vulnerable place of flooding and water logging. Before rainy season some pre-cautionary measure can prevent certain amount of loss. Blocked drains and gutters are one of the causes of water logging.
Table 13. Are the Gutters and Nullahas Cleaned before Rainy Season?
Category No. of %Respondents
YES 60 30%NO 142 70%TOTAL 202 100%
It is evident from the Table 13 that 142(70%) respondent agreed that gutters and nullahas are not cleaned before rainy season, and 60(30%) respondents agreed that gutters and nullahas are cleaned before rains.
Traditionally, relief in the wake of water logging has been treated as the primary responsibility of the municipal corporation. Under disaster management municipality is responsible for planning, organizing , coordinating and implementing measures which are necessary for public help.
Immediate Help Received
Table 14. Timely help Extended by Govt. Agencies
Category No. of %Respondents
LOCAL PUBLIC 148 73%FIRE BRIGADE 18 9%POLICE 36 18%TOTAL 202 100%
It could be seen from Table 14 that 148(73%) respondents accepted that its local public comes first for immediate help, 36(18%) respondents accepted that police comes for immediate help, and 18(9%) respondents accepted that fire brigade comes for immediate help.
Role of government is very important to provide basic infrastructure. Basic infrastructure enables the masses to use the services at economical prices and also help a comfortable stay in the state. For this purpose the data were collected and tabulated to know public opinion about municipality work.
Satisfaction Level By BMC Work
Table 15. Is the Respondent Satisfied with BMC Work?
Category No. of %Respondents
YES 46 23%NO 156 77%
TOTAL 202 100%
It is evident from Table 15 that 156 (77%) respondents are not satisfied with the BMC work, and 46 (23%) respondents are satisfied with the BMC work.
Shelter Provided During water Logging / Flood
There are many expectations from the public during the crisis. Among them the most important is shelter and food. An opinion from the public was taken about availability of shelter & community kitchen system.
Table 16. Did the Govt. Agencies provide shelter?
Category No. of %Respondents
YES 47 23%NO 155 77%
TOTAL 202 100%
It is deduced from Table 16 that 155 (77%) respondents accepted that there is no shelter provided during the time when due to flooding water enters in their houses, and 47(23%) respondents accepted that government provides shelter during the flooding time when water enters in their houses.
"Pragyaan : JOM" Volume 7 : Issue 2, Dec 2009 58
People, Welfare and Municipality: A case of Mumbai Floods

Community Kitchen Facilities Provided
The worst impact of flooding situation is that residents are unable to prepare food. At this situation provision of community kitchen is a helping measure.
Table 17. Were the Respondents Provided with Community Kitchen Facilities?
Category No. of %Respondents
YES 31 15% NO 171 85%
TOTAL 202 100%
It is inferred from Table 17 that 171(85%) respondents accepted that there is no community kitchen facility provided and they survived on whatever was available at home or from neighborhood.
Awareness About Disaster Management Plan
A water logging situation is a level of disruption which cannot be absorbed by the adjustment capacity of affected community within its own resources. Any action to reduce the impact on the community consists of increasing the adjustment capacity of the community by way of training and contingency planning. Mumbai Municipal Corporation has a wide disaster management plan to prevent the situational adversities during crisis. General awareness creation among women, children, old people, destitute and disabled is necessary as they are the most vulnerable group in disastrous situation. People's opinion was taken about awareness of BMC's disaster management plan.
Table 18. Were the Respondents Aware of Disaster Management Plan?
Category No. of %Respondents
YES 47 23%NO 155 77%
TOTAL 202 100%
It is deduced from the Table 18 that 155(77%) people are not aware of disaster management plan of Municipal Corporation.
Willingness to Participate in Disaster Management Training (DMT) Given By BMC
Community based disaster management plan is needed to be evolved and implemented. People's participation is the main principle in the disastrous situation. Supplementing municipality's efforts with people's participation can help avoid substantial losses. Thus, these people should be given disaster management training. People's opinion was taken towards training for disaster management training.
Table 19. Would you like the Respondent like to participate in DMT?
Category No. Of %Respondents
YES 118 58%NO 84 42%
TOTAL 202 100%
It is evident from Table 19 that 118(58%) respondents are willing to take disaster management training if provided by the municipal corporation.
Grave Impacts of Flooding
From the above findings of the study some important facts come into focus that a devastating monsoon brings to halt the pace of life in Mumbai city. The rains crippled normal routine with shortage of food, commuters struggle to get home trudging through roads with waist deep water as the suburban train services are knocked out of action. Traffic jams on the road are very common. Collapse of telephone service, drinking water, and electricity, and danger of electrocution is another feature. The state government and city administration comes under tremendous pressure from Mumbai residents who blame the officials and politicians for not managing the situation.
There has been tremendous influx of population into Mumbai in past decades with collusion of politicians, land mafia and administrative slumber. Slums developed everywhere on every possible open space in the city. Mangroves are cut by builders by flouting all rules and sky rise residential buildings constructed. Water drainage routes to sea are blocked which causes serious problems to residents of low lying areas.
"Pragyaan : JOM" Volume 7 : Issue 2, Dec 2009 59
Institute of Management Studies, Dehradun
Old age people, women and children are the worst sufferers of the floods. In almost all waterlogged areas children and sick people do not get proper food, and health care, and are forced to live in unhygienic conditions.
There is no access to safe drinking water, so water borne diseases are at peak, and snake and rat bites are very common in slum areas.
Impact on Business
In this study it is observed that flooding has a negative impact on financial status due to poor business. In the areas where flood or heavy water logging takes place people are unable to do their business. In case of perishable commodities market such as vegetables, fruits, meat, fish, flower and milk business almost gets stop because most of the business is not under permanent shop system.
Impact on Physical Capital
Physical Capital comprises the basic infrastructure and producer goods needed to support livelihoods. The crucial components of infrastructure which are usually essential for sustainable livelihoods are smooth transport system, secured shelter and buildings, adequate water supply and sanitation, medical services when in need, electricity and access to information. Hence flooding has an adverse impact on physical assets.
Infrastructure facilities are very important for the integration of one to another area. But during the time of flood the air and rail transport system gets very disturbed having huge traffic on the road and inconvenience to air passengers.
Old buildings and slum areas have all possible risks of life. Flood causes damage to furniture and other items in the house. Telephone cables, internet and T.V. cables get affected.
Electricity is disrupted and risk of electrocution increases.
Impact on Human Capital
In the livelihood framework, human capital is taken as a livelihood asset. It represents the skills, knowledge ability to work and good health that together enable people to pursue different livelihood strategies and achieve their livelihood objectives. Flood has grave impacts on people. The major health
problems faced by the people are malaria, cholera, water borne diseases, viral fever, laptrospiorosis, typhoid, jaundice, gastroenteritis, cold, pneumonia. There are also cases of food poisoning and skin related problems.
It has been observed that people living in water logged areas are more prone to monsoon related problems. With the increasing rains, there is moisture in the air that causes decay of household goods.
The medical facilities provided by the public hospitals are not of high quality due to overcrowded hospitals.
Municipal Corporation advised to organize some training programmes for the youth to handle disaster. This training should be for swimming, first aid, cooking for community kitchen. Preparing teams beforehand will be helpful during crisis.
Impact on Social Capital
In the sustainable livelihood framework, social capital is taken to mean the resources which people draw upon in pursuit of their livelihood objectives. The displacement of local residents is a common factor during flood. The local people have to be relocated to a new settlement. There is no compensation for damage. If compensation paid are not sufficient then people are often helpless.
Impact on Natural Capital
Natural capital can be defined as the stock of natural resources and environmental assets, including water, air, soils and other natural resources. Due to rains and flooding the first impact is on water. There is an acute scarcity of pure drinking water. Overflowing gutter water enters in the houses, stagnant water spoils things, generates dirty stinks, body parts of dead animal floating with the water is common, snails and earthworms are commonly seen in the houses. Deposition of garbage due to uninterrupted services of municipality sweepers causes unhealthy atmosphere to live. Fishing is worst affected. The fishermen are unable to catch fish and their business is adversely affected. Interrupted supply of vegetables affects business of road stall owners.
Impact on Financial Factor
The financial loss due to floods is unprecedented. The financial impact of floods is
"Pragyaan : JOM" Volume 7 : Issue 2, Dec 2009 60
People, Welfare and Municipality: A case of Mumbai Floods

manifested in various ways. First, the banking transactions across the city are adversely affected as many of the bank branches become inoperative. ATM transactions become inactive due to failure of the connectivity with their central system. The Stock Exchanges may also become inoperative.
thThe old established drainage system of 20 Century with limited capacity of functioning and clogged drainage from several places is one of the important cause of flood in the city. Due to financial constraints of the municipality an ambitious plan could not work out.
Haphazard development and construction without planning is the main cause of flood. In various instances no environment clearance from environment ministry has aggravated the situation.
Mangrove ecosystems which exist along the river and creek are being destroyed and replaced with construction. Hundred acres of land in Mahim Creek has been reclaimed and put to use for construction by builders. According to an estimation, Mumbai has lost about 40% of its mangroves in last 10 years. Sewage and garbage dumps have also destroyed mangroves.
Policy Suggestions
Municipality of Mumbai faces failure of controlling the situation in excessive rainfall. Even if rainfall is normal, some regions in Mumbai always suffer from serious deficiency in government support in the form of shelter, transport, food and medical facilities. Due to increasing pressure of population on Mumbai's land the effect of municipality failure is now felt more strongly than before. It is also felt that with the improvement in infrastructure, communication and technology the city should be better equipped to moderate the adverse effects of a situation. Thus, along with the relief measures, more attention needs to be given to educate people during the non-rainy season. This is required both at the grass root and at the top level of people. Organising rescue operations is necessary. Organising shelter for the people in distress, in case the arrangements of the civil authorities are considered insufficient, army assistance should be requisitioned. A well coordination between government, non-government and voluntary organizations is helpful. Organising relief camp and informing public via media help before the monsoon will ease the panic. Public should
be assured about provision of basic amenities like drinking water, sanitation, public health care and arrangements of cooked food in the relief camps.
Organising enough relief parties to the rescue of people suffering within a reasonable time limit, establishing effective communication with the help of dedicated people, organising community kitchen to supply food at least for a week's time, grant of emergency relief to all the affected people, and issuing correct information through mass media to avoid rumors will minimize panic. Repairs, reconstruction of infrastructural facilities such as roads, walls, sewers, and telephone lines of flood affected areas, and timely health care facilities need to be undertaken. Implementing an alternative crisis management plan with the help of corporate sector. Provision of insurance and small amount credit facilities to the flood victims may help. A packages of new techniques need to be introduced, one of which can be to encourage people to bring recyclable material to exchange for some daily use items at monthly exchanges in local communities. BMC should make provisions for clearance of a backlog of discarded items to help improve the environment. The city has experienced problems in waste disposal and has sought ways of handling it through alternative ways and techniques available but yet failed.
As Mumbai temperature remains almost constant during the whole year, a complete change in school session pattern can also minimize problems related to monsoon. As absenteeism is high during rainy season, the government should close the schools during the peak months of rainy season instead of summer vacation. This will minimize transport related problems and accidents.
Findings and Recommendations
The findings of the study cover all age groups and their experiences of flood situation. Only a small number of respondents are less educated. Majority of the respondents earning for their livelihood either by business or service are worst affected. As per findings if care is taken to cleaning gutters and pipes and BMC strictly follows completion deadline the problem can be minimized. Situation of flood is getting worse every year and except a very small number maximum victims don't get any compensation from the government. Occasionally loss of life is also experienced. Majority of respondents are not aware about insurance of their valuables which is very
"Pragyaan : JOM" Volume 7 : Issue 2, Dec 2009 61
Institute of Management Studies, Dehradun
important. Insurance should be a priority. State should take responsibility to educate people about insurance.
Majority of the respondents blame municipality for inefficient management. Respondents suffer due to no provision of shelter which is the main responsibility of the government. Absence of provision of community kitchen under adverse circumstances causes dissatisfaction among people. Public awareness about disaster management plan is also very poor. A Government program requires equal public participation to succeed. If awareness education is rightly spread public can get help in right time.
The sustainable livelihood approach imagines that people require a range of welfare measures. People are tax payers; their expectations from the government are genuine. Sometimes, it is seen that facilities are distributed an inequitable manner. Due to political reach some people get accessibility to all facilities but other people remain sufferers. This creates a social imbalance.
Given below are some suggestion for improving operations of Bombay Municipal Corporation (BMC) and the welfare of people at large:
? Timely actions have to be taken.
? Round the year, all areas should be kept clean, with proper maintenance.
? Mithi river should be cleaned regularly.
? BMC inspection is necessary to check the performance of work.
? Old pipes should be replaced, and wider pipes should be fitted.
? Cleaning of gutters and nullahs (drains) should be done at regular intervals.
? Public should not throw garbage on the roads.
? Control on mosquitoes and rat population should be exercised.
? Awareness among public should be created.
? Involvement of people in government projects can create awareness.
? Bribery and dishonesty among BMC workers should be curbed.
? Active “Mohalla Committees” should be setup.
? All civic works should be completed timely.
? Use of plastic bags should be banned.
? Unauthorised food stalls should be removed.
? Slum people should be educated about cleanliness.
? Every household should have a dustbin. There should be penalty for throwing garbage on the roads.
? City population should be controlled by controlling slum population.
? The residents need to support the efforts of the authorities to fulfill their expectations.
Recommendations for Future Studies:
? The present study was carried out in selective locations. In the future, there is scope to conduct the same type of study in other neighboring areas.
? Further, the present study was carried out in case of residents. The same type of research may also be carried for business class sector in order to find out actual impact on business.
? The present study of the public expectations from the government during flood was carried out for Mumbai only. In future, this type of research may be conducted at State or National level in flood or draught affected areas.
References
Alterkawi M.(2005) Measures towards a comprehensive municipals GIS- the case of Al-Riyadh Municipality, Habitat International Vol. 29 Issue 4, p.689-98
Baw Saujaya (2002) “Why Maharashtra Isn't a Malaysia”, Financial Express, Mumbai October 25.
CMIE (2003) “Infrastructure”, Centre for monitoring Indian Economy Pvt. Ltd., Mumbai
David E.(1998) “Flooding prompts city to repair sewers” American city & country Vol.113 Issue 5, p.81.
"Pragyaan : JOM" Volume 7 : Issue 2, Dec 2009 62
People, Welfare and Municipality: A case of Mumbai Floods

Figueiredo, Elisabete (2009) “Coping with risk : analysis on the importance of integrating social perceptions on flood risk into management mechanisms the case of the municipality of Agueda, Portugal” Journal of Risk Research Vol. 12 Issue 5, p.581-602
Hagihara, Yoshimi, Asada, K.Zhang Shengping (2004) Management of rainfall related environmental risks in urban areas, Journal of Risk Research Oct-Dec.2004. Vol. 7 Issue 7/8, p.731-744
J.Askin (2004) Performance Management and Organizational Intelligence : Adapting the balanced score card in Larvik Municipality. International Public Management Journal Vol.7 Issue 3, p.415-438
J.Mongkoln Chairwnya (2005) “ Promoting a community based solid waste management inititiative in local government : Yala Municipality, Thailand” Habital International, Vol.29 Issue 1, p.27-40.
Khatua, B.C.(2002) Water Supply and sanitation, Maharashtra Infrastructure Sumit 2002, MEDC Mumbai
Kumar Davinder (2001) “Who is immune to this Disease” Joint Action Committee, Kanpur
nd(JHCK), 22 Jan.
M.Grinberg (2007) “That sinking Feeling” Risk Management, Vol.54 Issue 8, p.i.8, 1.P
M.Satish (2006) “Citizen's Guide to Disaster Management” MACMILLAN India Ltd.
Maharashtra Development Report (2007) Academic Foundation, New Delhi
Moitra, Aheli and Jyotsna Ramachandran (2003) “Dry or Wet? It's all Garbage for them.” The Indian Express, Max.8, Mumbai
Moss, David A. Rosenbaum, Julie (1997) Great Missisippi flood of 1993 Haward Business School Cases.
N.Swartz (2005) “Plan prevents future flooding” American city & country Vol.120 Issue 13, p.33-33.
R.Gall (1997) How your municipality can save money by recycling, water engineering and management Vol.144 Issue 12, p.18
Waal A.A.de (2006) “Performance management Analysis : a case study at a Dutch Municipality” International Journal of productivity and Performance Management Vol.55 Issue 1, p.26-39.
White, Iain; Howe, Soc.(2002) “Flooding and the role of planning in England & Wales : A critical Review” Journal of Environmental Planning and Management Vol.45 Issue 5, p.735-745.
Y. Takahasi, Yutaka (2004) Public Private Partnership as an example of flood control measures in Japan. Vol. 20 Issue 1, p.97-106
Y.Julian Scott (2004) “Improved Policies for solid waste management in the municipality of Haniiton wentworth, Ontario” Canadian Journal of Administrative Sciences, Dec.2004 Vol.21 Issue 4, p.376-393.
www.indiahousing.com/municiapl_corporation_greater_mumbai.html
http://en.wikipedia.org/maharashtrafloods of 2005
"Pragyaan : JOM" Volume 7 : Issue 2, Dec 2009 63
Institute of Management Studies, Dehradun
Introduction
India is the fifth largest market in Asia by premium following Japan, Korea, China and Taiwan. The US$ 30 billion insurance business in India is expected to grow at 17 % in fiscal 2008-09 if the country's economy (GDP) touches a growth rate of7.6 % In fiscal 2007-08 life insurers grew their business by 23.3 % to Rs.930 billion while general insurers posted growth of about 14 % in premium income to Rs 298 billion. The premium income in the country increased to 4.7 % of GDP in fiscal 2006-07 from 3.3 % in the fiscal 2002-03.Total premium in the insurance industry grew at a CAGR of 28.1 % during the same period. The life insurance sector grew at a CAGR of 29.3 % outsmarting the general insurance sector's CAGR of 21.3 %. The Indian insurance sector has a turnover of around Rs 26,287 crore. Despite such a huge market the penetration of Indian insurance remains as low as 0.39-0.40% of the country's GDP.
Per capita insurance premium in India is a mere US$ 6, one of the lowest in the world. In South Korea, the corresponding figure is US$1,338, in USA it is $ 2250 and in UK it is $1589.
Insurance premium as a percentage of savings is barely 5.95 per cent in India compared to 52.5 per cent in the UK. The paper attempts to ascertain the investment preference with regard to policies and
Is it Really a Viable Option to Invest in Insurance Products? A Study of ICICI Prudential Life Insurance in Dehradun
Amit Adlakha *
ABSTRACT
Globalization has brought with it a host of opportunities and challenges that have led to the emergence of innovative practices that allows business and public services to operate at a high growth rate. This has rewritten the risk factors and insurance gateways. The macroeconomic studies reveal that the risk and insurance coverage awareness in India whose population is in excess of 1.1 billion is precariously low and as uncertainty prevails in the present business landscape, insurance looks indispensable. With only 3.2% of country's population within the bracket of insurance (which in most of the advanced countries is 100%) providing an insurance cover to every common citizen of the country appears to be a Herculean task for the policy makers as well as the insurance agents. This would require customized policies and plans catering to the requirements of different sections of society along with well defined and time tested channels of distribution. A modest attempt has been made in the paper to ascertain the investment preference of the consumers based in Dehradun, assess factors that influence their investment decisions and the level of satisfaction they obtain out of their investment choice.
* Faculty of Management, ICFAI University, Dehradun
brands available in the market, with specific reference to ICICI Prudential Life Insurance.
About the Industry
To safeguard the interests of the holders of insurance policies and to establish an authoritative body to regulate, promote and ensure orderly growth of the insurance industry, Insurance Regulatory and Development Authority (IRDA) was established by an act of Indian Parliament known as IRDA Act 1999. The Insurance Regulatory and Development Authority (IRDA) is a national agency of the Government of India, based in Hyderabad. The insurance industry has witnessed a rapid growth since 2001 with the participation of the private players, employment and career options have also increased since then leading to the growth of the industry at a higher pace.
Penetration of Insurance
Life insurance penetration in India was less than 1 per cent until 1990-91 and increased to 2.53 per cent in 2005, and to 3 per cent in 2006-07. While the impetus for growth has come from both public and private insurers, the number of players in this segment have also increased to 25 (24 in private sector), with Life Insurance Corporation (LIC) still being the dominant player (market share of over 74 per cent). The general insurance industry grew at 11.6 per cent
"Pragyaan : JOM" Volume 7 : Issue 2, Dec 2009 64

between April and November in 2007-08 with robust performances by private players. The 13 non-life insurers collected US$ 4.7 billion in premium against US$ 4.2 billion in the same period last year. Private sector players' market share has grown to about 40 per cent in FY08 as compared to the public sector's 60 per cent.
Company Profile of ICICI Prudential Life Insurance
ICICI Prudential Life Insurance Co. Ltd. is a joint venture between ICICI Bank, India and Prudential plc, U.K. It started its operations in December, 2000 and is the first life insurer in India to receive a National Insurer Financial Strength rating of AAA from Fitch ratings. The company offers a wide range of products coverings all the segments of the market and is a market leader offering a varied range of products but still has a long way to move ahead in order to create the overall positive impact.
Product Portfolio
1. Insurance Solutions for Individuals
ICICI Prudential Life Insurance offers a range of innovative, customer-centric products that meet the needs of customers at every stage of life. Its products can be enhanced with up to four riders, to create a customized solution for each policyholder.
2. Savings & Wealth Creation Solutions
It offers a wide range of options to build savings for future for various productive purposes like
3. Protection Solutions
These are plans such as Home Assure to protect the insured family against the loss of his/her income (Life Guard) or the burden of a loan especially home loan in the event of unfortunate demise, disability or sickness of the insured.
4. Education Solutions
The plan provides guaranteed educational benefits to a child along with life insurance cover for the parent who purchases the policy. The policy is designed to provide money at important milestones in the child's life.
5. Retirement Solutions
save 'n' Protect, Cash Back, Life Time Gold, Life Stage RP, Life Link Super, Premier Life Gold, Invest Shield Life New and Invest Shield Cash back.
The plans provide security for the future and give assurance to lead a peaceful and happy life after retirement like Forever Life, Life Time Super Pension, Life Stage Pension, Life Link Super Pension, Immediate Annuity and Premier Life Pension.
6. Health Solutions
Under this umbrella the company provides various solutions for an individual person to assure peace for him/her against any mishappening. The various plans are Health Assure Plus, Cancer Care, Cancer Care Plus, Diabetes Care, Diabetes Care Plus, Hospital Care and Crisis Cover.
Objectives of the Study
? To determine the investment preference with regard to various insurance policies and plans those are available in the market.
? To ascertain factors influencing the investment decision of the investors when they make an investment decision.
? To find satisfaction level of customers with regard to the channels of distribution and the various saving modes of investment.
Research Methodology
To analyze a group of individuals and depict similar characteristic or attributes in them required a descriptive study. It required describing the characteristics of a particular individual or group; estimate the degree of similarity between the individuals' behavior and their corresponding percentage. The research involved a study on the awareness of the investment products available with specific relation to ICICI Prudential Life Insurance Company.
Nature of Data
The researcher has made use of the primary data collected through a survey method to carry out the research process. The survey was conducted on investors with the help of MBA students who were specially trained for the purpose. A well structured questionnaire (as shown in the annexure) was developed for conducting the study. The questionnaire was divided into two parts. First part was designed to obtain demographic information about the respondents' age, income and profession etc. and the second part contained closed-ended questions relating
"Pragyaan : JOM" Volume 7 : Issue 2, Dec 2009 65
Institute of Management Studies, Dehradun
to various parameters on which investors' opinion was taken. A sample size of 100 was chosen keeping in mind not only the time factor but also the area of coverage. The primary data collected through the questionnaire was directly administered by the researcher when filled by the respondents.
Locale of the Study
The study was conducted in Dehradun during the month of March-April, 2009.
Limitation of the Study
? Time Constraint: The Study was conducted in the month of March-April, 2009 so the conclusions drawn analysis made pertain to the information obtained during this period of time only.
? Possibility of sampling error: Sample selected for study was gathered on the basis of convenience sampling and may not be the true representative of the population studied.
? Dependency on questionnaire: During the research the sole method of data collection has been questionnaire, this may have limited the data collection to the extent of data generation through this method.
? Limited sample size: A sample size of 100 may not be an appropriate representative of the population, and so the conclusion may be different from the real scenario.
Analysis and Inference of the Study
The following is an analysis of the responses received.
(1) Age of the Respondents
About 40% of the investors were in the age group 31-45. Though the people in the age group 31-45 invest more, the volume of their investment is low in comparison to that of their counterparts who are under 30 years of age.
Age of Respondents No of Percent Respondents (%)
Under 30 years 20 2031-45 years 40 4046-60 years 30 3060 years & above 10 10
Total 100 100
(2) Annual Income of Respondents Annual income helps to depict the amount of
the investment that can be made by an investor. Some of the respondents were initially slightly reluctant to disclose their annual income and had to be convinced to do so. It was observed that most of the respondents were having an annual income between Rs3-5 lakh and respondents with an annual income of Rs10 lakh and above were the least.
Annual Income of No of PercentRespondents Respondents (%)
Less than Rs.100,000 10 10
Rs1-3 lakh 10 10
Rs.3-5 lakh 70 70
Rs5-10 lakh 6 6
Rsd10 lakh & above 4 4
TOTAL 100 100
(3) Influence behind Investment Preference
These days, high cost of living takes away a substantial part of the income in order to meet the daily expenses. So, to minimize the burden of Income Tax, the investors prefer investing in plans that best suit their requirements. The study depicted that the most preferred plans of ICICI Prudential were the Pension Plan and Tax Saver Plan which confirms that the main objectives behind purchasing an Insurance plan are old age security and saving of income tax.
Insurance Plans No of PercentRespondents (%)
Protection Plan 20 20
Investment Plan 10 10
"Pragyaan : JOM" Volume 7 : Issue 2, Dec 2009 66
Is it Really a Viable Option to Invest in Insurance Products?...

Pension Plan 30 30
Saving Plan 14 14
Tax saver plan 26 26
TOTAL 100 100
(4) Preferred Distribution Channel for Investment
The chart below shows that amongst the various distribution channels that provide Insurance plans the most preferred channel of distribution is selling of insurance plans through corporate agents as most of the investors desire to be properly educated about various insurance plans that best fulfill their requirement in their leisure time before they finally make up their mind about purchasing a particular plan.
Channel No. of People
Corporate Agents 10
Agents 20
Blue Chip 6
Bank 14
All 50
(5) Preferred Mode of Investment
The below table depicts the preferred investment mode of the respondents. It was observed after the analysis that maximum people prefer investing on a monthly basis, some save once in three or six months and others as and when they have a cash surplus.
Investment Mode No of PercentRespondents (%)
Monthly 40 40
Once in three months 14 14
Once in six months 10 10
As and when Surplus 36 36
TOTAL 100 100
(6) Investment Decision
The below table depicts the choice of opinion leaders or the influences for making an investment decision. It has been observed after the survey that the major investment decisions towards the purchase of an insurance plan are taken after consulting the friends or relatives. Banks are still not the most preferred choice for making an insurance policy decision.
Investment Mode First Second Third
Banks 6 3 0
Friends 26 10 0
Relatives 19 8 0
Corporate Agents 10 1 2
Others 15 0 0
(7) Awareness Level
Most of the people were aware of the Insurance Company ICICI Prudential as nearly 90% respondents answered positively, which means awareness level of ICICI Prudential amongst the people of Dehradun is very high.
"Pragyaan : JOM" Volume 7 : Issue 2, Dec 2009 67
Institute of Management Studies, Dehradun
Awareness Level Response Percent (%)
Aware of ICICI Pru 90 90
Not aware of ICICI Pru 10 10
TOTAL 100 100
(8) Reason for Investment in Insurance Products
All the respondents preferred to invest, and their most preferred plan was Tax saving plan. Investors rated tax saving as their first preference followed by home security. After home security they preferred children plan and some gave second preference to children plan and then home security.
Investment Purpose No. of People
Tax Planning 31
Planning for home 21
Provide for children's education 21
Regular Post retirement Income 27
Findings
? Most of the Investors asserted that they should be guided properly while making an investment decision. About 90% respondents were aware of the various products of ICICI Prudential and their associated benefits.
? Awareness level that the private insurance companies have created in Dehradun is quite high. But a considerable percentage of people are still reluctant to invest in them as they have a pre conceived notion that private organizations often get involved in scams and fraudulent activities.
? In case the cash surplus available is on much higher side, majority of investors particularly large and established businessmen prefer investing their funds in immovable properties.
Conclusions and Suggestions
? The company has already generated a lot of awareness in the city. It's highly Customized product portfolio that is catering well to the requirements of investors. It is supplemented with aggressive marketing skills that is helping it capture a larger market share in comparison to its competitors.
? The company can further accelerate the pace of change through creation of loyal customers by making them realize that private insurance companies an equally safer bet as LIC.
? Relationship today matters a lot as customers have tendency to stick with the brand even if it is beyond the objective and subjective assessment of it's worth. The challenge lies in regaining a lost customer through win back strategies and strengthening customer retention.
? The company should provide information to it's customers about its new offering. They can make follow-up calls and request them visit to their websites.
? The e-marketing tool can be used effectively by banks; e-mails can be sent to those people who are having salary account at ICICI Prudential as this would improve the conversion rate. Further opening up the sector would mean development of new products, better distribution channels and improved customer service. This would force both new and existing players explore new distribution and marketing channels. Potential buyers for most of the insurance companies, including ICICI Prudential, are in the middle class. So insurance products catering to the requirements of this segment should be appropriately developed after working out the various benefits and the policy premium threadbare. In the past three year, the insurers have already begun to target niches like pensioners, women and children to mobilise the untapped potential market.
"Pragyaan : JOM" Volume 7 : Issue 2, Dec 2009 68
Is it Really a Viable Option to Invest in Insurance Products?...

Reference:
Donald R, Cooper and Pamela S and Schindler (2005), Business Research Methods, Tata
thMcGraw Hill, 8 Edition, p.857.
R Subramanian (2008),“Is Investment in Insurance Products A Worthwhile Option?A
Study based on HDFC Standard Life Insurance Plans”, The ICFAI journal on Risk and Insurance, Vol. 2, No.2,pp.21-29
Subroto Roy and William E James (1992), Foundations of Indian Economy: Towards
An Agenda for the 1990's, Sage Publications India Private Limited, p. 304.
www.indiaonestop.com
www.iciciprulife.com
www.irda.com
www.wikianswers.com
"Pragyaan : JOM" Volume 7 : Issue 2, Dec 2009 69
Institute of Management Studies, Dehradun
? Adlakha, Amit; Faculty of Management, ICFAI University, Dehradun.
? Aggarwal, P. K; Professor, IILM, Noida (UP).
? Agarwal, Roli; Research Scholar , LDCITS, Allahabad.
? Gupta, Omdeep; Assistant Professor, Department of Management, Institute of Management Studies, Dehradun.
? Gupta, Sunil; Assistant Professor, SOMS, IGNOU, Maidan Garhi, New Delhi.
? Gupta, Yashwant; Professor, Department of Finance Accounts, Institute of Management Studies, Himachal Pradesh University, Shimla, H.P.
? Kalaiselvan, K; HR Trainee, SABMiller India (Unit: SICA Breweries), Pondicherry.
? Khare , Arpita; Associate Professor, LDCITS, Allahabad.
? Kumar, Arun; Assistant Professor, Saranathan Engineering College, Trichy.
? Mamgain, Pradeep; Lecturer, Department of Business Management, H.N.B.Garhwal University, Srinagar, Uttarakhand
? Mani, B.Tamil; Reader, Gandhigram University, Dindugul.
? Narayan, Beena; Assistant Professor(Economics), Indian Educational Society's Management College and Research Centre Bandra Mumbai.
? Ravichandran, K; Assistant Professor, King Saud University, Saudi Arabia.
? Sharma, Ajay Kumar; Librarian, Institute of Management Studies, Dehradun.
? Sharma, R.K; Professor, IITM, Institutional Area, JanakPuri, New Delhi.
? Singh, Poonam; Department of FRM, College of Home Science, Chandra Shekhar Azad Krishi Evam Prodyogik Vishwa Vidyalaya, Rawatpur, Kanpur, Uttar - Pradesh.
? Singh, Saurabh; Assistant Professor, College of Agribusiness Management ,G. B. Pant University of Agriculture & Technology Pantnagar.
Our Contributors

Invitation and Guidelines for Contributors
PRAGYAAN : Journal of Management, is a biannual publication of IMS, Dehradun. Its objective is to create a platform, where ideas, concepts and applications related to Management can be shared. Its focus is on pure and applied research on emerging issues in management.
The articles are invited from academicians, practicing managers and research scholars.
Guidelines for Contributors
1. Manuscripts should be submitted preferably through email or in duplicate and should not ordinary exceed 5000 words. These must be typed on one side of the page only, with double spacing and a margin of 1.5 inches on both sides.
2. Articles which are published should not be reproduced or reprinted in any from either in full or in part without the prior permission of the editor.
3. Wherever copyrighted material is used, the author(s) should be accurate in reproduction and obtain permission from the copyright holders if necessary.
4. Papers submitted or presented in a seminar must be clearly indicated at the bottom of the first page.
5. Notes should be consecutively numbered and references alphabetically arranged and presented at the end of the article on separate sheets of paper, and not at the foot of each page.
6. The articles can fall into any one of the following types research based articles on management (with executive summaries), case studies, book reviews, letters to the editors, and interviews with academicians / senior corporate managers or CEOs.
7. The format of references should be as follows:a) Journal article : Saravanan, T (2005). "Cyber Laws in India: A case of the IT", SERLS Journal of
Information management, 42 (3), 281-284.b) Books : Moore, David S. et. al. (2003). Practice of Business Statistics, NY : Freeman.c) Internal : Basu, I. (2004). India's thorny FDI rule under scrutiny. Asia Times May 28.
http://www.atimes.com/atimes/South_Asia/FE28Dfo3.html.
8. Present each figure and table on a separate sheet of paper. All figures and tables must be consecutively numbered using Arabic numerals with appropriate titles.
9. Write numbers in figures (rather than words) for exact measurement and series of quantities, including percentage. Use thousands and millions rather that lakhs and crores.
10. Book review must contain the name of the author and the book reviewed, place of publication and publisher, date of publication, number of pages and price.
11. A brief resume of the author/s should accompany the research articles.
All manuscripts should be addressed to :
Dr. Shruti NagarEditorPRAGYAAN : Journal of Management
Institute of Management StudiesMakkawala GreensMussoorie Diversion RoadDehradun - 248009 Uttarakhand (India)Phones: 0135-2738000, 2738001, 6454003 E-mail : [email protected] [email protected]
12. Authors are required to send a duly signed copyright undertaking by post after sending the soft copy of their manuscript.
To The EditorPragyaan : Journal of Management,Institute of Management Studies,Makkawala Greens, Mussoorie- Diversion Road,DehradunPin- 248001, UttarakhandPh: (M) 09897910917Fax: +91-0135-2738005
Sir,
Sub: Assignment of Copyright
I/We, _____________________________________________________________________, author(s) of the
article entitled ____________________________________________________________________________
do hereby authorize you to publish the above said article in PRAGYAAN: JOURNAL OF
MANAGEMENT.
I/We further state that:
1) The Article is my/our original contribution. It does not infringe on the rights of others and does
not contain any libelous or unlawful statements.
2) Wherever required I/We have taken permission and acknowledged the source.
3) The work has been submitted only to this journal PRAGYAAN: JOURNAL OF MANAGEMENT
and that it has not been previously published or submitted elsewhere for publication.
I/We hereby authorize you to edit, alter, modify and make changes in the Article in the process of
preparing the manuscript to make it suitable for publication.
I/We hereby assign all the copyrights relating to the said Article to the Institute of Management
Studies, Dehradun.
I/We have not assigned any kind of rights of the above said Article to any other person/Publications.
I/We agree to indemnify the Institute of Management Studies, Dehradun. against any claim or
action alleging facts which, if true, constitute a breach of any of the foregoing warranties.
First author Second author Third author
1. Name: 2. Name: 3. Name:
Signature: Signature: Signature:

SUBSCRIPTION/ADVERTISEMENT RATES
The Subscription rates for each of our three journals, viz., Pragyaan: Journal of Management, Pragyaan: Information Technology and Pragyaan: Mass Communication are as follows:
Advertisement Rates (Rs.)
1 Year 3 Years 5 YearsCategory Domestic
Rates(Rs.)
Foreign Rates (US $) (US $)(US $)
Domestic Rates(Rs.)
Foreign Rates
Domestic Rates(Rs.)
Foreign Rates
Academic Institutions
500 30 1200 75 2000 120
Corporate 1000 60 2500 150 4000 240Individual Members
400 25 1000 60
1600 100
Students 300 20 700 40 1200 75
Location/Period 1 Year 2 Years 3 Years B/W (Inside Page) 10,000/- (2 Issues) 18,000/- (4 Issues) 25,000/- (6 Issues)Colour (Inside Back Cover)
17,000/-
(2 Issues)
30,000/-
(4 Issues)
45,000/-
(6 Issues)
Single Insertion (1 Issue) (Inside B/W Page) - Rs.5000/-
Please cut out and mail along with your cheque/DD to: The Registrar, Institute of Management Studies, Makkawala Greens, Mussorrie Diversion Road, Dehradun 248009, Uttarakhand , India
Phone No. 0135-2738000, 2738001, 6454003
Date: ____________ Signature (individual/authorized signatory)
Please send the amount by DD/Local Cheque favouring Institute of Management Studies Dehradun, for timely receipt of the journal. Outstation cheques shall not be accepted.
A bank draft/cheque bearing no ________________ dated_____________ for Rs. ________ Drawn in favour
of Institute of Management Studies, Dehradun towards the subscription is enclosed. Please register me/us for
the subscription with the following particulars:
Name ____________________________________________________________ (Indiviual/Organisation)
Address_______________________________________________________________________________
______________________________________________________________________________________
Phone__________________ Fax _________________ E- mail___________________________________
Pragyaan: Journal of Management
Pragyaan: Information Technology
Pragyaan: Mass Communication
SUBSCRIPTION FORM
I wish to subscribe to the following journal(s) of IMS, Dehradun:
Name of Journal No. of Years Amount
Total
ims
IMS at a glance
The recent call for knowledge capital has increased the demand for a quality education specifically in professional courses like management and IT.
With a focus on catering to the demands of modern industry for quality education, Institute of Management Studies, Dehradun started its venture in the year 1996, under the aegis of IMS Society, which is registered body under The Societies Registration Act 1860.
The potential employers of professional students today are looking for visionaries with skills to create future. IMS Dehradun has accordingly taken a stride to produce world class professionals. It is totally committed to provide high quality education, enhance the intrinsic abilities, and promote managerial and technological skills of the students.
IMS has been constantly pouring its efforts to upgrade effectiveness of educational process, and is committed to:
• Provide sound academic environment to students for complete learning.
• Provide state of-art-technical infrastructure.
• Facilitate students and staff to realize their potential.
• Promote skills of the students for their all round development.
Since its inception, it has been conducting professional courses in business administration, information technology and mass communication in a best professional manner. These courses are affiliated to Uttarakhand Technical University or HNB Garhwal University, Uttarakhand. Today more than 2000 students are admitted at the Institute in courses like PGDM, MBA, MCA, MIB, MA (Mass Comm.), BBA, BCA, B.Sc.(IT) and BA (Mass Comm.). Our courses, namely, PGDM, MBA and MCA are duly approved by AICTE and Ministry of HRD, Government in India.
The Institute has also taken up activities to facilitate respectable placement for our students. Our Corporate Resource Center (CRC) has been working with the industry to cater to its current needs effectively and the final placement scenario has been phenomenal. Many organizations are showing strong desires to have our students on board as their employees. For all round development of our students, many extra curricular activities are arranged. This is proving to be useful in translating efforts of our students into positive results.
Bringing out this Journal is an effort towards fulfilling our objective of facilitating and promoting quality research work in India.