institute of public health of the institute of public health · institute of public health bulletin...
TRANSCRIPT

No. 4 - 2014
INSTITUTE OF PUBLIC HEALTHBulletin of the Institute of Public Health

2
INSTITUTE OF PUBLIC HEALTH BULLETIN
Head of the Editorial BoardArjan Bregu
Editorial Board MembersGenc Burazeri, Eduard Kakarriqi, Silva Bino,Arben Luzati, Gentiana Qirjako
Assistant EditorsHerion Muja, Kreshnik Petrela
English VersionGenard Hajdini, Lluka Qafoku
Design & Layout Genc Musa
EDITORIAL BOARD

3
INSTITUTE OF PUBLIC HEALTH BULLETIN
INSTITUTE OF PUBLIC HEALTH BULLETIN: 4 - 2014
Teita Myrseli, Artan Simaku, Migena Baci, Silva BinoVisceral and cutaneous leishmaniasis in Albania: retrospective analysis forthe period of 2005-2013 ............................................................................................ 4
Valbona Gjoni, Erjona Abazaj, Luljeta AllaSero-epidemiological investigation of Hydatid disease during the periodof 2009-2013 .......................................................................................................... 20
Lila Shundi, Brunilda Vila, Silvia BinoHepatitis C Genotypes in Albania ............................................................................. 24
Bukurie Gega, Bajram Dedja, Eduard KakarriqiInfant Mortality Rate and Neonatal Mortality Rate and the Gender Balance in births,according to population structure, gender and regions for year-2013 ........................... 27
Alban Ylli, Sonela Xinxo, Jeta Lakrori, Eduard KakarriqiThe characteristics of consumption of some psychotropic medicaments in theelders of city of Tirana ............................................................................................ 33
Roland Shuperka, Aulona ZotajThe bazic control of alcohol and smoking: Screening test for the consumptionof alcohol and smoking ........................................................................................... 37
Alba Merdani, Dorina Çanaku, Prof.Dr.Eduard KakarriqiComparison of theabortion indicator for the years 2009-2013 .................................... 44
TABLE OF CONTENTS

4
INSTITUTE OF PUBLIC HEALTH BULLETIN
Visceral and cutaneous leishmaniasis in Albania:retrospective analysis for the period of 2005-2013
Teita Myrseli, Artan Simaku, Migena Baci, Silva Bino
Department of Infectious Diseases Control
Leishmaniasis is an infectious disease caused by protozoan parasitic transmission-vector of Leishmaniagender. It is a zoonosis that infects people, and dog serves as its reservoir.Leishmaniasis is a general term that is used for diseases caused by all kinds of protozoan Leishmaniagender. Leishmaniasis at human beings is manifested in some different forms, which are dividedinto three entities: visceral leishmaniasis (VL), cutaneous leishmaniasis (CL) and mucus-cutaneousleishmaniasis (MCL). In the Mediterranean region, where our country is included, there are twotypes of clinical forms of it affecting human beings:
· Visceral zoonotic leishmaniasis (VZL- caused from L. infantum) · Cutaneous leishmaniasis (KL caused from L. infantum and L. tropica)
Protozoan Leishmania spp. is present in two morphological forms: amastigote form, which isfound in human beings and in mammal hosts, as well as the pro-amastigote form, found in transmissionvectors and in culture.The clinical introduction varies from asymptomatic forms to those with high mortality. The peoplemost at risk to develop this illness are malnourished children, rural zone population and the personssuffering from immune-deficiency (HIV/AIDS cases). The incubation period is long, of an averageof 3-8 months, but it surpasses 10 years in cases of reactivation of latent infections. The death ratefor the treated cases varies from 2-3%, but there are also countries where the death rate reaches17 %. In the increase of death rate a lot of factors influence, and namely: a late diagnosis, non-adequate medication or treatment (toxicity of medications, of treatment and/or the manifestation ofresistant forms.) For LV medication treatment is recommended amphotericin B, the liposomal form(liposomal amphotericin B,) but because of its high cost, in many countries there are still usedpreparations of five-valence antimony. During the medical treatment and their increase, they causetoxic overdoses that, in addition to pancreatic disorders, they even cause cardiac problems.The responsible virus for Leishmaniasis transition in our country is Phlebotomus spp. VL, that isidentified in the Mediterranean region, which is a zoonose with dog as main reservoir. This infection,which derives from L. infantum is also recorded in cats, horses, pigs and in wild animals such as:foxes, wolves, jackals, bats, different rodents, etc. ZVL infects mainly young children until the age

5
INSTITUTE OF PUBLIC HEALTH BULLETIN
Figure 1. ZVL and CL frequencies during theyears of 2005 -2013
of 4. According to a study made in Albania in the years 1960-1994, there have been registered 2130cases with VL, from which 2040 children and 90 grown-ups, while during the period of 1995-2000there have been 591 new hospitalizations, and 95 cases were grown-ups treated with medicationsin UHCT.This diagnoses were established serologically by IFAT and ELISA methods. The serum has beenseparated from the intravenous blood and the detection of anti-bodies of IgG anti-Leishmania hasbeen made in all the sera. There has been used a commercial and antigen test, which has beenprovided in lab for IFAT by using pro-amastigote of L. Infantum according to the recommendedprotocol of OIE and reference labs of WHO, (ISS-Rome and Crete.) Also there has been used themethod of parasite isolation from the culture. The material taken from spinal-cord and the bones ofpatients was conserved in isolation in terrain Novy MacNeal Nicolle (NNN) and Evans ModifiedTobie (EMTM) and the cultures were examined periodically for the pro-amastigote growth. In thebelow table we are reporting the introduction of epidemiologic situation of ZVL and CL during theperiod of 2005-2013 in Albania, as well as the problems that are connected with the report of thethese zoonological cases of the Institute of Public Health in the monthly overview 14Sh.
The Leishmaniasis spread in Albania during the years of 2005 -2013
Table 1. The cases and incidence of Leishmaniasis in Albania during years 2005 -2013
Number of cases
Case incidence /100000 residents
ZVL 333
10.9
CL 20
0.7
Total 353
11.5
From the above Table we can observe that ZVL is more commonly found in comparison to cutaneousleishmaniasis. There was also observed an accumulative incidence for the years of 2005-2013,which was high, but comparable to other countries in the region before the onset of HIV epidemic.
The ZVL frequencies are shown as high incomparison to CL.In total, during the period of 2005-2013, therehave been reported 353 cases with Leish- mania,form which 20 cases or 6% of the total are CLand 333 cases or 94% of them are VL (p 0.05.)The incidence of ZVL is 10.9 cases/100000residents, whereas the incidence of CL is 0.2cases/100000 residents. The incidence of VLand CL all together is 11.4 cases/100000residents.

6
INSTITUTE OF PUBLIC HEALTH BULLETIN
Table 2. Number of cases for VL and CL 2005 -2013
Years L. visceral L. cutaneous
Total
2005 67
3
70
2006 58
3
61
2007 59
7
66
2008 30
2
32
2009 40
1
41
2010 21
1
22
2011 13
1
14
2012 21
21
2013 24
2
26
Figure 2. Incidences of VL and CL during the years of 2005-2013 in Albania.
The incidence of Leishmaniasis undergoes an observed trend of decrease during the period ofstudy (F-ratio=16.8 p<0.01). The incidence presents a sharp decrease from 2.3 cases/100000residents in the year 2005, to 0.5 cases/100000 residents in year 2011. But at the same time, it isnoticed an increasing trend for years of 2012 and 2013 with 0.7 and 0.8 cases/100.000 residents.

7
INSTITUTE OF PUBLIC HEALTH BULLETIN
2005 2006 2007 2008 2009 2010 2011 2012 2013 Total
Berat 1 1 10 3 1 3 2 3 2 26
Bulqizë 2 5 1 2 1 2 13
Delvin
1 1 2
Devoll
Dib r
1 2 1 4
Durr s
1 1 1 2 5
Elbasan 9 4 5 1 1 2 1 23
Fier 1 1 2 1 1 2 8
Gramsh 1 1 1 1 4
Gjirokast r
2 2 4
Has
Kavaj
1 1
Kolonj
Korç
Kruj
Kuçov
1 1 1 1 4
Kuk s
2 2 2 1 7
Laç 2 2 1 2 1 8
Lezh
2 2 5 1 5 3 3 3 24
Librazhd 5 1 2 1 2 11
Lushnjë
M.Madhe
Mallakast r
1 1 2
Mat 3 1 1 1 1 2 9
Mirdit
1 1 1 1 4
Peqin 1 1
P rmet
2 1 1 4
Pogradec 1 1
Puk
2 2
Sarand
1 1 2 3 7
Skrapar 1 1 1 3
Shkod r
24 22 16 6 5 3 1 77
Tepelen
2 1 3 1 7
Tiran
10 10 10 4 13 4 2 3 7 63
Tropoj
2 2
Vlor
1 4 1 1 7
Table 3. The spread of VL cases according to the localities during 2005-2013

8
INSTITUTE OF PUBLIC HEALTH BULLETIN
2005 2006 2007 2008 2009 2010 2011 2012 2013 Total
Berat 1 1 2 Bulqizë Delvin
Devoll Dib r
Durr s
Elbasan Fier 1 1 Gramsh
Gjirokast r
1 Has Kavaj
Kolonj
Korç
Kruj
Kuçov
Kuk s
Laç Lezh
Librazhd 1 1 Lushnjë 2 1 1 4 M.Madhe 1 1 Mallakast r
Mat Mirdit
Peqin P rmet
Pogradec Puk
Sarand
1 1 Skrapar 1 1 Shkod r
1 1 Tepelen
Tiran
5 1 6 Tropoj
1 1 Vlor
Table 4. The CL number of cases according to the localities during 2005-2013.

9
INSTITUTE OF PUBLIC HEALTH BULLETIN
2005 2006 2007 2008 2009 2010 2011 2012 2013 Total
Berat 1 1 10 3 1 3 3 3 3 28 Bulqizë 2 5 1 2 1 2 13 Delvin
1 1 2
Devoll Dib r
1 2 1 4 Durr s
1 1 1 2 5 Elbasan 9 4 5 1 1 2 1 23 Fier 1 1 1 2 1 1 2 9 Gramsh 1 1 1 1 4 Gjirokast r
2 2 1 Has Kavaj
1 1 Kolonj
Korç
Kruj
Kuçov
1 1 1 1 4 Kuk s
2 2 2 1 7 Laç 2 2 1 2 1 8 Lezh
2 2 5 1 5 3 3 3 24 Librazhd 5 2 2 1 2 12 Lushnjë 2 1 1 4 M.Madhe 1 1 Mallakast r
1 1 Mat 3 1 1 1 1 2 9 Mirdit
1 1 1 1 4 Peqin 1 1 P rmet 2 1 1 4 Pogradec 1 1 Puk
2 2 Sarand
1 2 2 3 8 Skrapar 1 1 1 1 4 Shkod r
24 23 16 6 5 3 1 78 Tepelen
2 1 3 1 7 Tiran
10 10 15 4 14 4 2 3 7 69 Tropoj
1 2 3 Vlor
1 4 1 1 7
Table 5. VL and CL number of cases according to localities, in 2005-2013.

10
INSTITUTE OF PUBLIC HEALTH BULLETIN
Figure 3. The incidence of VL and CL according to localities during the period of 2005-2013(cases/10000 residents)
The highest incidence of Leishmaniasis was found in those localities: Bulqiza (3 cases/10000residents,) Lezha (3 cases/ 10000 residents,) Skodra (4.2 cases/10000 residents.) Also, there areother localities with a high incidence such as Saranda, Tepelena, Berati and Delvina.

11
INSTITUTE OF PUBLIC HEALTH BULLETIN
Map 1. VL and CL incidence of according to localities (cases/10000 residents.)
It is observed that the incidence of leishmaniasis is less than 1 case/10000 residents in localitiessuch as: Big Mountain, Has, Puka, Dibra, Durrës, Kruja, Kavaja, Peqin, Lushnja, Fier, Vlora,Mallakastra, Gjirokastra, Kolonja, Korça, Devolli, PogradecIn localities such as: Tropoja, Kukesi, Mirdita, Kurbini, Mati, Tirana, Elbasani, Librazhdi, Gramshi,Skrapari, Permeti, Delvina the incidence is over 1-2 cases/10000 residents.In localities of Shkodra, Lezha, Bulqiza, Berati, Tepelena, Saranda the incidence is over 2 cases/10000 residents.

12
INSTITUTE OF PUBLIC HEALTH BULLETIN
Table 6. Cases spread out according to residence
City (no,%)
Village (no,%)
Total
ZVL 149 (44.7)
184 (55.3)
333
CL 9 (45.0)
11 (55.0)
20
Total 158 (44.8)
195 (55.2)
353
Figure 4. Distribution of cases by residence
Most of the patients, 195 (55.2%) are resident in village/rural areas compared with 158 (44.8%)patients resident in cities/urban areas, but without significant change (p>0.05.)
Table 7. The spread of cases according to residences in the years
City Village
2005
21
49
2006
22
39
2007
46
20
2008
15
17
2009
15
26
2010
12
10
2011
6
8
2012
12
9
2013
9
17

13
INSTITUTE OF PUBLIC HEALTH BULLETIN
Figure 5. Distribution of cases by residence over the years
It is observed that in years 2005 and 2006 the leishmaniasis was spread in village/rural areas witha significant change with that of city/urban areas, in year 2007 this disease covered urban areas,whereas in year 2008 until the year of 2013 there has not been any significant difference betweenvillage and city (p<0.01.)
Table 8. The spread of cases according to gender
Males (no,%)
Females (no,%)
Total
ZVL 194 (58.3)
139 (41.7)
333
KL 10 (50.0)
10 (50.0)
20
Total 204 (57.8)
149 (42.2)
353
Figure 6. Distribution of cases by gender

14
INSTITUTE OF PUBLIC HEALTH BULLETIN
Most of the patients, 204 (57.8%) are males compared with 149 (42.2%) female patients ,with asignificant difference between them (p>0.05.)
Table 9. The spread of cases according to gender during years
Males Females
2005
43
27
2006
32
29
2007
34
32
2008
20
12
2009
25
16
2010
13
9
2011
9
5
2012
15
6
2013
13
13
Figure 7. Distribution of cases by gender over the years
In the spread of cases according to gender and years, it is not observed a significant differencebetween males and females (p=0.7).

15
INSTITUTE OF PUBLIC HEALTH BULLETIN
Table 10. The spread of cases according to the examination result
Figure 8. The result of examination
Suspected (no,%)
Confirmed (no,%)
Total
L visceral 63 (18.9)
270 (81.1)
333
L cutaneous
5 (25.0)
15 (75.0)
20
Total 68 (19.3)
285 (80.7)
353
Most of the disease cases, 285 (80.7%) are confirmed compared to 68 (19.3%) suspected caseswith significant difference between them, p>0.05.
Table 11. The examination result according to the years
Suspected Confirmed
2005
8
62
2006
5
56
2007
10
56
2008
13
19
2009
13
28
2010
4
18
2011
5
9
2012
5
16
2013
5
21

16
INSTITUTE OF PUBLIC HEALTH BULLETIN
Figure 9. The result of examination by year
It is observed that over all the years of study, were highly noticed the confirmed cases with significantdifference with the suspected, not confirmed cases (p <0.01.)The cases in the monthly overview table 14Sh have been reported as confirmed ones in labs andsuspected ones, because the lab diagnosis of Leishmaniosis is not done in all the localities of thecountry.There exists an act reporting the problem, because some of the cases of the localities are directedfor visits and hospitalization in UHCT.
Table 12. The spread of visceral Leishmaniosis according to the age-groupin 2005-2013
Year
<1year 1-4 5-14 15-44
45-59 60+ Total
2005
6
37
16
5
1
2
67
2006
7
37
8
4
1
57
2007
11
30
13
4
1
59
2008
3
15
7
4
1
30
2009
4
17
8
9
1
1
40
2010
4
13
1
1
2
21
2011
7
4
1
1
13
2012
3
10
6
1
1
21
2013
7
10
4
2
1
24
Total
45
176
67
31
6
7
332

17
INSTITUTE OF PUBLIC HEALTH BULLETIN
Table 13. The spread of cutaneous Leishmaniasis according to the age - group,during the years of 2005-2013
Year
<1year 1-4 5-14
15-44
45-59
60+ Total
2005
1
2
3
2006
2
1
1
4
2007
1
2
3
6
2008
1
1
2
2009
1
1
2010
1
1
2011
1
1
2012
2013
2
2
Total
5
5
8
1
1
20
Table 14. The spread of VL and CL according to the age- group, during the years of 2005-2013
Year
<1year
1-4 year
5-14 vj
15-44 vj
45-59 vj
60+ year
Total
2005
6
37
17
7
1
2
70
2006
7
39
8
5
2
61
2007
11
31
16
7
1
66
2008
3
15
8
4
2
32
2009
4
18
8
9
1
1
41
2010
4
14
1
1
2
22
2011
7
5
1
1
14
2012
3
10
6
1
1
21
2013
7
10
4
4
1
26
Total
45
181
73
39
7
8
353
Figure 10. Number of cases and incidence by age-group of VL and CL.

18
INSTITUTE OF PUBLIC HEALTH BULLETIN
It is observed that the highest incidence has been noted in the age <1 years with 8.6 cases/10000residents, which is followed from the age-group of 1-4 years with 8.3 cases/10000 residents, andthe age-groups of 5-14 years with 1.2 cases/10000 residents.
Table 15. Hospitalization and death frequence
Number of cases Percentage from total (no=353)
Hospitalization
311 88.1 %
Death 2 0.6%
It is observed that 311 or 88.1% of patients are hospitalized.Two patients or 0.6% of them have resulted in death 95% CI (0.2 2.1).
Table 16. The hospitalization and death frequency according to years
Year Hospitalization, N0 (%)
Death
2005 64 (91.4)
2006 58 (95.1)
2007 59 (89.4)
2008 24 (75.0) 1
2009 37 (90.2)
2010 17 (77.3) 1
2011 11 (78.6)
2012 15 (71.4)
2013 26 (100)
Figure 11. Frequency of hospitalization and deaths by year

19
INSTITUTE OF PUBLIC HEALTH BULLETIN
It is observed that in each year have been hospitalized over 71 % of the patients. One death hasoccurred in the year of 2018 and another in 2010.
In conclusion, it is very important to make an early and prompt diagnosis of disease confirmation,which directs in the treatment and immediate medication, as well as into the reservoir control, in ourcountry case of dogs, by creating a National Monitoring Plan, and it will cause the reduction of theoverload of the population diseases. Also, during the reduction of this overload, an important factoris the strict Disease Surveillance covering all the districts of the country.

20
INSTITUTE OF PUBLIC HEALTH BULLETIN
Sero-epidemiological investigation of Hydatiddisease during the period of 2009-2013
Valbona Gjoni, Erjona Abazaj, Luljeta Alla
Echinococcosis or Hydatid disease is a zoonotic cosmopolitan illness of a problematic charactercaused from parasitic gender of Echinococcus. Two of the main forms of the illness in humanbeings are cystic echinococcosis (cystic hydatid disease) and alveolar echinococcosis. Many peopleget infected throughout direct contact with the definite hosts. The period of incubation lasts fromsome months to some years. From the known clinical manifestations of the patients, it has beenreported that in 70% of these cases the right lobe of liver is infected, accompanied with severepain, while in 15% of the cases the inferior pulmonary right lobe is infected, accompanied withbreast pain, cough, temperature; even the exposure to anaphylactic shock has been recorded. In15% of hydatid disease cases, the localization of cysts in other organs has also been recorded, suchas kidneys, spleen, brain, bones, etc.Echinococcosis is often costly and complicate in its treatment, and might require a surgical interventionand/or a prolonged drug therapy. This illness does not have a specific immune-prophylaxis andthere does not exist any chemical prophylaxis. The programs of developing prohibition ofechinococcoses include de-worming (dehelminitation) of dogs, the improvement of hygiene in butcheryshops and the public education campaigns. More than one million people are infected fromechinococcoses, more than one time in their lives. WHO has its own objective in accomplishing theeffective evaluation of strategies for the control of cystic echinococcoses, until the year 2018.This report has brought up the evaluation of results and the profitability for the real data of Hydatiddisease for the professionals of the health system in Albania during the period of 2009-2013, riskfactors, as well as the incidence and prevalence of the illness.The epidemiological databases for the period of 2009-2013 have been collected from the individualreport files of the cases for endemic control of zoonosis, referring to the trinomial person-place-time. The patients, who were diagnosed beforehand with imagery methods or by surgical treatment,were examined with the immune enzymes method ELISA IgG by strictly following the way ofblood taking, keeping and processing in proper time. The patients with susceptible diagnose resultswere lead to a second control with a new serum, two weeks after the first control. For the residualcases after the transition period of 4-6 weeks, there was made again a control of the patients bysero-diagnosing again and by comparing the respective databases.

21
INSTITUTE OF PUBLIC HEALTH BULLETIN
Totali i rasteve të anlizuara të shprehur në %(2009-2013)
In this way, it is possible to differentiate the cases where surgical treatment or chemotherapy havehad their effects in stopping the illness in organism. The estimation and evaluation of the resultswas made according to the basic data of the protocols of diagnosed kits that are in use. The resultsof the analyses were processed using Excel and Health Mapper programs. This has made possiblethe design of the sero-epidemic map, which has a time and geographic space orientation for ourcountry. During the five years of 2009-2013, as a result of the examinations done in the Laboratoryof parasites in IPH, were processed 658 suspected patient sera.The positivity of the cases resulted in the level of 31.4%;11.1% of the analized cases were recidivists.
Relative incidenca of the cases refered to this period (2009-2013), was from 4,1% (2009) to 4.7%(2013); (cases/100000 residents).The level of infestation refered to the gender and age group, is also shown at 45-54 year olds and65+ year olds for females, and 65+ year olds for males.
Sero-positivity according to the age group and gender (2009-2013)
Female
Male

22
INSTITUTE OF PUBLIC HEALTH BULLETIN
In conclusion, we can say that Hydatid disease is spread in different regions of Albania, but themost infected localities remain especially Tirana, Mati, Mirdita, Tropoja and Përmeti.
The geographical spread and sero-prevalence of Hydatid disease for the period of 2009-2013
The highest seroprevalence was recorded in the year 2011(44.5%).Only a positive case was recorded in the age group of 1-4 years old.The females result much more infected than males (61.35%).The highest level of incidence was noticed in the years of 2010 and 2013.

23
INSTITUTE OF PUBLIC HEALTH BULLETIN
Frekuenca e hasjes së Hidatidozës incidenca raste/100 000 banorëpër periudhën 2009-2013
According to this period (2009-2013), the number of new cases has increased in ± 22 patients,more than those recorded in the year 2006, when the number of new cases varied to ±14. The mostinfected organs result to be the liver in 41.54 % and pulmonary organs, in 21.7% of cases.Approximately 85% of the patients are being treated. The clinically or radiologically suspectedHydatid disease cases, and the cases that were practically confirmed by ELISA test, have beencompletely confirmed surgically as such (100%),However, there does not exist until nowadays any study or report of Hydatid disease spread innational level. Such a complex study should have been impossible to be carried out by only oneavailable specialist. It must be mentioned that the collaboration of the human and veterinary medicalauthorities is very important, in order to control zoonoses (especially Hydatid disease as an illnessof special negligence). It is recommended in a special way the test repetition for the patients after the recommended
treatments from the doctors, because the serologic techniques, accompanied with microscopy ofhydrate liquids and the anatomopathology, have provided diagnostic elements in a great number ofcases. Sero-negativity in recidivist patients is recommended to be observed 3-7 years after thetreatment. When the therapy is functioning, an increase of IgG anti-bodies is observed 4-6 weeksafter the post transitory operation period and the chemotherapy of the patients with Hydatid disease,and after that a slow decrease for 12-18 following months. If the increase of serologic valuescontinues after this period, this might orient us towards a regeneration of the illness. The highdensity of the known cases in the city of Tirana is to be related to the intense migration of thepopulation during those years, and it is presumed that the infestation might have occurred in theirearlier habitations. The last WHO reports emphasize the importance that should be given to thecontrol through an effective active surveillance national system, so that to identify the differencesof illness incidence, to the purpose of establishing adequate strategic directions for its control andprevention.

24
INSTITUTE OF PUBLIC HEALTH BULLETIN
Hepatitis C Genotypes in Albania.
Lila Shundi, Brunilda Villa, Silvia BinoDepartment of Infectious Disease Control and Epidemiology
Hepatitis C is a major public health problem worldwide. In Albania, the prevalence of HCV infectionin the population, varies from 0.9 - 1%, and among risk groups it varies from 28-33%. Until 2005,HCV diagnosis and studies in Albania, based on immunological screening methods, such as EnzymeImmuno Assay (EIA), Enzyme-Linked Immunosorbent Assay (ELISA), Recombinant ImmunoblotAssay (RIBA), etc., were insufficient to supplement the laboratory algorithm and epidemiologicalstudies on hepatitis C. In 2006, at the Institute of Public Health (IPH), Laboratory of MolecularBiology (LMB), was established, and its main objectives were the development of molecularmethodologies of research, diagnosis and molecular epidemiology related to HCV, in order to increasethe performance of quality monitoring and control of this infection. In the period 2008-2010, LMBconducted its first study of the molecular epidemiology in Albania to identify HCV circulatinggenotypes in the country and to assess the relative frequency and changes in the distribution ofHCV genotypes, depending on the mode of transmission, age and its correlations with clinicalfeatures in certain risk groups, thus fulfilling the gap in information about this area. HCV genotypesare important epidemiological biomarkers, and may affect the sensitivity and specificity of diagnosticmethods for detection of HCV. Due to geographical agglomeration of certain genotypes, genotypeidentification may serve as a useful tool to detect the source of an outbreak of HCV in a givenpopulation. HCV genotype combination with other biomarkers, such as quantitative assessment ofHCV s RNA, can be useful in the management of hepatitis C in the selection of candidates forantiviral therapy. Thus, genotype is pivotal in determining therapy. Initially it has very importantprognostic significance in predicting the chances for a successful response of the patient to aparticular therapy (patients with genotype 2 and 3 respond better to treatment with antiviral drugsthan those with genotype 1), and along with viral load values, becomes an important factor indetermining the duration of treatment.Molecular methods used in IPH for HCV genotyping are: HCV Genotype Assay (LIPA, Bayer)and HCV Linear Array (Roche). In Albania are identified four main genotypes (1, 2, 3, 4) and theirsubtypes (1a, 1b, 2a / c, 3a, 4a, 4c, 4e). Demographic and viral characteristics, as well as genotypesof all studied groups are presented in Table 1.

25
INSTITUTE OF PUBLIC HEALTH BULLETIN
Variable
Patients with hepatologic problems
Patients with Beta-thalassemia
major
Dialysis Patients
Nr. 160 22 33
Rate men/women 1:1 1:1 2:1
Average age (years) 45 18 46
Age-group (years) 16-73 5-27 22-68
The average level of HCV RNA (IU / ml)
936,000 1,265,000 531,000
Genotypes (%)
1 (1a, 1b, 1a/1b) 57 77 97
2 (2a, 2a/2c) 35 4.5 -
3 (3a) 4 - -
4 (4a, 4c, 4e) 4 18.5 3
Genotype 1 (subtype 1b) is dominant in Albania (65.6%), among all groups and patients who areinfected with HCV infection through blood transfusion or other parenteral exposures. Genotype 2(subtype 2a / 2c), second in prevalence (26%) is most common in the general population and thegroup of patients with hepatological problems. In recent years has been identified in Albania, as inneighboring countries, genotype 4 (5.6%), usually present in Egypt and Central Africa. Genotype 3(2.8%) dominates among the drug users. Regarding patients who underwent antiviral therapy,those with genotype 2 had a better response (95%) to interferon therapy than patients with genotype1 (44%). In LMB conducted studies, it results that the spread of HCV infection in the Albanianpopulation is primarily nosocomial and through blood transfusion and its derivatives. An importantstudy objective about hepatitis C in Albania remains the identification of circulating types in dialysiscenters, as well as their epidemiological relationships.
Table 1: Demographic characteristics, viral ones, and genotypes of the studied population.

26
INSTITUTE OF PUBLIC HEALTH BULLETIN
Figure 1: Models of HCV typing in Albania.

27
INSTITUTE OF PUBLIC HEALTH BULLETIN
Infant Mortality Rate and Neonatal Mortality Rateand the Gender Balance in births, according topopulation structure, gender and regions for year-2013.
Bukurie Gega1, Bajram Dedja1, Eduard Kakarriqi1,2
1. Department of Epidemiology and Health Systems.2. Faculty of Public Health, University of Medicine, Tirana
Infant Mortality Rate (IMR) in Albania for the year-2013 is 7.2/1000 live births. This indicator isshown by the Ministry of Health and INSTAT, by taking into account the hospitals and the officesof civil services as the. source data This indicator would be better reported in the case of a bettercooperation among the reporting entities.
Table 1. Mortality of 0-1 and 1-4 years old according to regions in the country for 2013
Mort 0-1 Mort 1-4
Regions Male Female Male Female
Berat 6.5
5.4
1.6
3.6
Dibër 7.0
13.5
2.8
3.0
Durrës 5.6
4.4
0.6
0.0
Elbasan 5.4
3.6
0.6
0.6
Fier 5.8
2.5
1.7
2.5
Gjirokastër
4.5
0.0
0.0
0.0
Korçë 7.7
3.7
1.0
0.0
Kukës 5.6
2.3
0.0
4.5
Lezhë 3.4
2.8
0.0
0.0
Shkodër 4.3
1.8
1.7
0.9
Tiranë 14.0
7.9
1.8
0.5
Vlorë 9.6
9.0
2.1
1.1
Albania 8.8
5.6
1.4
1.0
28
INSTITUTE OF PUBLIC HEALTH BULLETIN
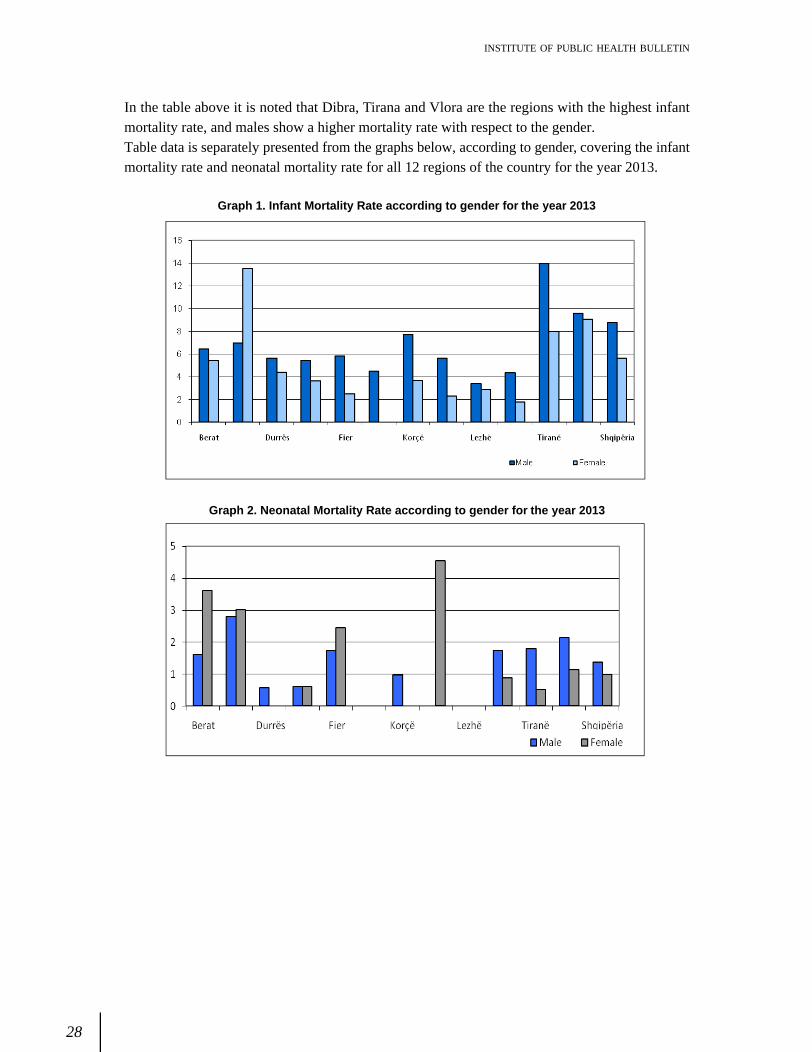
Graph 1. Infant Mortality Rate according to gender for the year 2013
Graph 2. Neonatal Mortality Rate according to gender for the year 2013
In the table above it is noted that Dibra, Tirana and Vlora are the regions with the highest infantmortality rate, and males show a higher mortality rate with respect to the gender.Table data is separately presented from the graphs below, according to gender, covering the infantmortality rate and neonatal mortality rate for all 12 regions of the country for the year 2013.

29
INSTITUTE OF PUBLIC HEALTH BULLETIN
Geographic distribution of infant mortality rate according to regions for the year 2013,
Gender balance by birth is 106 and according to group-age 101.1. This indicator displays a decreasingtrend after the age of 70. A clear explanation is obvious in the table below.

30
INSTITUTE OF PUBLIC HEALTH BULLETIN
Table 2. Gender Balance in birth (m/f)
Regions Gender Balance (m/F)
Berat 112.1
Dibër 107.8
Durrës 110.6
Elbasan 100.7
Fier 105.9
Gjirokastër 103.7
Korçë 95.4
Kukës 120.9
Lezhë 126.9
Shkodër 101.1
Tiranë 106.3
Vlorë 106.0
Albania 106.5
Table 3. Gender Balance according to age-groups for the year 2013
Age-Groups Gender Balance
0-4 108.7
5 - 9 111.6
10 - 14 107.1
15-19 102.5
20-24 115.5
25-29 113.6
30-34 96.2
35-39 90.1
40-44 90.0
45-49 95.0
50-54 98.7
55-59 99.7
60-64 101.1
65-69 103.3
70-74 94.3
75-79 96.6
80-84 79.8
85+ 50.9
Albania 101.1

31
INSTITUTE OF PUBLIC HEALTH BULLETIN
Graph 3. Gender balance according to age-groups for the year 2013
Population report under 15-years old vs. total population is decreasing, and is higher in males thanfemales, but the report for the 65+ years old age-group is higher in females than in males.
The mortality in males in this age-group is higher, but in INSTAT publications for the year 2013, wecan only find data for total mortality.
Table 4. Rates in percentage of specific age-groups for populationof the year 2013
Table 5. Neonatal Mortality Rate according to regions for the year 2013
Age-Group Male Female 0-14 20.6 19.1
65+ 11.1 12.2
15-64 68.3 68.7
0-14 / 15-64 30.2 27.9
65+/ 15-64 16.2 17.8
Regions
Neonatal Mortality
Berat 5.1
Diber 2.2
Durres 5.4
Elbasan 3.0
Fier 3.9
Gjirokaster 2.3
Korce 3.2
Kukes 2.8
Lezhe 0.6
Shkoder 2.6
Tirane 7.0
Vlore 7.4
Total 4.9

32
INSTITUTE OF PUBLIC HEALTH BULLETIN
Neonatal Mortality Rate accounts for 67.3% of infant mortality, therefore health care needs to bemore intensive and continuous during this period. To make comparisons according to gender, wewould need the data for both males and females alike.
Graph 4. Specific weight of infant mortality rate according to age-group

33
INSTITUTE OF PUBLIC HEALTH BULLETIN
The characteristics of consumption of somepsychotropic medicaments in the elders of city ofTirana
Dr. Alban Ylli
Apsychotropic medicament is a natural or a
synthetic substance that reaching the central nervoussystem can cause qualitative and/or quantitative changes. During the absorption in the organism,the psycho-tropes affect not only the central nervous system, but also the other organs. Thereforethe psycho-tropes might cause effects in the brain, as well as in the peripheral nervous system. Thepsychotropic medications are the most consumed medications by the elders, and moreover , thesemedications are used both inappropriately and more frequently by this population group .The consumption of the psychotropic medications in order to improve the health situation of theelders has turned into a case with high consequences in public health.This study gives us information over the level and consumption characteristics of psycho-tropes inelders of 65-74 years old, of the city of Tirana, in comparison to four different populations that havebeen involved in the international study of elderly mobility (International Mobility in Aging Study IMIAS).The data have been taken from the first phase of the study of IMIAS (International Mobility inAging Study) in five cities, which was done during the period September-December of 2012. Inthe study have been involved individuals of 65 to 74 years old, which live in communities of Kingston(Ontario, Canada), Saint Hyacinth (Quebec, Canada), Tirana (Albania), Manizales (Colombia) andNatal (Brazil). Identical procedures and measuring utilities have been used in the five cities wherethe study was developed. IMIAS has taken the approval from the Board of Ethics of each countryand has respected the regulations of ethics of the persons involved in the study. Some individualshave been disqualified from the study, those who used to make 4 or more than 4 mistakes in theprimary questionnaire of orientation (Leganes Cognitive Test LCT), which is a test of dementiaevaluation for populations of low education level.The samples involved in the study:
a) Tirana with about 750,000 residents. In Tirana, the study of IMIAS involved 394 individuals(188 men and 206 women), who were randomly chosen and were invited through thecentral health registers.

34
INSTITUTE OF PUBLIC HEALTH BULLETIN
b) Kingston is a city of 110000 residents in Canada. These individuals (398 total, 186 men and
212 women) were involved in the study through giving an answer to a letter that was sentto them by their family doctor.
c) Saint-Hyacinthe is a small French-speaking town in Canada with around 50000 residents.The recruitment of 401 individuals (191 men and 210 women) was done like in Kingston.
d) Manizales, in Colombia is a city with approximately 450000 residents. In total 400 individuals(198 men and 202 women) were involved in the study in a randomly selection from thepublic health centers.
e) Natal, in Brazil has 402 elders (192 men and 210 women), who were chosen randomly andwhere got involved in this study 5 health centers in 5 neighborhoods of the city.
The variables taken into account in this study
The consumption of psycho-tropes from men and women at the age of 65-74 years old. The interviewed individuals, were asked if they were actually taking any medication? If yes, theywere invited to show the names of the used medications, as well as by verifying the medicationboxes. Only the psychotropic medications have been taken into account in our study. Thesemedicaments were classified as analgesics / anti epileptics / anti Parkinson (N02, N03, N04) inanxiolytics and sedatives / hypnotic (N05B, N05C) and against depression (N06A). The interviewedindividuals have been asked for the medications, which have been taken with a prescription orwithout a prescription from the doctor.Depression: In the study we used the Scale of Depression from the Center of EpidemiologicalStudies measured with 20 points (CES-D), aiming at the evaluation of the depression symptomsduring the prior week. The results are measured in scores and the possible result derived and wasscored in the range of 0-60 points. We have defined the depression in this study, as having a CES-D of equal or greater than 16, which is a sign of a possible diagnose of depression, or of the highdepression risk.The descriptive analysis was used for the surveillance of the data, to show the percentage ofpsychotropic consumption (according to the classes, gender and according to the way how thepsychotropic medicaments were taken) and the percentage of depression present according togender and cities. This data processing study reported interesting results related to the consumptionof psychotropic medications in the elders of the city of Tirana.According to Table 1, the consumption level of psychotropics in the city of Tirana is the same for allmen and women (exactly 29.8 and 30.1). In comparison to the other cities that were included in thestudy, the men in the city of Tirana have a higher consumption level in comparison with the othercities, whereas, the level of consumption of women of Tirana is lower than in Quebec and it is thesame as in Ontario and Manizales.

35
INSTITUTE OF PUBLIC HEALTH BULLETIN
Analgesics take the largest part of the consumed psycho-tropes in Albania by men, as well as bywomen, which is comparable to the Latin American countries, whereas in Kingston the mostconsumed psychotropics are the anti-depressants.The women that live in Tirana report a high percentage of the consumed anxiolytics, around 7.8%compared to the men but also even with the women of other countries, excluding here St. Hyacinthin Canada with a percentage of 12.4%.On the contrary, for the consumption of anti-depressants by men and women of 65-74, who live inthe city of Tirana have been reported the lowest levels of consumption (excluding here men thatlive in Natal of Brazil).
Table 2. Levels of depression according to the cities included in the study (in %)
The cities included in the study
Natal (Brazil)
Manizales (Colombia)
Tirana (Albania)
St Hyacinth (Quebec )
Kingston (Ontario)
m f m f m f m f m f
Depression (CES-D >16 points) 6. 8 37 20. 2
31.7 29. 8 47. 6 38. 7 37.6 8. 1 12.3
Table 1. The consumption of psychotropics according to the population and gender
The kind of psychotropic used
anxiolytic/sedative/hypnotic
Anti-depressants
analgesic
At least one psychotropic
Natal (Brazil)
m
n=192 1. 6 0. 5 2. 6 3. 6
f n=210 3. 3 4. 8 8. 6 14. 8 Manizales (Colombia)
m
n=198 1. 0 7. 1 11. 6 19. 2
f n=202 0. 0 6. 4 24. 3 29. 1
Tirana (Albania)
m
n=188 5. 3 1. 6 23. 9 29.8
f n=206 7. 8 0. 5 24. 3 30. 1
St Hyacinth. Quebec Canada
m
n=191 8. 4 4. 7 12 22. 5
f n=210 12. 4 15. 7 21. 0 38. 1
Kingston (Ontario Canada)
m
n=186 5. 4 13. 4 9. 7 23.7
f n=212 6. 6 17. 0 12. 3 30. 2

36
INSTITUTE OF PUBLIC HEALTH BULLETIN
In Table 2 above are shown the percentages of the risk for depression according to populations. Inthe city of Tirana, the highest level of risk for depression is among women. In the Albanian populationwas identified the highest percentage of risk for women, and it was around 47.6% ,while amongmen the percentage was higher in St Hyacinth in Canada (with around 38.7%).In Table 3 is shown the way of taking psychotropic medications with a prescription or without aprescription according to the populations participating in the study (in %).
Table 3. The level of consumption of psycho-tropes (in %) according to the cities and the way of theirpurchasing (with prescription/without prescription).
The kind of psychotropic anxiolytics/ sedative/ hypnotic
Anti-depressants
analgesic
At least one psycho-trope City
Prescription
Natal with 2.2 2.7 5.2 9
(Brazil) without 0.2 0 0.5 0.7
Manizales with 0.5 6.8 17.5 23.8
(Colombia) without 0 0 1.3 1.8
Tirana with 3.8 0.8 1.5 6.9 (Albania) without 2.8 0.3 23.1 25.1 St Hyacinth with 10.2 10.5 14 28.9 (Quebec Canada) without 0.2 0.2 3.7 4.2 Kingston with 6 15.3 10.1 26.4 (Ontario Canada) without 0 0 1.5 1.5
In conclusion we can say, that in a constant way, for men and women of 65 to 74 years old, thepercentage of psychotropic medications which were taken without prescriptions was higher in theAlbanian population than in the populations of other countries that were involved in this study. Thiswas more emphasized for analgesic medicaments; almost always the analgesics are taken withoutprescriptions and about half of anxiolytics are taken without a prescription as well. Even in the caseof anti-depressants that are taken very rarely from the Albanian elders, around 25% of the casestake those medications without a prescription.In Albania it is identified a higher percentage of the consumption of psycho-tropes compared to thecities of Latin America, and it is comparable with the consumption of the cities in Canada. In thelargest part, the psychotropics are analgesics and in the least, are anti-depressants. In Tirana, in comparison to the other cities, almost all the analgesic medication cases, practically inalmost half of anxiolytics cases and in a considerable percentage also the anti-depressants, areused without a prescription from the general doctor or the specialist. One of the reasons of changingthe method of receiving the psychotropics must be the different method of organizing the purchasingor the reimbursement method of the medications in the countries included in this study.Despite of the fact of a high depression percentage in population groups, compared to other countries,the level of anti-depressants used (such as with prescription or without prescription) in Tirana, ismuch lower compared to this kind of consumption level in the other countries of Latin America orCanada. A more specific analysis is required for this situation, in order to find the reason of thelower level of consumption of anti-depressants amidst the population of around 65 to 74 years old.

37
INSTITUTE OF PUBLIC HEALTH BULLETIN
The purpose of this test is to identify the individuals that consume alcohol & smoke, as well as toprovide the necessary effective intervention.This test is created to be used in the primary health care, where the injuries and the aftermatheffects of alcohol & smoking consumption, might pass without being noticed.The screening test (the risk evaluation of alcohol & smoke) is a questionnaire with 7 questions forthe alcoholic part and 6 questions for the smoking one. It is designed to be administered from onehealth worker, who fills out with a pen on a form-sheet, which requires 5-7 minutes to be administered.This questionnaire is created to obtain information related to alcohol & smoke and determines thedamage level from the consumption. After the evaluation, health workers start to discuss with thecitizen on the alcohol & smoking consumption.The score is characterized with a low, moderate or high risk level. Referring to the testscore, it is defined whether there is no need for treatment, there are short interventions givenor they should be referred to a specialist for treatment.The test might identify a number of problems related to alcohol & smoking consumption, includinghere the acute intoxication in alcohol, as well as the regular consumption and dependence on it, etc.This test gives the level of risk that relates to the alcohol & smoking consumption from the citizen spart, as well as the information details whether the consumption is harmful or will cause harm in thefuture, in the case those will continue to be consumed in the same way.
The score evaluation is made by collecting the points of all the citizen s answers.
1. Test completion and the connection with short interventionsThere have been used many instruments and techniques for the composition of the questionnaire:It is defined as a test which is quickly administered, compared to the existing tests used for thediagnose of the consumed substances; It is a test which distinguishes the consumption of alcohol &
The bazic control of alcohol and smoking:Screening test for the consumption of alcohol andsmoking.
Roland Shuperka,Aulona ZotajThe Sector of Substance-Abuse of Smoking and Alcohol.The Department of Health Promotion. Institute of Public Heath in Albania.

38
INSTITUTE OF PUBLIC HEALTH BULLETIN
smoke; It is a test, which is used in the institutions of primary health care; It is a test that might besimply interpreted and the needed intervention might be determined.The short interventions have proved to be effective and have been much more valuable in themanagement of the problematic alcoholic individuals, by filling the vacuum between the efforts ofthe preventative intervention and the intensive treatment of the individuals with serious disordersbecause of the alcoholic abuse. The short interventions are also effective to ease the heavydependant alcohol cases for a more specialized treatment.The short intervention is used to improve the health of the population and that of the patientsgroups, as well as that of the individuals. When the systematic testing program starts, the approachon the intervention short system shows the way how health workers might use short interventionsto respond to three risk levels: heavy alcohol drinking; harmful alcohol drinking, alcohol & smokingdependence.of short interventions, as part of an effective method on health promotion and prevention of diseasesin community. A lot of smokers might change their behavior of smoking, throughout short consultationswith professionals of primary healthcare. The others need the outside support, which might beoffered from specialized clinics for quitting smoking.
2. The reasons for screening of alcoholic and smoking consumption.The consumption of alcohol and smoking is a heavy burden for the public health in the entire world.The consumption of alcohol & smoking and the risks that accompany their consumption, continuouslyindicate the rise of the risk level, by starting from the level with a lower risk (with non-problematiccases or consumption,) in moderate risk level (regular consumption,) till the highest risk level (frequenthigh risk consumption.) The users with a high risk level or with dependence are easily identifiedfrom doctors. Meanwhile, it is certain that the alcohol & smoking consumption that createdependence, is related to the considerable burden of the illness. Also, the consumers that are notaddicts are a heavy burden for the health system, because damages might be much bigger thanthose consumers that have a dependence on alcohol & smoking. Therefore, the questionnaire isespecially projected to identify and intervene in people, who are using substances in a harmful waythat might be the beginning of the self-harm, including here the risk of advancing to dependence.The main aim of screening is to discover the health problems or factors with high risk, in an early-stage, before the serious illnesses or other problems appear. This questionnaire should be part ofhealth care practice environments to maintain preventative activities.Criteria for Screening:The screening procedure ought to provide:
· an important influence in health and well-being of individuals and community; · an acceptable screening and intervention for individuals that are known-positives for this
test. · early-stage identification accompanied with interventions, which gives much better test-
results than late-stage treatment; · an adequate test in disposition of citizens, which is acceptable from their part.

39
INSTITUTE OF PUBLIC HEALTH BULLETIN
3. Who can use the test?The test is designed to be used by workers of primary health care. The workers of primary healthcare have especially the possibility of identifying the general life-style of the patients, as part oftheir routine work during the health care service they provide, and thus they are a reliable source ofinformation.
4. Which citizens should be screened?This test can be used in many ways to evaluate the alcohol & smoking consumption by citizens. Inan ideal world, all the patients of primary health care must be screened every year for the consumptionof substances, as part of the promotional health programs. In the case when the health workerscreens only those citizens, who he thinks have problems with the consumption of substances, hemight fail to cover all the citizens that have caused self-harm from the consumption of thesesubstances.
5. The problems related to the consumption of substancesThis is the first identifying test that includes alcohol & smoking, and might offer help for the healthcare workers in identifying the risk level of their patients consumption. It is important to mentionthat the harms, which come from alcohol & smoking consumption, cause heavy health problems;social problems for the family, society, law, work, school or individual finances.
6. Specific health problemsHealth workers that administer the questionnaire and that give short interventions must be awareof the frequent consequences caused from alcohol & smoking consumption. The alcohol & smokingconsumption is a risk factor for a great number of health problems and it causes many illnesses,incapability and death. Social problems are also related to the alcohol dependence and they includethe destruction of family and friendship relations, as well as the difficulty in the process of studyand/or work. For some people (male over 45-years old and women that have passed menopause),the alcohol consumption in small doses has resulted positive in health, especially in heart diseasereduction in the studies that were made in high revenue countries. When we mention low doses ofalcohol, we can understand the average consumption of 10g of alcohol per day for males and lessthan 10g of alcohol per day for females (one glass of beer contains 13g alcohol, 100 ml wine hasapproximately 9.5g alcohol, 35 ml strong alcoholic drink with 40 % alcohol contains 11 g alcohol).The women who consume alcohol during their pregnancy are in danger to have babies with birthdefects, retarded children in learning and other ways of behavior, as well as children with late mind-formation. The tolerance and the dependence towards alcohol & smoking are developed as a resultof the regular consumption of them. The alcohol consumers, who have created dependence, mightsuffer the symptoms of dependence withdrawal if they reduce or stop consuming alcohol. Thesymptoms of dependence include shivering, sweating, anxiety, nausea, vomiting, diarrhea, sleepingdisorders, headache, hypertension, hallucinations and convulsions.The risk related to the problems of alcohol over the allowed norms includes:Drunkenness, aggressive and violent manners of behavior, accidents and damages, nausea andvomiting; reduction of sexual performance and early aging, digestion problems, ulcers, pancreasinflammations and high-blood pressure; anxiety and depression, difficulties in social relations, financial

40
INSTITUTE OF PUBLIC HEALTH BULLETIN
problems even at work; difficulties in memorization and in problem-solving; birth defects and braindamages in babies who are born from pregnant alcoholic women; temporary brain damages thatresult in memory loss, cognitive deficiency and orientation problems; stroke, muscle and neuraldamages; liver and pancreas illnesses; mouth, lung and breast cancer; and suicide.
Smoking productsConsumption of smoking products is a concerning problem for public health and one of the maincauses of many deaths in the world. The consumption of smoking products is a risk factor for agreat number of health problems and increases the risk of other health complications, such as thehigh blood pressure, diabetes and asthma. The children exposed to cigarette smoking have a higherrisk of health problems such as respiratory infections, allergies, and asthma. Pregnant women thatsmoke cigarettes are in a greater risk of abortion, premature baby birth or to give birth to babieswith low-body weight. Also, the cigarette smoke exposure increases the risk of health problemseven to people who do not smoke.The risks which are related to consumption of smoking products include:Early aging and wrinkles of the skin; reduced physical activity and more time for the body toregenerate after a cold or influenza; respiratory infections or asthma; high blood pressure anddiabetes; abortions, premature babies and babies of low weight; liver disease; chronic lung disease;heart disease, stroke and vascular illnesses; esophagus, mouth, throat, lung and breast cancer.The questionnaire must be administered only with or combined to the other questionnaires, as partof an interview on health, as a questionnaire of a life-style or as part of a medical history.The citizens react in a good way and give exact answers related to the consumption of alcohol &smoking, when the health worker convinces the citizens that he is listening carefully to them. Heought to be friendly, not prejudging or judging the answers; he will show feelings and empathy infront of the citizen; he will provide information about the aim of questionnaire results; he will explaincarefully the reasons of asking for alcohol consumption; and at last he will tell the citizen that he willkeep the confidentiality of his answers.
The interpretation of questionnaire scoreThe questionnaire indicates the risk points for each used substance, so as to initiate a discussion (ashort introduction) with the citizens about substance consumption. The answers for each substancemight be of low risk category, moderate or high risk category. These risk categories indicatethe necessary intervention the citizen ought to undergo ( without treatment, short intervention orthe reference to the specialist and treatment .)
Low riskThe citizens with three or less than three smoking points and (10 or less than 10 alcoholic points)in the questionnaire have a low risk for the problems related to their substance consumptions. Evenwhen they randomly use substances, they do not feel any problems related to the substanceconsumption and they are of a low risk of future problems , if they continue to use the sameconsumption doses.
z

41
INSTITUTE OF PUBLIC HEALTH BULLETIN
Moderate riskThe citizens with smoking points between 4 and 26 and ( 11 and 26 for alcoholic points) are of amoderate risk for health and other problems. They might be experiencing actually some problems.The continuation of substance consumption in these doses might create in the future many healthproblems and other problems in them, including here, even the possibility to create dependence.The risk increases for those that in the past times have had a history with problems and substancedependency.
High riskThe collection of points 27 or more for the citizen of any of the substances (smoke & alcohol),puts this citizen in a very high risk of dependency from this substance and there exists a bigpossibility, that he might suffer health, social, financial, law problems and problems in relations withothers.
7. The choice of treatment, supported in test pointsThe final report chart is filled out in the end of the interview and in the end of the questionnairecompletion. It is used to give conclusions to the citizen about the level of risk for substanceconsumption.
Low riskThe citizens with low risk should take treatment as usual and there might be discussed the testconclusions and points if the time permits. The citizens with low risk or that abstain in substanceconsumption, should be encouraged to continue their behavior in this way.
Moderate riskThe citizens with moderate risk have a necessity to take a short intervention of 3-15 minutes. Theshort intervention gives to the clients the conclusions of the test by using the report conclusion chartand simple motivation techniques. The short interventions have been effective especially in thereduction of the quantity of substance consumption by the citizen.
High riskThe short interventions should be given also to the citizens with high risk. A small interventioncannot be an accomplished treatment in itself for the high risk users. The short intervention mightbe used in this context also to encourage the citizens to contact the specialist for special helprelated with the substance consumption. This help might be given from a specialist, who is involvedin the primary health care institution or for the specialized treatment in HUCT (for alcohol.)The program implementation of screening and short interventions aims at an effective managementof the staff, and includes four main aspects: planning, treatment, monitoring, and conclusions. InAppendix A, we are showing the questionnaire that we used for the evaluation of smoke andalcohol consumption in community.
z

42
INSTITUTE OF PUBLIC HEALTH BULLETIN
Appendix A.The screening test for Smoke & Alcohol consumption
The name of health worker _______________ Health Center___________________ Locality _____________________
The number of the client or Name _______________________ Date ______Gender M
F;
Age: The collected points
Presentation (please read this to the citizen or adjust according to the culture ofyour community)
The questions below are intended to collect information about the experience of alcohol consumption,smoking products during one s life and the substances in the three last months. These substancesmight be smoked, drunk, and inhaled (show the answer chart.) You must be assured that thisinformation is confidential. You should answer the questionnaire chart, before you ask the client.
QUESTION 1| During your life, which from these substances have you used?
a) Smoking products (cigarettes, chewing smoke, ect) No Yes
b) Alcoholic drinks (beers, wine, alcoholic drinks, ect) No Yes
If all the answers are negative: You have not tasted even when you were in school? If the answer is No in all the answers, stop the interview. If the answer is Yes in any of the answers, ask P2 for each of the substances used at any time
QUESTION 2| In the last three months, how often have you used the above mentioned substances.
Nev
er
Onc
eor
twic
e
Eve
ry m
onth
Eve
ry w
eek
Eve
ry d
ay o
r al
mos
t ev
ery
day
a) Smoking Products (cigarettes, chewing smoke, ect) 0 2 3 4 6 b) Alcoholic drinks (beers, wine, alcoholic drinks, ect) 0 2 3 4 6
If all the answers for P2 are never , go to question 6. If one of the substances is used in the last three months, continue with answers 3,4 for every used substance and question 5 for alcoholic drinks.
QUESTION 3| During the last three months, how often have you had a strong desire to use substances?
Nev
er
Onc
e or
tw
ice
Every
mon
th
Eve
ry w
eek
Eve
ry d
ay o
r al
mos
t ev
ery
day
a) Smoking products (cigarettes, chewing smoke, ect) 0 3 4 5 6 b) Alcoholic drinks (beers, wine, alcoholic drinks, ect) 0 3 4 5 6

43
INSTITUTE OF PUBLIC HEALTH BULLETIN
QUESTION 4| During the last three months, how often have you been had health, social, law or financial problems as a result of the substance consumption?
Nev
er
Onc
e or
twic
e
Every
mon
th
Every
wee
k
Every
day
or
almos
t ee
very
day
a) Smoking products (cigarettes, chewing smoke, ect) 0 4 5 6 7 b) Alcoholic drinks (beer, wine, alcoholic drinks, ect) 0 4 5 6 7
QUESTION 5| During the last three months, how often have you failed in making activities that normaly you should have made because of alcoholic consumption?
Nev
er
Onc
e or
tw
ice
Eve
ry m
onth
Eve
ry w
eek
Eve
ry d
ay o
r al
mos
t ev
ery
day
a) Smoking products (cigarettes, chewing smoke, ect) b) Alcoholic drinks (beers, wine, alcoholic drinks, ect) 0 5 6 7 8
QUESTION 6| Is there any concern from your relative or friend about your consumption of smoke & alcohol?
No,
Nev
er
Yes
, in
the
las
t th
ree
mon
ths
Yes
, bu
t no
t in
th
e la
st
thre
e m
onth
s.
a) Smoking Products (cigarettes, chewing smoke, ect) 0 6 3 b) Alcoholic drinks (beers, wine, alcoholic drinks, ect) 0 6 3
QUESTION 7| Have you ever tried to reduce the quantity or to give up the substance consumption, but you have failed?
No,
Nev
er
Yer
, in
th
e la
st
thre
e m
onth
s
Yes
, but
not
in th
e la
st th
ree
mon
ths
a) Smoking products (cigarettes, chewing smoke, ect) 0 6 3
b) Alcoholic drinks (beers, wine, alcoholic drinks, ect) 0 6 3

44
INSTITUTE OF PUBLIC HEALTH BULLETIN
Comparison of theabortion indicator for the years2009-2013
Alba Merdani1, Dorina Çanaku1, Prof.Dr.Eduard Kakarriqi1,2
1 Department of Epidemiology and Health Systems2 Faculty of Public Health, Medical University, of Tirana.
Around 6638 aborts have been reported in total for the year 2013, and that is 1208 less cases thanin preceding 2012. The number of the collected files in IPH from all the reported centers is 4447,representing 67% of the abortion reports, those accompanied with abortion files. A more detailedpresentation of births and abortions in Albania is provided by the table below:
Table 1 Number of births and abortions in Albania (2009-2013)
Year 2009 2010 2011 2012 2013
Births 34.044 33.856 34.297 34.974 33.994 Abortions (number) 9.200 8085 8307 7846 6638 Abortions for 1000 live births 270,2 238,8 242,2 224,3 195,3
The Relation: Births / Abortions
3,7 : 1 4,2 : 1 4,1 : 1 4,5 : 1 5,1 : 1
Notice: The databases over the total birth number have been consulted from Ministry of Health
The above table shows the decrease of birth numbers has brought the decrease of the number oftotal aborts. The rate births/abortions has reached the number of 5, 1:1, which means that in ourcountry approximately for 5 births we have one abortion.

45
INSTITUTE OF PUBLIC HEALTH BULLETIN
Graph 1. Abortions for 1000 live births according to the prefectures for theperiod of 2011-2013
The abortion proportion (abortions for 1000 live births) has decreased in ountry scale, (195,3 forthe year 2013 compared with 242,2 that has been in year 2011). Among the prefectures with themost high proportion of abortions for y. 2013 we can mention Berat (385, 1), Vlora (296,8), thenTirana with (248,6) and Fieri with (244, 6), notwithstanding the absolute number of cases, it ishigher in the prefecture of Tirana with 2908 accomplished abortionss.
Table 2. The Percentage of executed abortions according to the kind of abortion
The kind of abortion (in percentage)
y.2009 y.2010 y.2011
y.2012 y.2013
Pregnancy interruption 51,9 40 36,5
34,4 32,8
Spontaneous Abortion 48,1 60 63,5 65,6 67,2
Table 3. Percentage of abortions according to the woman s age-group
Gr-age y.2009 y.2010 y.2011 y.2012 y.2013 14
19 years old 4,7 5,1 5,1 4,1 6,1 20-
34
years
old
65,5
65,2
65,8
66,7
69,1
Over 35 years old 29,1 25,1 29,1 28,2 24,8 Without Declaration 0,6 4,6 0 1,0 0
Habitation y.2009 y.2010 y.2011 y.2012 y.2013 Urban 67,9 68,6 64,9 65,1 61,2 Rural 32,1 31,4 35,03 34,9 38,8
Table 5. Percentage of abortions according to woman education level.

46
INSTITUTE OF PUBLIC HEALTH BULLETIN
Midis grave që kanë kryer abort në vitin 2013, 28,4% e tyre nuk kanë patur lindje të gjalla më parë;23,8% kanë patur një lindje të gjallë dhe 32,7% e tyre kanë patur 2 lindje të gjalla.
Midis grave që kanë kryer abort në vitin 2013, 28,4% e tyre nuk kanë aktualisht fëmijë, 23,7% etyre kanë nga 1 fëmijë, 32,8% kanë 2 fëmijë dhe 3,5% kanë 4 fëmijë apo më tepër.
Në 2013, 84,1% e aborteve janë nga gra të cilat nuk kishin kryer ndërprerje më parë (aborte mekërkesë), 8,5% janë nga gra që kanë kryer 1 ndërprerje të mëparshme dhe 3,7% janë nga gra me2 ndërprerje të mëparshme.
Në 2013, 90,6% e aborteve janë kryer nga gra të cilat nuk kishin patur aborte spontane më parë,5,6% janë kryer nga gra që kanë patur 1 abort spontan të mëparshëm dhe 1,4% janë kryer nga gratë cilat kanë patur 2 aborte spontane të mëparshme.
Ndër arsyet e ndërprerjes së shtatzënisë, rreth 31,3% deklarohen me kërkesë të gruas dhe 51,6%për arsye shëndetësore të gruas.
Table 6. Percentage of abortions according to the woman employment.
employment y.2009 y.2010 y.2011 y.2012 y.2013
employed 21,6 22,2 18,0 19,0 16,3 Out of work 78,1
77,4
81,2
80,8
83,1
Table 7. Percentage of abortions according to woman health insurance
Table 8. Percentage of abortions according to woman marital status
Years Single Married Separated
Widow Missing
y.2009 6,2 92,5 0,8 0,0 0,4
y.2010 7,0 92,0 0,8 0,0 0,2
y.2011 4,7 93,8 0,7 0,1 0,7
y.2012 6,2 93,0 0,8 0,1 0,0
y.2013 6,3 92,8 0,6 0,1 0,2
Health insurance of woman y.2009 y.2010 y.2011 y.2012 y.2013 Insured 19,5
20,1
16,5
19,8
21,2
uninsured 80,3
79,4
83,0
80,1
78,4
Table 4. Percentage of abortions according to woman habitation
Education level of wife y.2009 y.2010 y.2011 y.2012 y.2013
First Grade 2,6 2,3 2,3 2,8 3,2 8-
year olds
45,5
43,7
47,4
45,9
50,1
Middle Schooling
36,3
36,8
35,8
34,9
31,7
University Level
14,8
15,6
13,5
14,8
13,7
Without Declaration
0,8
1,6
1,0
1,6
1,3

47
INSTITUTE OF PUBLIC HEALTH BULLETIN
Rreth 80% e aborteve kryhen brenda tremestrit të parë të shtatzënisë (më pak se 12 javë). Në vitin2013, 8% e aborteve kryhen në 12-14 javë shtatzënie dhe 9,7% mbi moshën 15 javëshe të shtatzënise.Ndërkohë që për shtatzënitë mbi 22 javë abortet e kryera zënë një shifër prej 2,6%.
Teknika kryesore për kryerjen e abortit në vitin 2013, në 49,4% të rasteve është dilatacion dhekyretazh dhe në 36,2% të rasteve dilatacion dhe aspirim.

BULLETIN Aleksandër Moisiu, Str. 80, Tirana, Albania
E-mail: [email protected] Tel: 04 23 74 756Fax: 04 23 70 058
OF THE INSTITUTE OF PUBLIC HEALTH