instituteof hydrology
TRANSCRIPT

aINSTITUTEof
HYDROLOGY

-..

;.4 v p
FederalCapitalCity .
NIGERIA,
Phasel Area
Flood.Estimates
FEDERALCAPITALCITY
,MGERIA
PHASE1 AREAFLCXJDESTIMATES
May 1980
This report is prepared for
Milton Keynes Development Corporation
by
Institute of Hydrology
Wallingford
Oxon
UK

FEDERALCAPITALCITYNIGERIA- PHASE1 AREAFLOODESTIMATES
Introduction
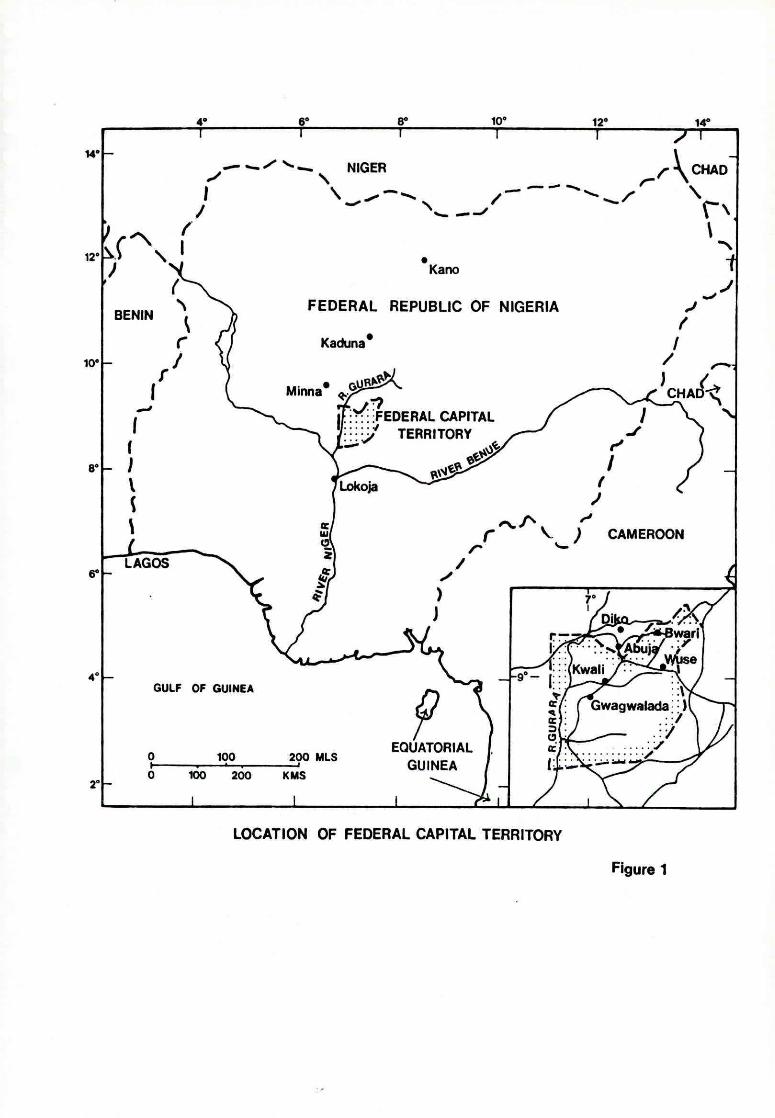
Thisreportprovidesestimatesof the 25and 100yearreturnperiod
floodsforthePhase1 areaof thenewNigerianCapitalCitylocated
in FederalCapitalTerritory(Figure1). The catchmentunderstudy
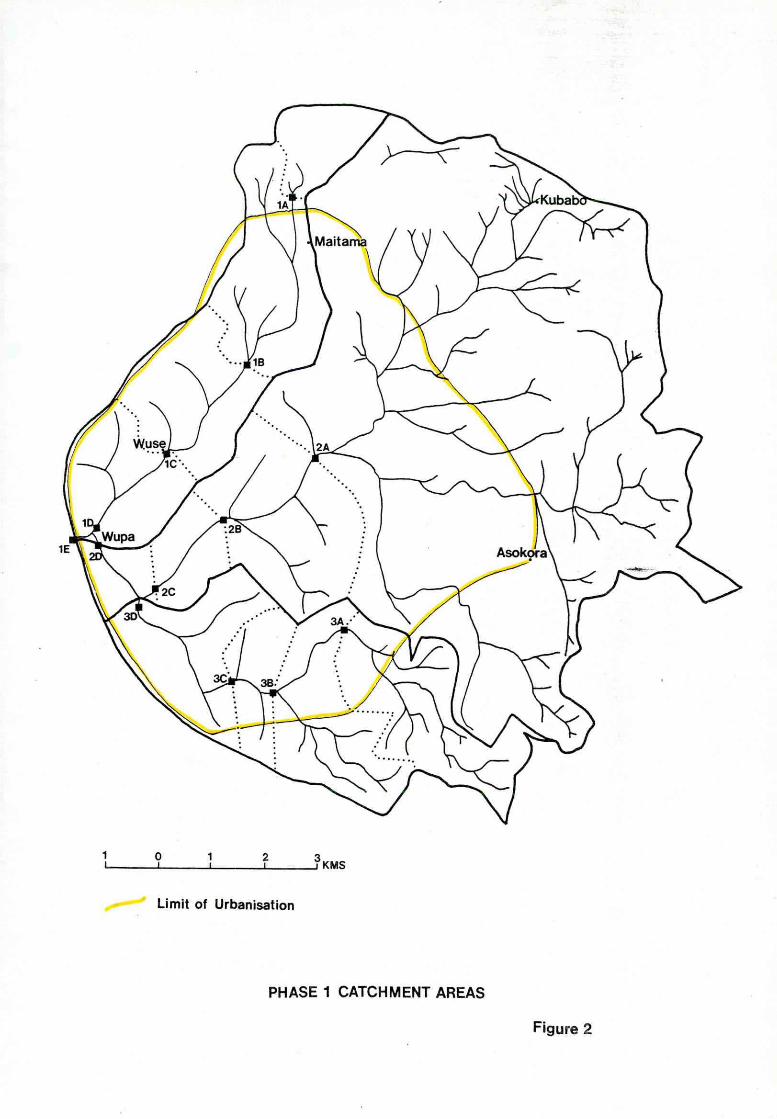
comprisesthreemainrivers;River1 (RiverNdawuse),River2 and
River3. Theseare shownin„Figure2 andhavea totalcatchmentarea
of 103.6sq km. Subcatchmentsandtheirboundariesmarkedon Figure2
indicate13 pointson theriversystemwherefloodestimateshavebeen
providedandthesecorrespondto similarpointson the 1:10,000map
suppliedby the client(Ref5). Threeadditionalpointshavebeen
addedwhereit appearedlogicalto producefloodestimates.Table1
showsthecorrespondencebetweenthetwosetsof annotation.The urban
areashownin Figure2 was definedby theperipheralroadson the
1:10,000map.
To ourknowledgethereareno rainfallrecordsfromwithintheareaand
therehaveonlybeena limitednumber(6)of rivergaugingsat point1C.
In theabsenceof suchdatait hasbeennecessaryto make several
importantassumptions(egpercentagerunoff,rainfallprofile)in order
to estimatethe designfloodhydrographs.Theseassumptionstendto be
conservativeand couldbe reviewedwhenmoredatabecomeavailable.
To assisttheclientwithassessingtheeffectof urbanisingthe catchment,
additionalfloodestimateshavebeenprovidedforall sitesassuminga
natural(rural)catchment.If theseestimates,whichrelateto the
presentstateof thecatchment,canbe seento be reasonableby those
witha localknowledgeof theriversystem,thenthisshouldprovide
additionalconfidencein thevalidityof theurbanisedcatchmentfloods.
A totalof 52 designfloodhydrographshavethereforebeen synthesised
(13sites,2 returnperiods,2 conditions).
We believethatthemostsatisfactorymethodof producingfloodestimates
on thesecatchmentsis by thecombineduse of a unithydrographto
determinethenatureof catchmentresponseandrainfallintensity/duration/
10° 12°14°
NIGER
••••es
,e kCHAD
12°
BENINk
1
10°
k
•Kano
FEDERAL REPUBLIC OF NIGERIA
Kaduna°
Minna q. CHAlcl<• •/' FEDERALCAPITAL
-/TERRITORY
Lokoja
ro
CAMEROON
LOCATION OF FEDERAL CAPITAL TERRITORY
Figure 1
LAGOS
GULF OF GUINEA
100 200 MLS
100 200 /OAS
EQUATORIAL GUINEA
1 01
2 3I I I 0 KMS
Limit of Urbanisation
PHASE 1 CATCHMENT AREAS
Figure 2
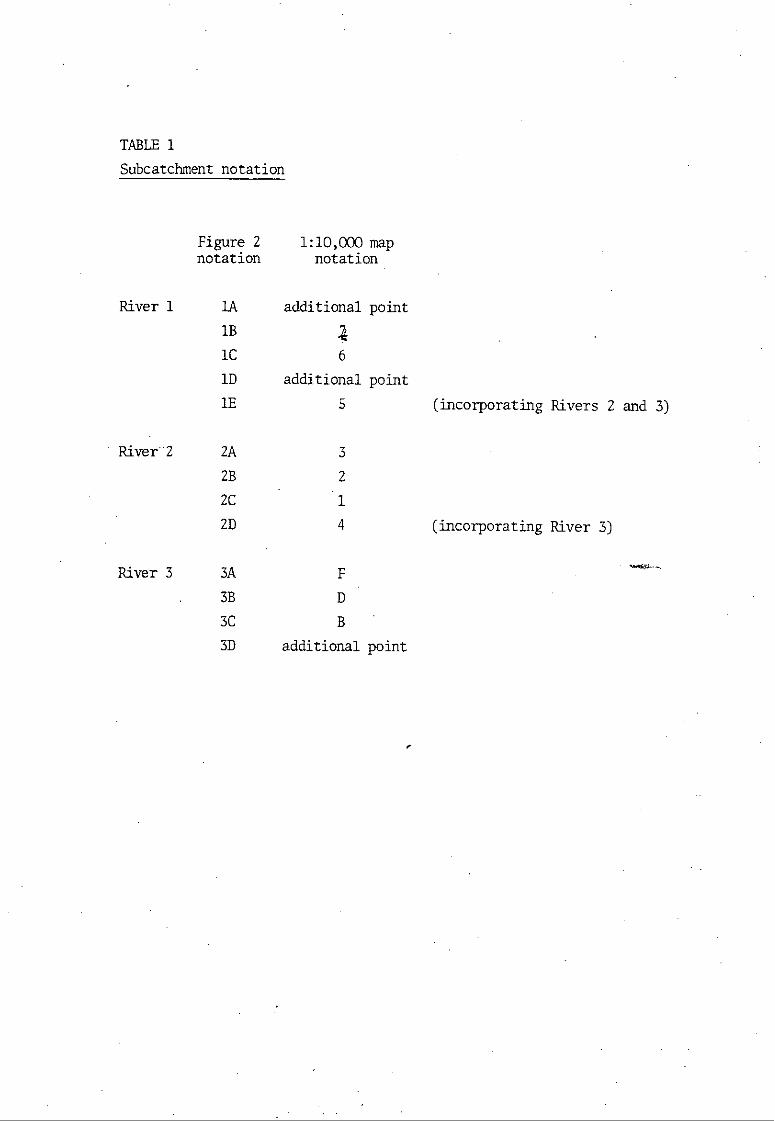
TABLE1
Subcatchmentnotation
Figure21:10,000 mapnotationnotation
River1lAadditional point
1B4
1C6
1Dadditional point
lE5
• River-22A3
2B2
2C • 1
2D4
River33A
3B
3C
3Dadditional point
(incorporatingRivers2 and 3)
(incorporatingRiver3)

frequencyrelationshipsto producerainstormsof thedesiredseverity.
Althoughthisstudyhasmadeextensiveuse of themethodsof analysis
describedin the FloodStudiesReport(FSR)(Ref1),wheneverpossible
localdatahavebeenusedtomodifyrelationshipsfromUnitedKingdom
catchments.
Thepresentreportcontainsa briefdescriptionof theunithydrograph
method,a surveyof the availabledata,and a detailedexpositionof
how the methodwas appliedti thedatato givethe requiredestimates.
Therecommendeddesignpeakflowsare summarizedin Table3 of thisreport.
Completehydrographpredictionsaregivenin theAppendices.
Theunithydrographmethod
Theunithydrographfora particularcatchmentdefinesthe responseto a
unitvolumeof net or effectiverainfallinputovera specifiedtime
interval.In commonwithFSRpracticea unitinputof 10 mm net
rainfallhasbeenusedthroughoutthisreport. The unithydrograph
methodrelyson twomainassumptionsof catchmentbehaviour.
Thereis a linearrelationshipbetweennet rainfalland flood
discharge;ie twicetheraindoublesthe flow.
Theprincipleof superpositionapplies.The finalflood
hydrographmay thereforebe consideredto comprisethe direct
additionof theordinatesof a seriesof unithydrographsscaled
and laggedaccordingto thenet rainfallhyetograph.This
processis calledconvolution.
FloodestimationusingtheFSRunithydrographtechniquemay be summarised
as follows:-
1. Estimatingthe shapeof theunithydrograph.Theunithydrograph
ismostreliablyobtainedfroman analysisof recordedfloodand
rainfalldata fromthecatchmentitself.Thisprocessalsoyields
thepercentagerunoff,ie theproportionof raineffectivein
producingthefloodhydrograph.It is recommended(Ref1, 1.6.8.4)*
thatat leastfivelargeeventsshouldbe usedin theanalysis.
However,in theabsenceof thisdataa syntheticunithydrograph
maybe derivedfromcatchmentcharacteristicssuchas stream
lengthand slopeusinga regressionequationderivedfromgauged
catchmentselsewhere.The FSRprovidessuchequationsbasedon
theanalysisof near15140catchmentsand 1400floodeventsin the
UnitedKingdom.Theseequationshavesuccessfullybeen
appliedto manycatchmentiworldwide.The UnitedKingdompercentage
runoffequationcannotso easilybe transferred(see(3)below).
Defininga suitabledesignstorm. A rainstormof the required
severityis constructedfromlocalrecordsof rainfallandan
assumedrainfallprofile.ForapplicationoutsidetheUnited
Kingdom,rainfallintensity/duration/frequencygraphsarecommonly
usedforrainstormsynthesis.Thisprocessis describedlater.
Estimatingthepercentagerunofffromthe designstorm. An
estimateof thepercentagerainfalleffectivein producingrunofi
is required.Thisismostaccuratelyachievedfromrainfalland
flowrecordson thecatchmentitself.However,if not available,
an approximationmaybe madeby analogyto similarcatchmentsor
by theuseof locallyderivedregressionequationsbasedon soil
type.
Combiningtheunithydrographwiththe (net)designstorm. The
netrainfallprofileis convolutedwiththeunithydrographto
producethe floodhydrograph.To thismustbe addeda slow
responseor 'baseflow'componentof thehydrographbut thisis
usuallysmallby comparisonwiththedirectrunofffrommajorfloods.
Dataavailable
HydrologicalinformationfromwithintheFederalCapitalTerritoryhas
beencollectedand analysedfora waterresourcessurveyundertakenby
* Referencesto theFloodStudiesReportaregivenby volume(Romannumerals),chapterandsection.

H P GauffGmbHandCo,AdejumoOgunsolaandPartnersandNoyuk (Ref2).
Thisreportprovidesan analysisof rainfalldatain the areaand in
particularan intensity/returnperiodgraphfordailyrainfalltotals
fromtheDikoandAbujagauges. Fromthesamereportit is evident
thattheRiverIkuhasbeengaugedat Abujasince1962;however,these
datawerenot directlyavailableto us. Of the17 regulargauging
stationsnewlyinstalledin the FederalCapitalTerritory(Ref2),
one lieswithinthePhase1 areaat point1C (Figure2). The only
dataavailableweresixrivef4gaugingsundertakenin 1978andreported
in thewaterresourcessurvey(Ref2).
MeteorologicalNoteNo 19 of theNigerianMeteorologicalService(Ref3)providesrainfallintensity/duration/frequencycurvesfor 21 stations
countrywide.It is unfortunatethattheonlyavailablecopyof this
Notecontainsjustonecurvenamelythatfor Ilorin.However,as will
be shownlater,it is evidentthaton a dailybasisat least,thereis
closecorrespondencewithAbujaandDikodata.
The followingmapswereusedto determinecatchmentcharacteristics:
1:10,000map coveringmost,butnot all,of the totalcatchment
1:50,000map coveringthecompletearea.
Unithydrographestimation
Sincetherewereno continuousflowrecordsand recordingrainfalldata
fromthesubjectcatchments,it is necessaryto constructa synthetic
unithydrographbasedon catchmentcharacteristics.Usingthe simplest
equationfromthe FSRbasedon streamlengthand slope(Ref1,1.6.5.4)
thetimetopeakof theunithydrograph(Tp)is definedas:
Tp = 2.8( L )°• 47 hours
whereL = mainstreamlengthmeasuredfroma 1:25,000map usingdividers
setto 0.1km spacing(forthisstudythe averagestream
lengthfromthe1:10,000and 1:50,000map was used)
I.
S = slopeof themainstream(m/ku)measuredat 10%and 85%
of L fromthemouthof thecatchment.
A standardtriangularshape(Ref1,1.6.5.2)hasbeenadoptedwherethe
timebase,TB, andpeakdischarge,QP,aredefinedas follows:
TB = 2.52Tp.
QP 220 cumecs/100sqlcmTp
Theserelationshipswerederivedfromabout140catchmentsin theUK.
Thereis almostidenticalagreementwitha similarlysimplifiedtriangular
unithydrographderivedfromAmericandataby theUS SoilConservation
Service.
Throughoutthisreporta timeintervalof 0.25hourshasbeenusedin
producingfloodestimates.Becauseof therangeof sizeof catchments
understudy(2.3km2to 103.61&) a smallertimeintervalwouldnormally
be recommendedforthesmallercatchmentsanda biggertimeinterval
forthe largercatchments.However,tomaintainconsistencyin the
analysisa 0.25hourtimebasewas consideredoptimum.The above
equationdefiningTp was derivedusinga standard1 hourtimeinterval.
The FSR (Ref1, 1.6.4.8)recommendsthefollowingadjustmentto Tp:
new Tp = oldTp + (T-1)/2
whereT = newbasictimeinterval= 0.25hours,therefore
newTp = oldTp - 0.375
Timesto peak foreachof the13 catchmentshavebeencalculatedandare
giveninTable2. It shouldbe notedthatthesevaluesof Tp correspond
to thePurelyruralcatchment.Urbanisationcanhavea dramaticeffect
on boththemagnitudeof peakdischargeand therisetime. Urbantime
to peakis computedfromthefollowingequation(Ref4):
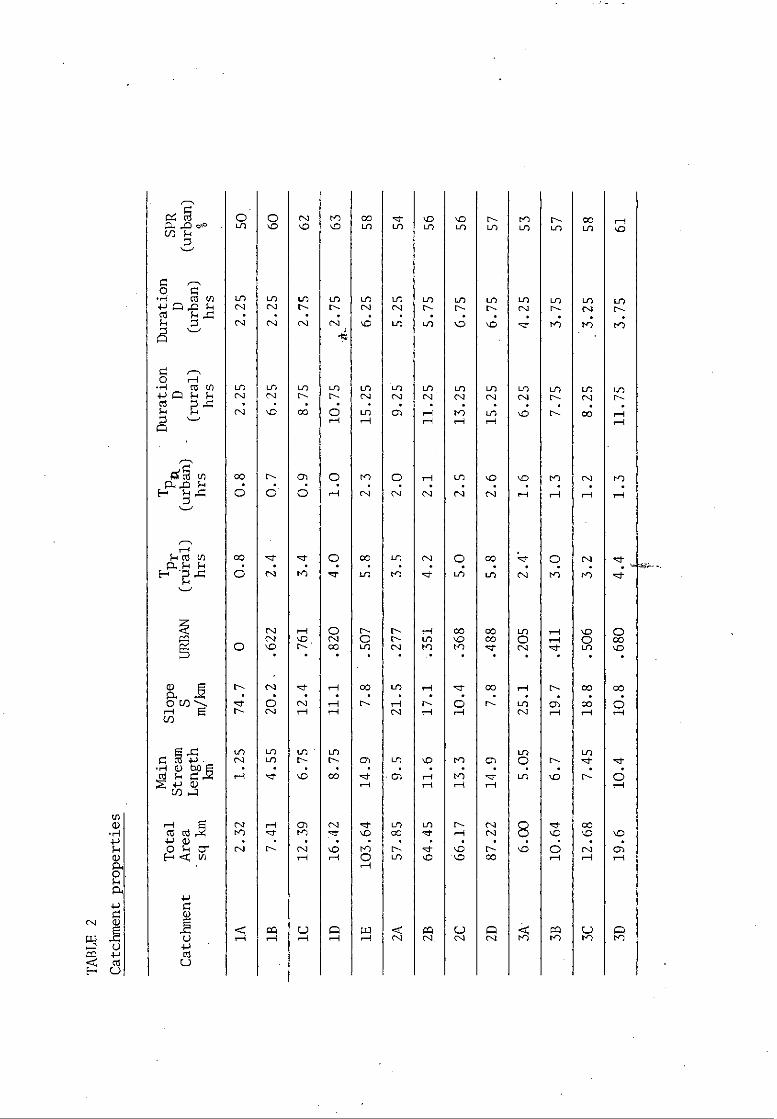
TABLE2
Catchmentproperties
Catchment
Total
Area
sqkm
Main
Stream
Length
km
Slope
S
m/km
URBAN
TPr
(rdral)
hrs
T Ptt
(urban)
hrs
Duration
-(rural)
hrs
Duration
(urban)
hrs
SPR
(urban)
lA
2.32
1.25
74.7
00.8
0.8
2.25
2.25
50
18
7.41
4.55
20.2
.622
2.4
0.7
6.25
2.25
60
1C
12.39
6.75
12.4
.761
3.4
0.9
8.75
2.75
62
1D
16.42
8.75
11.1
.820
4.0
1.0
10.75
2.75
4-
63
lE
103.64
14.9
7.8
.507
5.8
2.3
15.25
6.25
58
2A
57.85
9.5
21.5
.277
3.5
2.0
9.25
5.25
54
2B
64.45
11.6
17.1
.351
4.2
2.1
11.25
5.75
56
2C
66.17
13.3
10.4
.368
5.0
2.5
13.25
6.75
56
2D
87.22
14.9
7.8
.488
5.8
2.6
15.25
6.75
57
Ik
6.00
5.05
25.1
.205
2.4
1.6
6.25
4.25
53
3B
10.64
6.7
19.7
.411
3.0
1.3
7.75
3.75
57
3C
12.68
7.45
18.8
.506
3.2
1.2
8.25
3.25
58
3D
19.6
10.4
10.8
.680
4.4
1.3
11.75
3.75
61
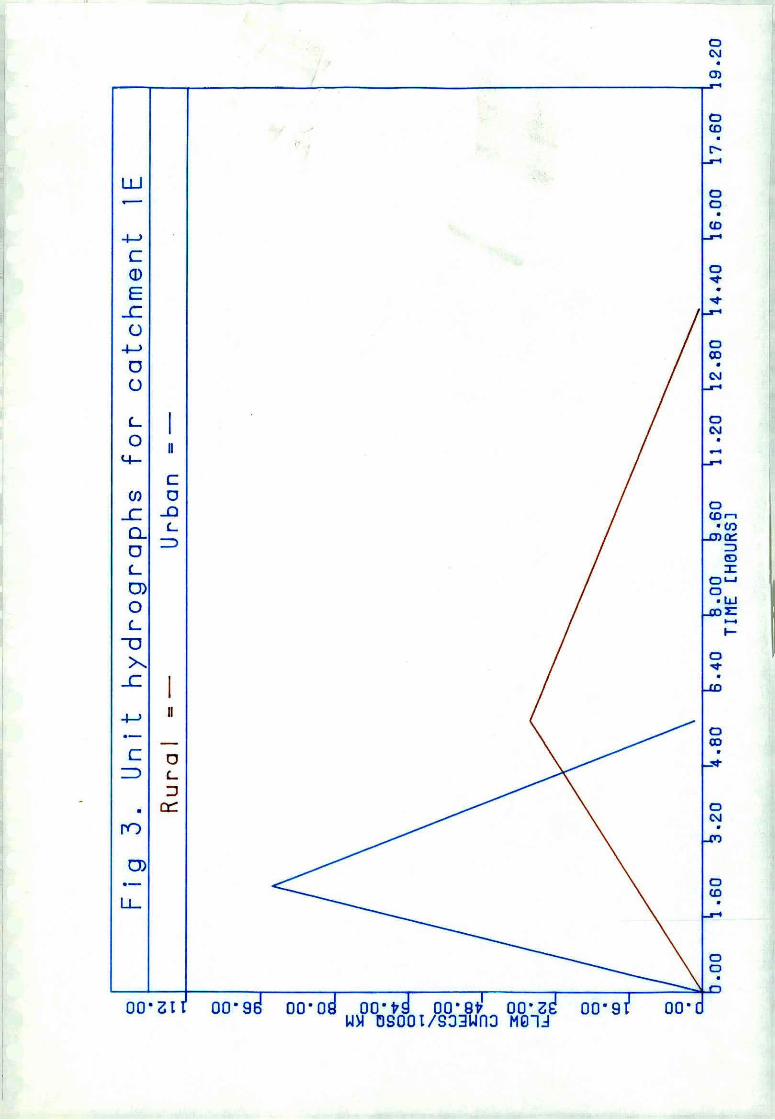
Tpu= Tpr (1+ URBAN)-1.99
where Tpu= urbantimetopeak
Tpr= ruraltimetopeak
URBAN= fractionofthetotalcatchmentunderurbandevelopment(Figure2)
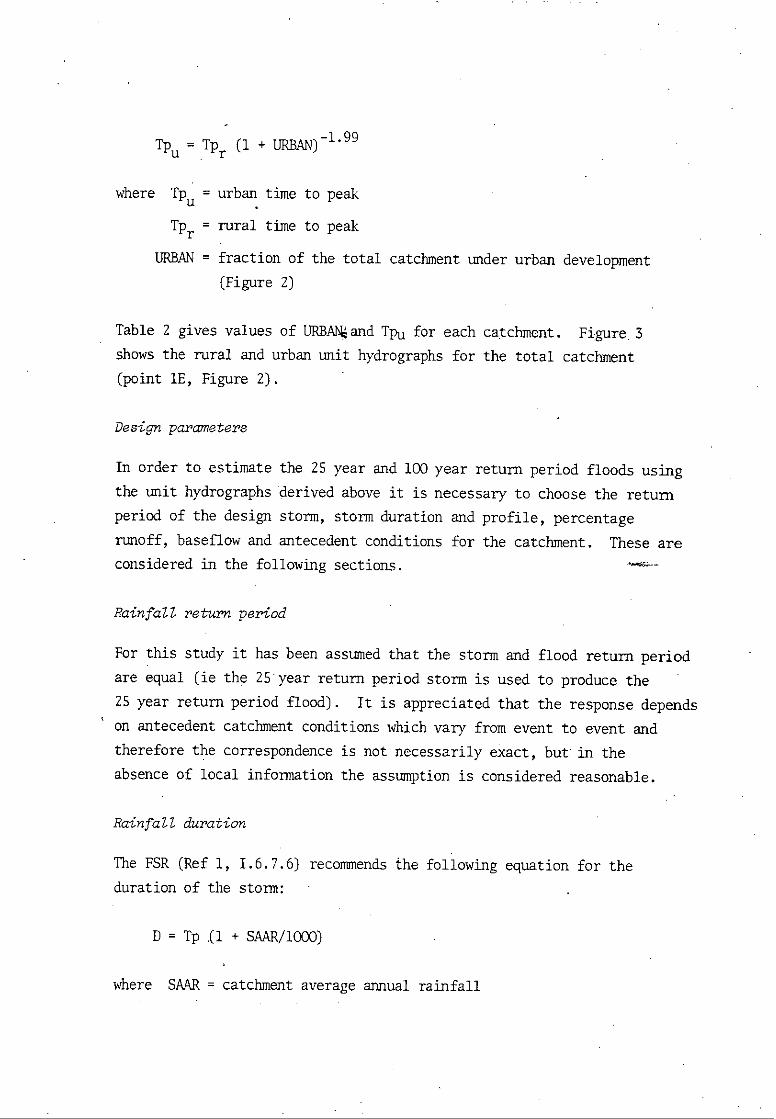
Table2 givesvaluesofURBAN4andTpuforeachcatchment.Figure.3showstheruralandurbanunithydrographsforthetotalcatchment(point1E,Figure2).
Designparameters
Inordertoestimatethe25yearand100yearreturnperiodfloodsusingtheunithydrographsderivedaboveitisnecessarytochoosethereturnperiodofthedesignstorm,stormdurationandprofile,percentagerunoff,baseflowandantecedentconditionsforthecatchment.Theseareconsideredinthefollowingsections.
Rainfallreturnperiod
Forthisstudyithasbeenassumedthatthestormandfloodreturnperiodareequal(iethe25yearreturnperiodstormisusedtoproducethe25yearreturnperiodflood).Itisappreciatedthattheresponsedepends
'onantecedentcatchmentconditionswhichvaryfromeventto eventandthereforethecorrespondenceisnotnecessarilyexact,butintheabsenceof localinformationtheassumptionisconsideredreasonable.
Rainfall duration
TheFSR(Ref1, 1.6.7.6)recommendsthefollowingequationforthedurationof thestorm: •
D = Tp (1+ SAAR/1000)
where SAAR= catchmentaverageannualrainfall
3.0
01/
4
F1
g3.
Uni
thy
drog
raph
sfo
rca
tchm
ent
1E
Rur
aI
=—
e-1
Urb
an=
cn_
0 0 co 03-
0 0 CD
v ,
0 0
.60
.20
14.8
0.4
0b.00b.so
1.20
2.80
4.40
6.00
7.60
In
1/4
1/4
1/4
1/4
s1/
41
bT
IME
[HO
UR
S]
9.20
A commonvalueof SAARwas usedforallcatchmentsandderivedfromthe
meanannualrainfallforthe gaugesat Bwari,AbujaandDiko (Figure1)
(Ref2):
Gauge No yearsrecord Annualaveragerainfall(mm)
Bwari 9 1551
' Abuja 18 1648
Diko 24 1541
The meanof thesethreegauges,weightedaccordingto thenumberof
yearsrecordfromeachgaveSAAR- 1580mm.
Usingthevaluesof TprandTpu previouslyobtainedthe durationof
eachstormwas calculatedusingtheaboveequation.D should,for
convenience,be an oddmultipleof thedatainterval.In eachcasethe
nearesthighermultipleof 0.25hourshasbeentaken(Table2). It
shouldbe notedthatbecauseof theverypeakynatureof therainfall
profile(discussedlater)themagnitudeof thefloodpeakis relatively
insensitiveto stormdurationsincemostof therainfallswithinthe
centralsection.
Rainfallprofile
It isnecessaryto obtainrainfallintensity/duration/frequencycurves
forthecatchmentsin orderthatrainfallprofilesof the required
severitycanbe developed.Forthisreportthefollowingprocedurewas
adoptedto establishtheseprofiles:
1. Fromthewaterresourcessurvey(Ref2, FigureA7) DikoandAbuja
recordshavebeencombinedto givemaximum'daily'rainfallsof_
differentreturnperiods. It isnotclearfromthe textof this
reportwhetherthenecessaryconversionfromthedailyto 24 hour
durationhasbeencarriedout. Fora givenreturnperiod,
rainfallsoverany24 hourperiodarehigherthanthoseoccurring
withina calendarday. Sincethereis no mentionof this
conversionin the reportit hasbeenassumedherethatit hasnot
beencarriedout. Fromthisgraphthefollowinginformationhas
beenabstracted.
5 yearreturnperioddailyrainfall= 94 mm
25 yearreturnperioddailyrainfall= 123mm
100yearreturnperioddailyrainfall= 148mm
At Abujathereforetheeowth factorsfrom5 yeardailyrainfallto
25 yearand 100yeardailyrainfallare 1.31and 1.57respectively.
FromMeteorologicalNoteNo 19 (Ref3) thecountrywideconversion
factorof dailyrainfallvaluesto 24 hourfallsis givenas
1.132. Hence:
5 yearreturnperiodAbuja24hourrainfall= 94 x 1.132= 106mm
MeteorologicalNoteNo 19 (Ref3)providesrainfallintensity/
duration/frequencycurvesfor21 stationsthroughoutNigeria.
Unfortunatelyonlyone,thatforIlorin,was availableforthis
study. However,thereis a closecorrespondenceto theAbuja
24hourrainfall(5yearreturnperiod):
5 yearreturnperiodIlorin24hourrainfall= 103mm
5 yearreturnperiodAbuja24hourrainfall= 106mm
Thedecisionto relatebackto the5 yearreturnperiodwas due
to thefactthatthe Ilorinrainfallintensity/duration/frequency
relationshipwerederivedfromonly9 yearsrecord(Ref3) and
thereforethe5 yearreturnperiodcurveshouldbe moreaccurate
thaneitherthoseof the 10yearor 25 yearreturnperiod.
Furthermore,thebasisof a 5 yearreturnperiodrainfallstatistic
is in linewithFSRpractice(Ref1).
The rainfallintensity/durationcurvefor the 5 yearreturn
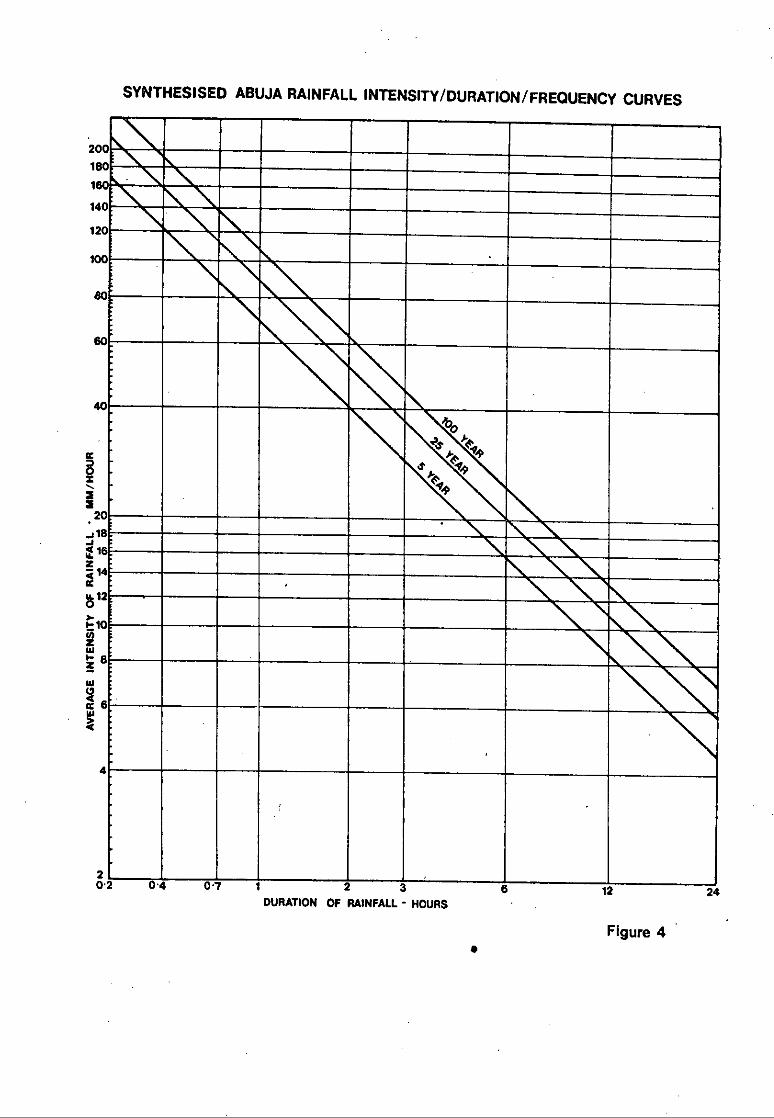
periodat Abujawas thereforeobtaineddirectlyfromthe Ilorin106graphafterscalingby 103- 1.03. Thiscurveis shownin Figure4.
5. The 25 yearand 100yearreturnperiodcurvesforAbujawerederivedby scalingthe5 yearreturnperiodrelationshipaccordingto the 24hourgrowthfactors(1.31and1.57respectively).Thereis strongevidencefora constantgrowthfactor(ieirrespectiveof rainfallduration).The Iloringraphitselfexhibitsthispropertyand it isalsoin linewithworkcarriedout in southwestNigeriaby theMeteorologicalOffice(UK). The 25yearand 100yearreturnperiodcurvesareshownin Figure4.
HavingobtainedAbujarainfal intensity/duration/frequencycurvestheywerethenusedto construct1 in 25yearand1 in 100yearstormsforeachof thecatchments.A nestedprofilewas adoptedsuchthatfor all durationstherainfallintensitiesof thesamereturnperiodoccurredwithinthe samestorm. The 1 in 25 yearstormof 2.25hourdurationwas thereforecomposedof the 1 in 25 year0.25hourfallin thecentreof the 1 in 25 year0.75hourfalletc. Althoughtheaverageintensityoverthetotalstormdurationhastherequiredreturnperiod,nestingtheprofilein thisway tendsto createalargerfloodbecauseof itspeakynature.However,it is preferableto uselocalrainfalldatain thisconservativefashionratherthanto adopttheparticular(andlesspeaky) rainfallprofileas recommendedin the FSRwhichhas validityonlyin theUnitedKingdom.
Arealreductionfactor(ARF)
Stormprofilesso farderivedapplyto pointrainfallsat Abuja. It hasbeenassumedthatthesepointstormsaredirectlytransferableto the catchmentarea. However,arealreductionfactorsmustbe appliedto accountfor thefactthatpointintensitiesarehigherthanthoseoccurring,withthe sameprobabilityof exceedance,overlargerareas Fromworkcarriedout by theMeteorologicalOffice(UK)in southwestNigeria,arealreductionfactorswerederivedfromcatchmentsbetween20 sqkm and 10,000sq km and durationsof 10 to 500hours. Thesewerelowerby a factorof 0.9 thantheirFSRUnitedKingdomcounterparts(Ref1, I.5). For thisstudywheredurationsandcatchmentareaslessthanthisareencountered,the samefactorhas beenassumedto applyin thisrangealso,thusenablingtheAPI to be calculatedforallcatchmentsandallstorms.
Sinceeachstormcomprisesa seriesof nestedstormsof different
a
SYNTHESISED ABUJARAINFALL INTENSITY/DURATION/FREQUENCY CURVES
40
:)?
i120
a182E li
200
180
160
_
140
120
100
.
eo
60
elkit.r44ed•1.9
r4:74
•II
141
. 122
.10:J
i 8J/I
6ii
4
20
.
20 40 /1 23 6 19 "A
DURATION OF RAINFALL HOURS
Figure 4
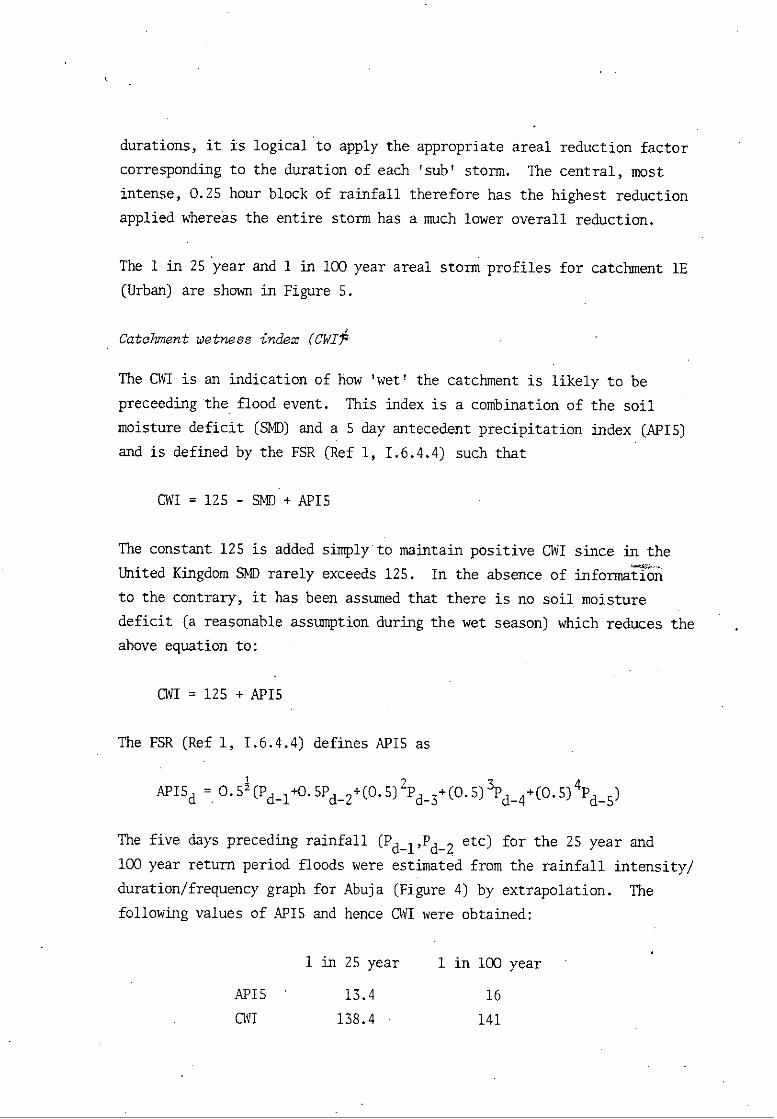
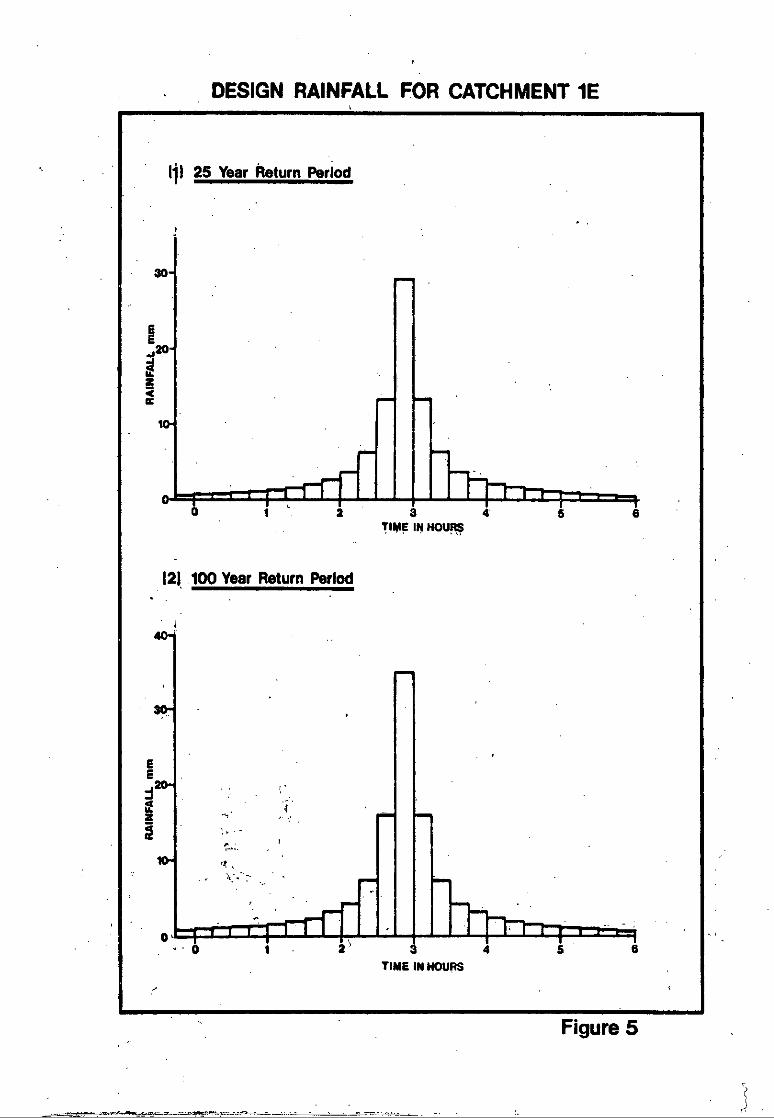
durations,it islogicalto applytheappropriatearealreductionfactorcorrespondingtothedurationofeach'sub'storm.Thecentral,mostintense,0.25hourblockofrainfallthereforehasthehighestreductionappliedwhereastheentirestormhasa muchloweroverallreduction.
The1 in 25yearand1 in100yeararealstormprofilesforcatchmentlE(Urban)areshowninFigure5.
Catchmentwetnessindex(CWI
TheCWIisan indicationofhow'wet'thecatchmentis likelyto bepreceedingthefloodevent.Thisindexis a combinationof thesoilmoisturedeficit(SMD)anda 5 dayantecedentprecipitationindex(APIS)andisdefinedby theFSR(Ref1,1.6.4.4)suchthat
CWI= 125- SMD+ APIS
Theconstant125isaddedsimplytomaintainpositiveCWIsinceintheUnitedKingdomSMDrarelyexceeds125. Intheabsenceof informationtothecontrary,ithasbeenassumedthatthereisno soilmoisturedeficit(areasonableassumptionduringthewetseason)whichreducestheaboveequationto:
CWI= 125+ APIS
TheFSR(Ref1, 1.6.4.4)definesAPISas
APISd= 0.52(Pd-1+0.5Pd-2+(0.5)2Pd-3+(0.5)3Pd-4+(0.5)4Pd_s)
Thefivedaysprecedingrainfall(Pd-1,Pc1-2etc)forthe25yearand100yearreturnperiodfloodswereestimatedfromtherainfallintensity/duration/frequencygraphforAbuja(Figure4)by extrapolation.ThefollowingvaluesofAPISandhenceCWIwereobtained:
1 in25year 1 in 100year
APIS 13.4 16CW1 138.4 141
DESIGN RAINFALL FOR CATCHMENT1E
Figure 5
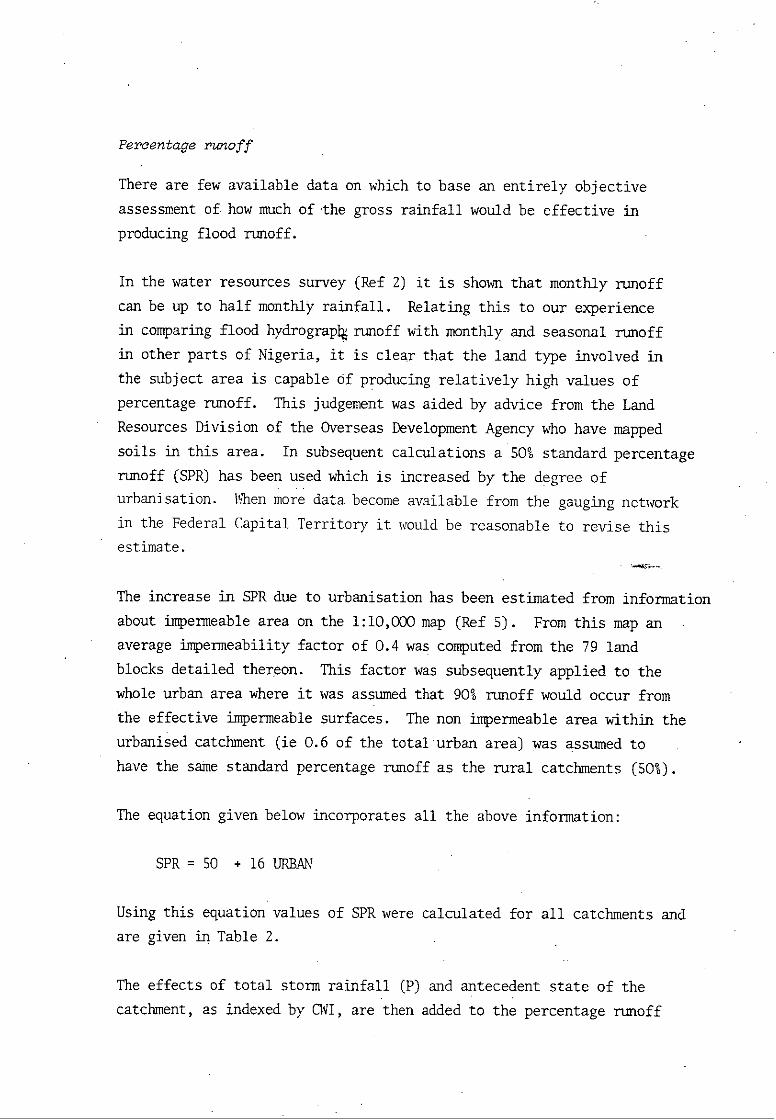
Percentagerunoff
Therearefewavailabledataon whichtobasean entirelyobjective
assessmentof howmuchof thegrossrainfallwouldbe effectivein
producingfloodrunoff.
Inthewaterresourcessurvey(Ref2) it is shownthatmonthlyrunoff
canbe up to halfmonthlyrainfall.Relatingthisto our experience
in comparingfloodhydrograpliwrunoffwithmonthlyand seasonalrunoff
in otherpartsof Nigeria,it is clearthatthe landtypeinvolvedin
thesubjectareais capableof producingrelativelyhighvaluesof
percentagerunoff. Thisjudgementwasaidedby advicefromthe Land
ResourcesDivisionof theOverseasDevelopmentAgencywho havemapped
soilsin thisarea. In subsequentcalculationsa SO%standardpercentage
runoff(SPR)has beenusedwhichis increasedby the degreeof
urbanisation.Mienmoredatabecomeavailablefromthe gaugingnetwork
in theFederalCapitalTerritoryitwouldbe reasonableto revisethis
estimate.
The increasein SPRdue to urbanisationhas beenestimatedfrominformation
aboutimpermeableareaon the1:10,000map (Ref5). Fromthismap an
averageimpermeabilityfactorof 0.4wascomputedfromthe 79 land
blocksdetailedthereon.Thisfactorwas subsequentlyappliedto the
wholeurbanareawhereitwas assumedthat90%runoffwouldoccurfrom
theeffectiveimpermeablesurfaces.Thenon impermeableareawithinthe
urbanisedcatchment(ie0.6 of thetotalurbanarea)was assumedto
havethesamestandardpercentagerunoffas theruralcatchments(50%).
The equationgivenbelowincorporatesallthe aboveinformation:
SPR= 50 + 16 URBAN
Usingthisequationvaluesof SPRwerecalculatedforall catchmentsand
aregiveninTable2.
The effectsof totalstormrainfall(P)andantecedentstateof the
catchment,as indexedby CW1,arethenaddedto thepercentagerunoff

foreachfloodevent. Percentagerunoff(PR)is defined(Ref1, 1.6.5.8)
as:
PR = SPR+ 0.22(CWI- 125)+ 0.1 (P- 10)
Usingthevaluesof SPRandCWIfromaboveandthe totalstormrainfall,
P, thepercentagerunoffforeachfloodwas thendetermined.
Baseflow
The convolutionof theunithydrographwithnet rainfallgivesthe
rapidresponsecomponentof thetotalhydrograph.To thismustbe added
a slowresponseor baseflowcomponentof thehydrograph.Baseflowis
onlya smallproportionof thefloodhydrographand itsvalueis
thereforenot criticalto theestimate.The FSRprovidesan equation
forthecalculationof baseflow(Ref1, 1.6.5.11).
BASEFLOW= AREA (0.000326(CWI-125)+0.00074R3MD+0.0(33)
RSMDis definedas thenet 1 dayrainfallof the 5 yearreturnperiodand
was obtainedfr6mFigure4. Followingworkdonein southwestNigeria
theRSMDtermwasmodifiedto 0.00037RSMDand it is thisformof the
equationwhichwasusedin thisstudy. Forcatchment1C thebaseflow
is calculatedas 0.46cumecsforthe1 in 25 yearfloodand 0.47cumecs
forthe1 in 100yearflood.
Thewaterresourcessurvey(Ref2) givessix gaugingsat point1C
(Figure1) of whichthreecamefromthewet season(Septemberand
October1978)givingvaluesof 0.202,0.32and0.41cumecs. If it is
assumedthatthesegaugingswerenot carriedoutduringa floodevent
theytendto confirmthattheaboveequation(modified)is giving
baseflowestimatesof therightorder.
Floodestimateresults
The designrainstormsdiscussedaboveweremultipliedby the appropriate
percentagerunoff(whichrangedfrom61%to 77%)and convolutedwiththe unit
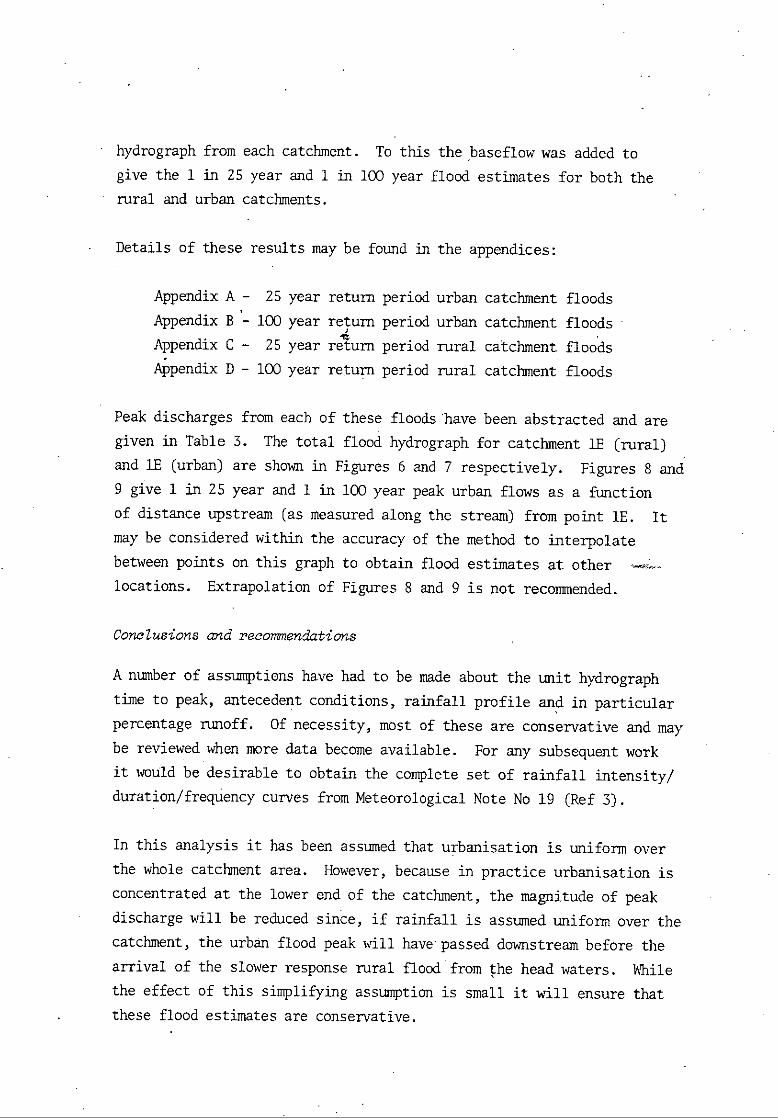
• hydrographfromeachcatchment.To thisthebaseflowwas addedto
givethe 1 in 25 yearand1 in 100yearfloodestimatesforboththe
• ruralandurbancatchments.
Detailsof theseresultsmay be foundintheappendices:
AppendixA - 25yearreturnperiodurbancatchmentfloods
AppendixB 100yearreturnperiodurbancatchmentfloods
AppendixC - 25 yearreturnperiodruralcatchmentfloods
AppendixD - 100yearreturnperiodruralcatchmentfloods
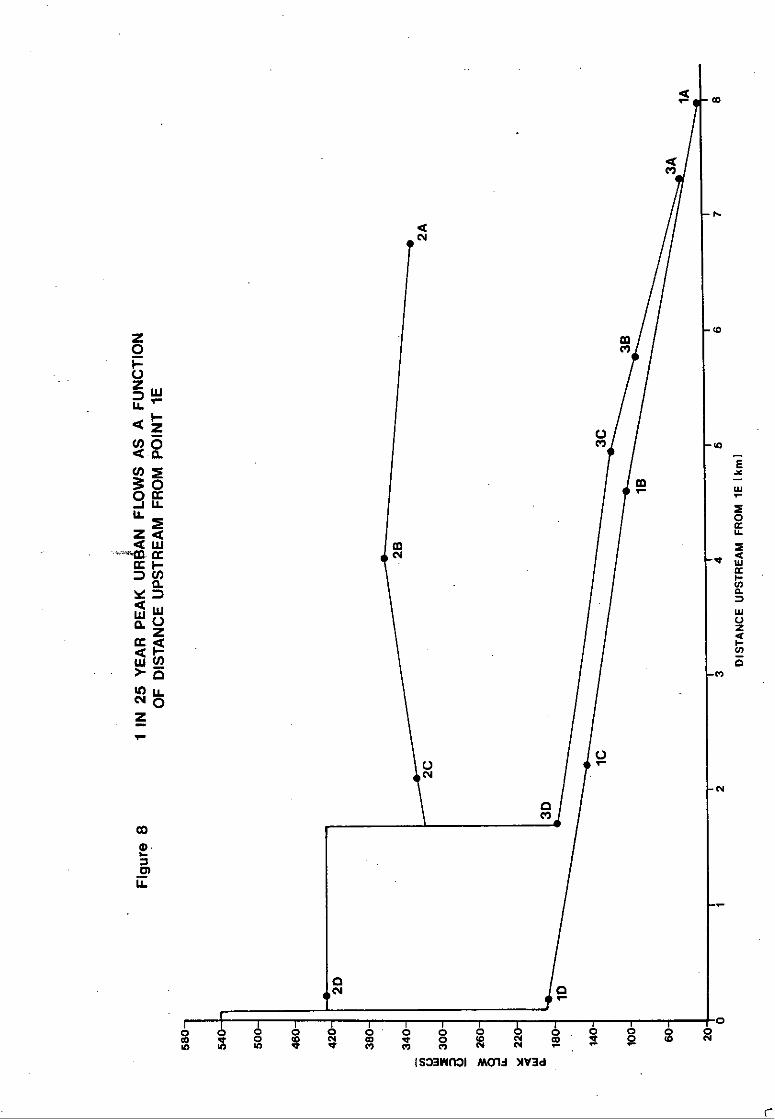
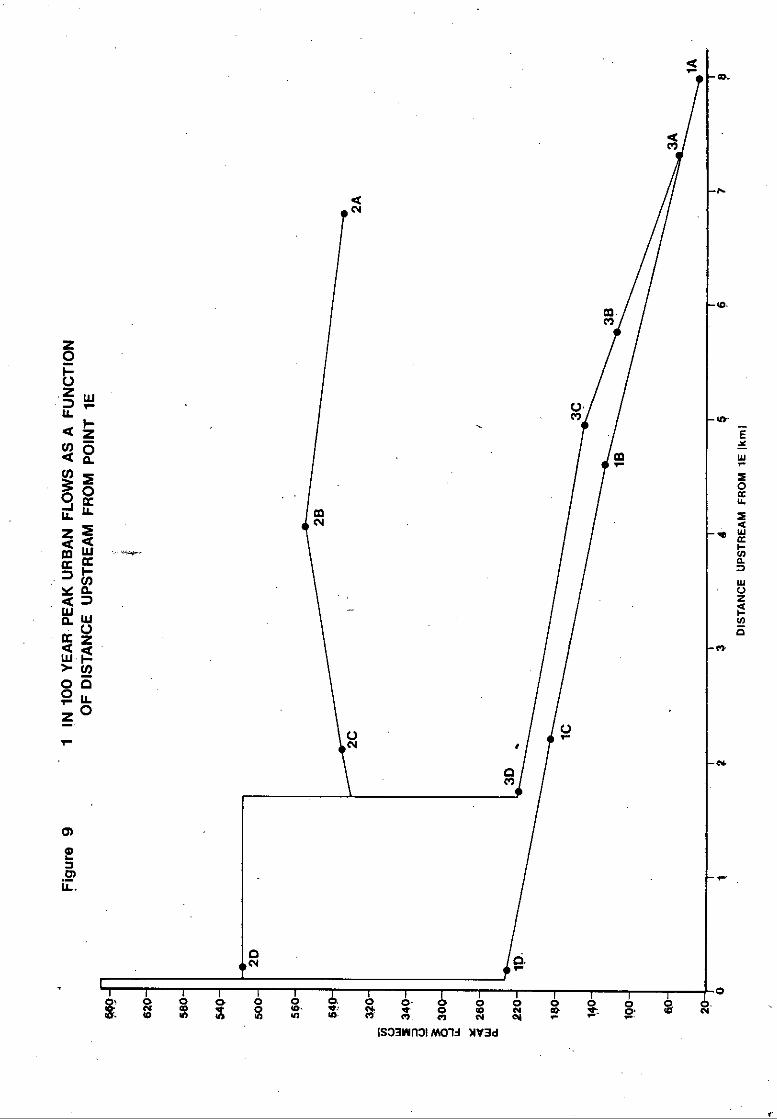
Peakdischargesfromeachof thesefloods'havebeenabstractedand aregivenin Table3. The totalfloodhydrographforcatchmentlE (rural)and lE (urban)are shownin Figures6 and7 respectively.Figures8 and9 give1 in 25 yearand1 in 100yearpeakurbanflowsas a functionof distanceupstream(asmeasuredalongthe stream)frompoint1E. It
may be consideredwithintheaccuracyof themethodto interpolate
betweenpointson thisgraphto obtainfloodestimatesat other
locations.Extrapolationof Figures8 and9 is not recommended.
Conclusionsand recommendations
A numberof assumptionshavehad to be madeabouttheunithydrograph
timeto peak,antecedentconditions,rainfallprofileand in particularpercentagerunoff. Of necessity,mostof theseareconservativeandmaybe reviewedwhenmoredatabecomeavailable.For any subsequentworkit wouldbe desirableto obtainthecompletesetof rainfallintensity/duration/frequencycurvesfromMeteorologicalNoteNo 19 (Ref3).
In thisanalysisit hasbeenassumedthaturbanisationis uniformover
thewholecatchmentarea. However,becausein practiceurbanisationisconcentratedat the lowerendof thecatchment,themagnitudeof peak
dischargewillbe reducedsince,if rainfallis assumeduniformoverthecatchment,theurbanfloodpeak1411havepasseddownstreambeforethe
arrivalof theslowerresponseruralfloodfromtheheadwaters. ithilethe effectof thissimplifyingassumptionis smallit will ensurethat
thesefloodestimatesareconservative.

TABLE3
Peakfloodflows(cumecs)
Catchment
UrbanisedCatchment RuralCatchment
25year 100year 25 year. 100year
lA 26 33 26 33
1B 105 130 38 47
IC 149 184 48 60
1D 188 233 56 69
lE 543 673 242 302
ZA 332 413 206 257
2B 362 450 198* 248*
2C 330* 410' 178* 222*
2D 418 519 205 256
3A 43 54 31 39
3B 93 116 46 57
3C 119 149 51 64
3D 177 220 61 76
* Reducedpeakflowsrelativeto pointupstreamdue to theeffectsof attenuationexceedingthoseof additionalflowfromintermediateareas.

TIME
[HOURS]
6.00
40.00
144.00
48.00
2.00
8.00
6.00
0.00
4.00
.00
3.0
04.
.00
2.00
Fig
6.F
Iood
hydr
ogra
ph1
-R
ura
I
25
Yea
r—
100
Yea
r=
—01
-1.
0
01-
0 0 LO
0.1-
1
LO
-
(-1
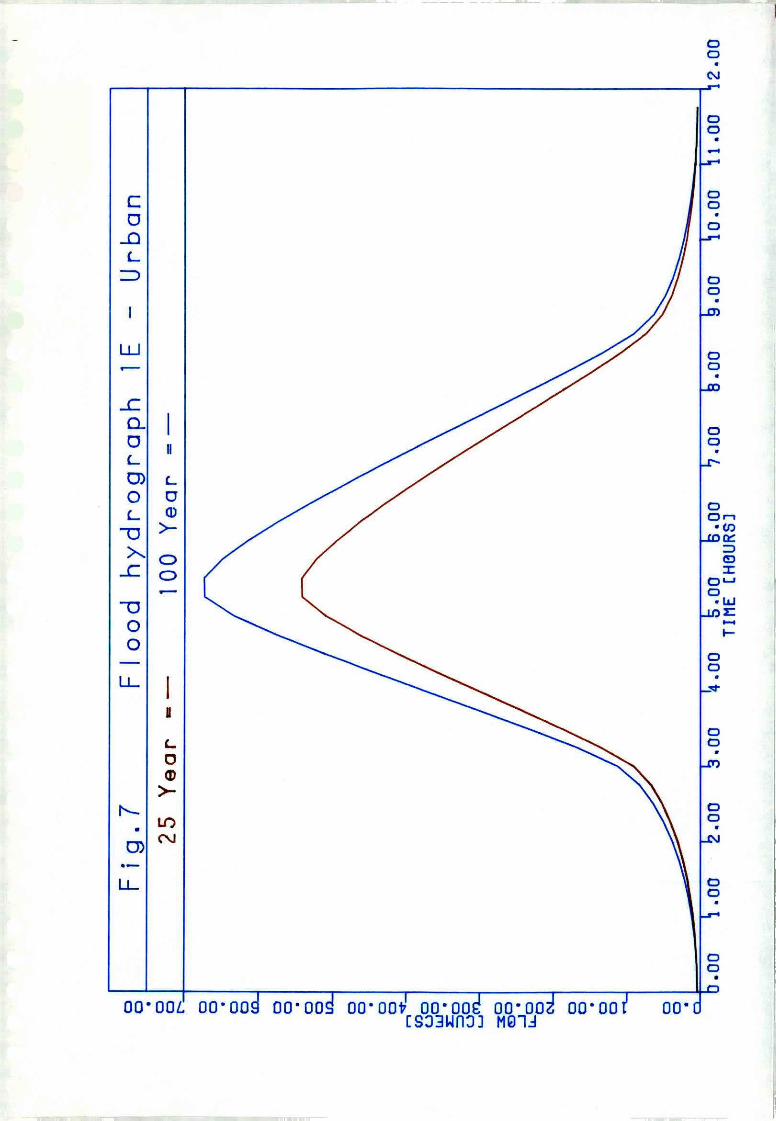
Fig.7
Flood
hydrograph
lE
-Urban
25Y
ear
100
Yea
r=
cm 0 CD
-
LD
-
.00
2.00
11.
00.0
01/
4.0
0.0
01/
4.00
4.00
.00
b.00
1/4
0.00
.00
.00
TIME
[HOURS]
Fig
ure
81
IN25
YE
AR
PE
AK
UR
AA
NF
LO
WS
AS
AF
UN
CT
ION
OF
DIS
TA
NC
EU
PS
TR
EA
MF
RO
MP
OIN
T1E
580-
540—
500-
480-
420-
380-
340-
830
0-D
260-
,
g22
0=
tu a.18
0-
140=
2D
28
2C2A
3D1D
1C3C
100-
381B
3A1A
201
23
45
67
8
DIS
TA
NC
EU
PS
TR
EA
MF
RO
M1E
Ikm
I
Fig
ure
91
IN10
0Y
EA
RP
EA
KU
RB
AN
FL
OW
SA
SA
FU
NC
TIO
NO
FD
IST
AN
CE
UP
ST
RE
AM
FR
OM
PO
INT
lE
28
•2C
2A
2D 11
620-
580-
540-
500-
see-
040-
PE
AK
FL
OW
ICU
ME
CS
I
349-
309-
260-
3D22
0-
180-
1C3C
140-
381B
3A60
-1
1A20
-
123
DIS
TA
NC
EU
PS
TR
EA
MF
RO
M1E
Ikm
I
67

References
FloodStudiesReport,1975,NaturalEnvironmentResearchCouncil,
London.
H P GauffGmbHandCo,AdejumoOgunsolaandPartnersandNoyuk,
FeasibilityStudyandPreliminaryEngineeringfor the WaterSupply
to theNew FederalCapitalCity,February1979.
MeteorologicalServiceNigeria,RainfallIntensity-Duration-Frequency
curvesforselectedNigerianStations,MeteorologicalNoteNo 19.
Instituteof Hydrology,Designfloodestimationin catchments
subjectto urbanisation,FloodStudiesSupplementaryReportNo 5,
September1979.
MiltonKeynesDevelopmentCorporation,Phase1 Area RiverCatchments,
FederalCapitalDevelopmentAuthorityPhase1 area,Abuja,
1:10,000map drawingno E/282.

APPENDIXA
25yearreturn,periodurbancatchmentfloods
,Wre"—
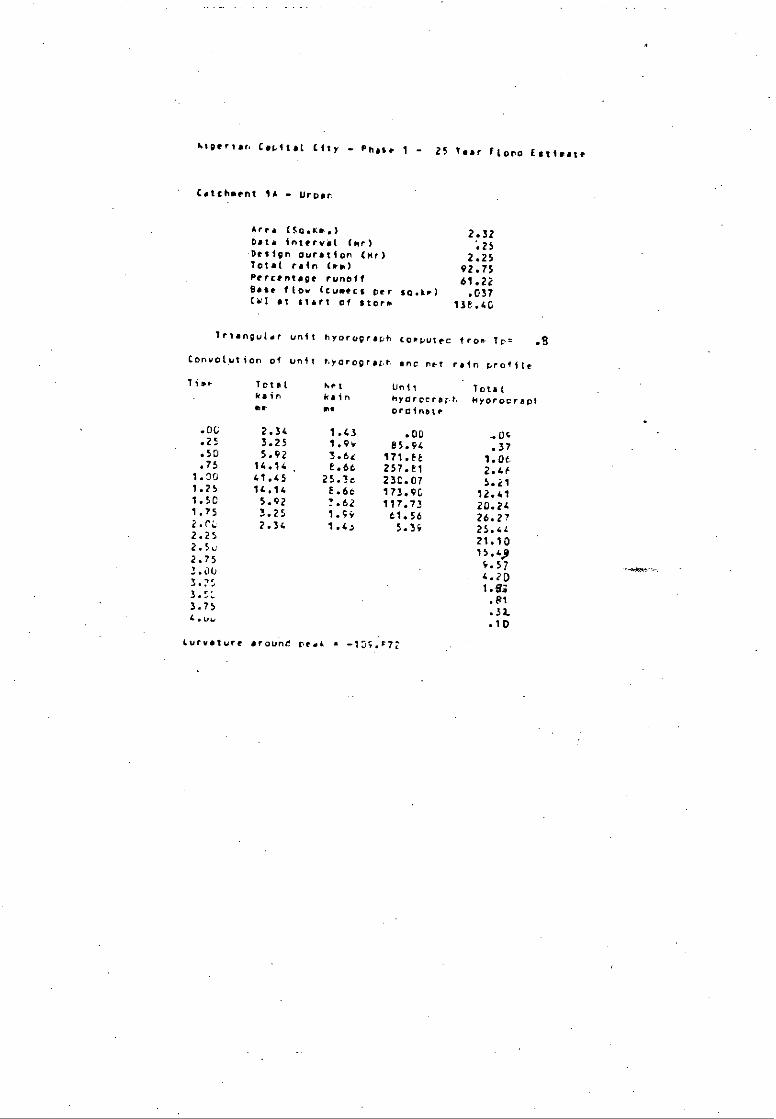
Al • Capital City - phase 1 - 25 Tsar Florio Estivate
' Catchment 14 - Uroan
Are. (Spam.) 2.32Data interval (lir) ..25Design Duration (Mr) 2.25Total rain (am) 92.75Pe rce nt•ge runoff 61.22Bast flow (ouses% per sig.ko.) .037CUI at &&&&& of storm 135.40
1riangular unit hyDrugraph covputec trot. fp= .13
Convolution of unit trorograAn Inc nrt rain profile
lia• Totalvainmc
ArtRainma
Unithyorocravnorcinate
Totalmyorocrapt
.00 2.34 1.43 .00 a 0C
.25 3.25 1.94 85.94 .37
.50 5.92 1.6c 171.E6 1.06
.75 14.14. E. 257.81 2.461.00 41.45 25.1c 250.07 5.211.25 14.14 E.6o 173.40 12.411.50 5.92 1.62 117.73 20.241.75 3.25 1.94 61.56 26.272.r0 2.34 1.4A 5.34 25.442.25
21.102.5v
15.4,2.75
4.572.00
4.203.25
1.8;3.::
.813.75
.3L4.L.1.
.10
curvature arounD reek • -104.A72

mtgerian Capital City - Phase 1 - 25 tear Flop(' Estimate
.
Catchment 18 - Urpan
Area (5g.km.) 7.41Data interval (tit) .25Resign duration (mr) 2.25Total rain (rm) 90.55Percentage runoff 71.03Base Ilom (cumecs Per so.kr) .037Cul at start of store 138.40
Triangular unit hyarograch ciOmputro from Tpt .7
Convolution of unit hydrograph ant net rain profile
Time TotalRain
• hetRainMR
Unithydropraphordinate
TotalmyorocraCh
.06 2.41 1.71
.25.25 3.34 2.37 112.24 1.7e
56 6.01 4.27 224.49 5.10.75 14.11 1n.02 299.61 11.57
1.0C 39.11 27.7E 22E.25 23.251.25 14.11 1C.0[ 152.E9 55.451.5C (.01 4.27 79.53 87.9'1.75 3.34 2.37 6.16 125.242.00 2.41 1.71
42.162.25.
64.51."2.5C
43.7!2.75
20.063.00
6.613.25
3.613.56
1.343.75
.3f
Curvature around peak • -427.970

Nigerian Capital City - Phase 1 - 25 tear floor)Estimate
Catchment IC - Uroan
Area (5o.Km.). 12.39Data tnt l (OW) .25Desion ouration (Mr) 2.75Total rain imm1 93.26Percentage runoff 73.27Base flow (sumacs per so.km) .037(W1 litstart of store 138.40
Triangular unit hydrograph computed from Tor .9
Convolution of unit hyorograch and net rain profile
TimeTotalNetRainRain
UnitTotalhydrocraph Hydroeraphordinate
.03 1.E2 1.33 .00 .46
.25 7.45 1 .E:, 67.90 1.59
.50 3.39 2.46 135.80 4.22.75 6.06 4.4 203.70 6.94
1.00 14.07 10.31 226.69 16.661.25 37.69 27.62 n2.31 30.911.50 14.07 10.31 137.93 65.561.75 6.16 4.44 93.55 104.312.00 1.39 2.46 49.17 137.362.25 2.45 1.Eu 4.79 146.512.50 1.E2 1.33
133.072.75
106.623.00
80.413.25
51.4th
3.50
3.75
12.744.00
6.6r4.25
3.254.51
1.3'4.75
.54
Curvature around peak s -425.969
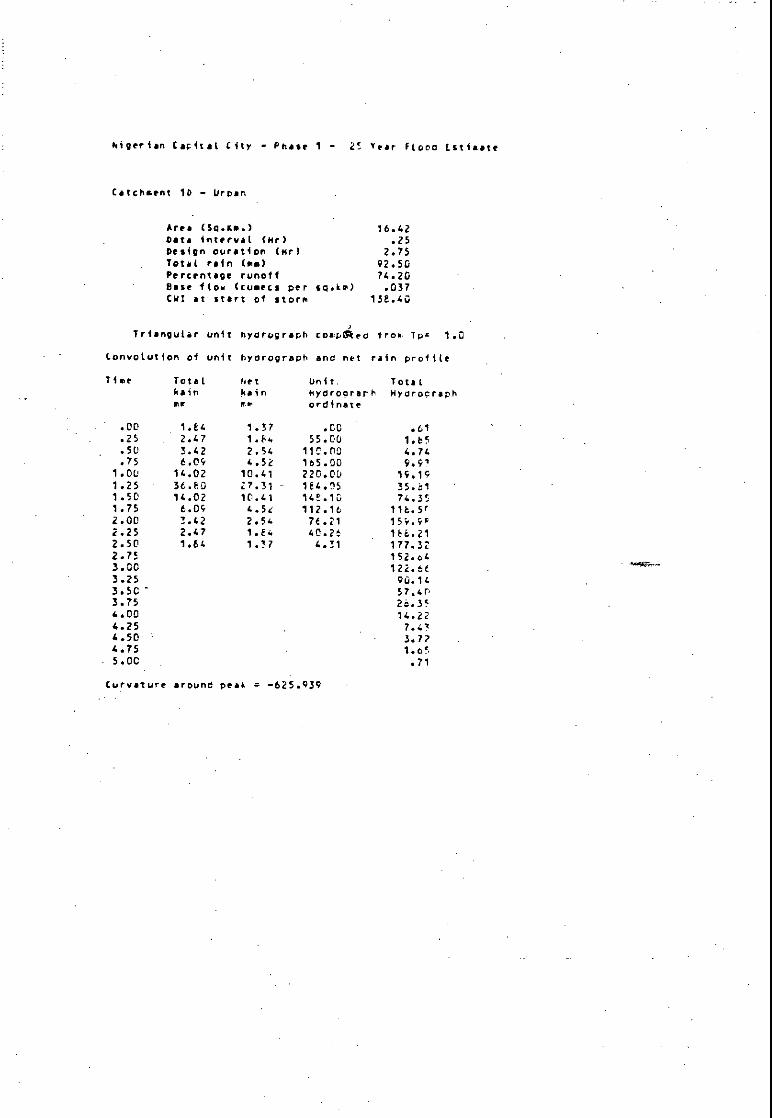
Nigerian Capital City - Phase 1 - 25 tear flout,[stint.
Catchaent 10 - Lirpan
Area (Scam.) 16.42Data interval (mr) .25Design ouration (Kr) 2.75Total rain (ma) 92.50Percentage runoff 74.20Base Ito. (punts per aclekr) .037CWI at start of storm 138.40
Triangular unit hyorograph coast/Ginofro. Tow 1.0
Convolution of unit hyorograph and net rain profile
Time Total Net Unit. TotalRain Main nyoroorarh Mvorocraphme "IP ordinate
.00 1.84 1.37 .00 .61
.25 2.47 1.84 55.00 1.65
.50 3.42 2.54 110.00 4.74
.75 6.09 4.52 165.00
1.00 14.02 10.41 220.00 19.191.25 36.60 27.31 184.05 35.611.50 14.02 10.41 148.10 74.351.75 6.09 4.5e 112.16 118.5r2.00 3.42 2.54 78.21 159.9F2.25 2.47 1.84 40.26 186.212.50 1.64 1.37 4.31 177.322.75
152.643.00
122.683.25
90.143.50
57.4r3.75
26.354.00
14.224.25
7.434.50
3.7?4.75
1.o55.00
.71
Curaaaure around peak = -625.939
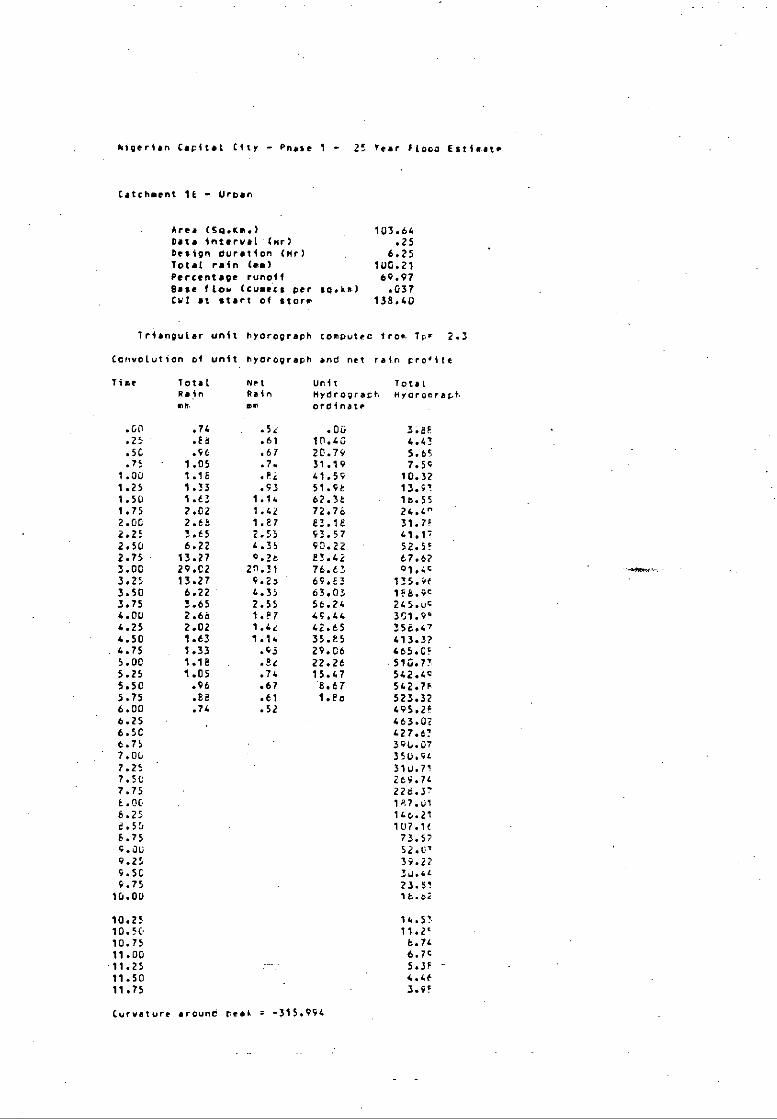
higerian Capital City - Phase - 25 Tear F(ooa Estimate
Catchment 1E - Urban
Area (Spam.) 103.64Data interval (Mr) .25Design duration (Mr) 6.25Total rain (ma) 100.21Percentage runoff 69.97fl•se f Low cusec s Per sca• k w .037Cv! at start of storm 138.40
triangular unit hyorograph computec trot Tor 2.3
Convolution oi unit hyorograph and net rain crofilt
Time Total Net Unit TotalRein Rain mydrograch HyorocraphCR me oroinate
.60 .74 .54 .00 3.8E
.25 .Ea .61 10.40 4.41
.56 .96 .67 20.79 5.65
.75 1.05 .7. 31.19 7.591.00 1.1E .Ei 41.59 10.321.25 1.33 .93 51.9k 13.911.50 1.63 1.14 62.35 15.551.75 2.02 1.42 72.76 24.4"2.06 2.6! 1.87 83.18 31.7;2.25 3.25 2.55 93.57 41.172.50 6.22 4.35 90.22 52.5!2.75 13.27 9 .26 83.42 67.523.00 29.02 2.31 76.63 9 1.443.25 13.27 9.2p 69.83 135.9r3.50 6.22 6.35 63.03 188.963.75 3.65 2.55 56.24 245.0'4.00 2.66 1.P 7 49.44 301.904.25 2.02 1.42 42.65 256.474.50 1.63 1.1.. 35.85 413.3?4.75 1.33 .93 29.06 465.055.00 1.18 .8e 22.26 510.775.25 1.05 .74 15.47 542.465.50 .96 .67 1.67 542.7F5.75 .88 .61 1.Po 523.326.00 .74 .52
495.2P6.25
463.076.56
427.676.75
300.077.00
350.9'7.25
310.717.50
269.747.75
226.37E.00.
13.06.25
146.212.50
107.1(6.75
73.579.013
52.09.25
39.2?
9.56
9.75
23.5110.00
1E.o2
10.25
14.5310.50
11.2'10.75
bac
11.00
6.7'11.25
5.5?11.50
4.4t11.75
3.9!
Curvature arounc peak -315.994

Nigerian Capital City - Phase 1 - 25 Tear flootlEstisate
Catchment 2A - UrCan
Area (So.ka.) 57.e5Data inaaaaa I (ar) .25Design ouration (lir) 5.25Total rain (ma) 99.59Percentage runoff 65.91Base flow (ceeeee Per SO.4e) .037CII at start of store 136.40
Trian4ular unit hyorograph coptLted trot Tor 2.0
Convolution of unit loyerograph ane net rain profile
Time Total 'het Unit TotalLain Bain Nydrograph Nyorooraphme et ordinate
.00 .92 .61 .00 2.16
.25 1.02 .67 13.75 2.o5
.50 1.13 .75 27.50 3.6e
.75 1.2o
41.25 5.271.00 1.57 1.04 55.00 7.5'1.25. 1.96 1.2v 66.75 10.ot1.5C 2.61 1.72 52.50 14.7'1.7: 3.55 2.3o 46.25 20.242.00 6.20 4.0V 110.00 27.672.25 13.62 7.90 101.111 37.5r2.50 31.80 20.90 92.03 53.542.75 13.62 8.96 23.04 85.373.00 6.20 4.0V 74.05 123.1F3.2$ 3.5C 2.3o 65.07 162.c.F3.50 2.61 1.72 56.0e 202.753.75 1.96 1.2v 47.09 241.7'4.00 1.57
36.10 275.674.25 1.26 .54 29.12 310.9V4.50 1.13 .75 20.13 332.2r4.75 1.02 .67 11.14 326.455.00 .92 .61 2.16 309.425.25
2E7.735.50
263.2F5.75
236.06.00
209.356.25
180.9r6.50
151.06.75
122.917.00
94.12
7.25
66.477.50
42.007.75
28.575.00
20.506.25
15.178.51.
11.2F8.75
6.319.0C
6.179.25
4.5'9.50
9.75
2.0'
10.00
2.24
Curvature aroune real • -431.53!
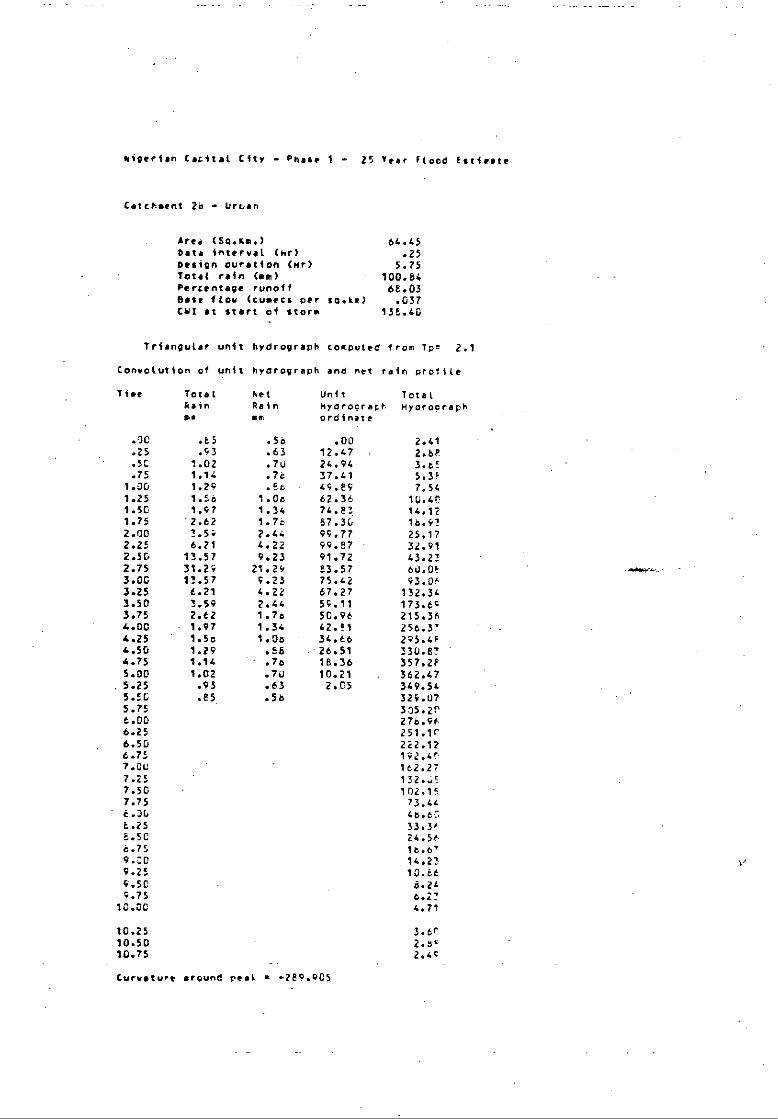
migerian Cacital City - Phase 1 - 25 rear FLO0d Estimate
Catchsent - Urcan
Area (56.ca.) 64.45Data in L (nr) .25Design duration (mr) 5.75Total rain (mm) 100.84
eeeeee runoff 68.03Base floe (warn per so.km) .037CWI at start of storm 138.40
Triangular unit hydrograph coeputed trom Tp= 2.1
Convolution of unit hydrograph and net rain profile
Time Total Net Unit TotalFain Rain 14y0rocran. HvorocrapnPS Elm ordinate
.00 .85 .56 .00 2.41
.25 .C3 .63 12.47. 2.61,
.5C 1.02 .70 24.94 3.6!
.75 1.14 .76 37.41 5.3E1.00 1.29 .86 49.89 7.541.25 1.56 1.0o 62.36 10.4r1.50 1.97 1.34 74.83 14.121.75 '2.62 1.76 87.30 16.9!2.00 3.59 2.44 99.77 25.172.25 6.21 4.22 99.87 32.912.50 13.57 9.23 91.72 43.232.75 31.29 21.29 83.57 6U.OF3.00 13.57 9.25 75.42 93.04-3.25 6.21 4.22 67.27 132.343.50 5.59 2.44 59.11 173.6c3.75 2.62 1.7o 50.96 215.364.00 1.97 1.34 42.!1 256.3'4.25 1.56 1.06 34.66 295.4s4.50 1.29 .16 - 26.51 3111.874.75 1.14 .7o 18.36 357.2F5.00 1.02 .70 10.21 362.475.25 .93 .63 2.05 349.545.5C .85 .56
329.075.75
335.2n6.00
276.966.25
251.1r6.50
222.126.75
192.4r7.0U
162.277.25
132..4!7.50
102.1S7.75
73,446.DU
46.6C8.25
33.348.50
24.5t6.75
16.6'9.00
14.239.25
10.664.50
8.249.75
6.2710.00
4.71
10.25
3.6r10.50
2.6‘10.75
2.4c
Curvature •round peas a .280.905
Migerian Capital Citr - Pnase 1 ; 25 Year Flood Estimate
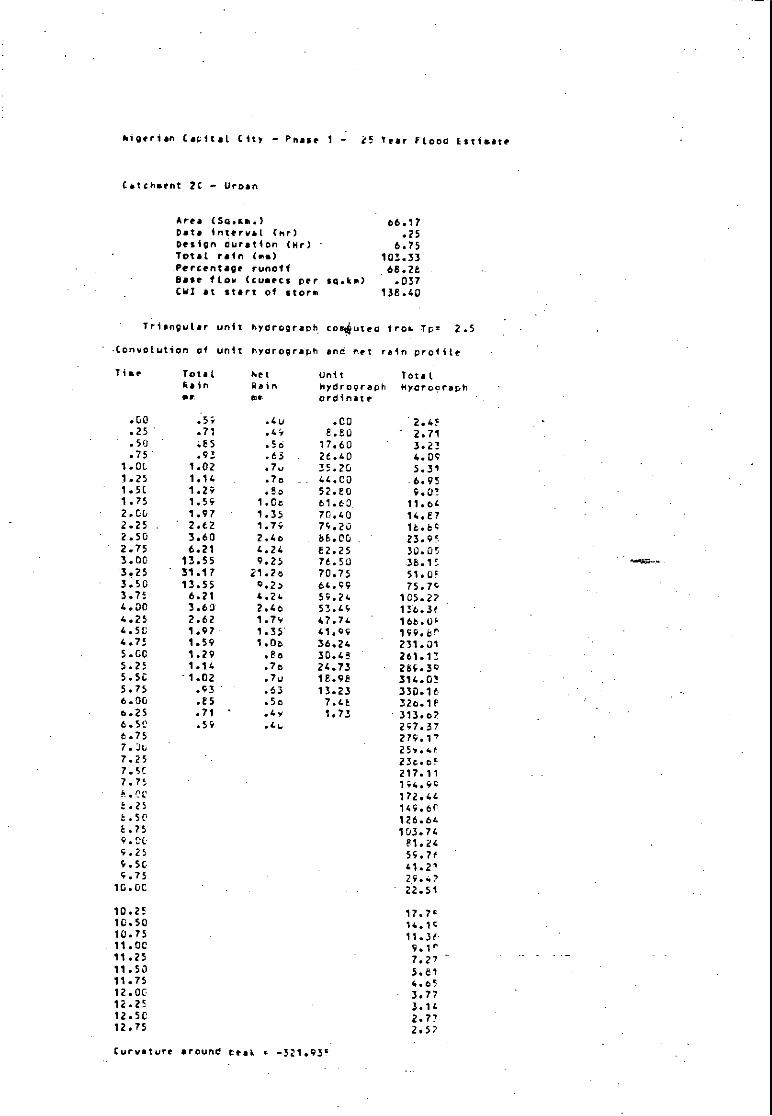
Catchment 2C - Urban
Area (56.gm.) 66.17Date itttttt l (nr) .25Design Duration (lir) - 6.75Total rain (mm) 103.33_Percentage runoff .68.2E -Base flow (cumecs per sci.km) .037Carlat ttttt of storm 138.40
Triangular unit nydrogreon comtuted from To= 2.5
-Convolution of unit nyorograon and net rain profile
Time TotalRainmy
,
hetRainme
unitHydrographordinate
Totalgygrogroph
.00 .5; .4u .00 2.45
.25 .71 .4Y 8.80 2.71
.50 4E5 .5o 17.60 3.23
.75 .93 .63 26.40 4.391.01 1.02 .7. 35.20 5.311.25 1.14 .76 44.00 -6.951.50 1.29 .50 52.80 9.071.75 1.59 1.0e 61.60 11.6L2.00 1.97 1.35 70.40 14.872.25 '2.62 1.7; 74.20 1O.2c2.50 3.60 2.4o 88.00 23.952.75 6.21 4.24 82.25 30.053.00 13.55 9.25 76.50 36.1S3.25 31.17 21.26 70.75 51.053.50 13.55 0 .25 64.99 75.703.7: 6.21 4.24 50.24 105.274.00 3.60 2.46 53.40 136.304.25 2.62 1.7v 47.74 166.04.50 1.97 1.35 41.09 1S9.6^4.75 1.59 1.0o 36.24 231.015.60 1.29 .8o 30.48 261.1!5.25 1.14 .7o 24.73 289.305.50 - 1.02 .7u 18.98 314.0!5.75 .93 .63 13.23 330.166.00 .85 .5o 7.4E 32o.18o.25 .71 '.Av 1.73 313.o76.50 .59 .44
2;7.376.75
279.1'7.00
25..4F7.25
23c.oF7.50
217.117.7:
1:4.90F.CC
172.448.25
149.6rE.50
126.4542.75
103.749.0C
(41.245.25
59.7f4.5C
41.2!9.75
25.4?16.06
22.51
10.2!
17.7'10.50
14.1'10.75
11.3(•11.00
5.1'11.75
7.2711.50
5.2111.75
4. Oc.,12.00
•3.7712.25
3.1412.50
2.7712.75
2.57
Curvature around teak• -321.93F

algerian Capital City - Phase 1 - i5 Year flop.: Lstiaate
(atchsent 25 - urpar
Area C5cloca..) b7.2Z
Data interval (Mr) .25
Design ouration (dr) 6.75
Total rain ism/ 102.15
Percentage runoff 69.16
Base flo. (cumrcs per sci.kn) .037
C41 at start of store 135.40
Triangular unit nyorugraon computec fro, 24e 2.6
Convolution of unit eyorograph and net rein pro4lle
Tire Total het unit Totalgain - Fain nycl rog r a Ph myorocrapl
CP 0 • ordinate
.1.0 .63 .42 .03 3.2!
.25 .7: .5v E.14 3.56
.50 .t7 .6u 16.27 4.21
.75 .95 .65 24.41 5.20
1.00 1.04 .72 32.54 6.64
1.25 1.16 •Eu 40.65 6.60
1.51; 1.32 .01 4E.F2 11.5?
1.75 1.61 1.1i 56.95 14.70
2.00 2.03 1.3, 65.09 14.te
2.25 2.6: 1.8- 73.22 23.50
2.51 5.63 2.51 0.36 30.25
2.75 6.22 4.3u 21.42 38.10
3.01 13.35. 0.25 76.11 44.44
3.25 20.52 20.62
70.79
3.50 13.3E 0.25 65.47 54.62
3.75 6.22 4.2u 66.15 130.7?
4.01 3.63 2.51 54.64 166.76
4.25 2.66 1.84 45.52 207.5'
4.50 2.03 1.35 44.23 246.45
4.75 1.61 1.12 36.E6 264.0
5.00 1.32 .91 33.57 322.02
5.25 1.16 .8u 2E.25 357.2;
5.50 1.04 .72 22.93 388.6S
5.75 .95 .65 17.61 412.47
t.CU .F7 .6u 12.29 417.6e
6.25 .73 .5.1 6.0e 4:7.37
0.5l. .63 .4z
1.66
6.75
7.0.
345.3?
7.25
32U.54
7.50
2;4.67
7.75
267.65
8.20
243.47
5.25
212.6;
d.5L
134.41
6.75
15o.11
5.20
127..4
5.25
100.37
9.51.
74.22
5.75
51.75
10.00
37.15
10.25
26.50
10.50
22.57
10.75
16.32
11.00
14.44
11.25
11.62
11.56
9.37
11.75
7.4F
12.30
6.67
12.25
4.91
12.51
4.11
-12.75
3.50
13.31;
3.32
CurvalLre •rount! reel. -252.306
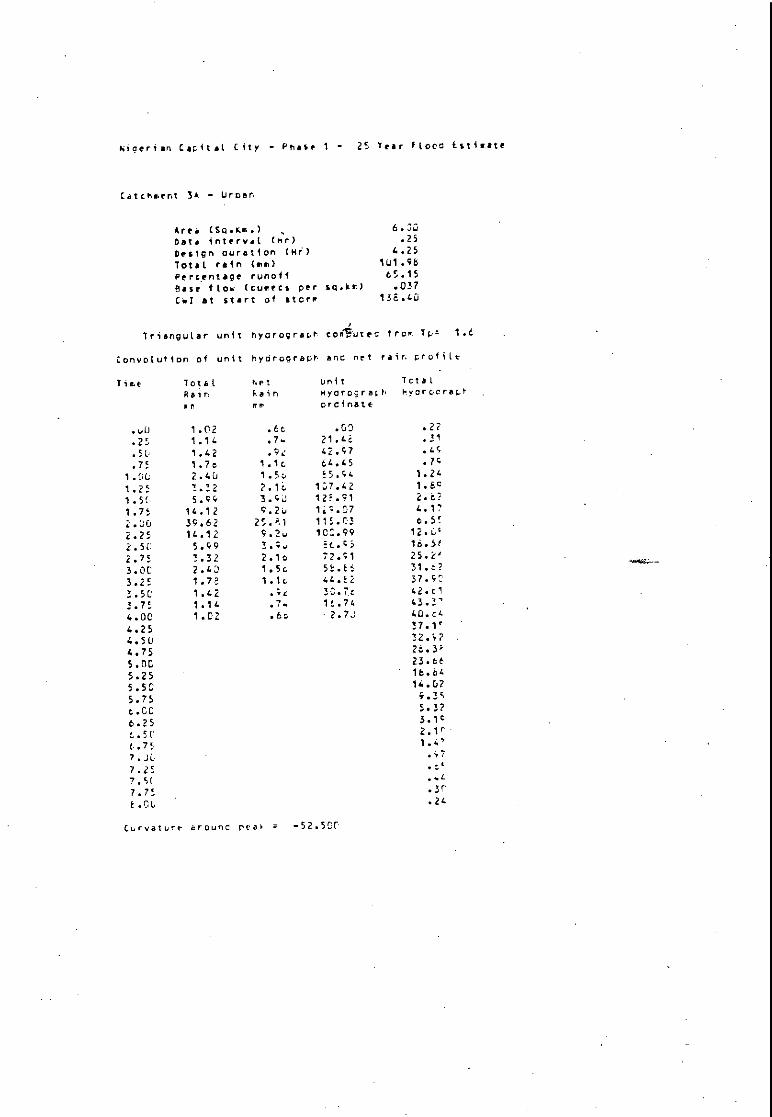
Nigerian Capital City. - Phase 1 - 25 tear flocc Estivate
Catchment 3A - Uroan
Area (Sq.Av.) , 6.30
Date interval (nr) .25
Design Duration (He) 4.25
Total rain (env) 1U1.96
Percentage runoti 65.15
ease Ito. (curets per sp.kv) .037
C.1 at start ol store 132.43
Triangular unit hyorograpt co4ttec iron TpA 1.6
Convolution of unit hydrograpr and net rain orolitt
71ae Totat net Unit total
Rair Rain 0'1ya rog ra I byorcc racl
orf vm oreinatt
.00 1.02 .6t .03 .2?
25 1.14 .7. 21.4t .31
.51) 1.42 .92 42.57 -LP
.75 1.70 1.1c 64.45 .7'
2.40 1.5., 55.t4 1.24
1.25 1.32 2.1C 107.42 1.Ec
1.5C 5.174 3.Cu 12F.91 2.e?
1.7: 14.12 9.2u 1i6.07 4.17
2.00 34.62 25.h1 115.C3 6.5!
2.25 14.12 S.2u 100.99 12.C,
2.50 5.99 3.6g Et..43 16.5t
2.75 3.32 2.10 :2.91 25.e,
3.00 2.43 1.5c 55.tt: 31.t?
3.25 1.76 1.1t 44.E2 37.4'0
3.50
1.42 30.7t 42.0
3.75 1.14
16.74 43.3'
4.00 1.02 .6t 2.73 40.:4
4.25
37.1,
4.50
32.42
4.75
2t.3%
s.00
23.t6
5.25
16.64
5.50
14.02
5.75
9.3C
6-00
5.3?
6.25
6.50
2.1,
!-75
1.4,
7.3i
.47
7.25
tt
7.5(
7.75
.31
t.CC
.24
Curvature arOunC peal . -52.501
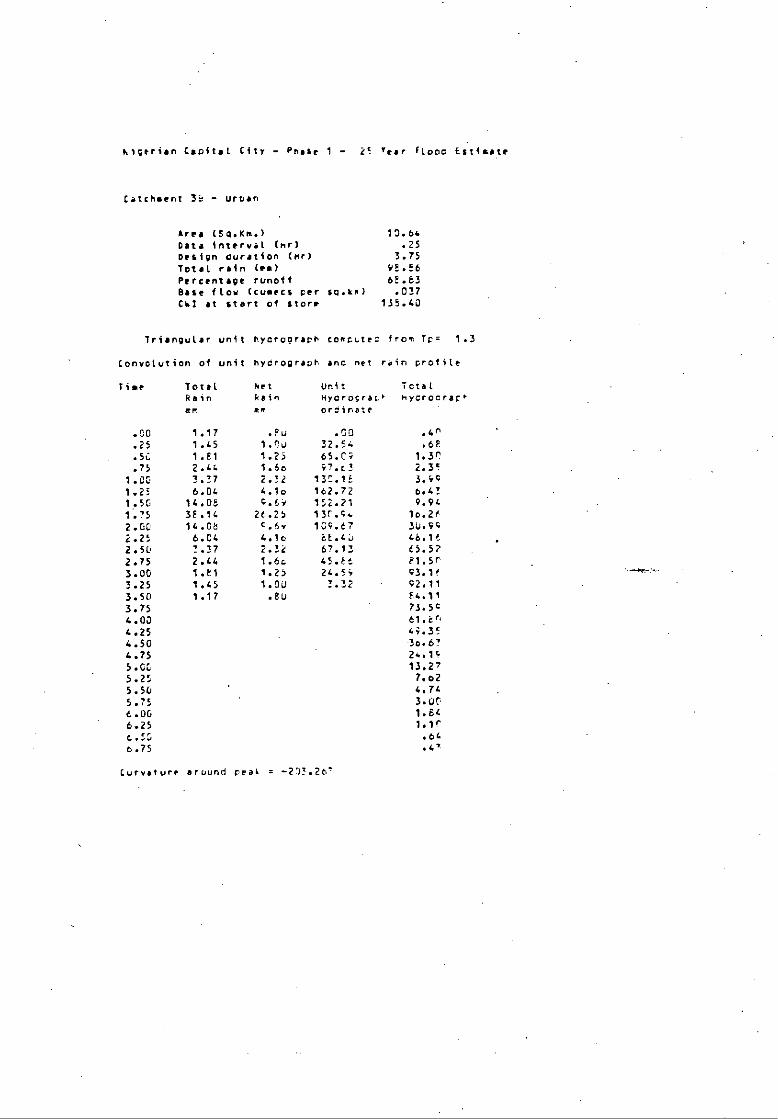
Algerian Capital. City - Phase 1 - 2! Year ftnno 65.tisate
Cetcheent 3E - Uroan
Area (50.Am.) 10.64
Data interval (nr) .25
Design ouration (mr) 3.75
Total rain (es) 95.56
Percentage runoff 65.53
Base flow Cowmen per 110.1te) .037LSI st Start of Storr. 135.40
triangular unit hyorograch cortLteo froc..Tr. 1.3
Convolution of unit hyorograph anc net rein profile
Time Total Net Unit Total
Rain Mein Hycrocrast nycrocrape
mm mm orr:inate
.00 1.17 .Pu .00 .4P
.25 1.45 1.eu 32.54 •65
.5C 1.81
1.23 1.3P
.75 2.44
1.6o 2.3!
1.00 3.37 2.32 130.15 3.4C
1.25 6.04 4.10 162.72 6.47
1.50 14.05 C.69 152.21 9.94
1.75 35.14 26.25 13C.C4 16.2r
2.00 14.08 c.6, 109.67 3u.vc2.25 6.04 4.10
46.16
2.50 3.37 2.32 67.13 65.5?
2.75 2.44 1.6c 45.Et P1.5r
3.00 1.E1 1.25 24.54 C3.16
3.25 1.45 1.00 3.32 C2.11
3.50 1.17 .8U
54.11
3.75
75.50
4.03
61.tr
4.25
4;.35
4.50
36.67
4.75
24.14
5.00
13.27
5.25
7.o2
5.50
4.74
5.75
3.0C
6.00
1.EL
6.25
1.1r
4.50
.04
6.75
.4,
Curvature eruund peak m - 2713.26'
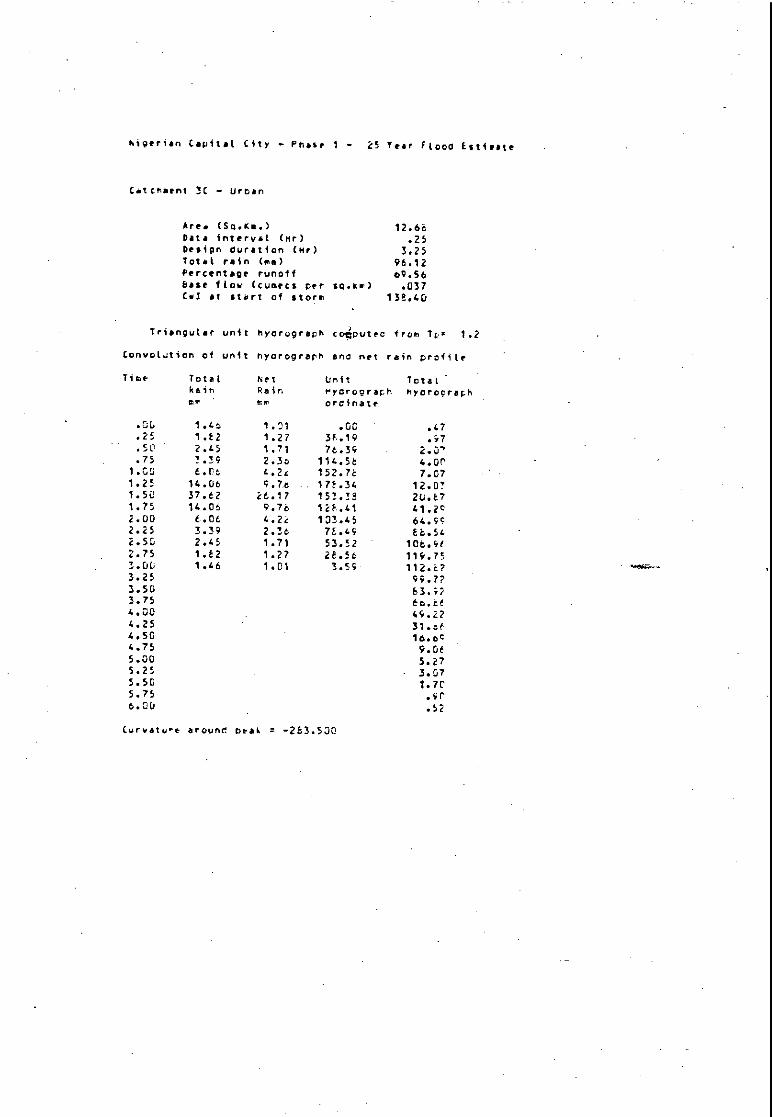
stgertan Capital City - Phase 1 - 25 Year ft000 Estivate
Catchment 1C - urban
Area(5o.sts.)Datainterval(or)Designduration(ne)TotalrainCom/Percentagerunoffbaseflow(sumacsperCa!atstartofstorm
Triangularunithyorograph
Convolutionofunithyarograch
SO.Str)
coioutec
ano net
12.66 .25
3.25 96.12 60.56 .037
1313.40
lrom Tor1.2
rainprofile
Time
.3U
Totalkain
'
NetRainerr
1.01
Unitrydrooraphoroinate
.00
Total -hyorograCh
.47.25 1.12 1.27 31.19 .97.50 2.45 1.71 76.39 2.0'.75 1.19 2.3o 114.51 1..or
1.00 t.0 L.2e 152.75 7.071.25
14.06 171.34 12.0!1.50 37.62 26.17 151.32 20.171.75 14.06 9.76 12/.41 41.2c2.00 6.04 4.2i 101.45 64.9C2.25 3.39 2.36 75.49 1/.542.53 2.45 1.71 53.52 101.9f2.75 1.12 1.27 28.56 119.751.00 1.46 1.01 3.59 112.123.25
99.773.50
63.C23.75
6o.tt4.00
49.224.25
31.ct4.50
16.oc4.75
9.0t5.00
5.275.25
3.075.50
1.7C5.75
.906.00
.52
Curvature around beak r -2E3.500

migerian Capital City - phase 1 - i; tear flood Estimate
Catchment So - Uroan
Area (5d.sm.) 19.60
Data interval (hr) .25
Design our• t on (sr) 3.75
Total rain (ey) 97.35
Percentage runoff 72.66
Base flow (Lumen per sq •Ice) .037Cul at start of storm 138.40
Triangular unit hydrograoh computec from To. 1.3
Convolution of unit hyorograch enc net rain profile
Time Total het Unit Total
Rain Vein Oycrc;rard' Myorooropl,
mm or ordinate
.00 1.2J .87 .00 .73
.25 1.4Q 1.0o 32.54 1.2;
.50 1.66 1.3) 65.09 2.54
.75 2.49 1.81 97.63 4.64
1.0C 3.44 2.5v 132.1t 7.91
1.25 6.11 4.44 162.72 12.7f1.50 13.9; 10.17 152.21 19.71
1.7; 36.2u 2.31 130.94 32.Gt
2.00 13.;+ 1^.17 109.67 59.5?
2.25 6.11 4.44 86.40 92.2;
2.50 3.44 2.50 67.13 125.02
2.75 2.49 1.81 45.66 155.1?
3.00 1.86 1.3) 24.59 176.85
3.25 1.49 1.06 3.32 175.1n
3.50 1.23 .67
160.21
3.75
140.424.00
116.114.25
94..51
4.50
70.37
4.75
40.75
5.00
26.ut-5.25
15.07
5.50
9.3F
5.75
5.926.00
3.6?
6.25
2.1,
6.50
1.22
6.75
.7c
Curveturt arounc Deo. = - 375.FJ1
APPENDIXB
100yearreturnperiodurbancatchmentfloods

Ai p Capital City - Past 1 - 100 Year iLepe Estimate
Catchment 14 - urran
Arta (SQ.Km.) 2.32
Data interval (mr) .25
Design duration (Mr) 2.25
Total rain (ma) 111.16
Percentage runoff 63.64
Base flow (pumas Per gq.kr) .036
Oil St Stift of storm 141.00
Triangular unit hyorograch cordidtec frog 764. .t
Convolution of unit tvorograpn and net rain profile
TimeTotalAPI
gainLain
it PF
UnitTotal
Hyorocrach mycrograpt
ordinate
.00 2-.E1 1.7, .00 .04
.25 3.40 2.4c 85.44 .45
.50 7.04 4.51 171.68 1.3'
.75 16.45 16.74 257.E1 3.0!
1.06 44.t7 31.61 230.07
1.25 16.45 11.74- 173.40 15.44
1.50 7.04 -4.51 117.73 25.14
1.75 2.40 2.44 61.56 32.71
2.CC 2.E1 1.7s 5.34 31.67
2.25
26.2f
2.50
14.27
2.75
11.4r3.00
5.213.25
2.27
3.51
.9c1.75
4.00
.11
Curvature around peak 4 -136.667

Nigerian Capital City - etas. 1 - 109iTear Flood Estimate
Catchment 1u - Urban
Area (Soar.) 7.41Data interval (nr) .25Design duration (mr) 2.25Total rain (re) 1US.LiPercentage runoff 73.41Base flow (ctiress per so.km) . .036Ca1 at start of storr, 141.03
Triangular unit hydrograoh computeo tror Tp= .7
Convolution of unit hvorograch and net rain profile
liar Total.vainrr
2.Ec
NetPainMT
2.12
UnithyorograchOrdinate
..00
Totalmyorodrarh
.2F•25 4.0D 2.94 112.24 2.0c.51' 7.2; 5.2v 224.49 6.2c.75 16.91 12.c 299.61 14.271.0c 46.E7 34.41 226.25 29.4!1.25 16.91 12.42 152.E9 66.611.5C 7.20 5.29 79.53 106.651.75 4.00 2.9, 6.16 130.352.01 2.E9 2.1c
114.02.25
86.022.se
54.1r,2.75
24.763.01
1U.E.53.21
4.6(3.5::
1.673.75
.35
Curvature around peak a -62;4-.372
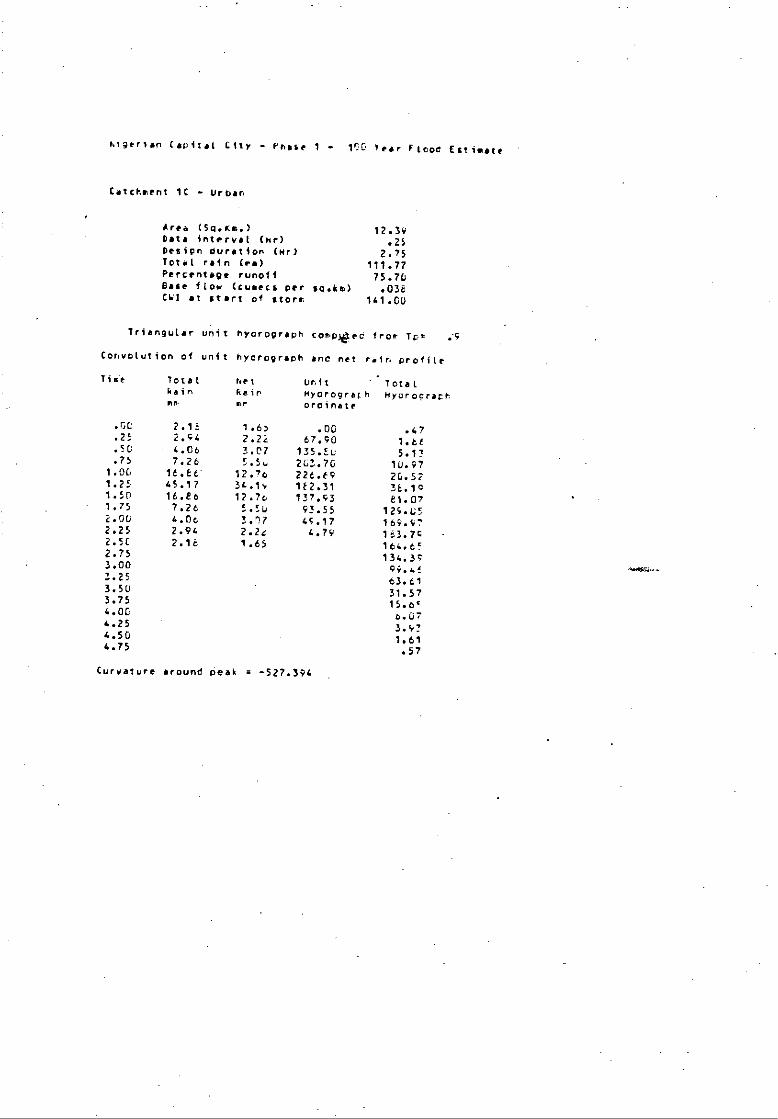
Nigerian Capital City - Phase 1 - 1F.'0fear Flood Estimate
Catchment IC - urban
Area (5q.Km.) 12.39Data interval (hr) .25Desion duration (kr) 2.75Total rain (ea) 111.77Percentage runoff 75.70Base flow (owlets per so.ltm) .036CM) at start of storm 141.00
Triangular unit hyorograph comp4ed fror Tot .9
Convolution of unit hyorograph lane net r.in profile
Time Total Net Uni t - Tota Lkain Rain hyprograrh hyorograrrma air ordinate
.GC
.25
.5C
2.16 2 .64 4. 06
1.652 .2
3 .C7
.OG
135 .Eu
67 .90.4 7
5.17.75 7. 76 5 .5,u 263 .70 1O. 97
1.00 16.6 I2 .76 226.E.9 20. 521.25 4 5 .1 7 34 .1 4. IF2 .31 36 .191. 50 1 6 .E e 12 .76 137 .93 E 1. lit1.75 7.26 5 .Su 97 .55 129 .052.00 4 .06 3 .r)7 4S .17 16; .972.25 2. 94 2 .26 4.79 1 t3 .792.50 2 .I6 1.65
164 . t F.2. 75
134. 3 73. 00
3.25
63.613.5 0
31.573.75
15.654.00
4. 25
l..5 0
1.6 14.75
.5 7
Curvature around peat = -527.394
-

higerian (apital City - Phase 1 - 100 Year flood Estimate
Catchaent ID - Urpan
area (5o.hm.) 16.42Data interval (Mr) .25Design duration (Mr) 2.75Total rain (em) 110.86Percentage runoff 76.61Base flow (cumecs per so.te) .038CWI at start of story 141.00
Triangular unit nydrograch coeputec from Toa 1.0
Convolution of unit hyorograph ano net rain profile
'fist Total het Unit TotalRain Main myorograch myorooraphme yr ordinate
.00 2.21 1.69 .00 .61
.25 2.97 2.27 55.00 2.16
5C 4.1J 3.14 110.00 5..74.75 7.30 5.5.0 165.00 12.15
1.00 16.61 12.6c 22C.00 23.621.25 44.11 32.79 1E4.05 44.1E
1.5u 16.81 12.Et 14E.10 91.67
1.75 7.30 5.54 112.16 146.4c
2.0C 4.13 1.14 76.21 197.62
2.25 2.97 2.27 40.26 232.712.50 2.21 1.64 4.31 219.2E
2.75
166.9(
3.0C
151.05
3.25
111.41
3.50
70.9(3.75
34.9E4.0C
17.4(
4.25
4.u(
4.5U
4.47
4.75
1.915.00
.7E
Curvature around peak a -774.516

stgerion COpitat City - Phase 1 - 100 tear Flood Estimate
Catchment 16 - Urban
Area(541.Se.)(I•t•in aaaaa L(Mr)Designduration(Hr)Totalrain(me)PercentagerunoffBaseflos(cumecsperCS!atstartofstorm
•Triangular unithycrograph
Convolutionofunithyorograph
so.km)
comPtiteo
and net
103.64 .25
6.25 120.10 72.53 .036
141.00
fromTo.2.3
rainprofile
7ise TotalRainme
%elRainaro
UnitMyeroord4rOreinsle
Totalhyoro,:rach
.00 .EE .64 .00 3.97
.25 1.05 .7o 1C.40 4.6,
.50 1.15 .E3 20.79 6.17
.75 1.2o .9c 31.19 8.57
1.00 1.41 1.02 41.54 11.97
1.25 1.5G 1.1e 51.9E 16.4(1.50 1.95 1.42 62.36 22.2r1.75 2.42 1.74 72.76 29.47
2.0U 3.21 7.33 63.18 36.67
2.25 4.38 3.17 V3.57 50.3r
2.50 7.45 5.40 90.22 64.47
2.75 15.90 11.53 83.42 63.163.r0 34.75 25.23 74.63 112.613.25 15.60 11.53 69.83 166.0!3.50 7.45 5.40 63.03 213.643.75 4.38 3.17 56.24 303.674.DC 3.21 2.33 49.44 374.37
4.25 2.42 1.76 42.65 444.5C
4.50 1.95 1.42 35.65 512.674.75 1.59 1.1e 29.06 576.9!
5.00 1.41 1.02 22.26 633.6`
5.25 1.26 .92 15.47 673.1r
5.50 1.15 .53 8.67 673.47
5.75 1.05 .76 1.6E 649.30
6.0U .68 .64
614.4*
6.25
574.37
6.50
530.41
9.75
4t3.71
7.06
435.14
7.25
355.1h7.5i.
334.21
7.75
282.66
i.UG
231.4F
6.25
160.7'
1.50
132.26
6.75
SU.4F
4.00
63.7G
4.25
47.8F
9..5C
36.979.75
2b.73
10.00
. 22.2c
10.25
17.1E
10.50
13.17
10.75
11).0
11.00
7•5E
11.2:
5.64
11.50
4.6E
11.75
4.uc
Curvature arounc peak • -3;2.572
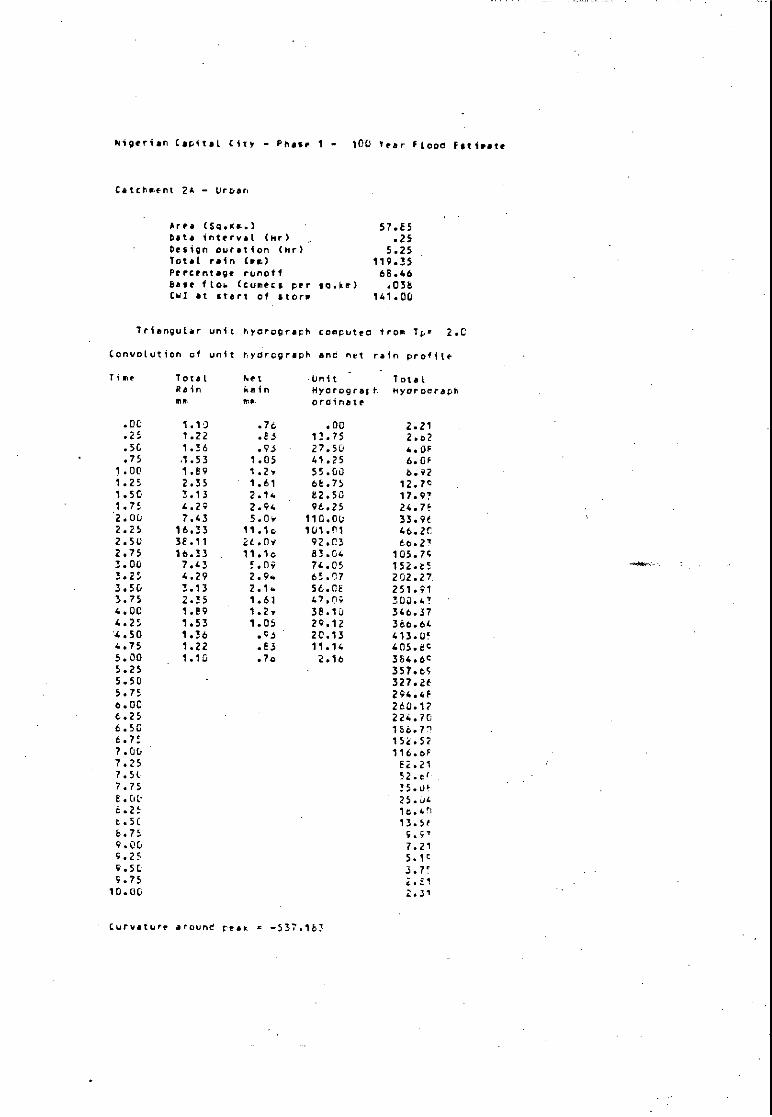
Nigerian Capital City - Phase 1 - 100 Year Flood titivate
Catchment 24 - Uroan
Area (5q.im.)Data interval (Hr)Design ouration (Hr)Total rain (am)Percentage runoff
57.85 .25
5.25 119.35 68.46
Base flo4 (curets per ao.kr) .038Cu] at aaaaa of store 141.00
Triangular unit hyorograph corputeo from To. 2.0
Convolution of unit hyorcgraoh and net rain profile
Tire TotalRainme
NetFainMP.
,UnitHyorograieordinate
TotalHyoroerAph
.00 1.10 .76 .00 2.21
.25 1.22 .53 12.75 2.o2
.56 1.36 .93 27.50 4.05
.75 1.53 1.05 41.25 6.0F1.00 1.59 1.2, 55.00 6.921.25 2.35 1.61 66.75 12.7c1.50 1.13 2.14 82.50 17.971.75 4.2; 2.94 96.25 24.7E.2.00 7.43 5.0. 110.00 33.962.25 16.33 11.10 101.01 46.202.50 35.11 26.09 92.03 66.272.75 16.33 11.10 83.04 105.743.00 7.43 5.09 74.05 152.653.25 4.29 2.94 65.07 202.273.50 3.13 2.14 56.0E 251.913.75 2.35 1.61 47.0; 300.4!4.00 1.59 1.29 38.10 346.374.25 1.53 1.05 29.12 366.644.50 1.36 .93 20.13 413.U!4.75 1.22 .53 11.14 405.695.00 1.10 .7o 2.16 384.6c5.25
357.t55.50
327.265.75
294.456.00
260.176.25
224.706.50
160.7'6.75
152.527.00
116.657.25
52.217.51
52.cr7.75
35.0r,2.01,
25.,J46.2:
115.4r1t.5(
13.516.75
9.979.00
7.219.25
5.1c9.56
3.7!9.75
2.5110.00
2.31
Curvature around pea. . -537053

Rigerian Caoital City - Phase 1 - 10U year flood Estimate
Catchment 26 - uman
Area (50.ite.) 64.45Data i I (mr) ..25Design duration (Mr) 5.75Total rain (rm) 120.85Percentage runoff 70.61Base /low (cumecs per so.km) .038CmI at start of storm 141.00
Triangular unit byorograph compved from To= 2.1
Convolution of unit hyorograph and net rain profile
Time lotal het Unit TotalRain Cain Hydrograph Myorooractmm Pr? ordinate
• .00 1.02 .74 .00 2.47.25 1.11 .7. 12.47 3.3!.50 1.23 .57 24.94 4.26.75 1.37 .96 37.41 6.16
1.00 1.55 1.0.
49.241.25 1.9.3 1.14 62.36 i2.4n1.50 2.3u 1.67 74.23 17.031.75 3.14 2.2e a7.30 23.012.00 4.31 2.P4 99.77 30.772.25 7.44 5.25 99.27 40.4r2.50 16.26 11.4e 91.72 53.2'2.75 37.53 26.4c £3.57 74.203.00 18.26 11.44 75.42 115.273.25 7.44 5.2: 67.27 164.073.50 . 4.31 3.04 54.11 215.5r3.75 3.14 2.72 50.96 267.344.00 2.36 1.67 42.1 318.244.25 1.90 1.34 34.66 366.944.50 1.55 1.0v 26.51 410.4r4.75 1.37 .96 18.36 443.o!5.00 1.23 .P7 10.21 450.315.25 1.11 .7i 2.05 434.2?5.50 1.02 .72
408.775.75
379.0?6.00
346.446.25
311.746.50
275.7'6.75
238.7F7.00
201.3"7.25
163.717.5C
120.527.75
90.81
5.0.92E.25
401.96t .5C
30. 318.75 2e. tr4.30 17.779.25 12.9'9.5C 9.7?9.75 7.22
10.00 5.3r
10.25 3.9'10.50 3.Lic10.75 4.5e
Curvature around pea. a -360.566
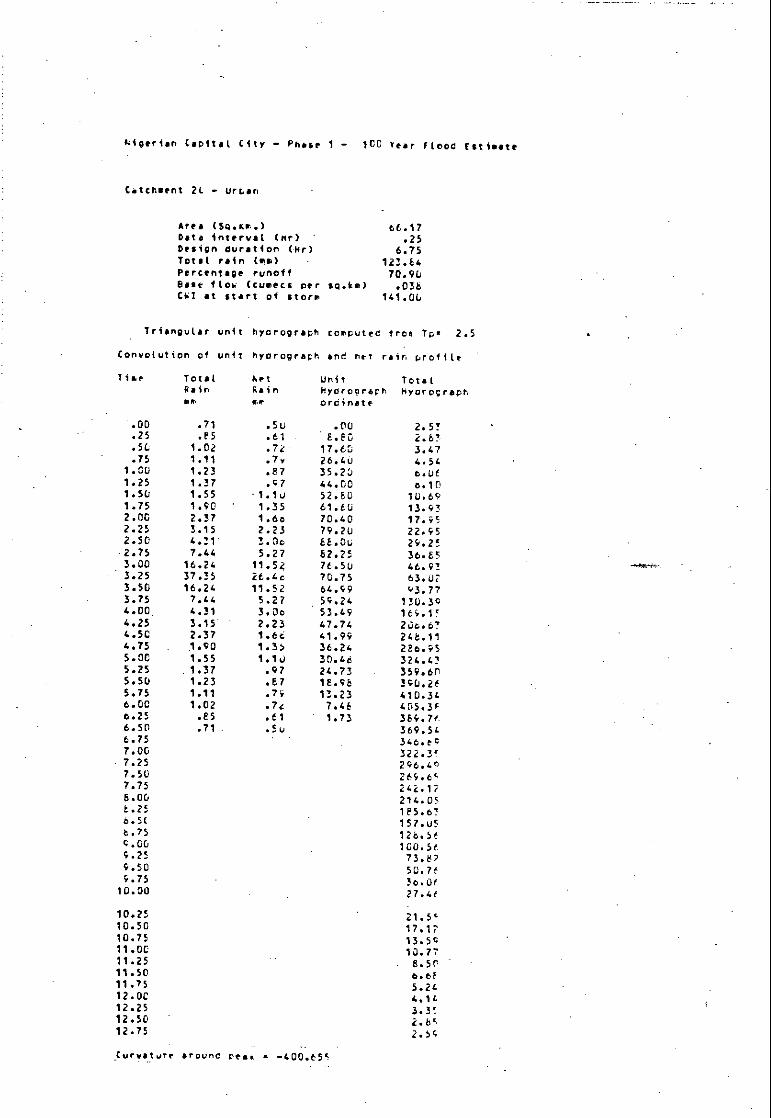
higerian Capital City - Phase 1 - 100 tear Flood Estimate
Catchment 21 - urt,an
area (546.sm.) 66.17Data interval (nr) ' .25Design duration (lir) 6.75Total rain tem/ 123.64Percentage runoff 70.9GBase Ito,. (cumecs per so.km) .0315Cal at start of storm 141.0G
Triangular unit hyorograph computed trot Tp= 2.5
Convolution of unit hyorograch and net rain profile
lime Total het Unit TotalRain Fain Myoroorach nyorographmn er ordinate
.00 .71 .50 .00 2.57
.25 .E5 .61 E.E0 2.63
.51 1.02 .74 17.61) 3.47
.75 1.11 .7v 26.40 4.541.011 1.23 .87 35.23
1.25 1.37 .G7 44.00 0.101.511 1.55 . 1.10 52.60 10.691.75 1.90 1.35 61.60 13.932.00 2.37 1.6o 70.40 17.952.2$ 3.15 2.23 79.70 22.952.50 4.31 1.00 66.06 29.2!2.75 7.44 5.27 82.25 36.653.00 16.24 11.54 76.50 46.9!3.25 37.35 26.4c 70.75 63.073.50 16.24 11.52 64.99 9 3.773.75 7./.4 5.27 59.24 170.394.00 4.31 3.0o 53.49 169.154.25 3.15 2.23 47.74 20c.674.50 2.37 1.66 41.99 246.114.75 1.90 1.35 36.24 236.955.0C 1.55 1.10 30.46 324.4!5.25 1.37 .97 24.73 159.6r5.50 1.23 .67 16.96 140.265.75 1.11 .7Q 13.23 410.346.00 1.02 .74 7.46 405.3E0.25 .E5 .61 1.73 364.7,6.50 .71 .5u
369.546.75
346.e7.00
322.3!• 7.25
296.407.50
269.6'7.75
242.178.00
214.055.25
1E5.6!6.5(
157.056.75
126.564.00
100.5t9.25
73.679.50
50.769.75
36.0(10.00
27.46
10.25
21.5'10.50
17.1710.75
13.5411.00
10.7711.25
8.5r11.50
0.15F11.75
5.2L12.0C
4.1412.25
3.3¶12.50
2.bc.12.75
2.5t
Curvature arourie Peat • - 400.655

algerion Capital City - Phase 1 - 100 Tear flood Estimate
Catchaent 2g - Urban
Area (56.am.) 67.22Data interval (lir/ .25Design duration (Mr) 6.75Total rain (ma) 122.43eeeeentage runoff 71.76Base llow (sumacs per sq.kal) .038Cal at start of storm 141.00
Triangular unit hyorograph compt4eo from Tps. 2.6
Convolution of unit hyorograph and net rain profile
i TotalRainit
Not-RainMP
Unitmyorographoroinate
TotalMyorocraph
.00 .72 .5e .00 3.34
.25 .07 .63 8.14 3.71
.50 1.04 .75 16.27 4.52
.75 1.13 ..°1 24.41 5.8C1.00 1.25 .991 32.54 7.7P1.25 1.39 1.0u 40.65 16.341.50 1.58 1.13 cE.E2 13.or1.75 1.93 1.34 56.95 17.672.00 2.40 1.74 65.09 22.772.25 3.19 2.29 73.22 24.0r2.50 4.35 3.11. 81.36 36.902.75 7.45 5.35 81.42 46.13e3.00 16.03 11.51 76.11 54.513.25 35.74 25.65 70.79 79.723.50 16.03 11.51 65.47 117.2r3.75 7.45 5.35 60.15 161.974.00 4.35 3.12 54.E4 204.1'4.25 3.19 2.29 40.52 257.394.50 2.40 1.74 44 .20 395.744.75 1.93 1.34 3E.EE 353.475.00 1.58 1.13 33.57 399.755.25 1.39 1.00 28.25 443.575.50 1.25 .99: 22.93 4E2.675.75 1.13 .81 17.61 512.206.06 1.04 .75 12.29 51E.6"6.25 .87 .63 6.98 505.4F6.50 .72 .52 1.66
6.75
457•5'7.01.
420.647.25
37.7.6F7.5C
3,5.er7.75
332.172.00
4.96.312.25
22.3.t6.50
226.6r5.75
143.41V.00
156.3T9.25
1Z4.u49.5C
0 1.014.75
93.6210.00
45.4'
10.25
34.7110.50
27.3410.75
21.7?11.00
17.2'11.25
13.7411.5C
10.6F11.75
it.5;12.00
6.7f12.25
5.3F12.50
12.75
3.71.13.60
3.41
Ceeeeeurr around real _a -313.74e

Nigerian Capital CitY ()nate - 100 te•r ii0061 Estimate
Catchment SA - Uri:an
Area C5o.sm)Data int l (lir)Design duration (nr)Total rain (Pm)Peeeeetape runoff
6.00•.25
4.25 122.22 67.74
Base flop (comets per so.km) .038Cvl af start of storm 141.00
Triangular unit hyorograch computeo trot To. 1.4
Convolution of unit hyorograph and net rain proli(e
Time Total Rat Unit TotalRain Rein Hydrocraph hydrocrapb
tar ordinate
.00 1.22 .84 .00 .2?
.25 1.37 .93 21.48 .34
.50 1.70 1.15 42.97 .5e
.75 2.13 1.44 64.45 .941.00 2.67 1.94 F5.94 1.501.25 3.98 2.6y 107.42 2.311.5C 7.18 4.ED 128.91 3.471.75 16.92 11.47 120.07 5.142.00 47.48 32.10 115.C3 8.112.25 16.92 11.47 100.99 15.or2.50- 7.18 4.86 86.95 23.092.75 3.98 2.6Y 72.91 31.4!3.00 2.87 1.94 58.26 39.60.3.25 2.13 1.44 44.82 47.183.50 1.70 1.15 30.78 53.063.75 1.37 .93 16.74 53.994.00 1.22 .5e 2.70 50.e44.25
46.254.50
40.4:4.75
35.325.00
29.435.25
23.435.50
17.425.75.
11.606.00
6.576.25
3.976.50
2.576.75
1.7?7.00
1.167.25
.7e
7.56
7.75
.375.00
.24
Curvature around real. -65.427
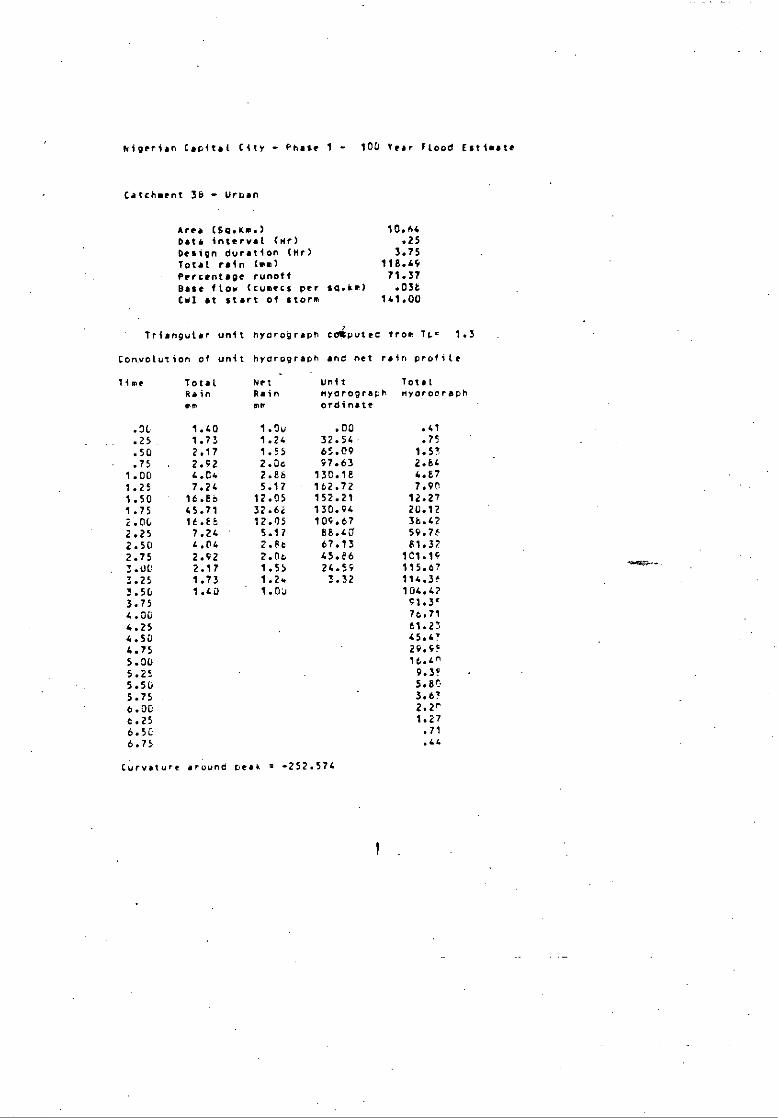
Nigerian Capital City - Phase 1 - 100 tear Flood Estimate
Catchment 36 - Urban
Area (Boa...) 10.64Data ineeeee 1 (mr) .25Design duration (fir) 3.75Total rain (mm) 118.49
Percentoge runott 71.37Base flow (tweets per so.lie) .038Cm1 at start of storm 141.00
Triangular unit hyorograph coiputec trot 149 1.3
Convolutionofunit
limeToni.Rainmm
hydrographand net rain profile
Net UnitTotalRainhydrographnyorooraphmmordinate
.0L 1.40 1.0u .00 .41
.25 1.73 1.24 32.54 .75
.50 2.17 1.55 65.09 1.5'
.75 2.92 2.0c 97.63 2.84
1.00 4.04 2.Eb 130.16 4.E7
1.25 7.24 5.17 162.72 7.901.50 16.E6 12.05 152.21 12.271.75 45.71 32.61 130.94 20.122.0L 16.25 12.05 109.67 38.42
2.25 7.24 5.17 68.40' 59.76
2.50 4.04 2.2t 67.13 61.372.75 2.92 2.06 45.26 101.193.00 2.17 1.55 24.59 115.673.25 1.73 1.24 3.32 114.31
3.5L 1.40 1.0J
104.423.75
91.394.00
76.71
4.25
61.234.50
45.474.75
29.495.00
16.4n5.25
9.39
5.50
5.8115.75
3.676.0L
2.2r6.25
1.276.5C
.71
6.75
.44
CUrvature arOund peak -252.574
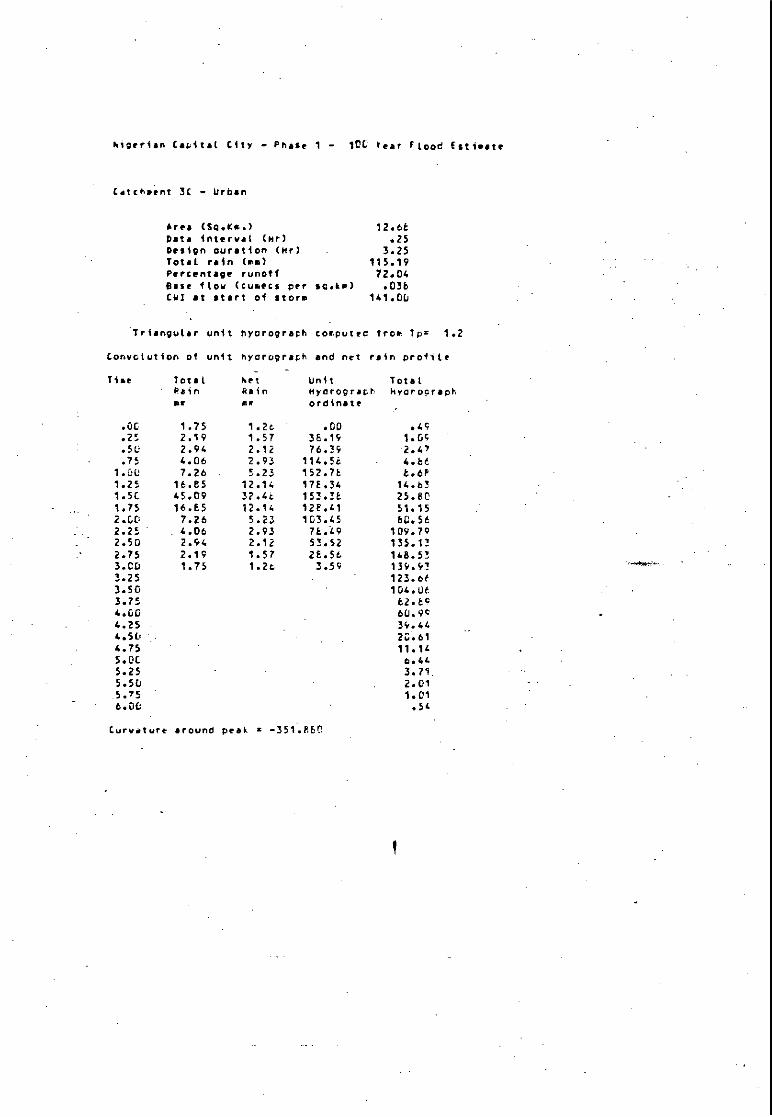
higerian Capital City - Phase 1 - 10C tear flood Estivate
(atchment 3( - Urban
Area (86.km.)Data Inaaaaa (0,-)Design ouration (mr)Total rain (mm)Percentage runotf
12.6E .25
3.25 115.19 72.04
Base flow (cumecs per sc.S0) .036[WI at start of storm 141.00
'Triangular unit nyorograrh computed from Tut 1.2
Convolution of unit nyorograch and net rain profile
Tin Tot•L ket Unit TotalPain Rain Myorograch Myorocraphor M. ordinate
.01 1.75 1.2c .00 .45
.25 2.19 1.57 36.19 1.GS
.5L 2.94 2.12 76.39 2.47
.75 4.06 2.93 114.5i 4.661.01' 7.26 5.23 152.7t 6.6P1.25 16.65 12.14 178.34 14.631.51 45.09 32.4c 153.26 25.8C1.75 16.65 12.14 126.41 51.152.00 7.26 5.23 103.45 60.562.25 ,4.06 2.93 76.49 109.792.50 2.94 2.12 53.52 135.132.75 2.19 1.57 26.56 148.5!3.CD 1.75 1.2c 3.59 139.4!3.25
123.0f3.50
104.063.75
62.694.00
60.9c4.25
39.444.512•
20.614.75
11.145.0C
0.445.25
3.71.5.5D
2.015.75
1.016.00
.54
Currrrrrr around peak 4 -351.88C

kigerian Capital City - Phase 1 - IC0 tear Flood Estimate
Catchment 3D - urban
Area (5o.S..) 19.6CDale interval (hr) .25Design ouration (mr) 3.75Total rain (ma) 116.67Percentage runoff 75.15base flow (cumecs per sci.sm) .036Ci.:1at start of storm 141.00
Triangular unit hyorograph corpfliec lrom Tor 1.3 '
Convolution of unit hyorogrsch and net rain profile
Time Total ket Unit 'TotalRain kain mydrogrepl hyorocraPE
cramnate
.00 1.44 1.0C
.75.25 1.72 1.34 32.54 1.44.50 2.23 1.67 65.05 2.9c.75 2.9; 2.25 97.63 5.15n
1.00 4.12 2.10 130.1C
1.25 7.32 5.50 162.72 15.6t1.50 16.77 12.61 152.21 24.2!1.75 43.39 32.62 130.94. 34.5F2.00 16.77 12.61 107.67 74.Or2.25 7.32 5.5u ee.40 114.212.50 4.12 3.1u 67.13 154.642.75 2.9; 2.25 45..E6 192.153.00 2.23 1.67 24.59 21;.1r3.25 1.7t 1.34 3.32 216.923.50 1.44 1.0o
19t..4r3.75
173.474.00
146.294.25
117.014.50
27.0f4.75
57.6r5.00
32.175.25
1C.575.50
11.475.75
7.1f6.00
4.376.25
2.49
6.56
1.3f6.75
.c?
Curvature Around peek . -465.904

APPENDIXC
25 yearreturnperiodruralcatchmentflpods

á

Nigerian Capital City - Pnase 1 - 25 Tear (loop Estimate
Catchment 14 - Rural
Area (521.6tm.) 2.32
Data interval (nr) .25
Design duration (Pr) 2.25
Total rain (mm) 92.75
Percentage runoff 61.22
base flow (cumecs per so.4m) .037
(wl at start of store 135.40
Triangular unit hyorograph coeputec fruit tor .E
Convolution of unit nyorograch ono net rain protile
Total Net Unit 'Total
Rain Fain wyorograt1 wyorporao1
mr ter ordinate
.0C: 2.34 1.43 .00 .04
.25 3.25 1.9w 25.C4 .37
.50 5.c 7.62 171.E8 1.0f
.75 1L.14 E.62 257.E1 2.4!
1.0C 41.45 25.3c 230.07 5.21
1.25 14.14 F.6c 173.90 12.41
1.512 5.92 3.64 117.73 20.24
1.75 3.25 1.9; 61.50 26.27
2.00 2.34 1.43 5.34 25.44
2.25
21.1r
2.5t.
15.49
2.75
9.57
3.00
4.ar
3.25
1.21
3.50
.21
3.75
.31
4.00
.1l
Curvature around peal. m -109.P72

Nigerian Capital City - Phase 1 - 25 fear floc(' Estimate
Catehcent to - Rural
area (5o.ile.) 7.41 •Data interval (lir). .25Design ouration (Mr) 6.25Total rain (em) . 107.95Percentage runoff 62.74Base flow (ousins Per sp.ra) .037CW1 at.start of store 138.40
Triangular unit hyorograph computeo Dow Tor 2.4C.
Convolution of unit hyorooraoh ono net rain profile
lime Total Net Unit TotalRain Rain nyorooraph nyurocraphSr MR orcinate
.00 .64 .4v .^Z 2F
.25 .77 4z 6.55 .31
.50 .b4 .53 15.10 37
.75 .52 54 2E.65 471.00 1.02 .64 38.19 .611.25 1.15 .7 47.74 .791.50 1.43 .94.; 57.24 1.031.75 1.79 1.1e 66.84 1.332.00 2.41 1.51 76.39 1.712.25 3.34 7.0; 65.94 2.2r2.50 6.01 3.77 69.17 2.el2.75 14.11 8.85 22.93 3.6'3.00 39.11 24.54 76.6.4 S.U!3.25 14.11 E.3 70.45 6.173.50 6.01 3.77 64.21 11.7!3.75 3.34 2.04 57.97 15.5e4.00 2.41 1.51 51.72
4.23 1.79 1.1e 45.48 21.3"4.51. 1.43 .9v 34.24 27.094.75 1.15 .74 33.0; 30.7!5.0L 1.02 .64 26.76 34.13.5.25 .52 .5e 20.52 36.875.5C .84 .53 14.28 37.695.75 .77 .40 8.04 36.81t.06 .64 .4u 1.F0 34.466.25
32.796.56
30.476.75
77.977.00
25.347.25
22.07.50
14.977.75
17.222.00
14.476.25
11.718.50
0.498.75
6.4r9.0C
4.1'9.25
2.024.50
2.12S.75
1.6!10.30
1.31
10.25
1.tiC10.50
.6110.75
.0.11.0C
.5311.25
.4!11.50
.3!11.75
.3112.00
.2c
Curvature around peak . -33.596
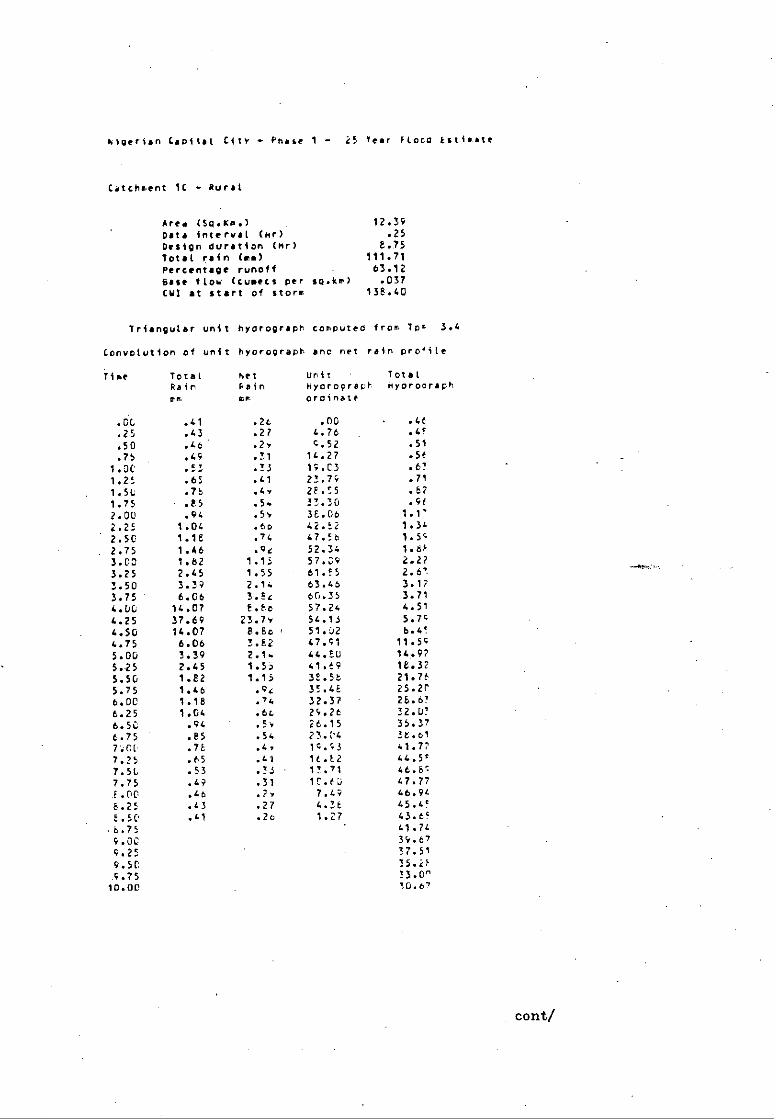
Algerian Capital CitY Prim 1 - 25 Tear Flood Estimate
Catchment IC - Rural
Area (56.1(m.) 12.39
Data interval (mr) .25
Design duration (mr) 8.75
Total rain (ms) 111.71
Percentage runoff 63.12
Base flow (cumecs per so.im) .037CW1 at start of storm 138.40
Triangular unit hyorograph computeo from Tot 3.4
Convolution of unit hyorograph ano net rain pro'ile
'Time Total het unit TotalRain Rain myorograch Myorooraph
we tr. oroinate
.00 .41 .24 .00 .46
.25 .43 .27 4.76 .45
.50
.29 C.52 .51
.75 .49 .31 14.27 .56
1.00 .53 .33 19.03 .67
1.25 .65 .41 23.79 .71
1.51 .75 .4, 25.55 .57
1.75 .E5 .54 13.30 .9t
2.00 .94 .5* 35.06 1.1'
2.25 1.04 .66 42.52 1.34
2.50 1.18 .74 47.5e 1.5c
2.75 1.46 .oe 52.34 1.8F
3.00 1.82 1.13 57.39 2.27
3.25 2.45 1.55 61.85 2.6'.
3.50 3.19 2.14 63.46 3.17
3.75 6.06 3.54 46.35 3.71
4.00 14.07 E.ho 57.24 4.51
4.25 37.69 23.75 54.13 5•79
4.50 14.07 8.84, 51.02 6.4!
4.75 6.06 3.82 47.91
5.00 3.39 2.14 44.80 14.97
5.25 2.45 1.55 41.49 18.32
5.50 1.82 1.15 38.56 21.76
5.75 1.46 .94 35.43 25.2r
6.00 1.18 .74 32.37 26.63
6.25 1.04 .66 25.24 32.0!
6.5C .94 .5v 26.15 35.37
4.75 .85 .54 23.U. 36.01
7'.0L .76 .4. 1;.53 41.72
7.25 .65 .41 14.52 44.55
7.51 .53 .33 17.71
7.75 .49 .31 1C.6U 47.77
E.00 .46 .2. 7.49 46.94
8.25 .43 .27 4.35 45.45
2.50 .41 .2o 1.27.
43.65
.5.75
41.74
9.00
35.67
9.25
37.51
9.50
35.2F
9.75
33.0"
10.00
10.67
cont/
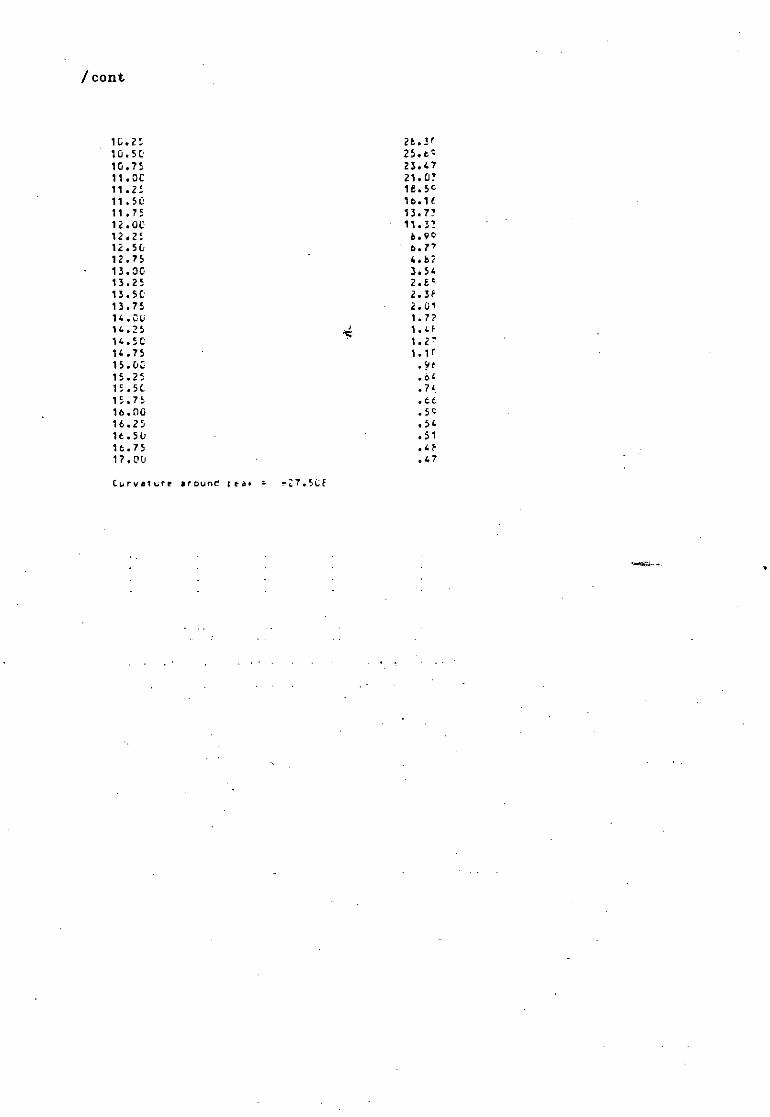
/ cont
1G.21 2b.3,10.5C 25.cc10.75 23.4711.0C 21.0711.21 16.5c11.50 16.1611.75 13.7712.0C 11.3!12.21 6.9012.50 6.7712.75 4.6213.3G 3.5413.25 2.Ec13.5C 2.3f13.75 2.0114.0C 1.7?14.25 1.4F14.5C 1.2'14.75 1.1r15.00 . ye.
15.25 .ol
15.5C •7L
15.75 .6616.00 .5c16.25 .54
16.50 .5116.75 .4F17.20 .47
Curvature around 66-a. r27.5CF
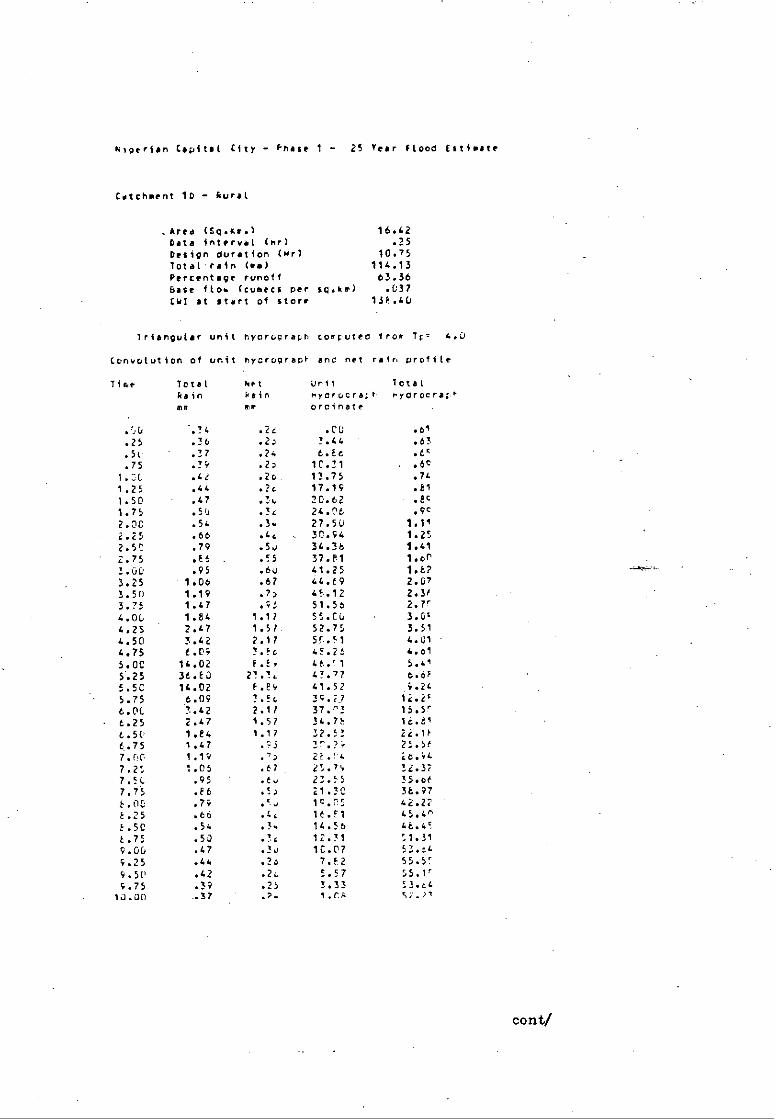
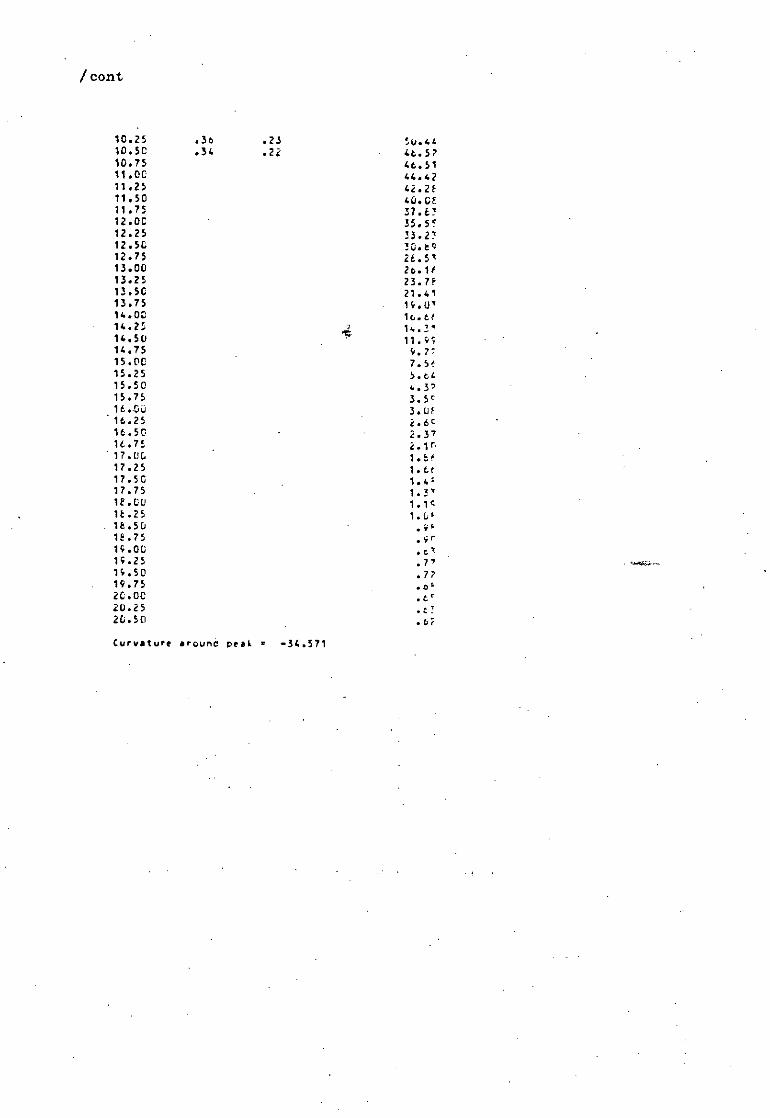
Nigerian Capital City - Phase 1 - 25 Tear Flood (stimate
Catchment 16 - aura/
_Area (So.me.) 16.42Data in 66666 (nr) .25
Design duration (wr) 10.75
7otal'rain Orm) 114.13
Percentage runoff 63.36
Base flo. (comets per coo...) .037
CM1 at Start 0/ StOrr 13/!..4/J
Iriangular unit hyorograth coecutet fro. 7c. 4.0
Convolution of unit hyorograpfr anc net raft. profile
Time Total hp/ unit TotalGain Fain nyorocra(6 nyOrocrarl'
ma n. oreinate
.'Al -.74 .24 .00 .61
.25 .36 .2; 3.44- .63
.5c •.37 .24 6.16 .66
.75 .34 .2; 10.31 ..6c
1.:c .42 .26. 13.75 .74
1.25 .44 .24 17.19 .21
1.50 .47 .3o 20.62 .64
1.75 .56 .36 24.06 .94
2.00 .54 .3. 27.50 1.11
2.25 .66 .4‘ 30.94 1.25
2.50 .79 .5o 34.36 1.41
2.75 .66 .55 37.61
1.60 .95 .60 41.25 1.67
3.25 '1.00 .67 44.f9 2.07
3.50 1.19 .7> 46.12 2.3'
3.75 1.47 .G:, 51.55 2.7r
1.64 1.17 55.C6 3.3'
4.25 2.47 1.57. 52.75 3.514.50 3.42 2.17 56.51 4.01
4.75 6.0; 3.6c 46.25 4.61
5.00 14.02 F.E. 4t.fl 5.41
5..25 3t.E0 27.1, 43.77 0.6F
5.50 14.02 F.EV 41.52 9.24
5.75 6.09 7.54 3G.73 ii.it6.00 7.42 2.17 37.n2 15.5r
6.25 2.47 1.57 34.75 12.61
6.51 1.64 1.17 12.51 22.16
6.75 1.47 .cs 3C.? 25.5t
7.60 1.19 .1'> 26.?4 it.GL7.25 1.05
.67 32.177.51. .95 .to 23.55 35.ot
7.75 .66 .5> 21.70 36.97
C.00 .79 .6o lc.C5 42.22
6.25 .66 .4, 16.61 45.4^
6.50 .54 .3. 14.56 46.45
6.75 .5) .74 12.31 51.51
9.00 .47 .30 10.07 53.64
9.25 .44 .2> 7.62 55.5r
9.5e .42 .2c 5.57 55.1r
9.75 .39 .25 3.33 53.641J.Cle -37
1.ra 5v.21
'
cont/
/ cont
10.25 .36 .23 14/.44
10.50 .34 .22 46.5710.7$
46.5111.00
44.4211.25
42.2E11.50
40.CE11.75
37.6!12.00
35.5!12.25
33.2712.50
30.8912.75
22.5"13.00
2o.lt13.25
13.50
21.4113.75
19.0114.00
16.6c14.25
14..3114.50
11.9;14.75
9.7715.00
7.5E15.25
5.6415.50
4.3715.75
3.5;16..00
- 16.25
16.50
2.3'16.75
2.1c17.0C
1.8317.25
1.ct17.50
1.017.75
1.3'12.00
1•1c12.25
1.LE18.50
.9E18.75
14.00
.2"15.25
.7'14.50
.7219.75
.6,20.00
.6'20.25
.2!20.50
.68
Curvature arourie peak • -34.571

higerian Capital City - Phase 1 - 25 tear Flood Estimate
Catchment 1E - Rural
Area (Solaallse) 103.64Data interval (nr) .25Design ouration Up) 15.25Total rain (ps) 114.34Percentage runoff 63.36Base flo. Ccume(s Per so.km) .037Col at start cf storm 135.46
Triangular unit hyorcgraph comAttec tram To. 5.8
Convolution of unit hyorograph and net rain profile
'rise TotalRale
hetkainft!
Unitnyorocrachoroinate
TotaleyorporapO
.0• .26 .16 .06 3.6P
.25 .26 .17 1.63 3.93
.5G .27 .17 3.27 3.96
.75 .26 .10 4.90 4.051.00 .29 .1, 6.54 4.1!1.25 .31 .1. 8.17 4.311.56 .33 .21 9.81 4.441.75 .35 .22 11.44 4.712.06 .37 .23 13.60 4.4e2.25 .33 .2. 14.71 5.2!2.56 .43 .2i 16.35 5•5c2.75 .42 .27 17.48 5.91
3.06 .45 .2: 14.62 6.33.25 .47 .3:. 21.25 6.66
3.50 .53 .32 22.89 7.3'3.75 .53 .3. 24.52 7.9'4.01) .5" .35 26.16 5.5P4.25 .61 .3r 27.74 9.2P4.50 .74 .47 24.43 10.044.75 .88 .53 31.06 16.875.00 %.96 .61 32.70 11.815.25 1.05 .67 34.33 12.645.50 1.15 .75 35.97 13.995.75 1.33 .84 37.66 15.2e6.00 1.63 1.0: 37.06 16.64.6.25 2.02 1.26 36.01 16.156.5r 2.68 1.7u 34.44 19.E'6.75 3.65 7.31 33.87 21.7'7.00 6.22 7.94 32.80 24.007.25 13.27 P.41 31.73 26.07.50 24.02 18.4g 30.66 31.117.75 13.27 8.41 29.6G 35.4r6.00 6.22 7.94 28.53 47.05
2.25 3.65 2.71 27.46
8.50 2.66 1.73 26.59
6.75 2.02 1.2z 25.32 75.0
9.06 1.63 1.03 24.25 55.5c4.25 1.33 .8. 23.16• 9 5.619.50 1.18 .75 22.10 1:5.0P4.75 1.05 .67 21.C5 115.79lo.nn .06 .61 19.Ce tiS.91
cont/

/cont
10.25 .ti .55 15.41 156.010.50 .74 .47 17.64 146.1110.75 .61 .39 16.77 156.1211.00 .57 .36 15.70 166.0311.25 .53 .34 14.64 175.8711.50 .50 .32 13.57 165.4611.75 .47 .3U 12.56 194.9712.00 .45 .26 11.43 204.1612.25 .42 .27 10.36 213.3412.50 .40 .25 9.29 221.6?12.75 .3i .24 6.22 229.5413.00 .37 .23 7.16 236.5713.25 .35 .22 6.04 241.5r13.50 .33 .21 5.02 241.2t13.75 .31 .1. 3.95 239.3414.00 .29 .19 2.65 235.5114.25 .26 .1c 1.P1 23u.4F14.50 .27 .17 .74 225.9214.75 .26 .17
zn. Se15.00 .26 .16
214.9415.25
209.1115.50
2G3.U415.75
196.5416.00
1;0.5416.25
164.0'16.50
177.4!16.7:
170.7717.00
164.0117.25
157.1P17.50
150.2417.75
143.3415.00
136.3515.25
124.3"16.50
122.2416.75
115.1'19.00
102.0"19.25
130.2F19.50
93.7119.75
56.5'20.00
79.6420.25
72.3220.50
65.2F20.75
521.2721.00
51.3421.25
44.5421.5C
37.9721.75
31.7122.00
26.0'22.25
21.6122.50
15.9r2E.75
16.9723.00
15.4723.2:
14.1123.5'2
12.9'23.75
11.4e24.'10
11.2724.25
10.2024.5C
9.5'24.75
25.00
2.2'25.25
7.7525.52
7.2725.75
0•t126.00
26.25
6. JA
26.50
5.7?26.75
5.4727.00
5.1727.25
4.9"27.50
4.7?27.75
4.542E.00
4.3F26.25
4.2426.50
4.1'26.75
4.0229.00
3,972:.25
3.9?24.50
3.54
Curvature arcunr ctv• - 4, ,r1:'
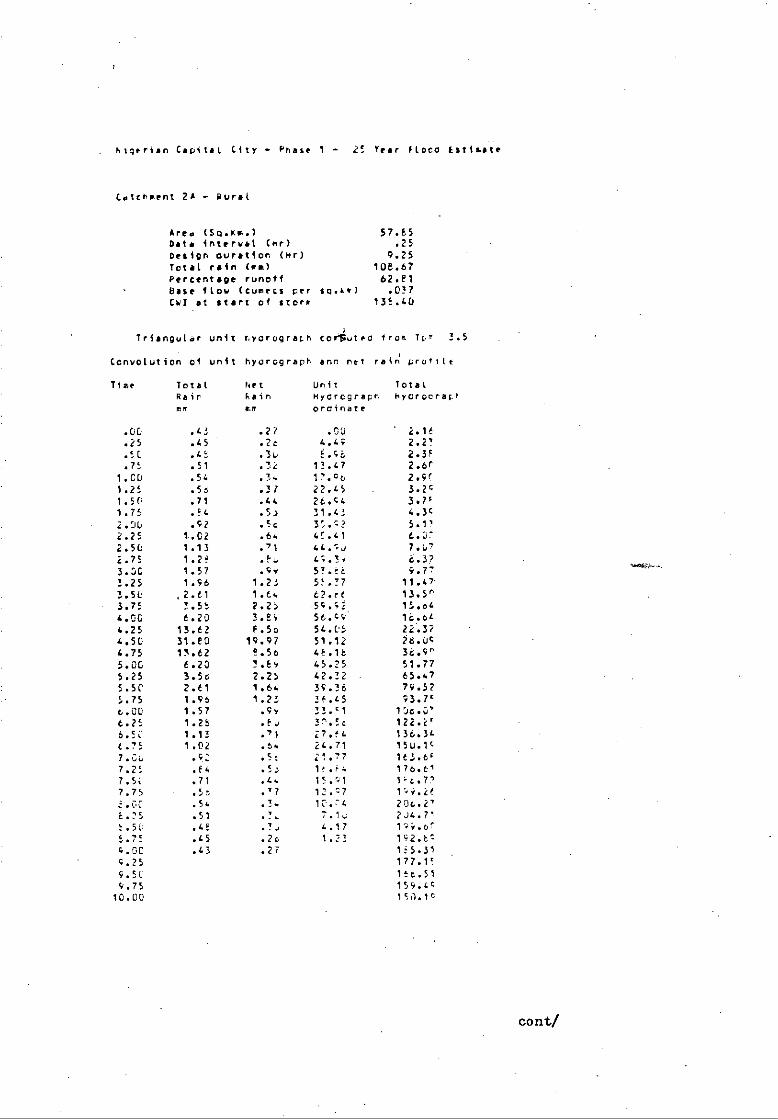
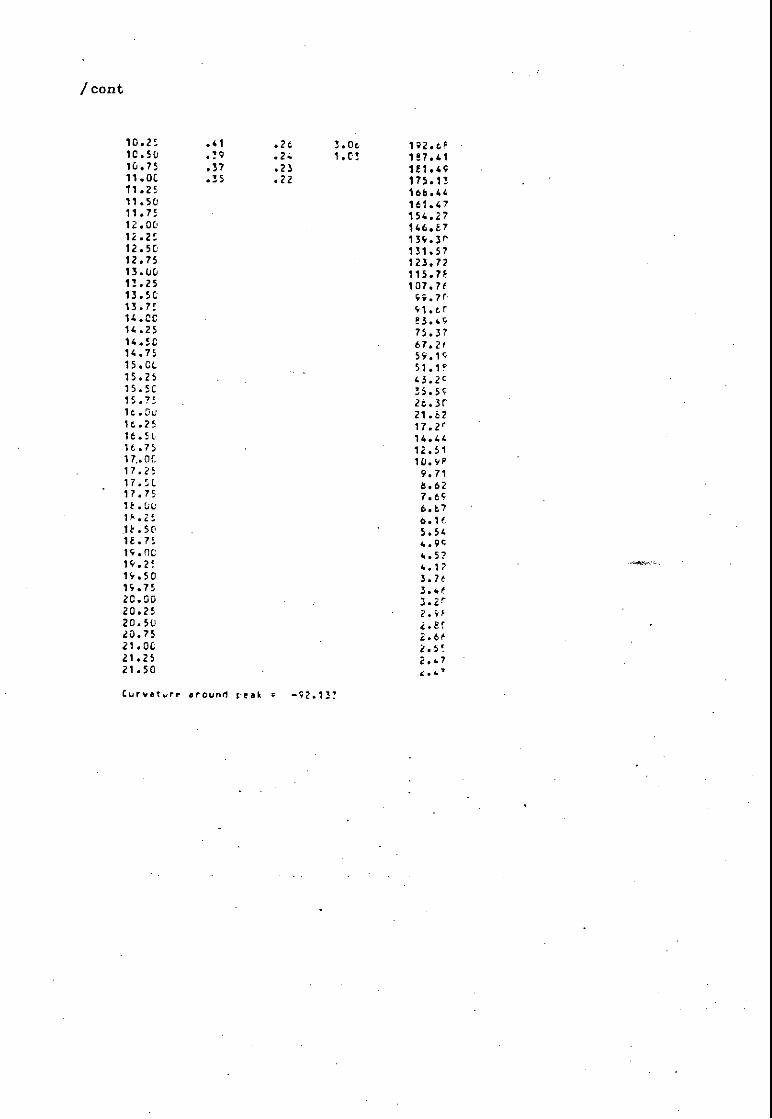
. higrrian Capital City Phase 1 - 2! Year Floco
Catchment 2A - aural
Are, (5o.rm.) 57.65Data interval (mr) .25
Design Gyration (vr) 9.25
Total rain Orm) 106.67
Percentage runoff 62.E1Base Ito. (oulness per sq.4c) .037
Cal at start of storm 136.40
Triangular unit hyorograch coeiuted Irom Tt,' 7.5
Convolution of unit nyorograph ann net rain profile
Time Total Net Unit Total
Rair Fain Hydrograpn ilyCf0Crari
ordinate
.00 .4: .27 .00 ' 2.14
.25 .45 .2c 4.4? 2.23
.51 .L‘ .3u F.GE 2.3F
.75 .51 .32 13.47 2.6r
1.00 .54 .34 17.4s 2.91
1.25 .56 .31 22.45 3.29
1.50 .71 .44 26.94 3.7F
1.75 .F4 .5: 31.43 4.3c
2.0U .92 .5.2 35.92 5.1!
2.25 1.02 .64 41.41 6.37
2.50 1.13 .71 44.CJ 7.E7
2.75 1.2€' .FE 49.3, 6.3?
3.30 1.57 .Gr 53.SE 9.77
3.25 1.96 1.23 55.37 11.47
3.50 ,2.61 1.64 t2.r6 13.5^
3.75 3.55 7.25 34.92 15.o4
4.06 6.20 3.ES 56.'9 16,64
4.25 13.62 F.56 54.05 22.37
4.50 31.E0 14.47 51.12 ii.09
4.75 13.62 6.56 4E.12 36.9^
5.06 6.20 3.64 45.25 51.77
5.25 3.56 2.25 42.32 65.47
5.50 2.61 1.64 39.36 79.52
5.75 1.95 1.23 25.45
6.00 1.57 .9r 33.'1 106.37
6.25 1.25 .F3 3'.5E 122.2'
6.53 1.13 .7i 27.4' 136.34
6.75 1.02 .54 24.71 15U.1c
7.0E .G2 .5: 21.77 163.5'
7.25 .F4 .5; 1( .44 176.61
7.5: .71 .44 15.51
7.75 .55 .T7 12.47 1%9.ir
.00 .54 .7. 1T'.r4 206.2'
F.25 .51 .:. 7.1E 234.71
t.50 .45 •7J 4.17 1%S.or
5.75 .45 .2c 1.23 192.5c
9.06 .43 .27 155.31
9.25 177.15
9.50 15.6.51
9.75 159.4c
10.00 131.1G
co nt/

/cont
10.2510.5C10.7511.0011.2511.5C11.7512.CC12.2512.5012.7513.0013.2513.5013.7514.0C14.2514.5014.751s.ric15.2515.5U15.7514.0016.2514.5016.7517.0i17.2517.5017.7;
141.4.4413G.e9120.97110.92100.7440.41
70.24t0.1750.1740.3731.1!23.0'17.5714.2712.u11U.2'k.c17.t!
5.714.97
4.34
3.t?3.393.U42.7!
2.3!
e.fl
Curvature •oun!, prat -135.t3t

Nigerian Capita( City - Phase 1 - 2! Tear Flood E$$$$$ te
•
Catchment 2e - Rural
Area (Scp.4m.) 64.45Date interval (hr.) .25Design ouration (Br) 11.25Total rain Com) 111.33Percentage runoff 63.06
' Base flow (cumecs per Sp.km) .037Cyr at start of storm 135.4U
Triangular unit hyorograch c6Riputed from Tpm 4.2
Convolution of unit hydrograph and nrt rain profile
Time Tctal Net Unit lotilRain Rein hydroprapn Myerperaprsr •r ordinate
:Of, .35 .24 .no 2.41.25 .17 .25 1.12 2.42.5U .39 .24 6.24 2.52.75 .41 .26 5.25 2.65
1.00 .43 .27 12.47 2.E!1.25 .45 .2, 15.59 3.1'1.50 .46 .3u 12.71 3.421.7: .51 .2c 21.23 3.CL2.00 .55 .35 24.54 4.232.25 .5% .27 22.04 4.732.50 .71 .45 31.18 5.302.75 .F5 .5% 34.2u 5.973.00 .42 .59 37.41 6.743.25 1.02 .65 4r..53 7.6'3.50 1.14 .74 42.65 6.c33.75 1.29 .21
4(.774.00 1.56 1.C.) 45.25 11.1C4.25 1.97 1.24 21.57 12.o04.50 2.62 1.65 4e.P4 14.3'4.75 5.59 2.27
47.4C5.00 4.21 2.51 45.26 10.615.25 13.57 2.5o 42-F2 21.05.50 31.24 19.7% 41.75 24.275.75 13.57 F.5o 39.75 54•7%6.00 f .21 3.91 37.71 .44.926.25 3.59 7.27 35.67 55.734.50 2.t2 1.65 22.f.3 66.oP6.75 1.97 1.2% 31.59 78.2'7.00 1.55 1.nU 2c.5c. Pisa`725 1.2% .F1 27.52 101.157.50 1.14 .74 25.4t 112.527.75 1.02 .6o 27.44 123.942.20 .93 .5r 21.41 135.15E .25 .35 .54 15.37 146.2f6.50 .71 .45 17.73 157.L%5.75 .5% .37 '15.29 167.5F9.00 .55 .35 13.25 177.55.9.25 .51 .32 11.22 1E6.779.50 .“ .3u 9.15 104.369.75 .43 .29 7.14- 1+8.'7
r..in
cont/
/ cont
10.25 .41 .24 3.0c, 192.01C.50 .19
1 .C3 137.4110.75 .37 .23
1E1.4911.0C .35 •22
175.1311.25
166.44
11.50
161.47
11.75
154.27
12.00
146.3,7
12.2:
134.3r'
12.50
131.57
12.75
123.77
13.00
115.73
13.25
107.7f
13.50
G9.7r
13.75
91.er14.CC
33.4G14.25
75.3714.50
67.2e14.75
59.1915.CL
51.1915.25
43.2r15.5C
35.5915.75
26.3r16.0u
21.6216:25
17.2r16.5C
14.4416.75
12.5117,01
10.9317.25
9.7117.5C
6.6217.75
7.69lt.00
6.671.25
6.16It.50
5.5412.75
4.9C14.00
4.5?14.2!
4.1714.50
3.7e14.75
3.4r20.00
3.2r20.25
2.4420.50
4•8f20.75
2.6t21.0C
2.5!21.25
2.4721.50
2•41
Curvature around peak -o2.133

kigerian Capital City - Phase 1 - 2! Year Flomo Estimate
Catchment 2C - aural
Area (541.1(0.) 66.17Data in aaaaa (nr) .25Design ouration (Mr) 13.25Total rain (am) 113.72Percentage runoff 63.32Base Ito.. (cumecs per so.sm) .037Cul at start of storm 13E.40
Triangular unit hyorograph Sputeci troe To: 5.0
Convolution 01 unit hyOrograph and net rain prolile
Time Totalapinme
NetRainso
Unitnyorograchordinate
TotalHyoronrai*
.00 .21 .14 .00 2.4!
.25 .33 .1v 2.20 2.56
.50 .32 .2u 4,40 2.51
.7: .34 .2e 6.60 2.64
1.00 .35 .22 F.60 2.71
1.25 .37 :23 11.00 2.96
1.50 .34 .25 13.20 3.0P
1.75 .41 .26 15.40
2.00 .43 .27 17.60 3.5'
2.25 .45 .24 14.E0 3.6'
2.50 dia .31 22.00 4.1P
2.75 .51 .33 24.20 4.5f
3.00 .55 .15 26.40
3.25 .59 .37 2E.63 5.4,
3.50 .71. , L5 30.10 6.0°,
3.75 .85 .54 33.63 6•0r
4.00 .43 .5: 35.20 7.2!
4.25 1.02 .65 37.40 6.34
4.50 1.14 .7e 39.60
4.75 1.29 .8e 41.50 5.if
5.00 1.59 1.0u 44.00 13.44
5.25 1.97 1.25 42.56 12.11
5.50 2.62 1.66 41.12 13.4c
5.75 3.60 7.2o 39.64 14.4f
6.0C 6.21 7.43 31.25 16.7t
6.25 13.55 F.56 36.11 14.U7
6.50 31.17 14.73 35.37 22.51
6.75 13.55
F.56 26.Ec
7.00 1.21 1 .93 32.!•.; 36.4'
7.25 3.6J 2.20 31.06 44.4'
7.50 2.6: 1 .66 20.6i 52.64
7.75 1.97 1,25 2.5.16 61.17
1.00 1.59 1.CuJ 26.75 84.64
t.25 1.2g .12 25.31 7:.2c
1.53 1.14 .'2 22.17 66.47
5.75 1.02 .65 22.43 V5.51
4.00 .43
.5, 104.16.
4.25 .es .54 19.5c 112.76
4.5o .71 .4) 11.12 121.1'
4.75 .59
.37 124.57
10.00 .55 .s., 15.74 117.7c
cont/

/cont
16.25 .51 .33 13.E0 145.fl10.56 .48 .31 12.37 153.5!10.75 .45
10.93 160.9511.00 .43 .27 9.49 167.6511.25 .41 .26 E.05 173.8211.50 .39 .25 6.61 177.8311.75 .37 .23 5.1E 177.0'12.00 .3$ .2c 3.74 174.3212.25 .34 .2e 2.30 170.6712.50 .32 .2u .E6 166.4712.75 .10 .15
161.2e13.00 .2E .16
157.0413.2$
152.02
13.50
146.6213.75
141.4/14.00
135.9914.25
130.3414.50
124.4914.75
110.6P15.00
113.0!15.25
107.1115.50
101.1"15.75
95.1'16.00
69.1116.25
63.0/16.50
76.9716.75
70.6F17.0C
64.8n17.25
56.7717.5C
52.6717.75
40.016.0C
40.6912.25
34.2716.5G
29.1416.75
23.7419.00
16.8F19.2:
15.2/19.50
13.1119.75
11.5920.00
10.3P20.25
9.3020.5t
6.4920.75
7.7'21.00
7.0521.25
6.4521.50
5.9121.75
5.4422.00
5.0?22:25
4.6422.50
4.3122.75
4.0123.00
3.7123.25
3.51"23.56
3.2'23.7!
3.1124.06
2.9e24.25
24.50
2.7124.75
25.00
2.5e25.25
2.5125.50
2.49
Curvature •round reek = -75.434

Nigerian Capital City - Phase 1 - 25 fear Flood Estimate
Cmtchment 20 - Rural
area (541.mm.) 87.22Date inaaaaa (nr) .25Design duration (mr) 15.25Total rain (me) 114.90Percentage runoff - 63.44ease flow (cumecs per sa.km) .037CW1 at start of storm 138.4U
Triangular unit hydrograph coOfiuted from Tp= 5.8
Convolution of.unit hyorograph and net rain profile
Time Total het Unit TotalPain Rain nydrograc6 1190rOgrart.mm me ordinate
.06 .25 .lo .00 3.26
.25 .26 .17 1.63 3.20
.50 .27 .17 3.27 3.33
.75 .2E .16 4.90 3.40
1.00 .29 .16 6.54 3.501.25 .33 .19 8.17 3.621.5C .32 .21 9.61 3.771.75 .35 .2e 11.44 3.952.00 .36 .23 13.06 4.1e
2.25 .36 .24 14.71 4.41
2.50 .40 .25 16.35 4.6c
2.75 .42 .2c 17.96 5.0r3.01 .44 .24 19.62 5.3c3.25 .47 .3u 21.25 5.743.50 -.49 .31 22.89 6.1'3.75 .53 •33 24.52 6.6'4.00 .56 .3o 26.10 7.1F4.25 .150 .30 27.79 7.7f
4.50 .73 .46 29.43 6.39
4.75 . .67 .55 31.06 9.0
5.00 .95 .60 32.70 9.e6
5.25 1.04 .66 34.33 10.72
5.5C 1.16 .74 35.97 11.675.75 1.32 .63 37.63 12.736.0C 1.61 1.CE 37.08 13.6?6.25 2.00 1.27 36.01 15.146.50 2.66 1.69 34.94 16.546.75 3.63 2•2c 33.67 16.1'7.0G 6.22 5.94 32.6u 20.0?
7.25 13.32. F.s, 31.73 22.41
7.5L 29.62 16.96 30.66 25.9'
7.75 13.3.5 6.4. 24.6j 52.1'
6.06 6.22 5.9s 25.52 34.5'
3.25 3.63
2.3u 47.47
E.50 2.66 1.64 26.24 5$.57
6.75 2.00 1.2/ 25.32 63.67
9.00 1.11 1.06 2S.22 72.31
9.25 1.32 .62 23.16 6U.67
9.50 1.16 .74 22.12 64.3'
4.75 1.04 .66 21.05 97.4'
10.00 _2.95 .Au 14.44 in6.sE
contI

/cont
10.25 .67 .5: 16.91 115.1510.50 .73 .46 17.64 121.7:10.75 .60 .36 16.77 132.2711.00 .56 .34 15.70 140.6!11.25 .53 .33 14.64 148.4711.50 .49 .31 13.57 157.1711.75 .47 .3J 12.50 165.2212.00 .44 .24 11.43 173.0P12.25 .42 .2o 10.36 1E0.6412.50 .40 .25 4.29 127.9612.75 .32 .24 6.22 194.711.00 .16 .21 7.16 200.7213.25 .35 .22 6.09 204.9413.50 .32 .21 5.02 205.2!13.75 .30 .1. 3.9: 203.0414.00 .2i .1t 2.82 1Q4.7!14.25 .28 .16 1.F1 145.c!14.50 .27 .17 .74 141.Se14.75 .26 .17
1P.c.9"15.00 .25 .16
“2.1'15.25
177.2115.50
172.2c15.75
1tc.6716.00
161.4216.25
15$.9116.5C
150.3r1t.75
144.6117.CC
136.8f17.25
131.0417.51
127.2417.75
121.3418.00
115.4118.25
1Ci.4418.50
103.4418.75
47.4114.00
01.3e14.25
19.:0
74.2414.75
73.120.06
67.1420.25
M.1720.50
55.1220.75
49.1F21.00
43.2421.25
17.5!21.50
31.9521.75
26.6222.00
21.7422.25
16.0522.50
15.7722.75
14.1f23.00
12.6723.25
11.7523.50
10.c!21.75
9.4424.00
9..2424.25
24.50
7.9724.75
7..225.00
6.4725.25
6.4425.50
6.Lic25.75
26.01
26.25
26.50
4.b126.75
4.Sf27.00
4.3427.25
4.1427.50
3.9f27.75
3.t126.00
3.oF26.25
1.5726.50
3.4726.75
3.4r24.00
1.3425.25
3.1r25.50
3.2'
f • r
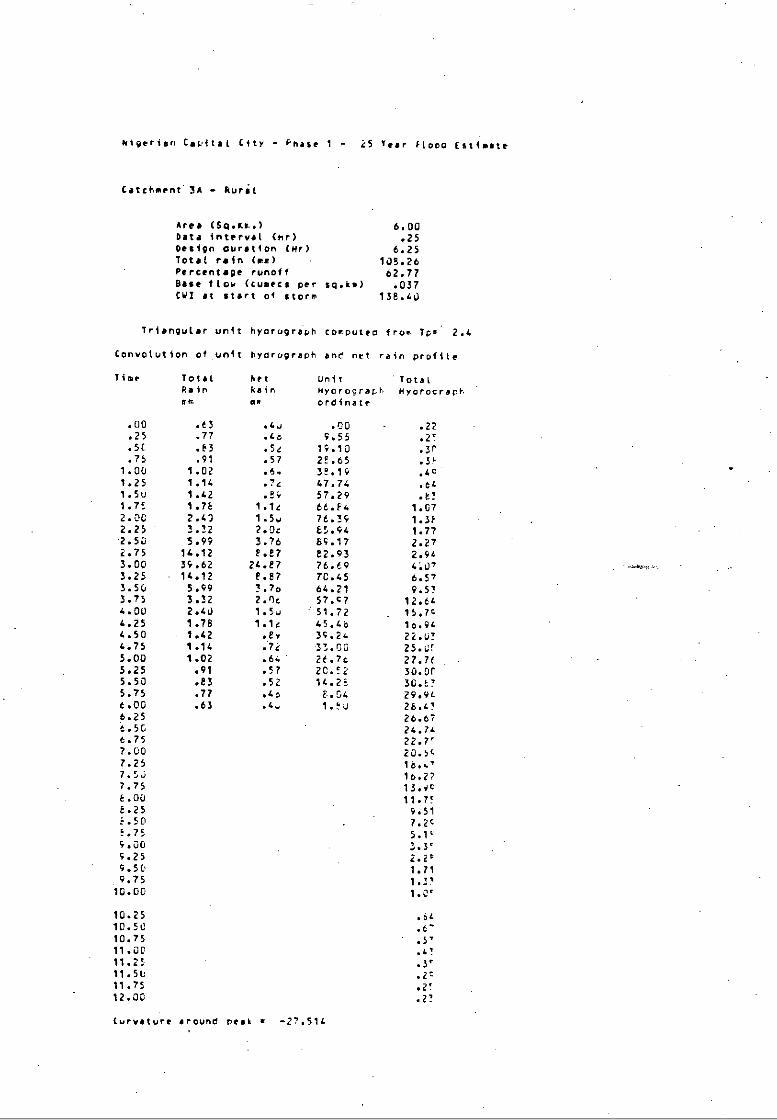
wig Capital City - Phase 1 - 25 tear fl000 Estimate
Catchment 34 - aural
Area (5.1.4s.) 6.00Data interval (nr) .25Design ouration (mr) 6.25Total rain (me)105.26 •Percentage runoff 62.77Base flow (cumecs per sq.km) .037CWI at start of storm 138.40
Triangular unit hyorograph computeo from Tom 2.4
Convolution of unit hyorugraoh and net rain profile
lime TotalAminmm
NetRain
MR-
unit4yorograpli
ordinate
TotalHyorooreOT
.00 .63 .4o .00 .22
.25 .77 .46 9.55 .2!
.50 .E3 .5e 19.10 .3r
.75 .91 .57 21.65 .3h1.00 1.02
31.19 491.25 1.14 .72 47.74 .641.5u 1.42 .14 57.29 .t!1.75 1.7E 1.12 64.F4 1.072.0U 2.43 1.5u 76.39 1.312.25 3.32 2.0c 25.44 1.77-2.50 5.99 3.76 69.17 2.272.75 14.12 E.17 82.93 2.943.00 39.62 24.27 76.69 4:073.25 14.12 1.87 70.45 6.573.50 5.99 3.70 64.21 9.573.75 3.32 2.112 57.C7 12.644.00 2.40 1.5o ' 51.72 15.7c4.25 1.78 1.1c 45.46 16.944.50 1.42 .fi. 54.24 22.U74.75 1.14 .7k 33.00 25.915.00 1.02
26.74 22.2!5.25 .91 .57 20.52 50.0T5.50 .23 .52 14.2E 30.475.75 .77 .4o 6.04 29.444.00 .65 .4, 1.0 26.4,6.25
26.676.50
24.746.75
22.7r7.00
20.547.25
16.07.50
16.277.75
15.i46.00
11.7!6.25
4.51E.50
7.241.75
5.1cS.00
3.5.9.25
2.24.5o
1.719.75
1.1710.00
1.0'
10.25
.6410.50
10.75
.5'11.00
.4711.25
.3"11.5U
.2911.75
.2!12.00
.27
Curvature around peak e -27.514
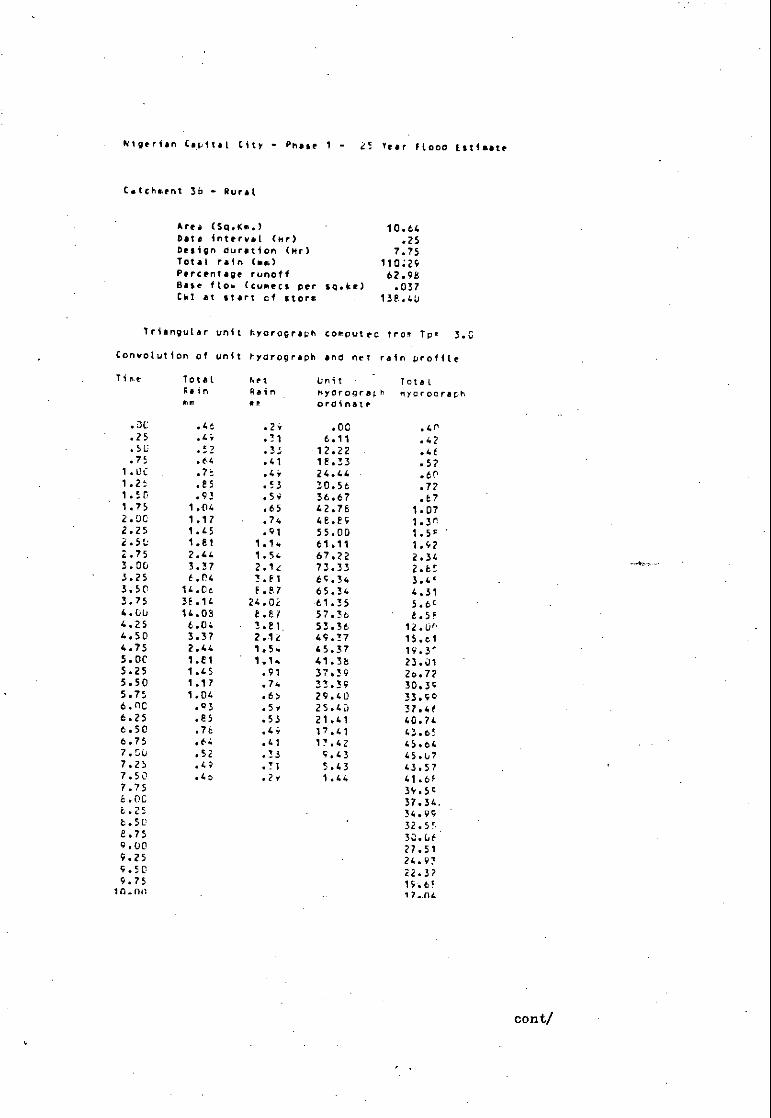
Algerian Capital City - Phase 1 - 25 Year Flood Estimate
Catchment 36 - Rural
Area (5q.km.) 10.64Date interval (HO .25Design duration (ir) 7.75Total rain (me) 110.29Percentage runoff 62.98Base flow (cumeds per sg.k.) .037Cvl at start cf storm 13F.40
Triangular unit hyorograph computec from Tom 3.5
Convolution of unit hyorograph and net rain profile
Tise TotalRaine
hetRainCR
Unit•myorpqrathordinate
Totalnyorooraph
0C .4t .24 .00 .411.25 .44 .71 6.11 .42.50 .52 .33 12.22. .46.75 .64 .41 18.33 .57
1.0C. .7t .49 24.44. .601.25 .85 .53 30.56 .771.50 .93 .54 36.67 .67
'1.75 1.04 .65 42.76 1.072.00 1.17 .74 48.89 1.3'2.25 1.45 .91 55.00
1.50 1.81 1.14 61.11 1.922.75 7.44 1.54 67.22 2.343.00 3.37 2.12 73.33 2.653.25 6.4 3.F1 69.34 3.4'3.50 14.06 F.P/ 65.34 4.313.75 38.14 24.02 t1.35 5.694.00 14.03 8.81 57.36 '8.584.25 6.04 3.81. 53.36 12.0''4.50 3.37 2.12 49.37 15.614.75 2.44 1.54 45.37 19.355.00 1.81 ' 1.14 41.36 23.015.25 1.45 .91 37439 26.725.50 1.17 .74 33.39 30.305.75 1.04 .6S 29.40 33.906.00 03 .54, 25.40 37.466.25 .85 .53 21.41 40.746.50 .78 .49 17.41 41.656.75 .64 .41 17.42 45.647.50 .52 .35 0.43 45.u77.25 .49 .31 5.43 43.577.50 .4o .2* 1.44 41.6F7.75
39.596.00
37.34.8.25
34.99'8.5C
32.55.2.75
30.069.00
27.519.25
24.939.50
22.32
9.75
10.n0
1 7..11L
cont/

/cont
11,.251Q.5v1D.7511.0011.2511.5L11.7512.0c12.2512.5u12.7513.nb11.2512.5013.7514.0u14.2514.5t,14.7515.ut•
1..41I1.304.LLtot2.4.7b3.37
2.76 1.79 1.4Q
75.e556Lo46
,0
Curvature orOunC r.tai-4 0497

higerian Capital City - Pnase 1 - 25 tear Flood Estimate
Catchment 3C - Rural
area (5o.se.) 12.68Data in aaaaa (Kr) .25Design duration (Kr) 8.25Total rain (mm) 110.85Percentage runoff 63.03base flow (cumecs.Per so.ke) .037CUT at aaaaa of storm 138.40
Triangular unit nyorugrach car/doted trot To= 3.2
Convolution of unit nyorograpn and net rain profile
Time TotalRainan,
hetRein
PTIr
UnitHyorogral.tordinate
TotalKyorodreph
.00 .44 .27 .03 .47
.25 .46 .2. 5.77 .49
.50 .49 .11 10.74 51
.75 .53 .73 16.11 591.CL .65 .41 21.48 .671.25 .74 26.86 .781.50 .95 32.23 .931.75 .94 .54 37.60 1.112.00 1.04 .6o 42.97 1.3'2.25 1.15 .7. 45.34 1.602.50 1.46 .9.. 53.71 1.912.7$ 1.62 1.15 sy.rs i•293.00 2.45 1.55 64.45 2.7'3.25 3.39 2.1. 68.05 3•3f3.56 6.06 3.84 64.54 3.973.75 14.06 E.E4 61.03 4.874.00 37.62 23.71 57.52 6.344.25 14.06 f.Po 54.01 9.3P4.50 6.06 3.8e 50.50 12.914.75 1.79 7.1. 46.9! 16.7'5.00 2.45 1.55 43.47 20.665.25 1.P2 1.15 39.96 24.5°5.50 1.46 .94 36.45 26.515.75 1.16 .74 32.94 32.406.00 1.04 .66 29.43 36.250.25 .94 .5. 25.92 39.996.51 .65 .5.. 22.41 43.596.75 .76 .44 19.90 44.9"7.00 .65 .41 15.35 49.er7.25 .53 .33 11.E8 51.347.51, .49 .31 8.17 50.577.75 .46 .2v 4.P6 46.946.04 .44 .27 1.35 4b.916.25
4..776.50
42.368.75
39.899.0C
37.349.25
34.779.50
Ii.049.75
29.31lo.nn
2n. Si
cont/

/cont
10.25 23.6C10.50 21.0210.75 16.2,11.00 15.4t11.25 12.7111.50 10.0111.75 7.4F12.00 5.2512.25 3.8712.50 3.0'12.75 2.5113.00 2.1r13.25 1.7F13.50 1.5113.75 1.2c14.00 1.1r14.25 .‘4
14.50 .L214.75 .7115.00 .6'15.25 •5715.50 .5715.75 .5r16.00
Curvature around peak k -37.016

higerian Capital City - Phase 1 - 25 Sear Flood Estimate
Catchment 3D - Rural
area (Sq.4m.) 19.60Data in aaaaa (sir) .25Design duration (Kr) 11.75Total rain (mm) 115.06Percentage runoff 03.46base flow ((urets per sc.ka) .0370+1 at start of storm 138.40
TrAangular unit hydrugraph computec from To. 4.4
Convolution of unit hycrograph and net rain profile
Time Total het Unit TotalRain Rain Hydrograch. hydrooraehNM. MIL ordinate
.00 .32 .20 '.00 .73
.25 .33 .21 2.84 .74
.50 .34 .22 5.6c •77
.75 .36 .23 8.52 br1.00 .3e .24 11.34. .651.25 .40 .2e 14.20 .411.50 .42 .27 17.05 .GG1.75 .44 .2.3 19.84 1.082.00 .47 .5... 22.73 1.1r2.25 .53 .3c 25.57 1.3r2.50 .54 ;54 26.41 1.442.75 .66 .4c 31.25 1.6r3.00 .63 .51 34.09 1.793.25 .87 .53 36.93 2.0"3.50 .96 .61 3;.77 2.243.7.5 hilt, .66 42..51 2.574.00 1.73 .7o 45.45 2.b74.25 1.49 .94. 48.33 3.1F4.50 1.86 1.13 49.26 3.554.75 7.49 1.5c 47.40
5.00 3.44 2.10 45.54 4.5'5.25 6.11 3.87 43.69 5.1'5.50 13.99 8.3o 41.33 5.455.75 36.23 22.97 39.97 7.2t6.00 13.99 E.bo 36.12 9.bn6.25 8.11 !..r7 36.26 12.616.50 3.44 7.14 34.40 16.0r0.75 2.44 1.50 32.55 19.2G7.00 1.to 1.1e 3E..e9 22.047.25 1.49
25.63 26.027.50 1.23 .7o 26.Ge 29.417.75 1.00 .5c 25.12 32.7G6.00 .96 .61 23.26 36.1f6.25 .87 .55 21.41 39.518.50 ..60 .51 19.55 42.316.75 .66 .42 17.69 40.0•9.00 .54 .34 15.63 45.2r4.25 .50 .32 13.90 52.359.50 .47 .30 12.12 55.259.75 .44 .26 10.2o 57.9710.00 .42 .27 R.41 hn.1*
cont/

/cont
10.25 .40 .25 6.55 60.9710.50 .38 .24 4.69 60.2?10.75 .36 .25 2.84 58.8711.00 .34 .22 .98 57.2711.25 .33 .21
55.4211.50 .32 .2u
53.5'11.75
51.5r
12.00
49.47
12.25
47.3C
12.50
45.12
12.75
42.9r
13.00
40.eL
13.25
36.34
13.50
36.0713.75
33.6914.00
31.3?14.25
28.9e14.50
26.5414.75
24.2115.00
21.8415.25
19.4'15.50
17.1115.75
14.7710.00
12.4t16.25
10.2116.50
8.0616.75
6.1517.00
4.7417.25
4.0417.5:
3.5117.75
,3.1118.C.3
2.7'15.25
2.4c18.30
2.2718.75
2.0119.00
19.25
1.0419.50
h.;19.75
1.3'20.00
hie20..25
1.1e20.50
20.75
21.00
.6721.2.5
.6121.50
.8721.75
.7'22.00
.7722.25
.7922.50
.74
Curvature around pea& . -25.317

á

APPENDIXD
100yearreturnperiodruralcatchmentfloods
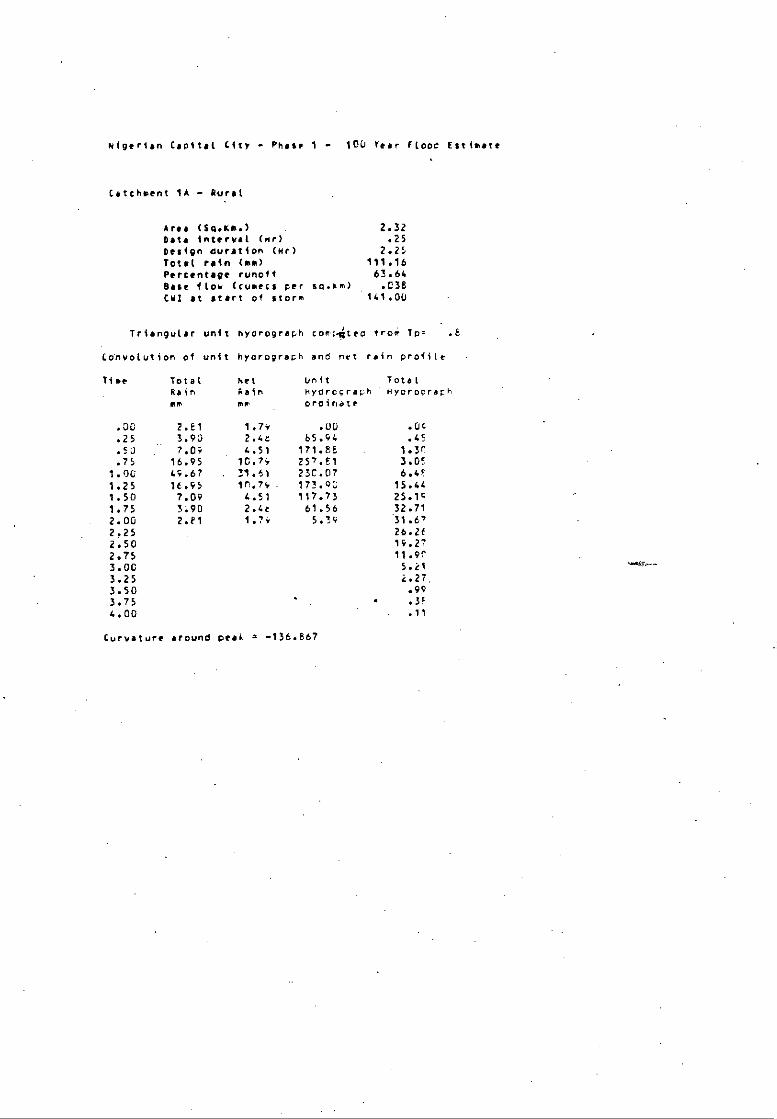
Nigerian Capita( City Phasp 1 . 100 Year flood Estimate
Catchment IA - Rural
Area (So.km.) 2.32
Data interval (mr) .25
Design duration (Mr) 2.25
Total rain (ee) 111.16
Percentage runoff 63.64
Base flow (carts per so.lie) .038
CWI at start of store 141.00
Triangular unit hydrograph cormiteo from To2 •
Convolution of unit hyorograch and net rain profile •
Time Total het Unit Total
Rain Rain hyorograph hyorocrapnmm me ordinate
.00 2.21 1.7s .OU
.09
.25 3.93 2.4c 65.94
.45
.50 7.04 4.51 171.85
1.8r
.75 16.95 10.74 257.51
3.0!
1.00 49.67 ,31.61 23C.07
6.4!
1.25 16.95 10.74 173.9c
15.44
1.50 7.09 4.51 117.73
25.14
1.75 3.90 2.46 61.56
32.71
2.00 2.P1 1.74 5.39
31.67
2.25
26.2e
2.50
19.27
2.75
11.9r
3.00
5.i1
3.25
2.27
3.50
.99
3.75
• .3!
4.00
.11
Curvature around peak 2 -136.667
%sea:a- -

Nigerian Capital City - Phase 1 - inC Tearjtoor Estimate
Catchment 16 - Rural
Area (Soar.)Data interval (NODesign ouration (lir)Total rain (mm)Percentage runof/
7.41 .25
6.25 129.3a 65.46
Base /Los (rumen per Sel.km) .036,Cul at start 01 Store 141.01:
Triangular unit nyorograph computes /roe Tp. 2.4
Convolution of unit hyorogreipT and net rein profile
Tiae Total Net Unit TotalRain hair Hydrocrapt, nyorocracham ma ordinate
.no .76
.90 .22.25 .92 .6u 9.55 .32.51) 1.06 .66 19.1U .40
.75 1.1'3 .72 22.65. 52
1.00 1.23 .Eu 35.19 .7r1.25 1.34
47.74 .9!1.50 1.71 1.12 57.29 1.271.75 2.14 1.43 66.24 1.6r12.01.1
1.24 76.3: 2.0E2.25 4.00 2.62 25.94 2.6E2.5C 7,2J 4.71 89.17 3.462.75 16.91 11.07 82.93 4.5r3.00 46.27
76.69 6.2!3.25 16.91 11.07 70.45 10.0c
.3.50 7.20 4.71 64.21 14.6!
3.75 4.00 2.6z 57.97 19.4T4.0U 2.89 1.2r 51.72 24.24
4.25 2.14 1.4u 45.46 29.074.50 1.71 1.12 39.24 33.614.75 1.35 .93 33.00 34.30
5.00 1.23
26.76 42.615.25 1.13 .7e 20.52 46.04
5.50 1.03 .64 14.26 47.31
5.75 .92 .6u 2.04 45.966.00 .76 .5u 1.20 43.65
6.25
40.94.
6.56
:7.996.75
34.tt7.00
31.6?7.25
26.297.50
24.9r'7.75
21.476.00
16.0?6.25
14.52E.50
11.1E4.75
7.949.00
5.114.25
3.47
9.50
9.75
2.1 0r.10.00
1.57
10.25
'1.7'10.50
.c7
10.75
.7t11.00
.6f11.25
.4'11.50
.3c11.75
.3712.00
.2c
Curvature around pea, a -42.005
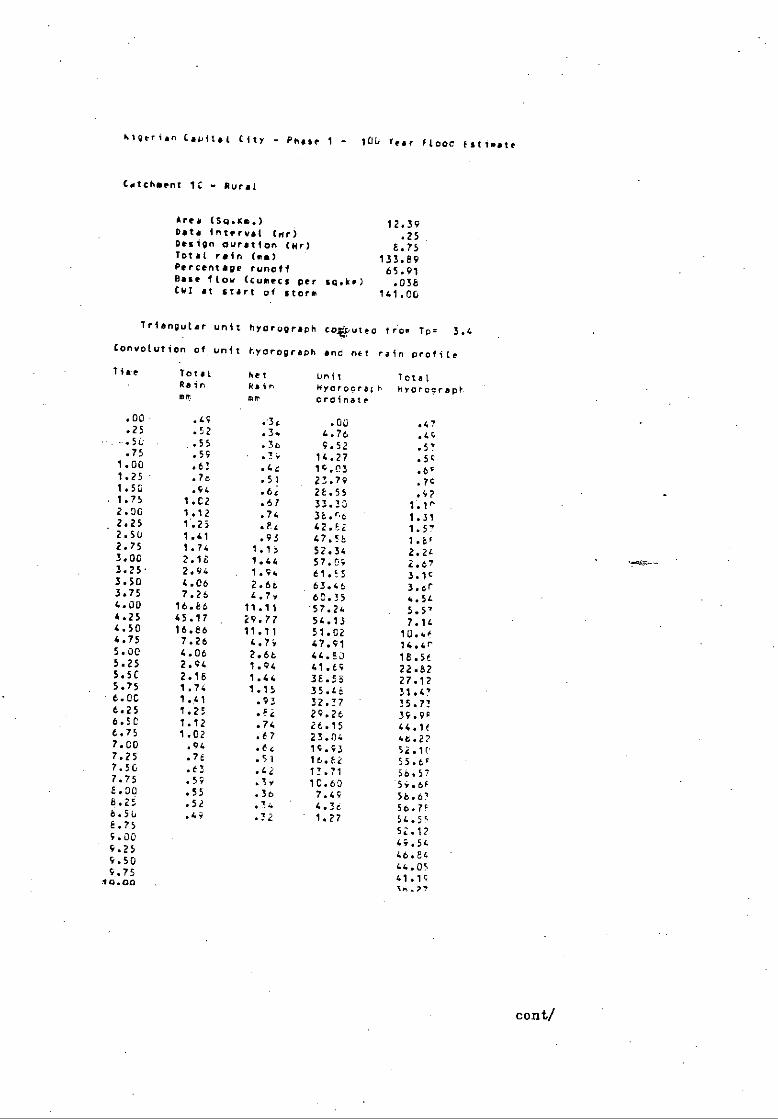
higerian Capita( City - Phase 1 - 100 Year flood Estimate
Catchment 1C - Rural
Area (541.Se.) 12.39Data interval (ar) .25Design curatiOn (Nr) 8.75Total rain (mm) 133.89Percentage runoff 65.91Base /low (tunes Pet sp.") .038CVI at start oi storm 141.00
Triangular unit hyorograoh cotputeo tr.on Tpv 3.4
ConvoLution of unit hyorograph and net rain profile
Time Total Net unit TotalRain vain hyorocract hyorooraptID11 ir oroinate
.00 .49
.00 .47.25 .52 .34 4.76 .4c
.55 .36 9.52 .52.75 .59
14.27 .5C1.00 .63 .4e 14.03 .6F1.25 .76 .51 23.79 .7C1.50 .94 .62 28.55 .421.75 1.62 .67 33.20 1.1"2.00 1.12 .74 36.06 1.31
.2.25 1..25 .84 42.62 1.572.50 1.41 .93 47.53 1.852.75 1.74 1.15 52.34 2.243.00 2.12 1.44 57.09 2.673.25- 2.94 1.94 61.C5 3.1c3.50 4.06 2.6e, 63.46 3.0r3.75 7.26 L.7I 60.35 4.544.00 16.86 11.11 57.24 5.5'4.25 45.17 29.77 54.13 7.144.50 16.86 11.11 51.02 10.404.75 7.26 4.7i 47.91 14.4r5.00 4.06 2.63 44 .c,) 18.565.25 2.94 1.94 41.69 22.825.5C 2.18 1.44 38.53 27.125.75 1.74 1.15 35.ci 31.47
• 6.00 1.41 .93 32.77 35.776.25 1.25 .Fi 29.26 39.946.50 1.12 .74 26.15 44.116.75 1.02 .67 23.04 4t.227.00 .94 .64 1C.53 52.1r7.25 .72 .51 16.82 55.6F7.5C .63 .42 13.71 56.577.75 .59 .1v 16.60 54.6F8.30 .55 .36 7.49 58.626.25 .52 .34 4.3c 56.7c6.50 .4i .72 1.27 54.5c8.75
52.124.00
44.549.25
46.849.50
44.054.75
41.14
10.00
cont/
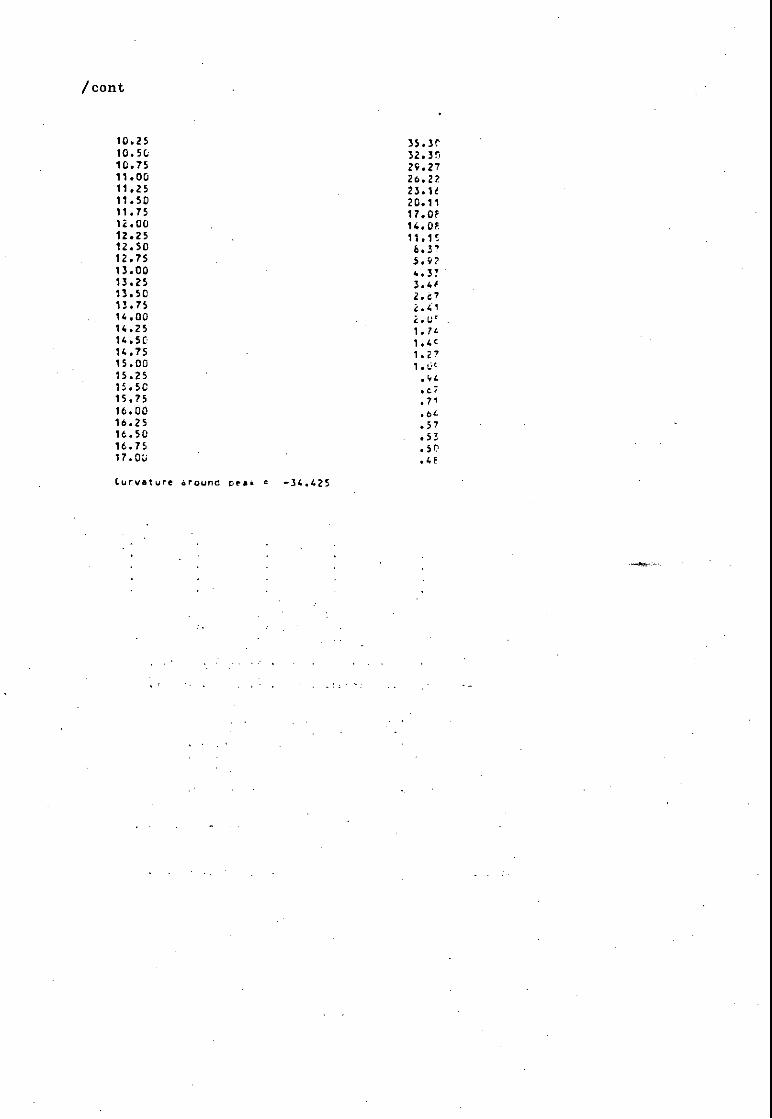
/ cont
10.25 35.3C10.5C 32.3010.75 29.2711.00 26.2211.25 23.1d11.50 20.1111.75 17.0F12.00 14.0612.25 11.1S12.50 6.3712.75 5.9213.00 4.3713.25 3.4,13.50 2.013.75 4.4114.00
14.25 1.7414.50 1.4c14.75 1.2715.00 1.0c15.25 .4[15.5C c215.75 7116.00 .6416.25 .5716.50 .5316.75 .5017.00 .42
Curvature aroune peak t -34.425
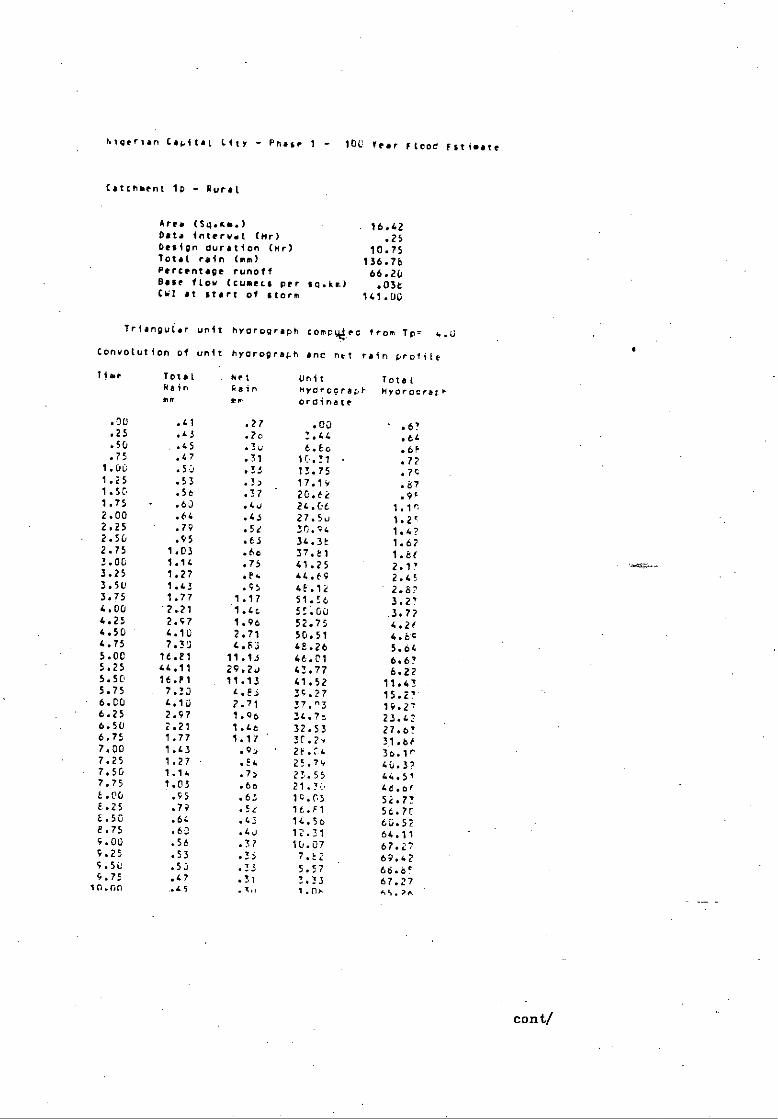
hlgerian Cacitat City - Phase 1 - 100 Year Flood Pulsate
Catchment 16 - Rural
Area (5q.k..) • 16.42Data interval (Mr) .25design duration (11r) 10.75Total rain imed 136.76Percentage runoff 66.20Base flow (cumecs per sq.ke) .03tCW1 at start of Storm 141.00
TrianduCar unit hvorograph comptiec from Tor 4.3
Convolution of unit hyorograoi end net rain protile
Time TotalRainmm
NetFainme
UnitNYOrOgraohordinate
TotalNeorocrar•
.DU .41 .27 .00 '.6!
.25 .43 .2c 2.44 .64
.50
.3u 6.6o .6F.75 .47 .31 10.31 .72
1.00 .53 .33 13.75 .7c1.25 .53 .35 - 17.19 .471.50 .56 .37 20.62
1.75 -.60 .4o 24.06 1.1n2.00 .64 .45 27.5u 1.232.25 .79 .5C 30.94 1.4?2.50 .95 .63 34.3E 1.622.75 1.03 .64 37.E1 1.813.06 1.14 .75 41.25 2.1!3.25 1.27 .e4 44.69 2.453.50 1.43 .95 4E02
3.75 1.77 . 1.17 51.56 3.274.00 '2.21 '1.44 55..00 .3.774.25 2.97 1.96 52.75 4.2e4.50 4.10 .2.71 50.51 4.6'64.75 7.30 4.F3 48.26 5.645.00 16.21 11.13 46.C1 6.675.25 44.11 29.2u 42.77 6.225.50 16.P1 11.13 41.52 11.4!.5.75 7.53 4.25 39.27 15.27.6.00 4.13 2.71 37."3 19.776.25 2.97 1.96 34.7t 23.426.50 7.21 1.44 32.53 27.6!6.75 1.77
1.17 31.067.00 1.43 .9)' 2i,.n4 36.1c7.25 1.27 .F.4 25.74 40.3?7.50 1.14 .7> 21,55 44.517.75 1.03 .6o 21.7L, 4 6.oeE.00 .95 .63 19.05 52.77.8..25 .79 .5e 1t.F1 56.717E.56 .64 .41 14.56 60.522.75 .60 .4u 12.31 64.119.00 .56 .77 10.07 67.27S.25 .53 .35 7.E2 . 69.92S.50 .53 .73 5.57 66.6FS.75 .47 .31 3.23 67.27in.nn .4s .1“ 1 . ill. 001.7e.
cont/

/cont
10.28 .43 .2a 63.010.51 .41 .27 60.6110.75
56.0c11.00
55.4F11.25
52.er11.50
50.0411.75
47.2!12.00
44.3712.25
41.4712.50
36.5!12.75
35.5F13.00
32.6113.25
29.6413.50
26.6t13.75
23.6C14.00
20.7?14.25
17.71'14.50
14.8714.75
12.0!15.0C
9.3715.25
6.9215.50
5.2715.75
4.3516.00
3.7711.25
3-.2!
2.8!16.75
2.4!17.01
2.1c17.25
1.4317.50
1.7117.75
1.5216.00
1.3!18.25
1.2115.50
1.Uc15.75
.9F1C.0C
•9r14.25
.6719.51
.7(19.75
.7120.0C
.6'20.65
.6!20.50
.6!
Caaaaaure aroun0 peak = - 43.26F
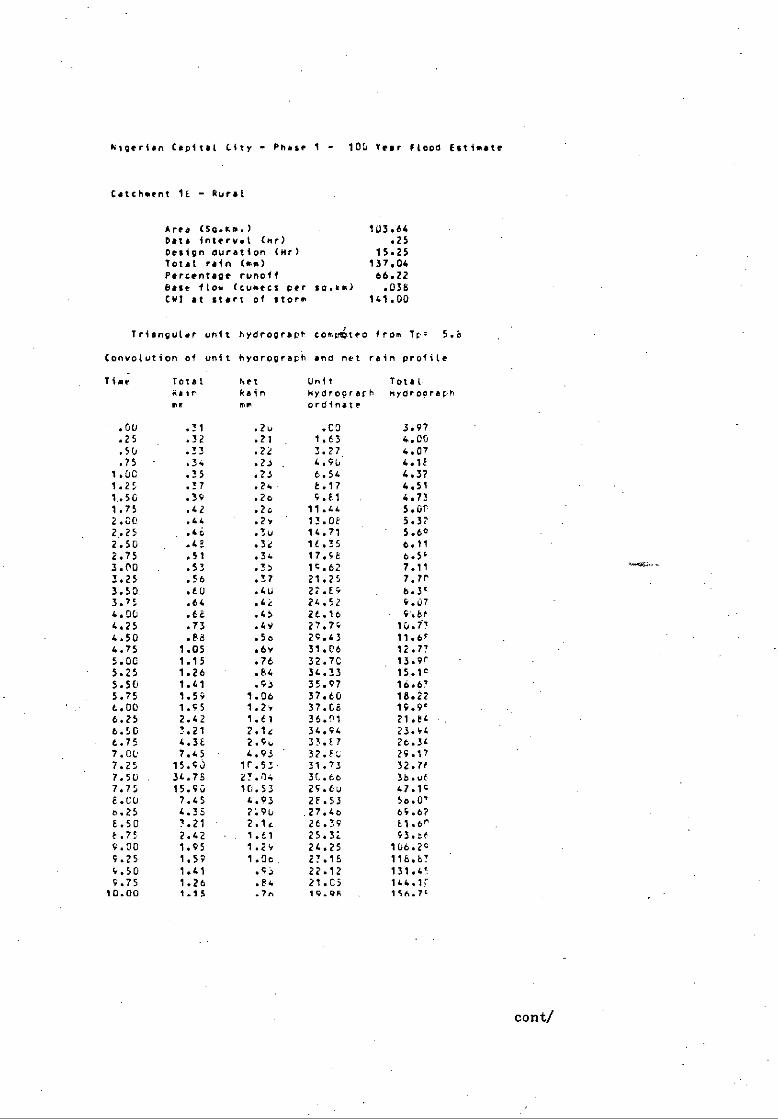
Nigerian Capital City - Phase 1 - 100 tear Flood (stimate
Catchment 1E - aural
Area (Scam.) 103.64Dal. interval Cnr) .25Design duration (Mr) 15.25Total rain (mm) 137.04Percentage runoff 66.22base flow (cumecs per •o.am) .038CUT at start of storm 141.00
Triangular unit hydrograph comptgteo from Tr: 5.8
Convolution of unit hyorograch and net rain profile
Time Total.Rainmr
hetRainmm
Unithydroorarhordinate
Total,hydropraph
• .00 .31 .2u .00 3.97.25 .32 .21 1.63 4.00.5U .33 .22 3.27 4.07.75 .34 .23 4.90 4.1E
1.00 .35 .23 6.54 4.371.25 .37 .24 6.17 4.511,50 .39 .20 4.E1 4.731.75 .42 .20 11.64 5.0f2.00 .44 .2, 13.06 5.322.25 .48 .12, 14.71 5.60
2.50 .43 .34 16.25 0.112.75 .51 .34 17.46 6.5f3.00 .53 .35 14.62 7.11
3.25 .56 .37 21.25 7.7r
3.50 .60 .40 22.64 15.3E3.75 .64 .42 24.52 4.074.00 .66 .45 26.16 c.bt4.25 .73 .49 27.74 10.714.50 .88 .5o 29.43 11.694.75 1.05 .6v 31.06 12.7'5.00 1.15 .76 32.70 13.9r5.25 1.26 .84 34.33 15.105.50 1.41 .93 35.97 16.6,5.75 1.54 1.06 37.60 18.226.00 1.95 1.2' 37.08 19.9'6.25 2.42 1.61 36.01 21.e4
6.50 3.21 2.1e 34.94 23.“6.75 4.38 2.90 33.67 26.3E7.00 7.45 4.93 32.8C 29.127.25 15.96 lr.53 31.72 32.7t7.50 34.75 2!.n4 30.66 3b.ue7.75 15.90 10.53 29.60 c7.1c6.00 7.45 4.93 26.53 50.0'6.25 4.35 290 27.4o 454.06.50 7.21 2.1c 26.39 El.Or6.75 2.42 1.61 25.32 43.th
9.00 1.95 1.24 26.25 106.249.25 1.59 1.06 21.15 118.6!4.50 1.41 .43 22.12 131.09.75 1.26 .e4 21.05 14.4.11
¶0.00 1.15 .7n 19.9A 156.7,
Conti
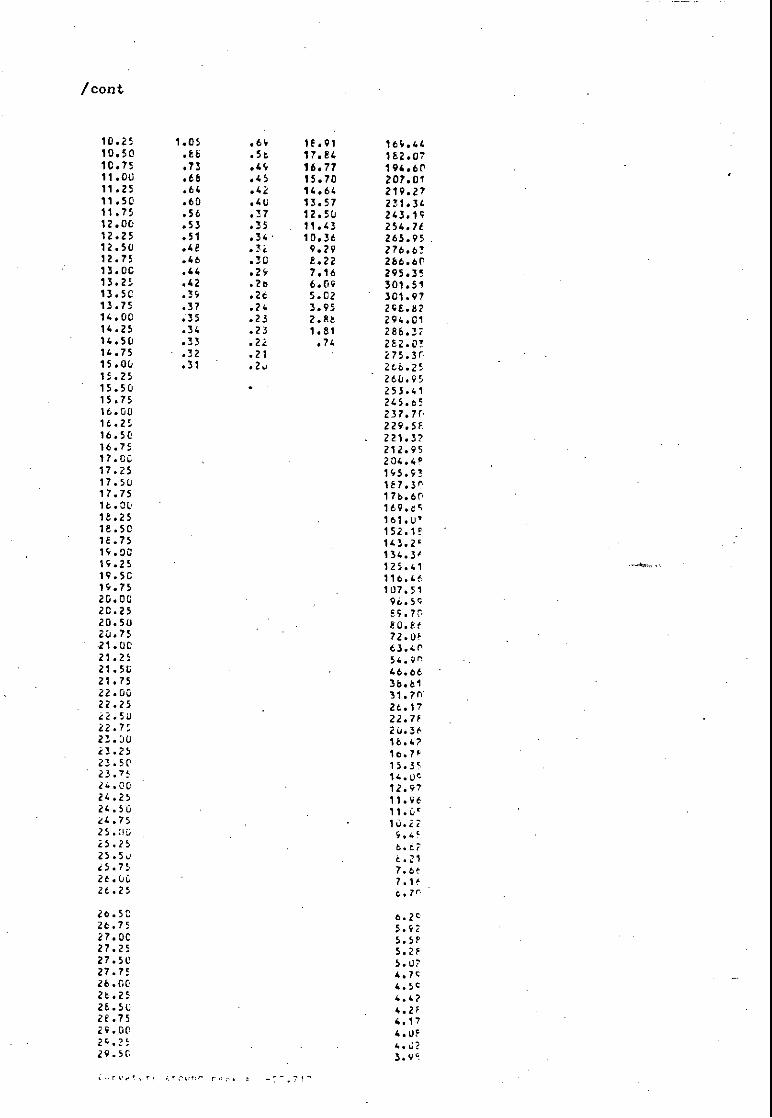
/cont
10.25 1.05 64 18.91 164.4410.50 .86 .5e 17.84 162.0710.75 .73 .44 16.77 194.6t11.00 .66 .45 15.70 207.0111.25 .64 .42 14.64 219.2711.50 .60 40 13.57 231.3411.75 .54 .37 12.50 243.1412.00 .53 .35 11.43 254.7i12.25 .51 .34 10.36 265.9512.50 .48 .32 9.29 276.6!12.75 .46 .30 2.22 266.6013.00 .44 .29 7.16 295.3513.25 .42 .2o 6.09 301.5113.50 .34 .24 5.02 301.9713.75 .37 .24 3.95 296.8714.00 .35 .23 2.92 294.014.25 .34 .23 1.81 286.3714.50 .33 .22 .74 2E2.0!14.75 .32 .21
275.3r •
15.00 .31 .240
264.2515.25
266.9515.50
253.4115.75
245.6516.00
237.7014.25
229.5f16.50
221.3?16.75
212.9517.00
204.4P17.25
145.4!17.5U
1E7.3r17.75
1712.6r1t •
169.c518.25
161.0'18.50
152.1F16.75
143.2'14.00
114.3114.25
125.4119.50
116.4619.75
107.5120.00
94.5c20.25
ES. 7C20.50
80.8f20.75
72.0521.00
63.4021.25
54.4"21.5C
46.6621.75
36.6122.00
31.7022.25
24.1722.56
22.7F22.7:
26.5623.00
16.4?23.25
16.7F23.50
15.3c23.75
14.0c24.0U
12.4724.25
11.9624.50
11.0524.75
16.2225.3Q
4.4,25.25
4.6725.5o
t.2125.75
7.6t
7.1'26.25
4.7r
26.50
6.2426.75
5.9227.00
5.5?27.25
5.2?27.50
5.0727.75
4.7428.00
4.5c2t.25
4.4?26.50
4.2?28.75
4.1729.00
24.25
4.0229.5C
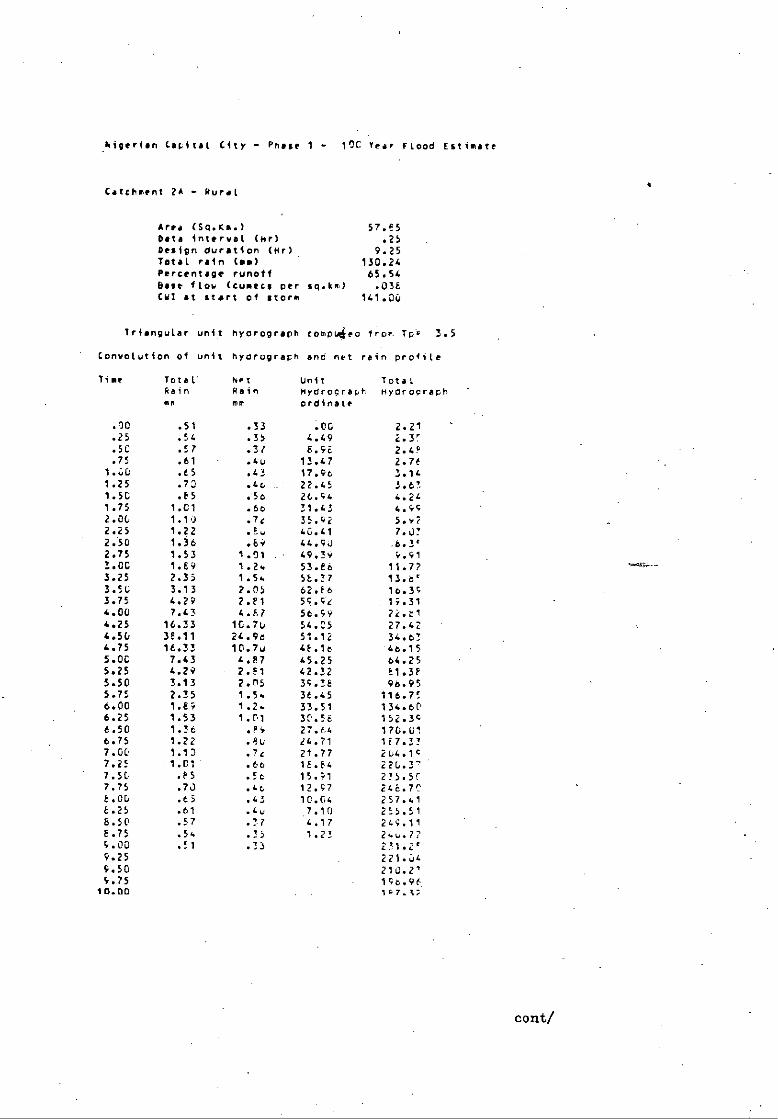
poigerian Cacital City - Phase 1 - 106 Tear Flood Estimate
Catchment 24 - Rural
Arra (59.14a.) 57.65Data i L Chir1 .25Design duration Cur). 9.25Total rain Com/ 130.24Percentage runoff 65.54Base flow (turns per sq.lia) .03ECM! at start of storm 141.00
Triangular unit hycrograph comp4eo from Tp. 3.5
' Convolution of unit hydrograch ono net rain profile
Time Total.Rainen
hatvainmm
UnitHydrogractordinate
Totalhydrocraph
.00 .51 .33 .00 2.21
.25 .54 .35 4.49 2.35
.50 .57 .3/ 6.96 2.4°
.75 .61 .4u 13.47 2.7f1.60 .65 .43 17.9G 3.1'1.25 .70 .46 22.45 3.6!1.50 .E5 :So 26.44 4.2L1.75 1.01 .60 31.4: 4.992.0C 1.1.) .7c 35.97 5.r?2.25 1.22 .5. 40.41 7.4132.50 1.36 .69 44.9J
2.75 1.53 1.01 49.39 9.913.00 1.69 1.24 53.6C 11.7?3.25 2.35 1.54 56.37 13.be3.50 3.13 2.05 62.E6 16.393.75 4.29 2.F1 59.9e 1;.314.00 7.43 4.67 56.4; 72.t14.25 11.33 1C.70 54.05 27.474.50 351.11 24.9e, 51.12 34.6!4.75 16.33 10.7v 0.16 46.155.00 7.43 4.67 45.25 64.255.25 4.29 2.51 42.32 E1.355.30 3.13 2.05 39.35 96.955.75 2.35 1.54 36.45 116.756.00 1.69 1.2. 33.51 134.66'6.25 1.53 1.01 30.56 152.3c6.50 1.36 .Pr 27.64 170.010.75 1.22 .8u /4.71 167.377.00 1.13 .7g 21.77 204.1C7.2: 1.01 .60 15.64 220.3'7.51 .P5 .56 15.91 235.557.75 .73 .40 12.97 246.75'5.00 .65 .43 10.04 257.416.25 .61 .4u 7.10 255.516.50 .57 .77 4.17 249.116.75 .54 .35 1.21 24u.7?4.0C .51 .33
231.2'9.25
221.049.50
210.2'4.75
196.9610.00
1P7.i;
cont/
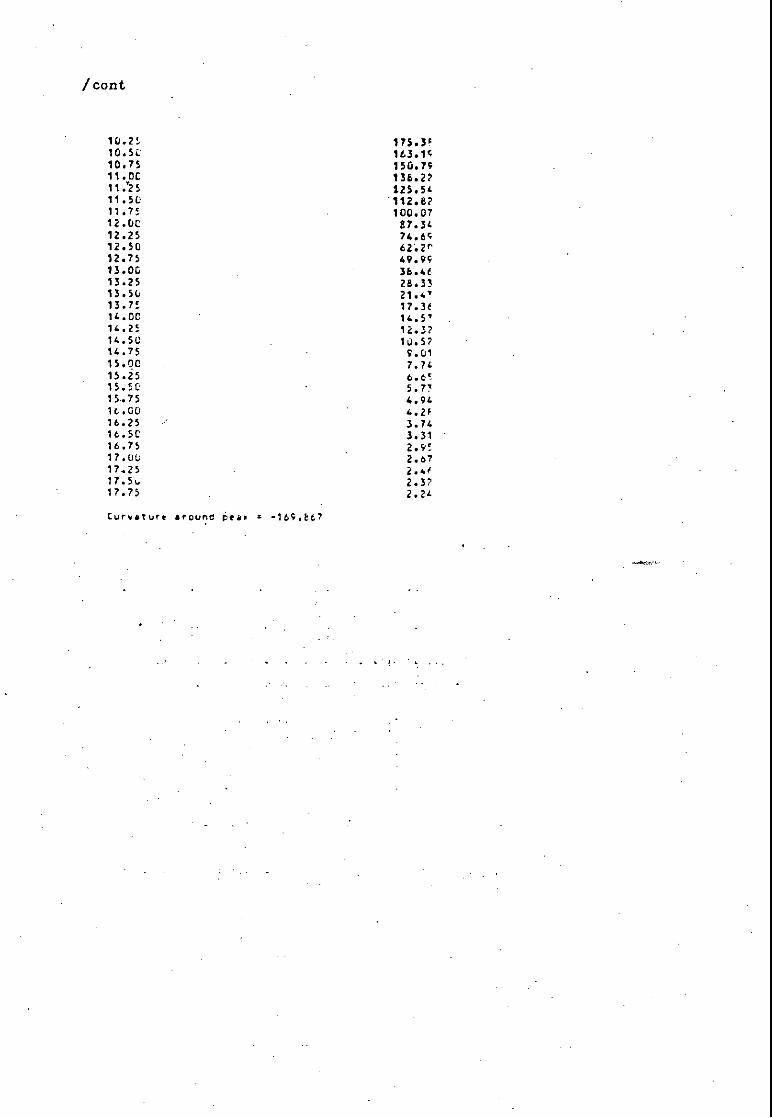
/ Cont
10.25 176.3F10.54 163.1;10.75 150.7411.0C 136.2211.'25 125.5'11.5C 112.8211.75 100.0712.0C 67.3412.25 74.6c12.50 62.2r12.75 49.9413.0C 36.4613.25 26.3313.54 21.4713.75 17.3e14.0C 14.5714.2: 12.3214.50 1u.5714.75 9.0115.00 7.7415.25 6.6F15.5C 5.7715.75 4.94it.00 4.2F16.25 3.741e.5C 3.3116.75 2.9!17.00 2.6717.25 2.4f17.54 2.3717.75 2.2'
Curvature around peak
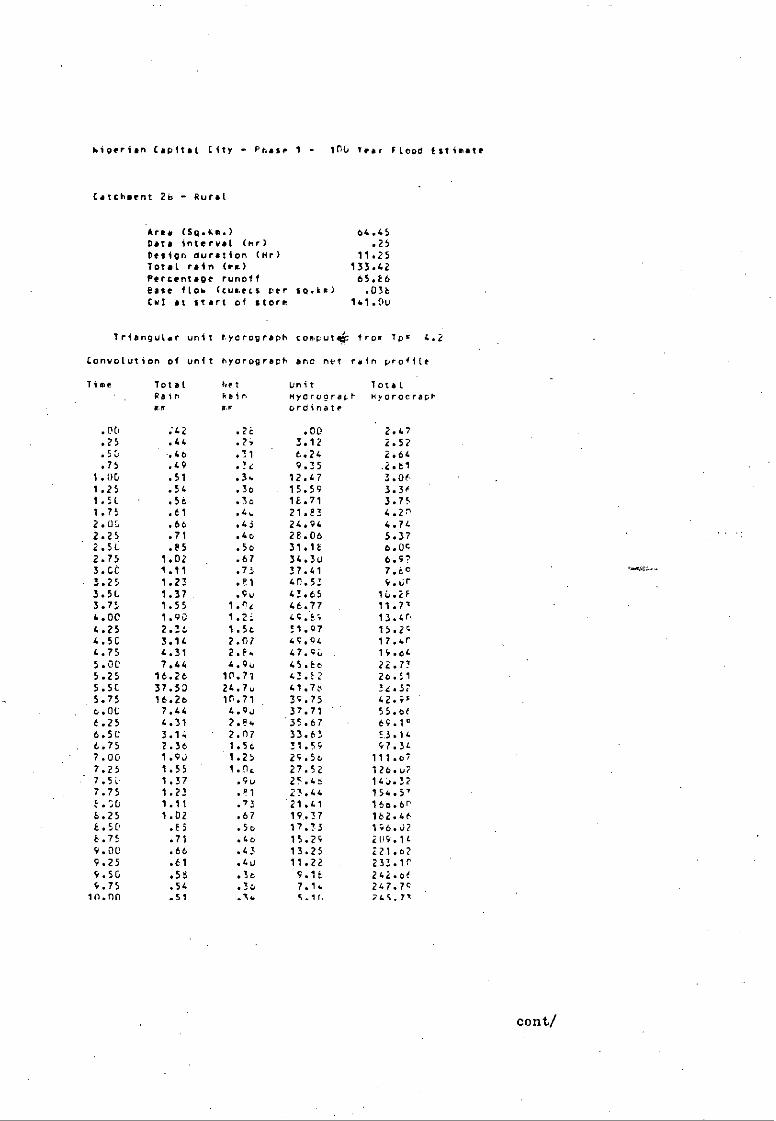
hiperian Capital City - PhaSe 1 - 100 Tear Flood E SS iSSte
Catchment 26 - Rural
Area (521.sm.) 64.45Data inte r v• (Kr) .25Design duration (lir) 11.25Total rain (ma) 133.42Percentage runoff 65.E6Base 11214 (cusecs per so.s.) .036Cvl at start of storm 141.0u
Triangular unit ryorograph comcut4 fro. Tor 4.2
Convolution of unit hyorograoh and net fain proTile
Time TotalRainLI
hetRainMI
UnitHsi,rograpbordinate
lotalRyaroerash
.00 242 .2E .00 2.47
.25 .44 .2i 3.12 2.52
.5L ..46 .71 6.24 2.64
.75 .29 .22 9.25 .2.611.00 .51 .34 12.7 3.061.25 .51. .30 15.59 3.3A1.50 .56 .30 18.71 3.751.75 .61 .44 21.23 4.2:12.0: .66 .43 24.94 4.74
. 2.25 .71 .40 28.06 5.372.51 .D5 .5o 31.1b 6.092.75 1.02 .67 34.30 6.5?3.CC 1.11 .71 :7.41 7.E9
•3.25 1.23 .F1 4c.53 co..x
3.51 1.37 .Vu 42.65 10.2E3.7; 1.55 1.N 46.77 11.714.00 1.90 1.2. 45.25 13.4n4.25 2.36 1.52 :1.97 15.294.50 3.14 2.07 4S.94 17.4f4.75 4.31 2.E. 47.90. 15.2165.00 7.44 4.9u 45.E2 22.7?5.25 16.26 10.71 42.22 20.515.5C 37.50 24.7u 41.7h 22.3;5.75 16.26 1%71 35.75 42.iF6.01 7.44 4.9J 37.71 55.ot6.25 4.31 2.24 35.67, 65•1F6.51 3.14 2.07 33.63 53.19
.6.75 2.36 . 1.54 31.59 97.39
7.00 1.90 1.25 25.56 111.07
7.25 1.55 1.04 27.52 126.0
1.37 .9u 25.4o 192..32
7.75 1.23
23.44 154.5'
1.11 .73 21.41 16o.or
8.25 1.02 .67 19.37 154.46
8.50 .E5 .5o 17.33 196.02
E.75 .71 .Lo 15.29 209.199.0e .66 .43 13.25 221.o2
9.25 .61 .4U 11.22 233.1r
5.50 .58 .76 9.1E 292.of5.75 .54 .2o 7.14 247.79
10.00 .51 .54 5.11. 745.71
cant/
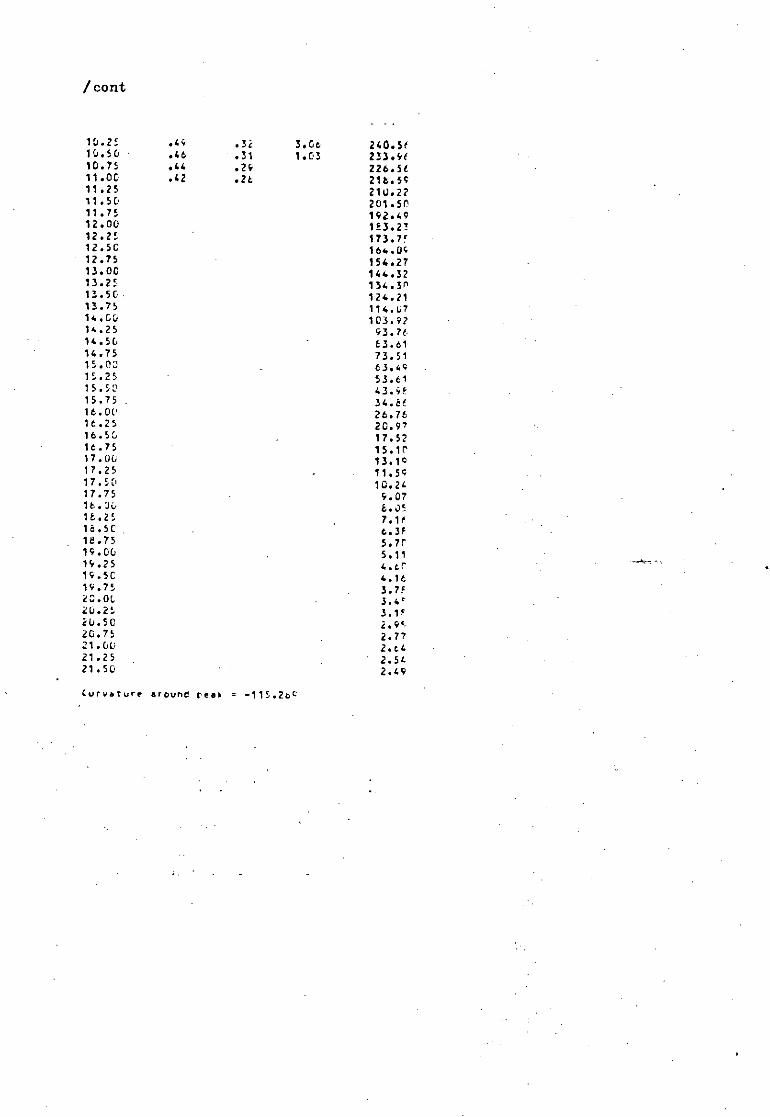
/cont
•
10.2: .49 .3i 3.00 240.5(10.50 .40 .31 1.03 233.4610.75 .44 .2i
226.5611.00 .42 .20
216.5C11.25
210.22
11.50
201.50
11.75
142.40
12.00
1E3.23
12.2:
173.7!'
12.50
104.0C
12.75
154.27
13.00
144.32
13.25
154.30
13.50
124.21
13.75
114.0714.00
103.9214.25
93.7614.50
E3.6114.75
73.5115.00
63.4015.25
53.6115.50
43.4615.75
34.8616.oe
26.7616.25
20.9716.50
17.5210.75
15.1017.00
13.1017.25
11.5917.50
10.2417.75
4.0716.0‘,
8.0516.25
7.1e18.50
6.3F1d.75
5.7r19.00
5.1114.25
4.tr19.5C
4.1614.75
3.7'20.0L
3.4r20.25
3.1020.50
2.4c,20.75
2.77.71.EU
2.9421.25
2.5421.50
2.49
Curvature around real r -115.200
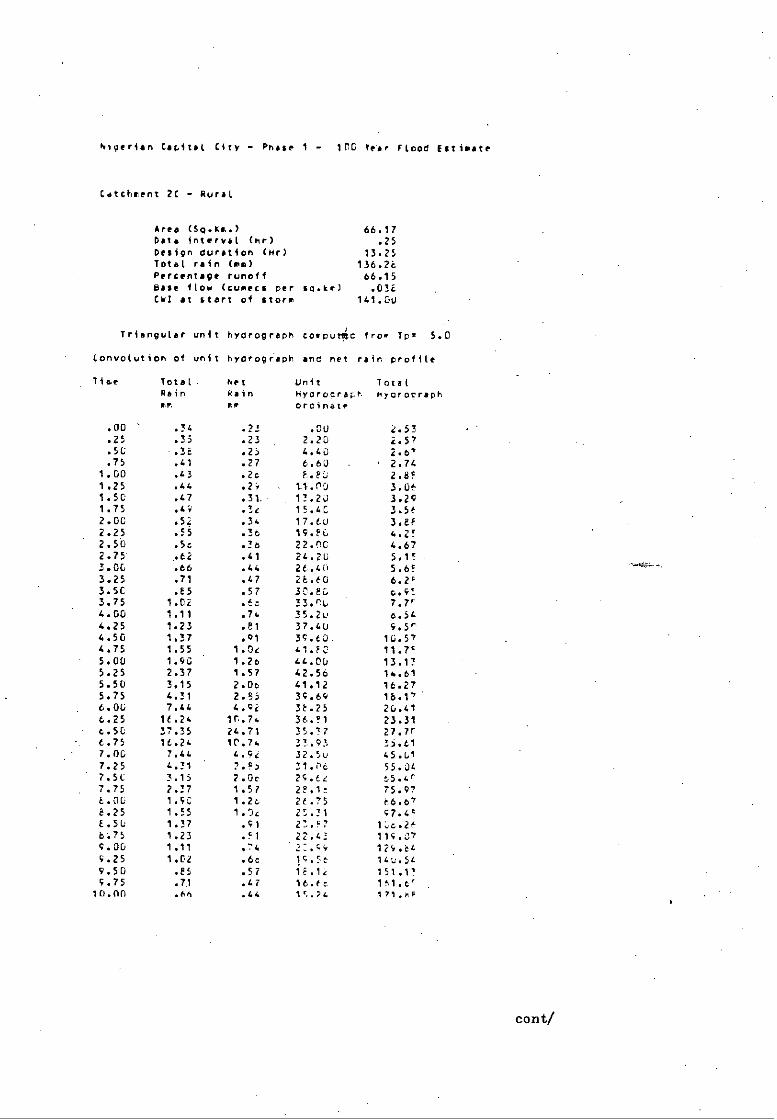
Nigerian Capital City - Pnase 1 - Iro Tear Flood Estimate
Cetchment 2C - Rural
Area (So.i4140 66.17Dote interval (nr) .25Design duration (lir) 13.25Total rain (ma) 116.26Percentage runoff 66.15Base flow (swim per so.its) .03E[WI at start of storm 141.0U
Triangular unit hydrograph Cogroutic fro. Ton 5.0
Convolution of unit hyorograph ant net rain profile
. lime Total Net unit IntelPain Aain wyo rop r ath HyGrOrraph
mr Orcinate
.00- .34 .22 .00 2.5!
.25 .25 .23 2.20 2.57
.50 -.18 .25 4.413 2.6'
.75 .41 .27 6.60 '2.741.00 43 .26 6.20 2.8F1.25 .44 .2S 11.00 3.061.50 .47 .31. 11.213 3.2C1.75 .49 .1c 15.40 3.5f2.00 ..52 .34 17.6U 3.882.25 .55 .36 19.56 4.Z!2.50 5c .26 22.00 4.672.75 A 62 .41 24.20 5.1!3.06 .66 .44 26.40 5.6F3.25 .71 .47 26.60 6.2c3.50 .E5 .57 30.80 G.S!
3.75 1.02 .8: 33.P0 7.7,4.00 1.11 .74 35.2u 6.5'4.25 1.23 .81 37.40 c.sr
4.50 1.37 .01 34.63. 14.574.75 1.55 1.0e 41.50 11.7c5.00 1.913 1.26 44.04 13.125.25 2.37 1.57 42.56 14.615.50 3.15 2.06 41.12 16.275.75 4.31 2.55 34.69 16.176.00 7.44 4.0i 35.25 24.416.25 1C.24 1.7. 36.51 21.116.50 37.35 24.71 35.17 27.7r6.75 16.24 10.74 31.93 5i.617.06 7.44 4.9i 12.5u 45.017.25 4.21 2.F5 31.i,6 55.jc
'7.50 3.15 2.0r 29.te
7.75 2.37 1.57 28.1n 75.976.04 1.4e
1.2c t6.076.25 1.55 1.0c 20.21 7.6.54 1.37 .51 2Z.F7 10c.26Oa: 1.23 .51 22.4Z 114.079.00 1.11
.74 12S.6L9.25 1.02 .6c 14.5t 144.5c9.50 .85 .57 16.1 151.1"9.75 .71 .47 16.f c 16.1.tr
10.00 .6el .44 1,',.24 171.AF
cent/
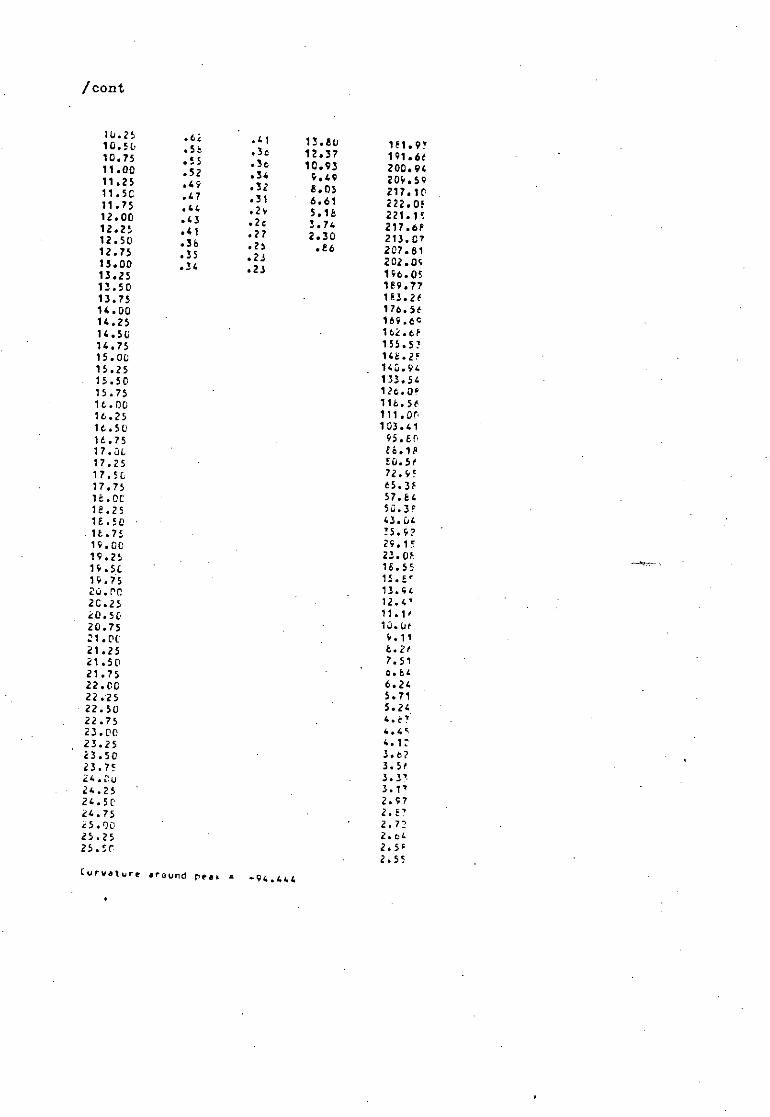
/cont
10.25 .62 .41 13.60 101.9!10.54 .5t .30 12.37 191.6f10.75 .55 .36 10.93 200.9411.00 .52 .34 9.49 209.5911.25 .49 .32 8.05 217.1 r11.5C .47 .31 6.61 222.0211.7$ .44 .29 5.16 221.1512.00 .43 .2c 3.74 217.61,12.25 .41 .27 2.30 213.0712.50 .36 .25 .86 207.8112.75 .35 .23
202.0413.00 .34 .23
196.0513.25
189.7713.50
153.2813.75
176.5014.00
169.6014.25
162.6814.50
155.5214.75
146.2515.00
140.9415.25
133.5415.50
126.0•15.75
118.5816.00
111.0016.25
103.4116.50
95.ED16.75
68.1817.3c
50.5e17.25
72.9!17.5&
65.3817.75
57.6418.0C
53.3018.25
43.0418.50
35.9716.75
29.1519.00
23.0819.25
18.5519.5C
15.Er19.75
13.4820.re
12.412C .25
11.1020.5C
10.ut20.75
4.1121.DC
6.2f21.25
7.5121.50
0.6421.75
6.2422.00
5.7122.25
5.2422.50
4.e,22.75
4.4923.0C
4.1223.25
3.6723.50
3.5f23.75
3.37,24.2u
3.1/24.25
2.9724.5C
2.E'24.75
2.72i5.00
2.0485.25
2.5225.SC
2.55Curvature around peak = - 94.444
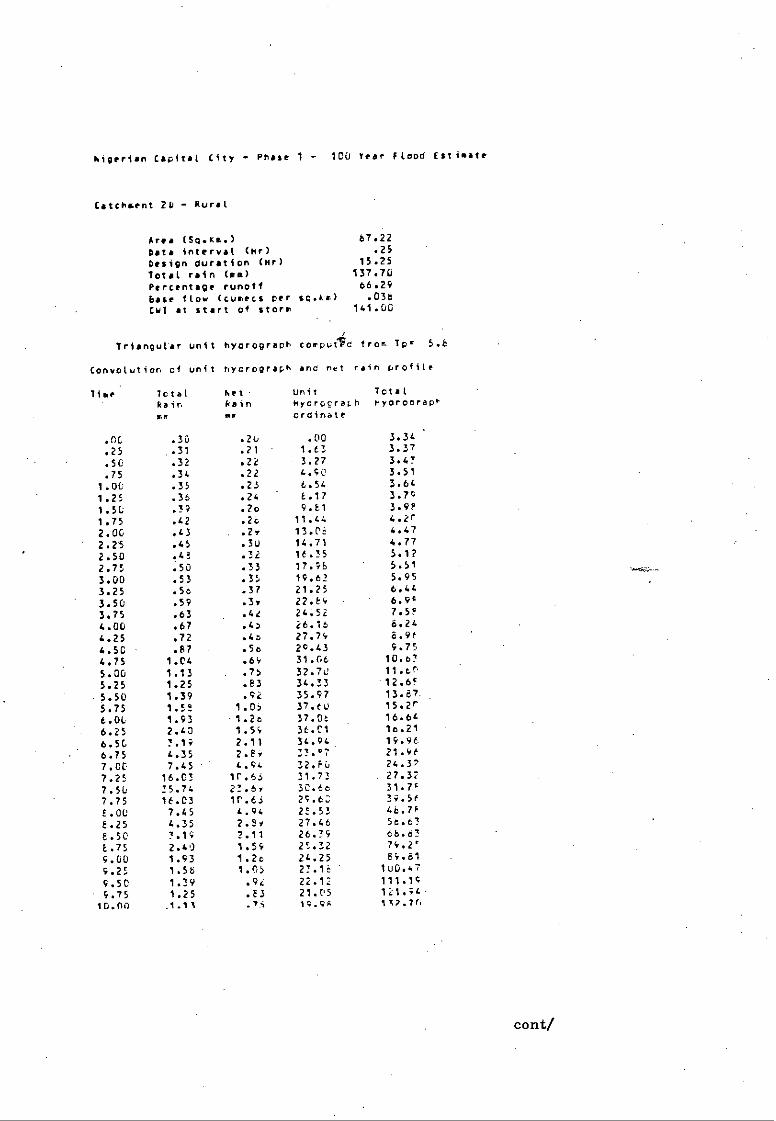
hIgerian Capital Cite Phase 1 - 100 Year flood Wilhite
Catcement 2D - Rural
Area (561.Am.) 67.22
Date interval (mr) .25
Design duration (mr) 15.25
Total rain (am) 137.70
Percentage runoff 66.29
base flow (cumecs per so.4e) .036
Cwl at start of storm 141.00
Triangulmr unit hydrograoh coroutic from Tom 5.e
Convolution of unit nycrograch ono net rain orofile
TimeTotalhetRainkainMRMP
UnitTotalnycrogra4h HyoronraOT
croinate
.nc .30 .2u .00 3.34
.25 .31 .21 1.61 3.37
.54 .32 .22 3.27 3.43
.75 .34 .22 4.40 3.51
1.00 .35 .25 6.54 3.64
1.25 .36 .24 6.17 3.74
1.50 .37 .20 4.81 3.98
1.75 .42 .24 411.4 8.2r
2.06 .43 .2. 13.06 4.47
2.25 .45 .31) 14.71 4.77
2.50 .45 .32 16.35 5.12
2.7; .50 .33 17.7E 5.51
3.00 .53 .3; 19.62
3.25 .5o .37 21.25i.199.;3.50 .59 .37 22.84
3.75 .63 .4d 24.52 7.5?
4.00 4.25 4.50
.67
.72
.87
.4D
.4z •50
26.16
2274.:43
8.24 6.9( 9 .75
4.75 1.04 .61. 31.Gt 10.o3
5.00 1.13 .75 32.70 8,11.0
5.25 1.25 .83 34.33 12.6!
5.50 1.39 .92 35.47 13.87
5.75 1.58 1.0D 37.6U 15.2r
6.04 1.93 1.2o 37.06 16.64
6.25 2.40 1.5% 36.01 1o.21
6.5L 3.1; 2.11 34.94 19.96
6.75 4.35 2.E. 77.07 21.46
7.00 7.45 L. 32.881 24.37
7.25 16.03 lr.65 31.73 .27.32
7.5b 35.74 23.6. 30.6c 31.7E
7.75 16.03 1r.63 29.62 34.56
8.00 7.45 4.94 25.53 46.7E
8.25 4.35 2.3v 27.46 55.63
E.50 3.19 2.11 24.39ti238.75 2.40 1.59 25.32
9.00 1.93 1.20 24.25 84.81
9.2; 1.58 1.05 23.1514.419.50 1.34 .94 22.11
9.75 1.25 .E3 21.05 107.54,
10.110 .1.1i .7i 1C.0 ): 1Ta.7n
cont/
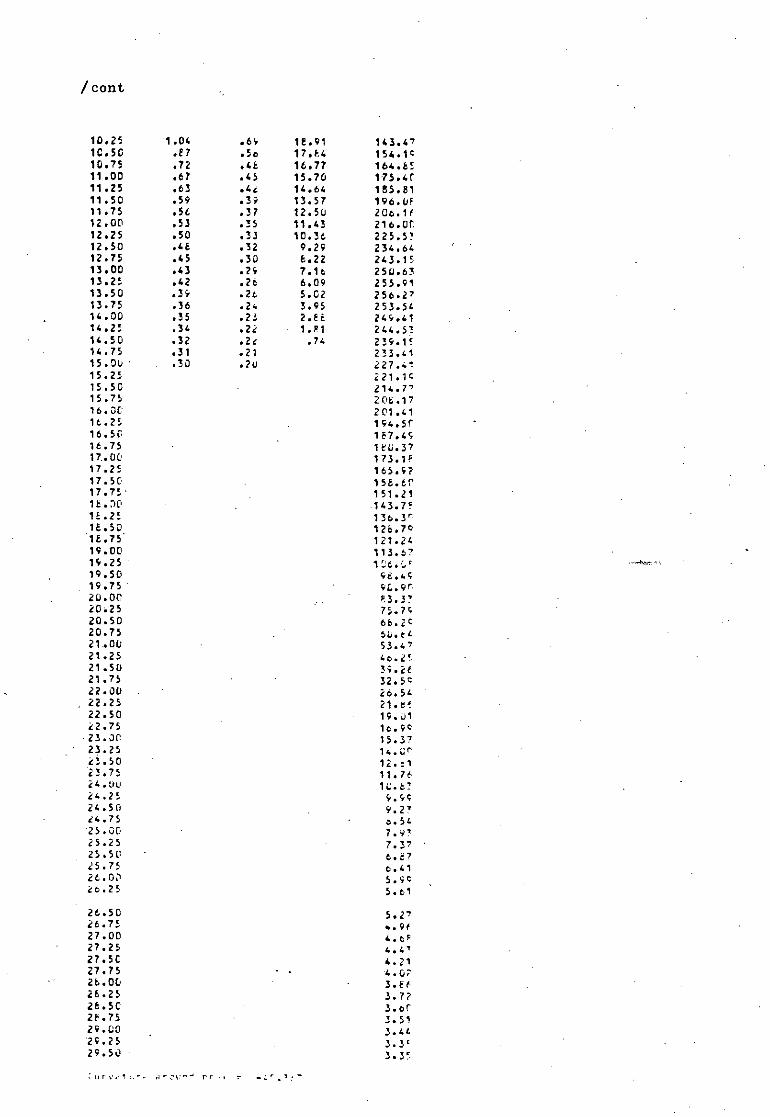
/cont
10.25 1.04 .64 12.91 143.4710.50 .27 .So 17.E4 154.1410.75 .72 .46 16.77 164.6511.00 .67 .45 15.70 175.4011.25 .63 .42 14.64 185.8111.50 .59 .37 13.57 196.0F11.75 .56 .37 12.50 206.1f12.00 .53 .25 11.43 216.or12.25 .50 .33 10.36 225.5?12.50 .4E .32 9.29 234.6412.75 .45 .30 6.22 243.1513.00 .43 .74 7.16 250.6313.25 .42 .26 6.09 255.9113.50 .34 .26 5.G2 256.2713.75 .36 .26 3.95 253.5414.00 .35 .23 2.E6 244.4114.2: .34 .22 1.91 244.5714.50 .32 .22 .74 234.1!14.75 .31 .21
233.4115.00 .30 •2u
227..115.25
221.1415.50
214.7715.75
206.1716.00
201.4116.25
194.5516.50
127.4416.75
160.3717,00
173.1p17.25
165.9217.50
158.6017.75•
151.2116.D0
143.7916.25
136.3516.50
126.7418.75'
121.2419.00
113.6714.25
106.0'19.50
46.4419.75
90.9520.00
E3.3720:25
75.7;20.50
66.2420.75
60.6221.00
53.4721.25
40.2521.50
29.2f21.75
32.5422.00
26.5222.25
21.6S22.50
19.0122.75
10.4423.00
15.3723.25
14.0522.50
12.:123.75
11.7624.uu
1C.6724.25
9.4S24.50
9.2724.75
o.5L25.00
7.Y,25.25
7.3725.50
6.6725.75
o.4126.00
5.4626.25
5.61
26.50
5.2726.75
4.9f27.00
4.oF27.25
4.4727.5C
4.2127.75
A.G726.00
5.6626.25
3.7728.5C
3.652O.75
3.5129.00
3.4429.25
3.3'29.50
3.35
rr
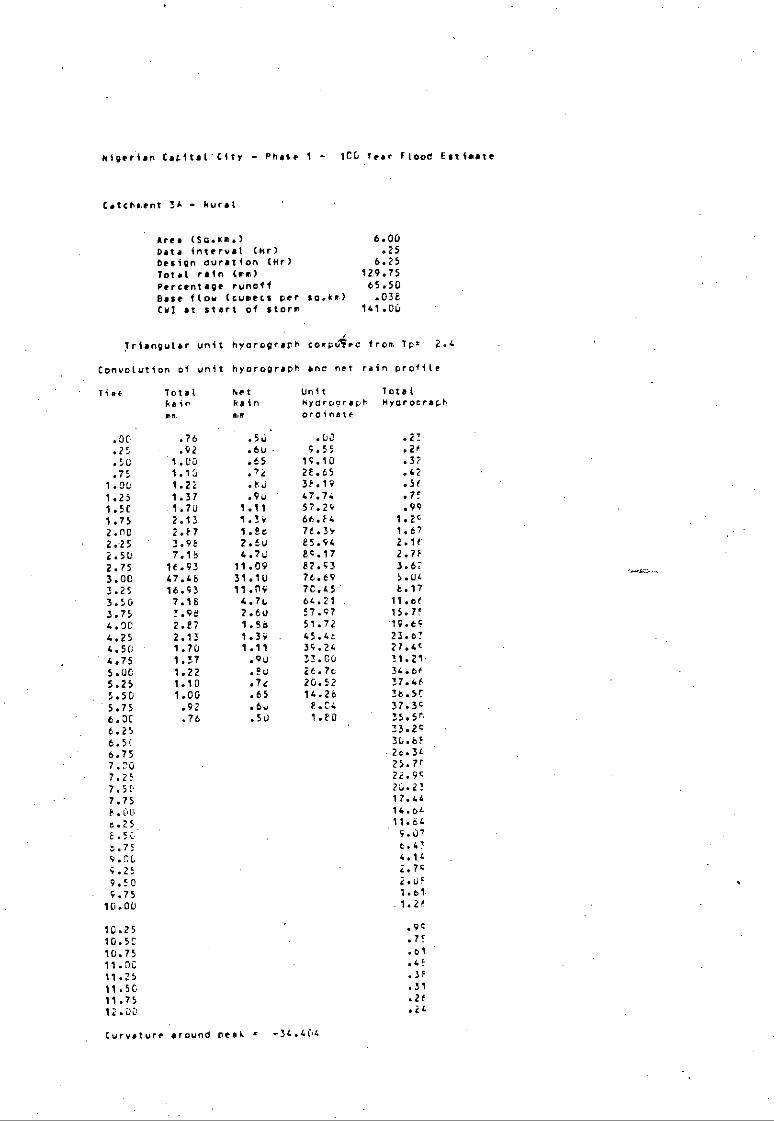
Nigerian CacitaL'Cith - Phase 1 - ICC; iear flood Estimate
Catchment 34 - Mural
Area (541.Km.) 6.00
Data interval (lir) .25
Design duration (Mr) 6.25
Total rain (am) 129.75
Percentage runoff 65.50
Base flow (sumacs per so.ta) .036
CU! at start of storm 141.00
Triangular unit hyorograph comptirc from 76= 2.4
Convolution of unit hyorograph •rie ner rain profite
. Time Total Net Unit Total
Nair kiln Hyorograph Nyorocraph
PR. RM orcinate
.00 .76 .5U La .23
.25 .92
9.55 .2e
.50 1.00 .65 19.10 .37
.7;
• 2E.65 .42
1.00 1.22
38.19 .5!
1.25 1.37 .91.4 47.74 .7!1.50 1.70 1.11 57.29 .99
1.75 2.13 1.3, 66.E4 1.292.n0 2.F7 1.8.e 76.39 1.672.25 3.98 2.60 85.94 2.1e2.50 7.15 4.7u E9.17 2.7F
2.75 16.93 11.09 82.c3 3.623.00 47.45 31.10 76.69 5.043.25 16.93 11.09 70.45. 8.17
3.50 7.18 9.7o 64.21. 11.e!
3.75 3.98 2.60 57.97 15.7!4.00 7.87 1.8o 51.72 19.69
4.25 2.13 1.39 45.4t 23.o74.5G 1.70 1.11 34.24 27.4c4.75 1.37 .90 35!.00 31.21.
5.00 1.22 .90 26.7o 34.6e
5.25 1.10 .7e 20.52 37.46
5.50 1.00 .65 14.26 36..5P
5.75 .92 .6u E.C.4 37.396.00 .76 .50 1.80 15.506.25
33.29
6.5(
30.06.75
,2e.3e7.7_10
25.797.25
22.997.5O
20.2!
7.75
E.00
14.64
8.25
11.64
8.52
9.07
6.75
6.439.nt,
4.199.25
2.799.50
i.uF9.75
1.6110.00
.1.2!
10.25
.9c
10.50
.7!
10.75
.o1
11.0C
.4!
11.25
11.56
.31
11.75
.26
12.02
.24
Curvature around peak . -34.404

Aigerian Capital City - Phase 1 - 10C tear Flood Estimate
Catchment 36 - Aural
Area(Spam.)Datain ttttt(hr)Designduration(Kr)lots'.rain(mm)PercentagerunoffBateIto(ouseciperCalatstartofstore,
Triangularunitnyorograph
Convolution otunithyorograch
tio.kr)
cogputec
ancnet
10.64.25
7.75
132.1E 65.74 .CTE
141.00
fro,To.3.0
rainprofile
Time Totalgainme
hetRain
UnitKydrocraphordinate
Totalhyorooraph
.00 .55 .3o -.00 .41
.25 ..5; .3s 6.11 .47
.50 , .63 .41 12.22 •4P
.75 .77. .51 16.73 .551.00 .93 .61 24.44 .661.25 1.02 .67 30.56 .811.50 1.12 .73 36.67 1.on1.75 1.24 .62 42.76 1.242.00 1.40 .92 46.69 1.542.2.5 1.73 1.14 55.00 1.8C2.50 2.17 1.43 61.11 2.312.75 2.92 1.9c 67.22. 2.8?3.00 4.C4 7.to 73.73 3.4F3.25 7.24 4.7t 69.34 4.263.51 16.65. 11.04 65.34 5.3r3.75 45.71 30.0) 61.35 7.074.00 nab 11.oi 57.36 10.554.25 7.24 4.70 53.3t 14.914.50 &alt. 2.6o 49.37 19.444.75 2.92 1.92 45.37 24.055.00 2.17 1.43 41.38 26.7e5.25, 1.73 1.14 37.39 33.345.511 1.40 .91 33.39 37.9!5.75 1.24 .62 29.40 42.4!6.00 1.12 .73 25.40 46.776.25 1.02 .67 21.41• 50.866.50 .93 .61 17.41 54.576.75 .77 .51 13.42 57.017.00 .63 .41 5.43 56.247.25 .54 .34 5.43 54.417.50 .55 .36 1.44 52.0!7.75
47..47e.,00
46.676.25
43.oS6.5L
4L.L76.75
37.515.00
34.379.25
31.1C5.50
77.675.75
24.51it;DD -
21-ii
cont/
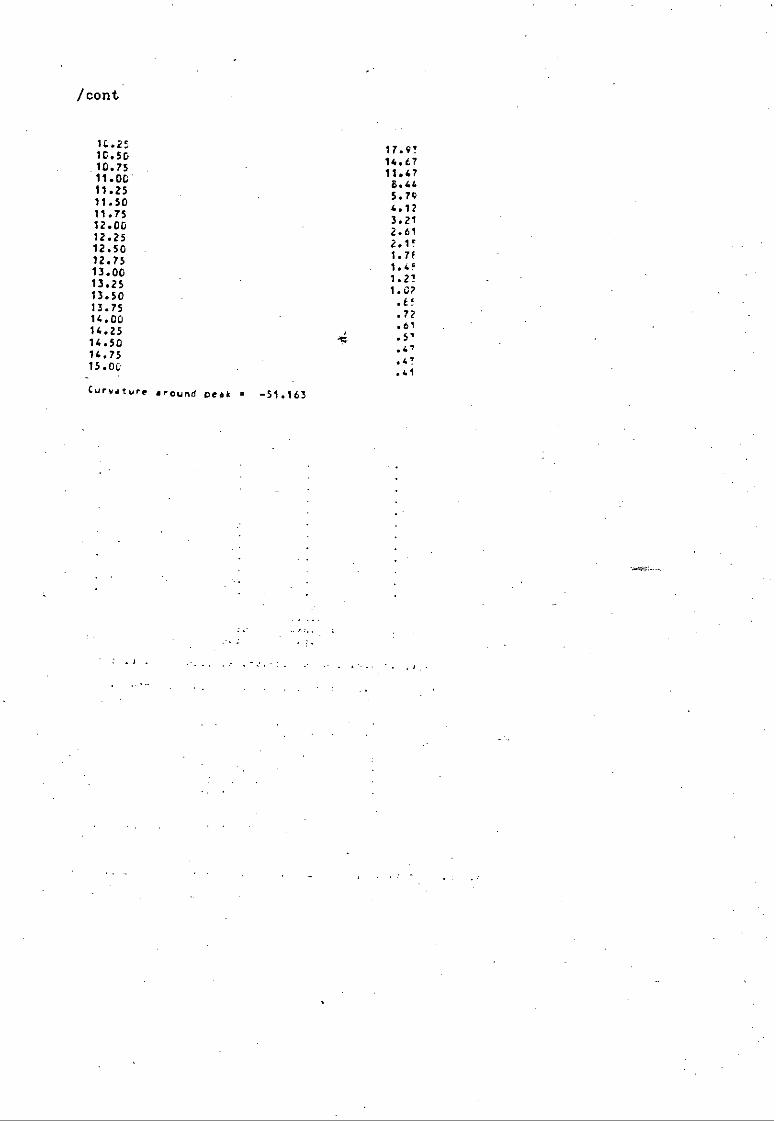
/cont
1C.2510.5D10.7511.00'11.2511.5011.7512.0012.2512.5012.7513.0013.2513.5013.7514.0014.2514.5014.7515.0C
Curvature aroundPeak e -51.163
17.9!14.6711.47
8.4'5.794.123.212.612.1!1.7F1.01.2!1.07
e!.72615'47
. 4 !41

Algerian Capital City - Phase 1 - 10C tear Flood Estimate
Catchennt !C - Rural
Are.. (5o.tm.)Datainterval(fir)DesignDuration(Hr)Totalrain(ma)PercentagerunoffBaseflow(owletsperCW1atstartof. store
Triangularunitnyorograch
Convolutionofunithyorograpr
•ci.ke)
computeo
ancnet
12.6E .25
8.25 132.85 65.51 .038
141.00
IronTpm3.2
rainprofile
Time TollsL'Re inMr
'het&sinDM'
UnitnyoroprackorOlnate
Totalmyorocrsof
.00 .52 .34 .00 .4C
.25 .55 .30 5.37 .51.50 .59 .39 10.74 .56.75 .63 .4e 16.11 .67•1.00 .76 .51 21.46 .7!1.2t .94 .62 24.26 .871.50 1.02 .67 32.23 1.051.75 1.13 .74 32.60 1.2F2.00 1.25 .Ed 42.97 1.5t2.25 1.41 .93 42.34 1.6C
-2.5L 1.75 1.15 53.71 2.252.71 2.19
1.44 2.7C3.10 2.94 1.9j 64.45 3.373.25 4.06 2.67 0.05 4.013.50 7.26 4.7c t4.54 4.br3.7; 16.65 11.09 0.03 5.994.00 45.09 29.67 52.52 7.824.25 16.E5 11.0? 54.01 Mt:4.5t 7.24 4.7t 50.56 16.174.25 4 .06 7.67 46.9e 20.E'5.00 2.94 1.93 0.47 25.745.25 2.19
1.44 30.655.50 1.75 1.15 36.45 35.565.75 1.41 .9. 32.94 40.446.00 1.25 .Fc 29.43
6.25 1.13 .74 25.92 49.97•6.51 1.02 .67 22.21 54.416.75 .94 .42 IF.90 50.047.00 .76 .51 15.79 t2.2r7.25 .63 .4e 11.E6 64.177.51 .5; .39 E.37 63.127.75 .55 .3e 4 .bc 0.126.00 .52 .34 1.15 56.616.25
55.6!2.50
52.9r2.75
44•009.0C
46.09.25
43.1?9.5c
3i.9F4.75
56.591 0 • OD. I .
cont/

/ cont
10.25 24.6!10.50 26.1410.75 22.7C11.0G 14.2711.25 15.b'11.5C 12.4411.75 C.20-12.00 6.4E12.25 4.6712.50 3.6912.75 3.0713.00 2.5?13.25 2.1113.50 1.7713.75 1.5114.00 1.2714.25 1.0714.50 .9114.75
15.00 .6 115.25 .6115.5C .5115.75 .5116.0G .46
Curvature orourie peak = -4t.!1!
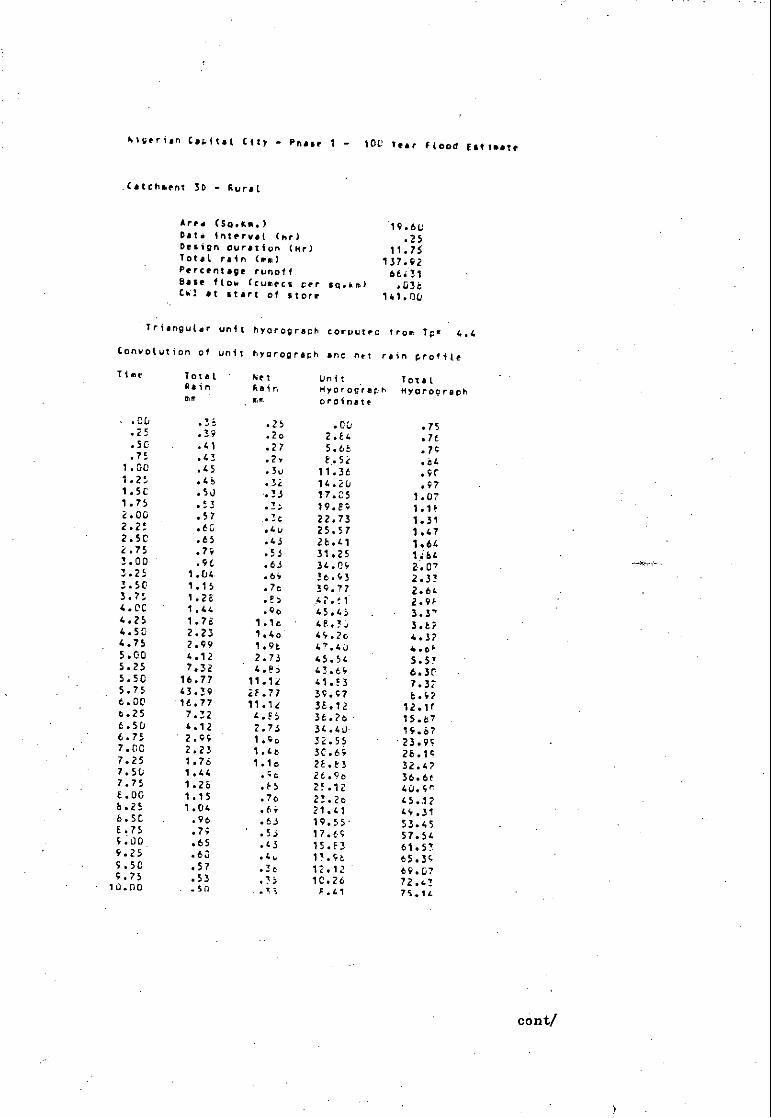
NIgerian Cosital City - Phase 1 - 100 tear Flood Estimate
.Catchment 3D - govat
area CSo.sm./ 19.60Data interval (ht.) .25Design ouration (lir) 11.75Total rain ie./ 157.92Percentage runoff 6E:31Base flow (cusecs Ler Sg .9 to) .036Ch1 at •tart of storm 141.00
Triangu(ar unit hyorograch convotvo trom Tor 4.4
Convolution of unit hyorograph anc net rain profite
Time Total. Net Unit . Totalgain Rain myorograch myorooraghmrr cff oroinate
-.00 .36 .25 .00 .75.25 .39 .2o 2.84 .76.50 .41 .27 5.66 .74.75 .43 .2, 8.52 .64
1.00 .45 .3o 11.3E .9(1.25 .46 .32 14.20 .971.50 .50 .33 17.C5 1.071.75 .53 .25 19.8; 1.1?2.00 .57 •.16 22.73 1.312.25 .60 .4u 25.57 1.472.50 .65 .43 22.41 1.642.75 .79 .53 31.25 1443.00 .94 .63 34.04 2.073.25 1.04 .69 36.43 2.3!3.50 1.15 .76 39.77 2.643.75 1.28 .8) .47.t1 2.954.00 1.44 .90 45.45 3.374.25 1.76 1.1c 48.35 3.624.50 2.23 1.4o 44.2o 4.374.75 2.99 1.96 47.40 4.045.00 4.12 2.73 45.54 5.575.25 7.32 4.8) 43.64 6.305.50 16.77 11.12 41.83 7.375.75 43.39 25.77 34.47 6.426.00 12.77 11.1[ 38.12 12.1f6.25 7.32 4 .ES 36.26 15.676.50 4.12 2.73 34.40 19.576.75 2.44 1.40 32.55 23.947.00 2.23 1.4e 30.64 26.147.25 1.76 1.10 25.43 32.477.50 1.44 .46 26.46 36.6e7.75 1.26 .55 25.12. 40.4iT6.00 1.15 .70 23.26 45.122.25 1.04 .64 21.41 44.316.50 .96 .63 19.55 53.45E..75 .7; .53 17.f4 57.544.00 .65 .43 15.53 61.5!9.25 .63 .46, 13.42 65.344.50 .57 .36 12.12 69.074.75 .53 .35 10.26 72.4!10.00
.fts F.L1 75.1t
cant/

/cont
10.25 .46 .32 6.55 76.IG1C.50 .45 .3u 4.69 75.2710.75 .43 .29 2.84 73.5611.00 .41 .27 .98 71.5r11.25 .39 .2o
69.2411.5C .38 .25
66.4411.75
64.34
12.03
61.74
12.25
59.0p
12.50
56.35
12.75
53.5E
13.00
50.72
13.25
47.85
13.50
44.9413.75
42.0114.00
39.0614.25
36.1r14.50
33.1714.75
30.1615.00
27.1715.25
24.2715.50
21.2'15.75
16.3716.01
15.4416.25
12.6216.50
9.5716.75
7.5717.00
5.8417.25
4.EG17.5C
4.2717.75
3.7216.00
3.2c18.25
2.9318.50
2.6216.75
2.3419.0C
2.1'19.25
1e2C19.50
1.ir19.75
1.5'20.00
1.4r20.25
1.i720.50
iel,40.75
1.021.00
isor21.25
.9!21.50
.8721.75
.6322.00
.7922.25
.7722.5C
.7t
Curvature eround Dliou -31.762
t