institutional assessment survey of community … survey of community organisations ... education and...
TRANSCRIPT
Institutional Assessment Survey ofCommunity Organisations (COs) Fosteredby Rural Support Programmes (RSPs)in Pakistan
Survey Consultants: APEX Consulting Pakistan
Survey Design Team Members:
James F Morton, Technical Advisor HTSPE
Andrew Penney, Statistical Advisor HTSPE
Fazal Ali Saadi, Specialist MER RSPN
Edited by: Muhammad Hasnain Khalil
Printed at: MASHA ALLAH Printers, Islamabad. Ph: 051-2872253
Copyrights © 2010 Rural Support Programmes Network
Monitoring Evaluation and Research Section
Rural Support Programmes Network (RSPN)
House No.7, Street 49, F-6/4, Islamabad, Pakistan
Tel: (92-51) 2822 476, 2821 736
This document has been prepared with the finacial support of the Department for InternationalDevelopment (DFID) of the Gorvernment of the United Kingdom and in collaboration with theRural Support Programmes (RSPs) of Pakistan.
This findings, interpretations and conclusions expressed in this paper are entirely those of the author(s) and do not necessarily represent the views of the RSPN, RSPs, or DFID.

Institutional Assessment Survey ofCommunity Organisations (COs) Fosteredby Rural Support Programmes (RSPs)in Pakistan


Acknowledgements
The Consultants wish to express their gratitude to Ms. Shandana Khan, Chief
Executive Officer RSPN for providing the opportunity to conduct this Institutional
Assessment Survey of Community Organisations (COs) Fostered by the Rural
Support Programmes (RSPs) in Pakistan.
We further thank Mr. Khaleel Ahmed Tetlay, Chief Operating Officer RSPN, for his
guidance during the Assignment planning.
Special thanks are due to Mr. Fazal Ali Saadi, MER Specialist RSPN for his
cooperation and facilitation throughout the Assignment.
Abbreviations & Acronyms
Conversion Table
1 US $ 86.0 Pak Rupees
1 US Gallon 3.79 Liters
Disclaimer
The Consultants have made every effort to provide the most accurate information, data, statistics, facts, figures, drawings and procedural descriptions contained in this document. The limitations of the accuracy of the information at the source, however, remain. The document may thus contain human or mechanical errors or omissions. Only limited liability for such errors, or omissions, or un-intentional misrepresentations will be accepted. The Consultants reserve the right to make corrections and changes in any information contained in this and in subsequent versions of this document.
AKRSP Aga Khan Rural Support Programme
BRSP Balochistan Rural Support Programme
CCB Citizen Community Board
CMST Community Management Skills Training
COs Community Organisations
FGD Focus Group Discussion
GB Gilgit Baltistan
GBTI Ghazi Brotha Taraqiati Idara
GoP Government of Pakistan
IAI Institutional Assessment Indicators
Km Kilometers
KP Khushal Pakistan
KPK Khyber Pakhtunkhwa Province
LMST Leadership Management Skills Training
LSO Local Support Organisation
MCO Mens Community Organisation
NGO Non Governmental Organisation
NRSP National Rural Support Programme
PCP Pakistan Center for Philanthropy
PRA Participatory Rural Appraisal
PRs Pakistani Rupees
PRSP Punjab Rural Support Programme
RSPN Rural Support Programmes Network
RSPs Rural Support Programmes
SO Social Organiser
SPSS Statistical Package for Social Sciences
SRSO Sindh Rural Support Organisation
SRSP Sarhad Rural Support Programme
ToC Table of Contents
ToRs Terms of Reference
TRDP Thardeep Rural Development Programme
UC Union Council
VDO Village Development Organisation
WCO Womens Community Organisation
.
TABLE OF CONTENTS
1
2
3
4
5
6
7
8
I EXECUTIVE SUMMARY ................................................................................................ 1-3
6-15
II PROLOGUE ................................................................................................................................ 2.1. Background ................................................................................................................................ 6 2.2. Background and Literature Review ................................................................................................ 8
III ORGANISATIONAL MOTIVATION ................................................................................................ 18-22 3.1. Objectives, Mission and Goal of COs ................................................................................................ 18 3.2. Participation in Needs Identification and Planning ................................................................ 19 3.3. Selection of COs President and Manager ................................................................ 20 3.4. Number of Poor Households Included as Members of COs ................................ 21 3.5. Reasons of Excluding Poorest of the Poor in COs ................................................................ 21
IV ORGANISATIONAL CAPACITIES ................................................................................................ 24-27 4.1. Record Keeping at CO Level ................................................................................................ 24 4.2. Education and Training of Office Bearers ................................................................ 25 4.3. Capacity Building of COs ................................................................................................ 26 4.4. What have COs Done About Women Issues ................................................................ 27
V ORGANISATIONAL PERFORMANCE ................................................................................................ 30-35 5.1. COs Meetings ................................................................................................................................ 30 5.2. Management of Project Activities by COs ................................................................ 31 5.3. Microcredit Activities of COs ................................................................................................ 31 5.4. Analysis of Loan Profile Over Past 12 Months ................................................................ 33 5.5. Linkages and Networking ................................................................................................ 35 5.6. Role of COs in Conflict Resolutions and Women Issues ................................ 35
VI EXTERNAL FACTORS ................................................................................................ 38-41 6.1. Participation of COs in the Survey ................................................................ 38 6.2. Profile of President and Managers of COs ................................................................ 39 6.3. Residential Status of Office Bearers ................................................................ 40 6.4. Interactions among COs and RSPs ................................................................ 41
VII COMPARATIVE ANALYSIS AMONG RSPs ................................................................ 44-47 7.1. Case Studies and Success Stories ................................................................ 45
VIII CONCLUSION AND THE WAY FORWARD ................................................................ 50-54 8.1. Key Findings ................................................................................................................................ 50 8.2. Recommendations ................................................................................................ 53
ANNEXES ................................................................................................................................ 55-101 Annex I: Terms of Reference ................................................................................................ 57 Annex II: Assessment Instrument ................................................................................................ 63 Annex III: Comparative Analysis of COs ................................................................ 87 Annex IV: Sample Design, Sampling Frame, Sample Size and Project Management Team 97
LIST OF TABLES
LIST OF FIGURES
Table 2-1: RSP Outreach at June 2009....................................................................................................6
Figure 2-2: The Institutional and Organizational Assessment (IOA) model of Universalia.
Table 2-2: Number & Name of Sample Districts .....................................................................................15Table 3-1: Number of CO Members Participated in FGDs.......................................................................18Table 3-2: Understanding about Objectives, Mission and Goal of COs...................................................19Table 3-3: Need Identification and Planning...........................................................................................19Table 3-4: Election of CO Office Bearers .................................................................................................20Table 3-5: Inclusion of Poor Household in COs .......................................................................................21Table 3-6: The Reasons of Having few Poor Members in the COs ..........................................................22Table 4-1: Quality of Record Keeping......................................................................................................25Table 4-2: CMST/LMST Training Received by Office Bearers...................................................................26Table 4-3: Why COs Had Few Trained Members: Reasons......................................................................26Table 4-4: Women Issues What have the COs Done about Women's Issues .........................................27Table 5-1: Frequency of Regular Meeting...............................................................................................30Table 5-2: How Frequently Does the CO Think They Should Meet .........................................................31Table 5-3: Number of CO Members in Default .......................................................................................33Table 5-4: Main Reasons for Defaults .....................................................................................................33Table 6-1: Province and Area wise Distribution of COs (2000-2008) ......................................................38Table 6-2: Primary Occupation of Office Bearers....................................................................................40Table 6-3: Residential Status of Office Bearers .......................................................................................40Table 8-1: The Analysis of the Ratings was Based on the Following 15 Indicators. ................................51Table 8-2: CO's Institutional Development Category/Stage....................................................................51Table 8-3: Summary of the Scores and the Final Categorization for COs................................................52
Figure 2-1: RSPs' Three-Tiered Social Mobilization Approach ................................................................13....................13
Figure 2-3: Modified Version of the IOA Model.....................................................................................14Figure 3-1: Holding Officers in the Past by COs ......................................................................................21Figure 4-1: Record Keeping At CO Level..................................................................................................24Figure 4-2: Education Level of the President and Manager of COs ........................................................25Figure 4-3: Number of Trainings Received by COs ..................................................................................26Figure 5-1: Attendance of Members.......................................................................................................30Figure 5-2: Amount of Loan Borrowed from RSPs ..................................................................................32Figure 5-3: Amount of Loan Borrowed from RSPs during Past One Year ................................................33Figure 5-4: Savings by COs ......................................................................................................................34Figure 6-1: Geographic Coverage of COs included I Assessment Survey 2010 .......................................38Figure 6-2: Age Group of Managers of COs ............................................................................................39Figure 9-1: Analysis of COs (percent) Institutional Development...........................................................51
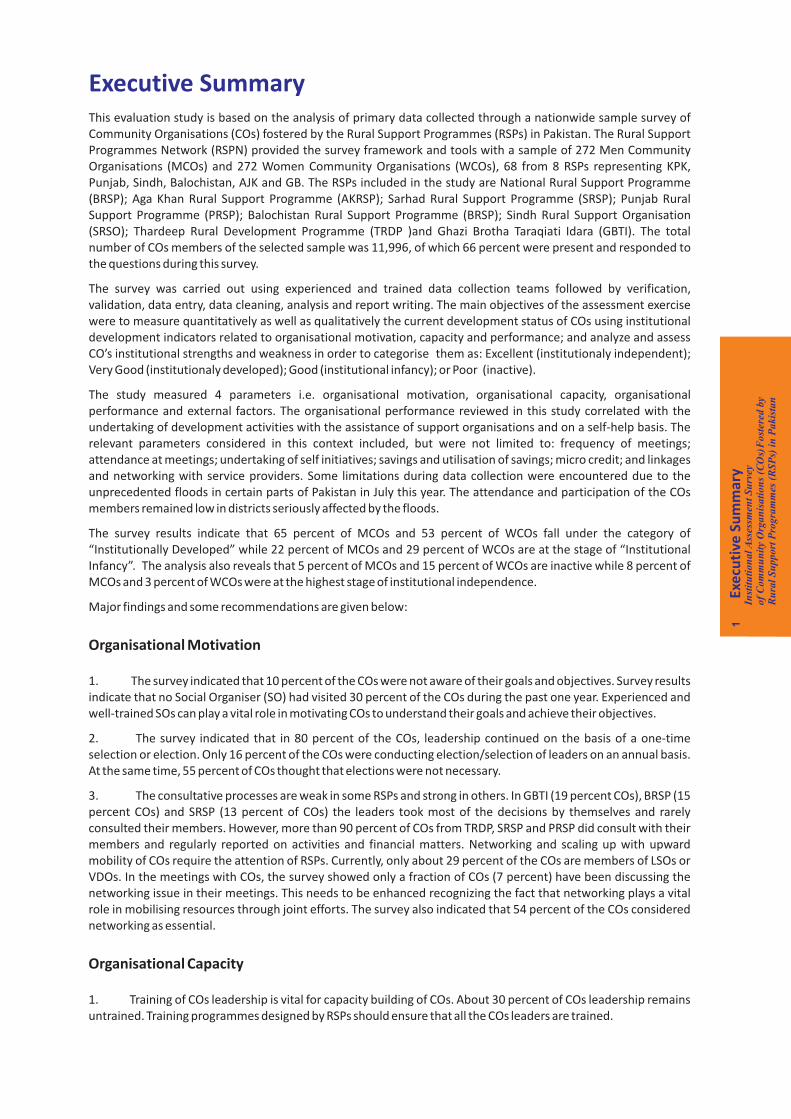
Executive SummaryThis evaluation study is based on the analysis of primary data collected through a nationwide sample survey of Community Organisations (COs) fostered by the Rural Support Programmes (RSPs) in Pakistan. The Rural Support Programmes Network (RSPN) provided the survey framework and tools with a sample of 272 Men Community Organisations (MCOs) and 272 Women Community Organisations (WCOs), 68 from 8 RSPs representing KPK, Punjab, Sindh, Balochistan, AJK and GB. The RSPs included in the study are National Rural Support Programme (BRSP); Aga Khan Rural Support Programme (AKRSP); Sarhad Rural Support Programme (SRSP); Punjab Rural Support Programme (PRSP); Balochistan Rural Support Programme (BRSP); Sindh Rural Support Organisation (SRSO); Thardeep Rural Development Programme (TRDP )and Ghazi Brotha Taraqiati Idara (GBTI). The total number of COs members of the selected sample was 11,996, of which 66 percent were present and responded to the questions during this survey.
The survey was carried out using experienced and trained data collection teams followed by verification, validation, data entry, data cleaning, analysis and report writing. The main objectives of the assessment exercise were to measure quantitatively as well as qualitatively the current development status of COs using institutional development indicators related to organisational motivation, capacity and performance; and analyze and assess CO’s institutional strengths and weakness in order to categorise them as: Excellent (institutionaly independent); Very Good (institutionaly developed); Good (institutional infancy); or Poor (inactive).
The study measured 4 parameters i.e. organisational motivation, organisational capacity, organisational performance and external factors. The organisational performance reviewed in this study correlated with the undertaking of development activities with the assistance of support organisations and on a self-help basis. The relevant parameters considered in this context included, but were not limited to: frequency of meetings; attendance at meetings; undertaking of self initiatives; savings and utilisation of savings; micro credit; and linkages and networking with service providers. Some limitations during data collection were encountered due to the unprecedented floods in certain parts of Pakistan in July this year. The attendance and participation of the COs members remained low in districts seriously affected by the floods.
The survey results indicate that 65 percent of MCOs and 53 percent of WCOs fall under the category of “Institutionally Developed” while 22 percent of MCOs and 29 percent of WCOs are at the stage of “Institutional Infancy”. The analysis also reveals that 5 percent of MCOs and 15 percent of WCOs are inactive while 8 percent of MCOs and 3 percent of WCOs were at the highest stage of institutional independence.
Major findings and some recommendations are given below:
Organisational Motivation
1. The survey indicated that 10 percent of the COs were not aware of their goals and objectives. Survey results indicate that no Social Organiser (SO) had visited 30 percent of the COs during the past one year. Experienced and well-trained SOs can play a vital role in motivating COs to understand their goals and achieve their objectives.
2. The survey indicated that in 80 percent of the COs, leadership continued on the basis of a one-time selection or election. Only 16 percent of the COs were conducting election/selection of leaders on an annual basis. At the same time, 55 percent of COs thought that elections were not necessary.
3. The consultative processes are weak in some RSPs and strong in others. In GBTI (19 percent COs), BRSP (15 percent COs) and SRSP (13 percent of COs) the leaders took most of the decisions by themselves and rarely consulted their members. However, more than 90 percent of COs from TRDP, SRSP and PRSP did consult with their members and regularly reported on activities and financial matters. Networking and scaling up with upward mobility of COs require the attention of RSPs. Currently, only about 29 percent of the COs are members of LSOs or VDOs. In the meetings with COs, the survey showed only a fraction of COs (7 percent) have been discussing the networking issue in their meetings. This needs to be enhanced recognizing the fact that networking plays a vital role in mobilising resources through joint efforts. The survey also indicated that 54 percent of the COs considered networking as essential.
Organisational Capacity
1. Training of COs leadership is vital for capacity building of COs. About 30 percent of COs leadership remains untrained. Training programmes designed by RSPs should ensure that all the COs leaders are trained.
Exe
cuti
ve S
um
mar
y1
Inst
itu
tio
na
l Ass
essm
ent
Su
rvey
of
Co
mm
un
ity
Org
an
isa
tio
ns
(CO
s) F
ost
ered
by
Ru
ral
Su
pp
ort
Pro
gra
mm
es (
RS
Ps)
in
Pa
kis
tan
2. Limited participation by COs was observed in the planning process. The major reason as expressed by 34 percent of the COs was the difficulty in understanding the concept of needs identification and the planning process. More orientations and training programmes need to be designed by incorporating simple tools in the planning process at the community level. Recognition of the importance of the planning process was indicated by 52 percent of the COs. The COs which have participated in this process are by and large practicing it as evidenced by the fact that 54 percent of the COs discussed resolutions in CO meetings and all COs members signed and submitted these resolutions.
3. About one tenth of the COs responded that cost associated with attending trainings was the reason for not attending trainings. It is therefore recommended that appropriate incentives and necessary facilitation be provided for training of COs office bearers at no cost to them.
Organisational Performance
1. The survey showed that 16 percent of the COs had no meeting during the last one year. At the same time, as earlier mentioned, 30 percent of the COs stated that SOs had never visited their COs during the last one year.
2. There is a need to increase activities at the CO level, particularly for women. The survey indicated that 42 percent of the WCOs had no activity. Networking with other agencies including line departments e.g. health and education may be fruitful in engaging these COs in productive activities.
3. About 40 percent of the MCOs had defaulters ranging from 6 to 10 members. Focused group discussions revealed that man-made and natural disasters as well as conflicts had rendered 23 percent borrowers as delinquent.
External Factors
1. Interactions among RSPs are low. The survey indicated that 53 percent of the COs had not been visited by any other RSPs during the last one year.
2. The role of RSPs staff was recognized as helpful and supportive by the members as was expressed by 58 percent of the COs. RSPs may devise programmes and projects ensuring CO participation with an enhanced role of SOs.
3. Group dynamics observed in RSPs indicates that about 25 percent COs have included the poorest of the poor as their members.
Factors Affecting CO Institutional Development
Apart from the development context, a number of factors might be expected to affect the institutional strength of COs, or their capacity to develop institutionally. In following are results of some preliminary statistical analysis of the impact of different factors on COs institutional capacity, as measured by the Institutonal Development Score (IDS). It must be stressed that these simple analyses conceal a complex of different and interconnected effects. They must be interpreted with care. All the relationships reported here have been tested and are statistically significant.
1. COs which have ever taken an RSP loan have an IDS that is 39 percent higher than those which have not. However, the difference between those who have taken a loan in the last 12 months and those which have 'dropped out' of the microcredit programme is much smaller and not significant. This seems to indicate that involvement in credit is positive, but that it does not need to be a currently active involvement.
2. Continuing member saving has an important effect. COs which made savings in the last 12 months, have an average IDS which is 53 percent higher than those which did not.
3. Neither CO age nor the size of the membership has a significant impact on the IDS.
4. The IDS increases with the number of Sponsored Activities which a CO has implemented.
5. The age of a COs’ Office Holders does not affect its IDS.
6. The Office Holders' level of education does appear to have an impact, but the patterns are complicated. Overall, COs whose Presidents hold education above matriculation have an average IDS score of 25.9 out of 45, compared with 22.0 for those with no education. However, MCOs whose President has no education score higher or equal to those with primary and middle school grades. And WCOs with primary education score higher than
Exe
cuti
ve S
um
mar
y2
Inst
itu
tio
na
l Ass
essm
ent
Su
rvey
of
Co
mm
un
ity
Org
an
isa
tio
ns
(CO
s) F
ost
ered
by
Ru
ral
Su
pp
ort
Pro
gra
mm
es (
RS
Ps)
in
Pa
kis
tan

those with middle grades or matriculation. While education above matriculation has a clear effect, differences below that level seems to have more to do with a correlation between the lower IDS scores and the lower level of education in WCOs than it has to do with any direct impact of education.
7. MCOs where the Office Holders have had CMST training score 22 percent higher. For WCOs it is 47 percent.
8. The level of RSP support has a strong impact. COs which have not been visited in the last 12 months, have an average IDS of 18. Just one or two visits raised it to 23. COs which had been visited more than 10 times scored 28 on average.
9. Unsurprisingly, COs satisfaction with RSP was closely related to the institutional development score. COs which rate the RSP as 'inadequate' had an average IDS score of 17. Those who gave a 'satisfactory' rating scored 24. For COs who gave 'very satisfactory', the score was 26.
Exe
cuti
ve S
um
mar
y3
Inst
itu
tio
na
l Ass
essm
ent
Su
rvey
of
Co
mm
un
ity
Org
an
isa
tio
ns
(CO
s) F
ost
ered
by
Ru
ral
Su
pp
ort
Pro
gra
mm
es (
RS
Ps)
in
Pa
kis
tan

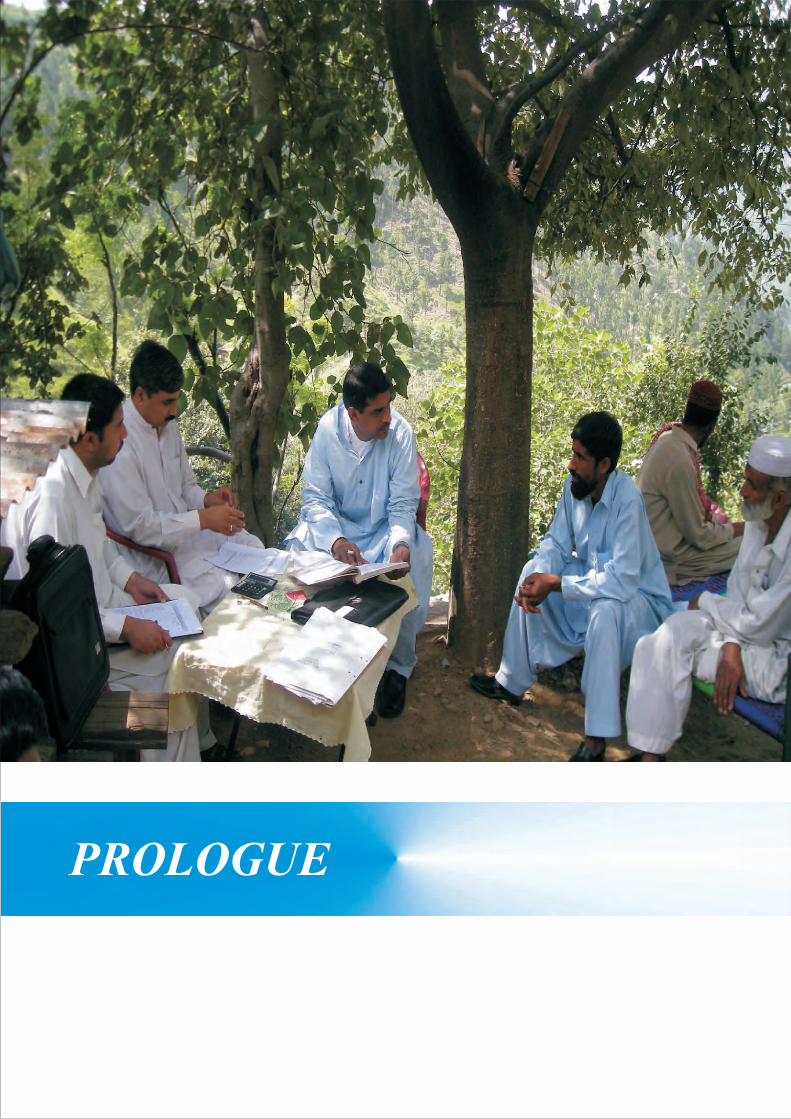
PROLOGUE

II Prologue
2.1. Background
2.1.1. Introduction
The Rural Support Programmes Network (RSPN) is a nationwide network of ten Rural Support Programmes (RSPs), collectively the largest group of civil society organisations in pakistan which is working currently with 3.6 million rural households across the five provinces and Azad Jammu & Kashmir. The RSPs promote and pursue an integrated approach by forming Community Organisations (COs) at the grassroot level.
With their presence in 105 districts, as of June 2010, the outreach of RSPs is 2.7m members with 158,027 COs. RSPs' outreach is given in Fig 2.1. A CO comprising 25-30 members located in a village or hamlet is a vital catalyst providing linkages at the grassroot level and plays the rule of nucleus role in socio-economic development of the targeted communities.
The quality and quantity of outputs and outcomes are directly proportional to the capacity, dedication, capability and expertise possessed by a CO working under its own leadership represented by two key office bearers designated as President and Manager.
1
RSPs Included in this Survey :
1 Aga Khan Rural Support Programme
(AKRSP);
2 Balochistan Rural Support Programme (
BRSP);
3 Ghazi Brotha Taraqiati Idara (GBTI);
4 National Rural Support Programme (NRSP);
5 Punjab Rural Support Programme (PRSP);
6 Sarhad Rural Support Organisation (SRSO)
7 Sindh Rural Support Programme and
8 Thardeep Rural Support Programme (TRDP)
Pro
logu
e6
Inst
itu
tio
na
l Ass
essm
ent
Su
rvey
of
Co
mm
un
ity
Org
an
isa
tio
ns
(CO
s) F
ost
ered
by
Ru
ral
Su
pp
ort
Pro
gra
mm
es (
RS
Ps)
in
Pa
kis
tan
Table 2-1: RSP Outreach at June 2009 RSP
Women Cos
Men COs
Mixed COs
Total COs
Total CO Members
AKRSP 1,981 2,655 - 4,636 172,743 BRSP 1,638 3,688 35 5,361 92,721 GBTI 1,045 1,183 - 2,228 40,864 NRSP 22,270 57,405 4,720 84,895 1,249,833 PRSP 12,226 16,916 528 29,670 500,551 SRSO 2,290 3,782 34 6,106 98,202 SRSP 3,793 8,881 - 12,674 370,697 TRDP 4,937 6,275 1,245 12,457 240,920
All RSPs 50,680 100,785 6,562 158,027 2,766,531 Source: RSP Outreach Issue 01 – April to June 2009

Assessment of a CO's institutional maturity is a key task for RSPs' management as well as for COs. Ground realities reveal that except for AKRSP, there is limited quantitative evidence and qualitative testimony available on the COs in terms of operational efficiency and effectiveness across the RSPs.
In order to undertake an independent survey of COs' institutional maturity, RSPN engaged APEX Consulting, a reputed consulting organisation with experience in conducting research-based programme evaluations, through a transparent and competitive process of selection. Accordingly, a comprehensive survey of 544 sample COs was conducted by the APEX field teams in September, 2010. The survey data was analyzed and collated in this report to inform senior management of the RSPs. The analysis will also be useful for COs, international aid agencies, government departments undertaking development interventions in partnership with RSPs and the public at large.
A fundamental objective of RSPs' social mobilisation efforts is to foster COs as capable grassroot organisations, that are functional, transparent, accountable, and broadly representative. Evidence indicates that investment in the social capital of local communities through collective action for a transformational change leads towards socio-economic development of the people at large. The basic aim of this survey is to assess how far COs have been able to achieve their prime objective.
The specific objectives of the survey are given in Annex 1 under ToR of this study.
The scope of this study has been restricted to response analysis of a set of questions on 15 aspects of COs’ development. On the basis of the response, the COs’ score was given on a 4 point scale for Institutional Development Indicator. The 15 indicators were:
1. How well the CO mission statement and goals are conceived by the community. 2. The planning processes used to identify and prioritise community needs. 3. CO member participation in needs identification and planning. 4. The CO's networking with other community organisations. 5. Frequency of CO meetings. 6. Attendance at CO meetings. 7. Processes for electing Office Bearers. 8. Accountability of Office Bearers. 9. The CO's role in conflict resolution. 10. CO efforts to address women's issues. 11. CO efforts to include poor households. 12. Whether Office Holders and others have received management training. 13. CO involvement in technical training. 14. Procedures for managing CO activities. 15. CO record keeping.
The 15 indicators were then summed up to give each CO an Institutional Development Score (IDS). With a scale from 0 to 3 for each indicator, the maximum possible result was 45. Scoring levels were classified as: Inactive, Below 25 percent (ie < 11); Institutional Infancy, 25 percent to 50 percent (12-22); Institutional Development, 50 percent to 75 percent (23-33); Institutional Independence, over 75 percent (35-45).
The Institutional Assessment Survey of Community Organisations (IASCO) covered 272 MCOs and 272 WCOs (MCO/WCO): 68 from 8 RSPs. The sample included districts from Azad Jammu Kashmir and Gilgit Baltistan, as well as the four main Pakistani provinces. Data was collected using a detailed questionnaire, which was completed in discussion with a focus group of CO members, and cross-checked wherever possible against the COs' written records.
After the identification of data, the first section of the questionnaire recorded factual details about the CO and its activities. In the second section, the enumerator ranked the CO's institutional development against the 15 indicators on a 4 point scale. Section 2 also recorded data on RSP support to the CO, and CO member opinions about the support. Enumerators were also asked to give, confidentially, their personal assessment of the quality of the focus group discussion.
The last section of the questionnaire recorded data on the community's access to standard public services and
2.1.2. Objectives
2.1.3. Scope of the Study
2.1.4. Methodology and Study Framework
Pro
logu
e7
Inst
itu
tio
na
l Ass
essm
ent
Su
rvey
of
Co
mm
un
ity
Org
an
isa
tio
ns
(CO
s) F
ost
ered
by
Ru
ral
Su
pp
ort
Pro
gra
mm
es (
RS
Ps)
in
Pa
kis
tan

facilities: schools, clinics, electricity, etc. This was to provide an indication of the community's overall level of development, as a likely contributory factor to CO's institutional development.
The RSPN MER team provided the Consultants with the survey framework, survey tools, the sampling framework and a list of sample COs as per details given in Annex 1. Sample design, sampling frame, sample size selection, study framework and information about survey team is given in Annex IV.
The entire assignment, from design to field work to data analysis and report preparation, was carried out between July 26, 2010 to November 10, 2010.
An unprecedented, devastating flood hit Pakistan just at the start of the survey. About one-fifth area of the country and about 20 million people were affected by the floods. More than twenty districts of KPK, Punjab, Sindh and Balochistan were seriously affected with heavy loss of crops, infrastructure, livelihood activities and livestock while about 1.8 million houses were washed away. This natural disaster also affected the survey causing the following limitations:
2.1.5. Limitations
2.2.1. Development and Poverty Alleviation in the Post-colonial Era
- Members of COs from the affected districts were displaced and some relocated elsewhere. Consequently, the original data collection schedule could not be adhered to. A revised schedule for data collection had to be prepared. Therefore, systematic data collection was not possible as originally planned. The floods also caused some delays in data collection.
- Considerable delays occurred in the far-flung and difficult-to-reach areas. Due to the floods and consequent mud-sliding, road links were disconnected.
- SOs of the respective RSPs working in flood affected areas could not give their full concentration and attention as they were also simultaneously assigned rescue and rehabilitation work by their respective RSPs. Therefore, the data collection teams had to wait until the SOs of the respective RSPs were available.
- The attendance of the CO members remained low in districts seriously affected by the floods. Therefore, the outcome of discussions may not fully represent views of all CO members in such areas.
- It is worth mentioning that the field teams worked hard and continued data collection during Ramadhan. Meetings in few locations had to be shortened. This resulted in prolonged data collection periods as the number of COs visited during a day remained less than what was originally planned.
- In some (negligible) cases, record keeping was incomplete, therefore the data collection teams had to rely on information and data derived during discussions with CO members.
At the end of WW II, a battle of economic ideologies began to be waged between the communist and the capitalist camps. Each side of the ideological divide was armed with its own model of growth and economic development coupled with promises of technical and financial assistance.
The capitalist ideology gave birth to two major theories of economic development known as “structuralism” and “linear stages of growth model”. Both these theories were non-classical in the sense that both involved a major role for the state as against predominant reliance on the market forces.
The “linear stages of growth model” is chiefly associated with US economist W.W. Rostow who advised successive US administrations on how to channel aid to developing countries in order to transform them into modern capitalist economies, thus realizing the US strategic objectives in the process. The three pre-conditions for growth in this model were: (i) increase in investment rates either through mobilisation of domestic savings or injection of foreign capital; (ii) development of a high performing industrial sector; and (iii) establishment of an institutional framework. All these conditions required the active involvement of the state in the manipulation of domestic savings and investment rates and in creating a legal, political and social framework for efficient functioning of the private sector. This model was inspired by the post-WWII European success in re-industrialisation as a result of the
In the 1960s economists at the United Nations Economic Commission for Latin America and the Caribbean (ECLA) developed this model into “dependency theory” Rostow, W.W. (1960), The Stages of Economic Growth: A Non-Communist Manifesto. Cambridge University Press, Cambridge, UK
2.2. Background and Literature Review
2
3
2
3
Pro
logu
e8
Inst
itu
tio
na
l Ass
essm
ent
Su
rvey
of
Co
mm
un
ity
Org
an
isa
tio
ns
(CO
s) F
ost
ered
by
Ru
ral
Su
pp
ort
Pro
gra
mm
es (
RS
Ps)
in
Pa
kis
tan
Marshall Plan. For non-European societies it, however, did not factor-in the lack of human resources and the absence of historical experience of capitalism and industrialisation, although both were present in pre-modern form in all the societies. Consequently, the model never led to sustained broad-based industrial and social development and instead resulted in concentration of wealth in a few industrial conglomerates within a few industrial sectors.
The failure of Latin American countries in catching up with North American and European economies after WWII .laid the foundations of the “structuralist” school with the pioneering work of Raúl Prebisch It contended that
countries trapped in the dependency cycle of raw material supply and import of manufactured items could only break free through a state sponsored programme of “import substitution”. The governments of developing countries thus need to impose tariffs on imports, provide “infant industry” protection to wide spectrum of domestic industries as well as get directly involved in economic activity through “state owned enterprises”. Decades later the countries following this model discovered that protected domestic industries never reached the level of maturity to be able to compete internationally and the inefficiencies of the “state owned enterprises” made them permanently dependent on state subsidies, draining the exchequer. The relationships of dependence were never fully severed.
Latin America, after experiencing the debt crisis in the early 1980s, and former Soviet Union, Eastern and Central European and Central Asian States after the fall of the Berlin Wall, were slowly eased into the model of the “Washington Consensus” by the Bretton Wood institutions and US administrations.
However, one alternative to the failed post-WWII state sponsored development experiments that did not advocate a return to the neo-classical or to neo-Marxist ideologies were provided by the work of Robert Chambers , Albert Hirschman and M. Bratton. This school of thought advocated bottom-up development and emphasized power of the people in making their own decisions and realising their own projects. The role of the state as well as markets was minimised in this model that advocated direct assistance to the community organisations. Small scale interventions, taken collectively, became one of the accepted directions for development policy. Albert Hirschman analyzed the exceptional circumstances surrounding the birth of post-colonial development economics and noted how political corruption and incompetence had discredited many of the accepted post-WWII development notions. He, however, found optimism in the works of cooperatives in Latin America and discovered the possibility of grassroots collective development. M. Bratton studied grassroots organisations in Africa and considered them a powerful tool for the empowerment of the poor. As the likes of Bratton and Hirschman provided philosophical foundation, Robert Chambers supplied the tools of working with community members. Working at the Institute of Development Studies at the University of Sussex, Robert Chambers, for the first time coined the term Rapid Rural Appraisal (RRA) to describe a technique where the community was in control of setting the development agenda. This model grew rapidly and by the mid 1990's RRA and Participatory Learning and Action (PLA) were common development planning and appraisal techniques. Chambers always attributed the insight reflected in his work to many of the development practitioners in India. In turn, the ideas of Chambers were widely tested and used in India and by other South Asian organisations such as BRAC and Prosika in Bangladesh and the AKRSP in Pakistan.
Pakistan followed this model under the auspices of Harvard Advisory Group and the consequent concentration of wealth in 22 families was highlighted by Dr. Mehbul-ul-Haq in his speech and later in an article published in 'The London Times' on March 22, 1973. Prebisch, Raúl (1950), The Economic Development of Latin America and its Principal Problems. United Nations. This and several sub-sequent sections are adapted from the Ph.D. thesis titled, “Grassroots Organisation Sustainability in Tajikistan“ of Mirza Jahani from Cambridge received in 2008. Chambers, R (1983), Rural Development: Putting the Last , First. Intermediate Technology Publications, London, UK. Hirschman, A (1984) Getting Ahead Collectively: Grassroots Experiences in Latin America. Pergamon, New York, USA.
Bratton, M and van de Walle, N (1992) “Towards Governance in Africa: Popular Demands and State Responses” in Hyden G and Bratton M (eds) Governance and Politics in Africa. Lynne Rienner, UK Hirschman, A (1984), Getting Ahead Collectively: Grassroots Experiences in Latin America. Pergamon, New York, USA.
2.2.2.. Failure of the State Sponsored Models and the Move towards Participatory Development
4
5
6
7
8
4
5
6
7
8
9
9
10
10
Pro
logu
e9
Inst
itu
tio
na
l Ass
essm
ent
Su
rvey
of
Co
mm
un
ity
Org
an
isa
tio
ns
(CO
s) F
ost
ered
by
Ru
ral
Su
pp
ort
Pro
gra
mm
es (
RS
Ps)
in
Pa
kis
tan
2.2.3. Models for the Formation of Grass Root Organisations (GROs)/(COs )
2.2.4. History of Social Mobilisation in Pakistan
The shift in focus from the state to the community organisations meant that people needed to be mobilised and organized at the grassroots level be that a hamlet, village or town. As these organisations slowly became the focus of development work their behaviour was also closely studied. Many researchers also studied the process of formation of these grassroots organisations that had some bearing on their performance and sustainability. Professor Jenny Pearce of University of Bradford identified three ways in which community organisations (grassroots organisations) were being formed. In the first instance, grassroots structures of local cooperation that had existed historically were supported by the donors and the NGOs. This support linked these traditional grassroots organisations with non-state actors. In the second case, the relationship between the grassroots organisations and non-state actors (mostly foreign NGOs) was restricted to the advocacy of local issues (honor killings, degradation of local land by multinationals, etc.) at both national and international levels.
The third type of synergy between community organisations and NGOs involved a more active role where NGOs actively mobilised the populace and assisted the process of the formation of these community organisations. Some scholars describe thus formed local organisations as “induced GROs”. This third model of formation of COs was followed in the creation of NGOs in South Asia. Organisations such as BRAC and Proshika in Bangladesh, Sadguru in India, and AKRSP and NRSP in Pakistan actively formed COs and their pyramid of village and local organisations. Similarly, the disbursement of the international development assistance that was channeled through international NGOs such as CARE, Plan International, Save the Children, etc. meant either the strengthening of or fresh formation of COs.
As a result of the shift of the development paradigm from the state to the civil society, there now exists a near-blanket cover of such community organisations in several of the developing countries. In fact, some of the communities even in remote areas are serviced by several NGOs, both local and international, and thus the COs, as well as their upwardly linked organisations, are simultaneously carrying out projects with several civil society and donor organisations.
The history of social mobilisation in Pakistan can be traced to the Comilla Project launched in 1959 by the Pakistan Academy for Rural Development under the leadership of Dr. Akhtar Hameed Khan. In 1971 the model was replicated by Shoaib Sultan Khan in Daudzai. The assumptions underlying the Comilla and Daudzai models were the willingness of the community to improve its own condition along with the presence of an activist and that of the government to help the poor with available resources. However, the poor cannot help themselves unless they are organised, and the government was unable to reach the poor within its current structure. Therefore, alternative models of participatory development had to be developed for poverty reduction. The two pioneering projects adopted groups of poor women and men into grassroots organisations, provided skills development and fostered a cadre of village specialists who accumulated capital through savings and increased productivity through local planning and efficient and effective use of locally-available resources. They also accessed services and resources from government as well as markets. In this social mobilization model the “Support Organisation” was to act as a catalyst by fostering grassroots organisations and village cadre and developing Programmeme packages for mobilization of resources. The role of the “Support Organisation” became gradually clear as the work of the AKRSP progressed in the Northern Areas of Pakistan since its inception in 1982. As of December 2009, there were 10 Rural Support Programmes (RSPs) working in 103 districts and 2 FATA Agencies/Areas using the model pioneered by Comilla, Daudzai and AKRSP.
The RSPs in Pakistan define social mobilisation as “harnessing people's potential to help them by establishing a network of grassroots institutions for poverty reduction and sustainable & equitable development”. Through social mobilization these RSPs work to harness the innate potential of the community which remains locked under the debris of centuries old customs and hostile socio-economic forces. These RSPs strive to increase a community's (i) social capital through organisation; (ii) human capital through training; and (iii) financial capital through a discipline of regular savings.
Pearce, J (1997), Between Co-option and Irrelevance? Latin American NGOs in the 1990s in Hulme, D and Edwards, M. (eds) “NGOs, the State and Donors: Too close for Comfort” MacMillian in association with Save the Children Fund, Basingstoke, UK
Midgley, J (1986), Community Participation, Social Development and the State. Methnen, London, UK Other sister organisations of NRSP that engaged in this activity included: (i) Punjab Rural Support Programmeme (PRSP); (ii) Balochistan Rural Support Programmeme (BRSP); (iii) Sindh Rural Support Organisation (SRSO); (iv) Sarhad Rural Support Programmeme (SRSP); and (v) Thardeep Rural Development Programmeme (TRDP).
11
11
12
12
13
13
Pro
logu
e10
Inst
itu
tio
na
l Ass
essm
ent
Su
rvey
of
Co
mm
un
ity
Org
an
isa
tio
ns
(CO
s) F
ost
ered
by
Ru
ral
Su
pp
ort
Pro
gra
mm
es (
RS
Ps)
in
Pa
kis
tan
2.2.5. Process of COs Formation by RSPs in Pakistan
In Pakistan, RSPs have been fostering COs since 1983. The pace of CO formation was, however, not brisk until the year 2000 when the Pakistan Poverty Alleviation Fund (PPAF), supported by the World Bank and Government of Pakistan, began to make investments. Data compiled by the RSPN, shows that of the total COs fostered by RSPs between 1983 and 2009, nearly 90 percent of the COs were fostered since the year 2000. Of the total COs formed, 60.7 percent are MCOs, 31.9 percent are WCOs and 7.4 percent are mixed-gendered COs. An analysis of the 109,122 COs formed by eight RSPs, between 2000-2008 shows that 64.2 percent are in Punjab followed by 16.8 percent in Sindh while the shares of the other provinces are either 10 percent or below. The NRSP has fostered nearly 60 percent of the total COs formed during 2000-2008.
RSPs in Pakistan have generally adopted the “induced GROs” model that includes active social mobilization. This has been the norm for other NGOs working in the rural areas such as BRAC, Proshika, Sadguru, etc. in much of South Asia.
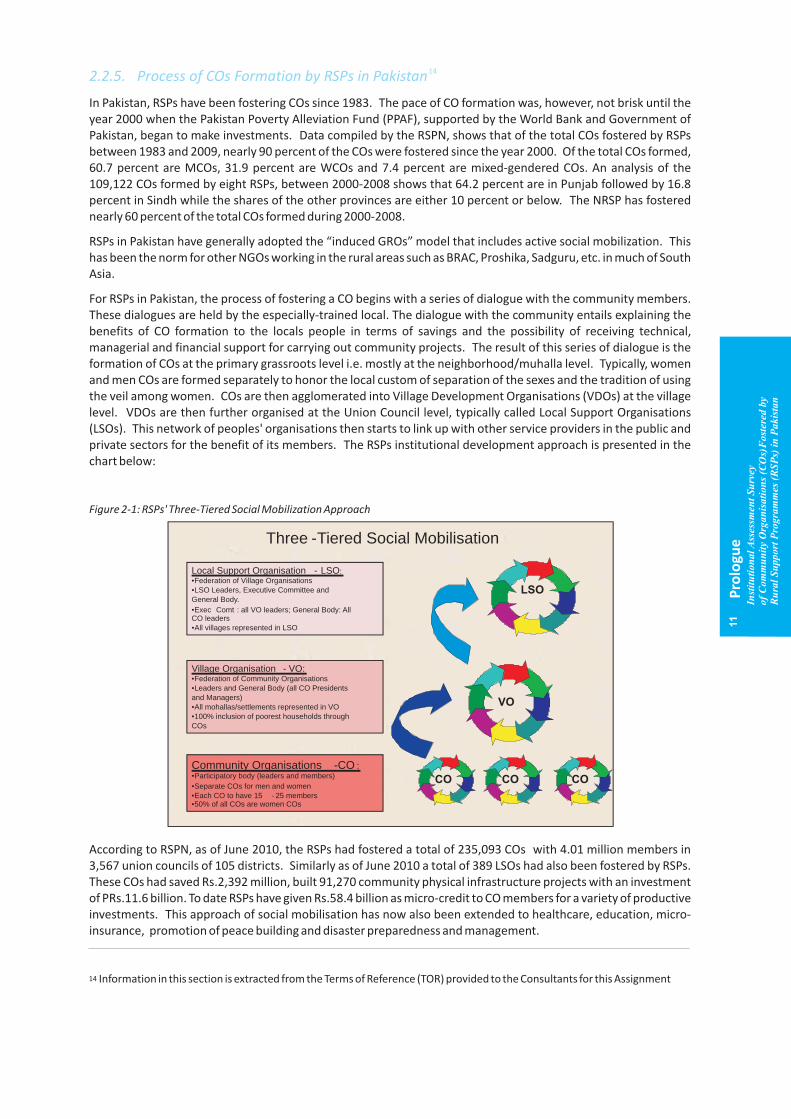
For RSPs in Pakistan, the process of fostering a CO begins with a series of dialogue with the community members. These dialogues are held by the especially-trained local. The dialogue with the community entails explaining the benefits of CO formation to the locals people in terms of savings and the possibility of receiving technical, managerial and financial support for carrying out community projects. The result of this series of dialogue is the formation of COs at the primary grassroots level i.e. mostly at the neighborhood/muhalla level. Typically, women and men COs are formed separately to honor the local custom of separation of the sexes and the tradition of using the veil among women. COs are then agglomerated into Village Development Organisations (VDOs) at the village level. VDOs are then further organised at the Union Council level, typically called Local Support Organisations (LSOs). This network of peoples' organisations then starts to link up with other service providers in the public and private sectors for the benefit of its members. The RSPs institutional development approach is presented in the chart below:
Figure 2-1: RSPs' Three-Tiered Social Mobilization Approach
According to RSPN, as of June 2010, the RSPs had fostered a total of 235,093 COs with 4.01 million members in 3,567 union councils of 105 districts. Similarly as of June 2010 a total of 389 LSOs had also been fostered by RSPs. These COs had saved Rs.2,392 million, built 91,270 community physical infrastructure projects with an investment of PRs.11.6 billion. To date RSPs have given Rs.58.4 billion as micro-credit to CO members for a variety of productive investments. This approach of social mobilisation has now also been extended to healthcare, education, micro-insurance, promotion of peace building and disaster preparedness and management.
Information in this section is extracted from the Terms of Reference (TOR) provided to the Consultants for this Assignment
Three -Tiered Social Mobilisation
LSO
CO CO
VO
COCommunity Organisations -CO :•Participatory body (leaders and members)
•Separate COs for men and women
•Each CO to have 15 - 25 members•50% of all COs are women COs
Village Organisation - VO:•Federation of Community Organisations
•Leaders and General Body (all CO Presidents
and Managers)
•All mohallas/settlements represented in VO
•100% inclusion of poorest households through
COs
Local Support Organisation - LSO:
•Federation of Village Organisations
•LSO Leaders, Executive Committee and
General Body.
•Exec Comt : all VO leaders; General Body: All CO leaders
•All villages represented in LSO
14
14
Pro
logu
e11
Inst
itu
tio
na
l Ass
essm
ent
Su
rvey
of
Co
mm
un
ity
Org
an
isa
tio
ns
(CO
s) F
ost
ered
by
Ru
ral
Su
pp
ort
Pro
gra
mm
es (
RS
Ps)
in
Pa
kis
tan
2.2.6. Various Models for the Institutional Assessment of (GROs)/(COs )
2.2.7. Theoretical Framework for the Institutional Assessment of the COs
The large scale formation of GROs in many developing regions of the world inevitably led to the debate about the efficacy of these organisations and their work. The projects and programmes implemented by these organisations went through the routine monitoring and evaluation cycles and the impact of these interventions were regularly gauged through various models and M&E techniques pioneered by donors, development agencies and governments. Researchers interested in measuring the overall performance of these organisations (as against the outcome and impact of a certain project or programme) began using the various institutional and organisational assessment models that were available and were being used in the field of corporate and public sector management. Some of the models that were available for use included the following.
One of the pioneering works in institutional assessment was the Seven S-Model developed to help managers analyse and then improve the performance of their enterprises. The model looks at the set of seven variables (structure, strategy, skills, style, staff, shared values and systems) and in a holistic manner, tries to determine the overall system performance. The drawback of the model is that it focuses more on activities inside the organisation than outside and gives little attention to two other “Ss” which are particularly important for social enterprises i.e. stakeholders and setting.
A similar model was developed somewhat earlier by US analyst Marvin Weisbord which looks at purpose, structure, relationships, rewards, leadership and helpful mechanisms to measure performance by using the input and output categories. The model is not specific to any sector and can be used across different types of organisations.
A model that not only measures performance but also gives clues to the process of change is the Burke & Litwin Model that links the internal factors of the organisation with the outside environment. The model is a good tool for managing organisational change. The organisational dimensions measured under this model include external environment, mission and strategy, leadership, organisational culture, structure, management practices, systems, work unit climate, task and individual skills, individual needs and values, motivation and individual and organisational performance.
Another model that focuses even more on the outside environment is the Open System Model that inherently perceives an organisation as a unit that is in constant interaction with its external environment.
In the field of development, one of the most comprehensive and widely used models for organisational assessment is the Institutional and Organisational Assessment Model (IOA Model) which identifies four areas and then looks into the factors in each of these four areas.
This evaluation assignment draws inspiration from the theoretical framework of the IOA Model developed by Universalia, a Canadian Monitoring and Evaluation (M&E) firm, in collaboration with the International Development Research Centre (IDRC). The Model is being further developed in collaboration with McGill University of Canada to prepare an interactive organisational assessment tool.
The IOA Model is quite comprehensive compared to the other models mentioned in the previous section. The IOA Model is also broad enough to be applied to any form of organisation be that in the public, government, corporate, civil society or informal sector.
The origin of this model is traced back to early 1980s and is ascribed to Tom Peters and Robert Waterman, two consultants working at the consulting firm of McKinsey & Company.
Weisbord, M (1978), Organisational Diagnosis: A workbook of Theory and Practice. Addison-Wesley Burke, W. Warner and Litwin, George H., A Causal Model of Organisational Performance and Change published in Journal of Management 1992 (vol. 18, No. 3, 523-545) Lusthaus, Charles, Adrien, Marie-Helene, Anderson, Gary, Carden, Fred and Montalvan, George Plinio, (2002) Organisational Assessment: A Framework for Improving Performance IDRC reports to the Canadian Parliament through the Minister of Foreign Affairs. Approximately 83 percent of IDRC's 2008/2009 revenues came from Parliament.
15
15
16
16
17
17
18
18
19
19
Pro
logu
e12
Inst
itu
tio
na
l Ass
essm
ent
Su
rvey
of
Co
mm
un
ity
Org
an
isa
tio
ns
(CO
s) F
ost
ered
by
Ru
ral
Su
pp
ort
Pro
gra
mm
es (
RS
Ps)
in
Pa
kis
tan

Figure 2-2: The Institutional and Organisational Assessment (IOA) model of Universalia.
Source: Universalia.com
The Model is designed to measure the performance of an organisation as evidenced by “organisation's effectiveness (mission fulfillment), efficiency (accuracy, timeliness and value of services and programme delivery), ongoing relevance (the extent to which an organisation adapts to changing conditions and its environment), and financial viability.”
For the purpose of this survey the above outlined IOA Model was adapted with changes to reflect the needs of evaluating the RSP fostered COs in Pakistan. The four broad areas of investigation were kept intact i.e. the external environment, organisational performance, organisational motivation and organisational capacity. The factors to be investigated within these four areas were, however, carefully selected based upon the experience of RSP in social mobilisation within the context of Pakistan.
http://universalia.com/services/institutional-and-organisational-performance-assessmentpercent20 The exercise of adapting the IOA Model for the purpose of this survey was carried out by the RSPN internally and the Consultants were provided with the final adapted version of the IOA model in the TOR.
20
20
21
21
Pro
logu
e13
Inst
itu
tio
na
l Ass
essm
ent
Su
rvey
of
Co
mm
un
ity
Org
an
isa
tio
ns
(CO
s) F
ost
ered
by
Ru
ral
Su
pp
ort
Pro
gra
mm
es (
RS
Ps)
in
Pa
kis
tan
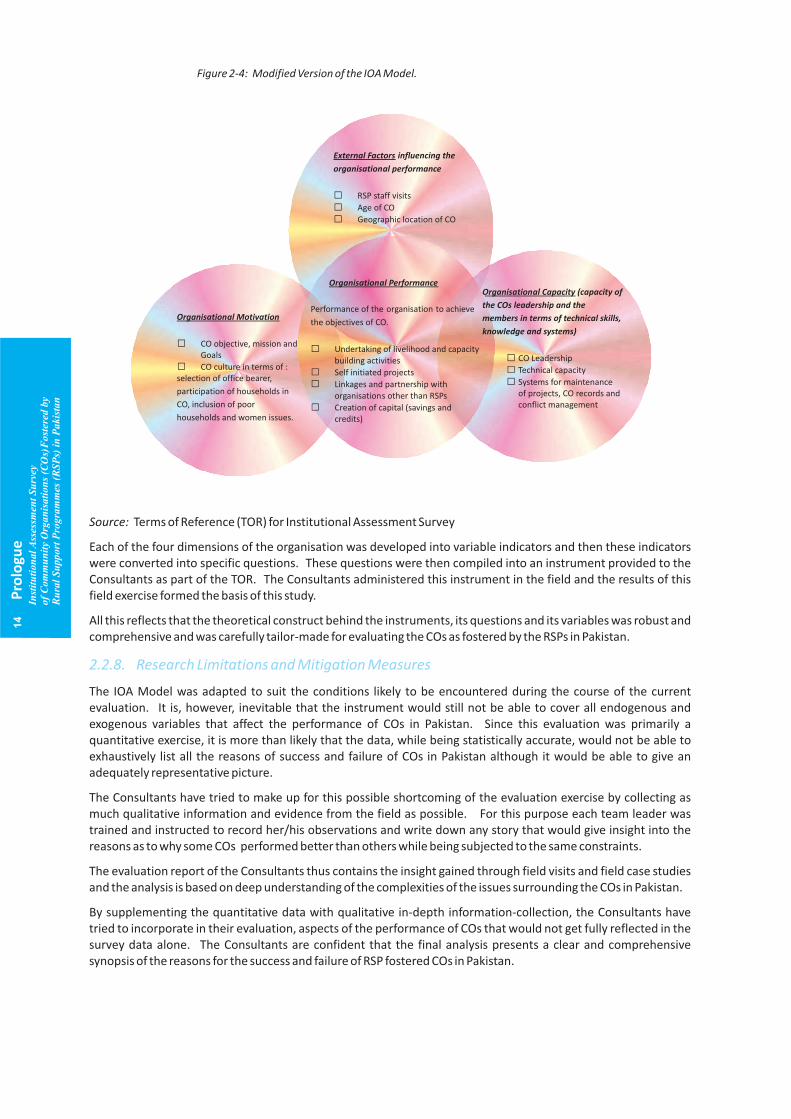
Figure 2-4: Modified Version of the IOA Model.
Source: Terms of Reference (TOR) for Institutional Assessment Survey
Each of the four dimensions of the organisation was developed into variable indicators and then these indicators were converted into specific questions. These questions were then compiled into an instrument provided to the Consultants as part of the TOR. The Consultants administered this instrument in the field and the results of this field exercise formed the basis of this study.
All this reflects that the theoretical construct behind the instruments, its questions and its variables was robust and comprehensive and was carefully tailor-made for evaluating the COs as fostered by the RSPs in Pakistan.
The IOA Model was adapted to suit the conditions likely to be encountered during the course of the current evaluation. It is, however, inevitable that the instrument would still not be able to cover all endogenous and exogenous variables that affect the performance of COs in Pakistan. Since this evaluation was primarily a quantitative exercise, it is more than likely that the data, while being statistically accurate, would not be able to exhaustively list all the reasons of success and failure of COs in Pakistan although it would be able to give an adequately representative picture.
The Consultants have tried to make up for this possible shortcoming of the evaluation exercise by collecting as much qualitative information and evidence from the field as possible. For this purpose each team leader was trained and instructed to record her/his observations and write down any story that would give insight into the reasons as to why some COs performed better than others while being subjected to the same constraints.
The evaluation report of the Consultants thus contains the insight gained through field visits and field case studies and the analysis is based on deep understanding of the complexities of the issues surrounding the COs in Pakistan.
By supplementing the quantitative data with qualitative in-depth information-collection, the Consultants have tried to incorporate in their evaluation, aspects of the performance of COs that would not get fully reflected in the survey data alone. The Consultants are confident that the final analysis presents a clear and comprehensive synopsis of the reasons for the success and failure of RSP fostered COs in Pakistan.
2.2.8. Research Limitations and Mitigation Measures
External Factors influencing the
organisational performance
RSP staff visits
Age of CO
Geographic location of CO
Organisational Motivation
CO objective, mission and Goals
CO culture in terms of : selection of office bearer,
participation of households in
CO, inclusion of poor
households and women issues.
Organisational Performance
Performance of the organisation to achieve
the objectives of CO.
Undertaking of livelihood and capacity building activities
Self initiated projects
Linkages and partnership with organisations other than RSPs
Creation of capital (savings and credits)
Organisational Capacity (capacity of
the COs leadership and the
members in terms of technical skills,
knowledge and systems)
CO Leadership
Technical capacity
Systems for maintenance of projects, CO records and conflict management
Pro
logu
e14
Inst
itu
tio
na
l Ass
essm
ent
Su
rvey
of
Co
mm
un
ity
Org
an
isa
tio
ns
(CO
s) F
ost
ered
by
Ru
ral
Su
pp
ort
Pro
gra
mm
es (
RS
Ps)
in
Pa
kis
tan
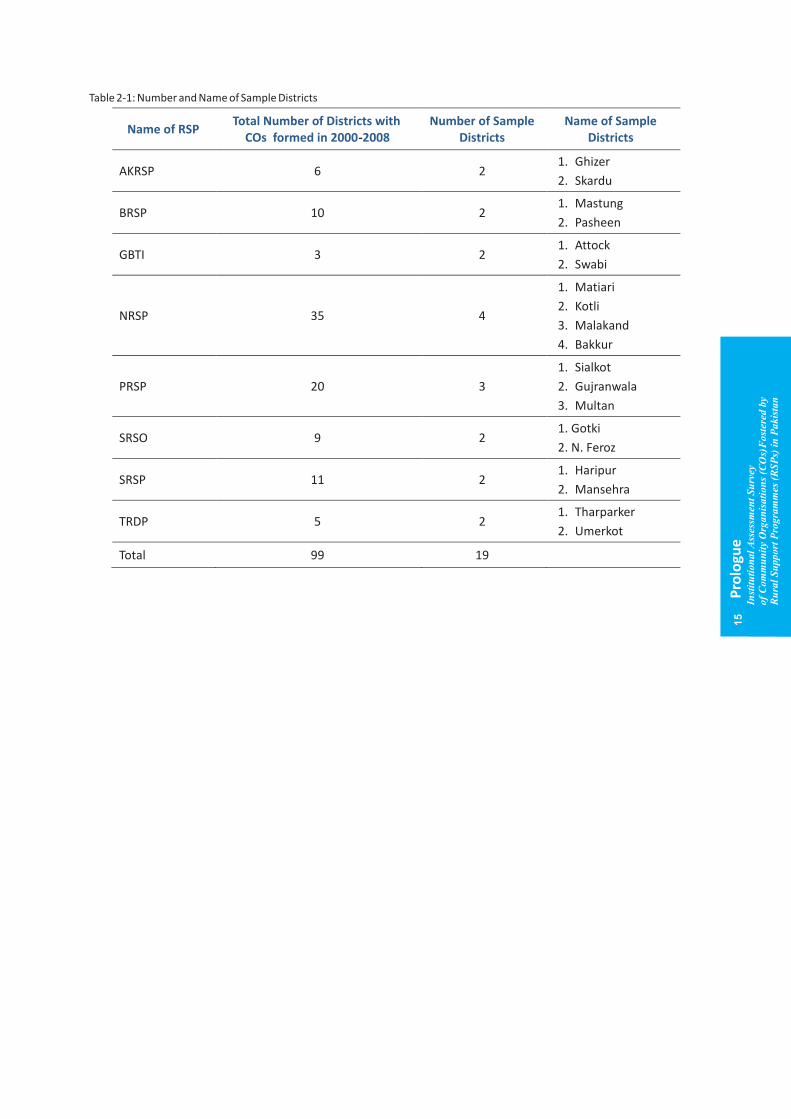
Table 2-1: Number and Name of Sample Districts
Name of RSP Total Number of Districts with
COs formed in 2000-2008 Number of Sample
Districts Name of Sample
Districts
AKRSP 6 2 1. Ghizer
2. Skardu
BRSP 10 2 1. Mastung
2. Pasheen
GBTI 3 2 1. Attock
2. Swabi
NRSP 35 4
1. Matiari
2. Kotli
3. Malakand
4. Bakkur
PRSP 20 3
1. Sialkot
2. Gujranwala
3. Multan
SRSO 9 2 1. Gotki
2. N. Feroz
SRSP 11 2 1. Haripur
2. Mansehra
TRDP 5 2 1. Tharparker
2. Umerkot
Total 99 19
Pro
logu
e15
Inst
itu
tio
na
l Ass
essm
ent
Su
rvey
of
Co
mm
un
ity
Org
an
isa
tio
ns
(CO
s) F
ost
ered
by
Ru
ral
Su
pp
ort
Pro
gra
mm
es (
RS
Ps)
in
Pa
kis
tan

Organisational Motivation
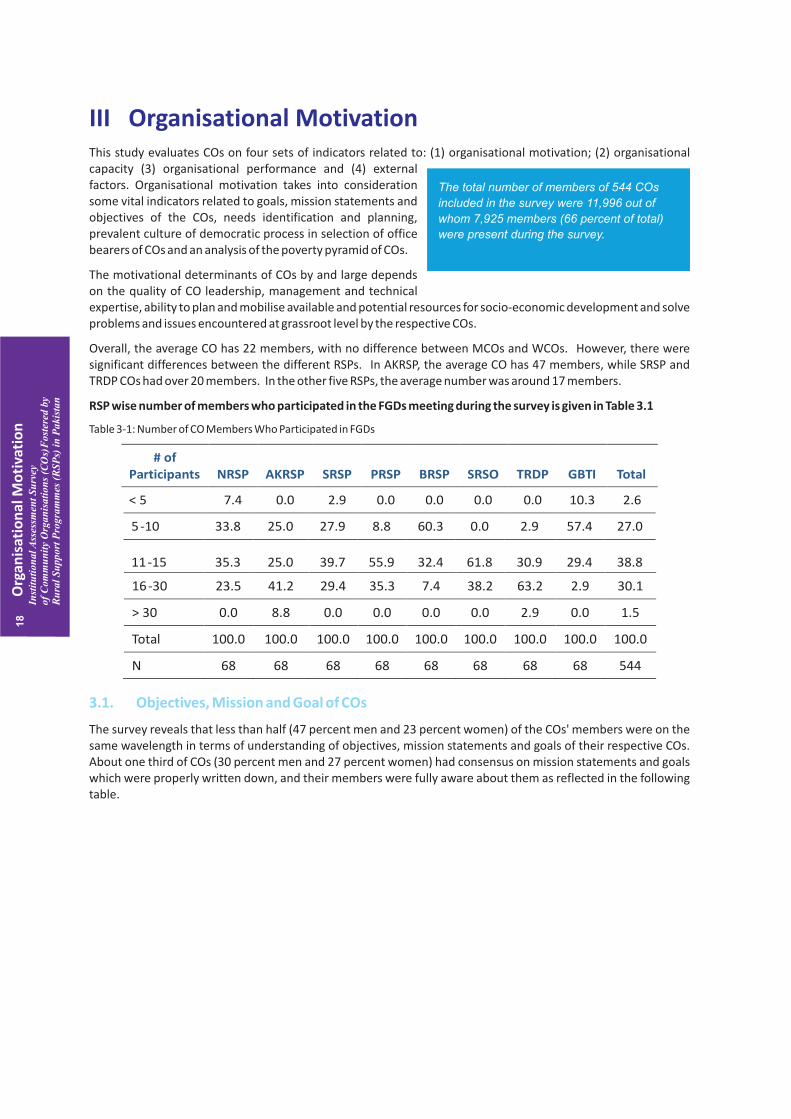
III Organisational MotivationThis study evaluates COs on four sets of indicators related to: (1) organisational motivation; (2) organisational capacity (3) organisational performance and (4) external factors. Organisational motivation takes into consideration some vital indicators related to goals, mission statements and objectives of the COs, needs identification and planning, prevalent culture of democratic process in selection of office bearers of COs and an analysis of the poverty pyramid of COs.
The motivational determinants of COs by and large depends on the quality of CO leadership, management and technical expertise, ability to plan and mobilise available and potential resources for socio-economic development and solve problems and issues encountered at grassroot level by the respective COs.
Overall, the average CO has 22 members, with no difference between MCOs and WCOs. However, there were significant differences between the different RSPs. In AKRSP, the average CO has 47 members, while SRSP and TRDP COs had over 20 members. In the other five RSPs, the average number was around 17 members.
RSP wise number of members who participated in the FGDs meeting during the survey is given in Table 3.1
Table 3-1: Number of CO Members Who Participated in FGDs
The survey reveals that less than half (47 percent men and 23 percent women) of the COs' members were on the same wavelength in terms of understanding of objectives, mission statements and goals of their respective COs. About one third of COs (30 percent men and 27 percent women) had consensus on mission statements and goals which were properly written down, and their members were fully aware about them as reflected in the following table.
3.1. Objectives, Mission and Goal of COs
# of Participants NRSP AKRSP SRSP PRSP BRSP SRSO TRDP GBTI Total
< 5 7.4 0.0 2.9 0.0 0.0 0.0 0.0 10.3 2.6
5 -10 33.8 25.0 27.9 8.8 60.3 0.0 2.9 57.4 27.0
11 -15 35.3 25.0 39.7 55.9 32.4 61.8 30.9 29.4 38.8
16 -30 23.5 41.2 29.4 35.3 7.4 38.2 63.2 2.9 30.1
> 30 0.0 8.8 0.0 0.0 0.0 0.0 2.9 0.0 1.5
Total 100.0 100.0 100.0 100.0 100.0 100.0 100.0 100.0 100.0
N 68 68 68 68 68 68 68 68 544
The total number of members of 544 COs
included in the survey were 11,996 out of
whom 7,925 members (66 percent of total)
were present during the survey.
18
Org
anis
atio
nal
Mo
tiva
tio
nIn
stit
uti
on
al A
sses
smen
t S
urv
eyo
f C
om
mu
nit
y O
rga
nis
ati
on
s (C
Os)
Fo
ster
ed b
y R
ura
l S
up
po
rt P
rog
ram
mes
(R
SP
s) i
n P
ak
ista
n
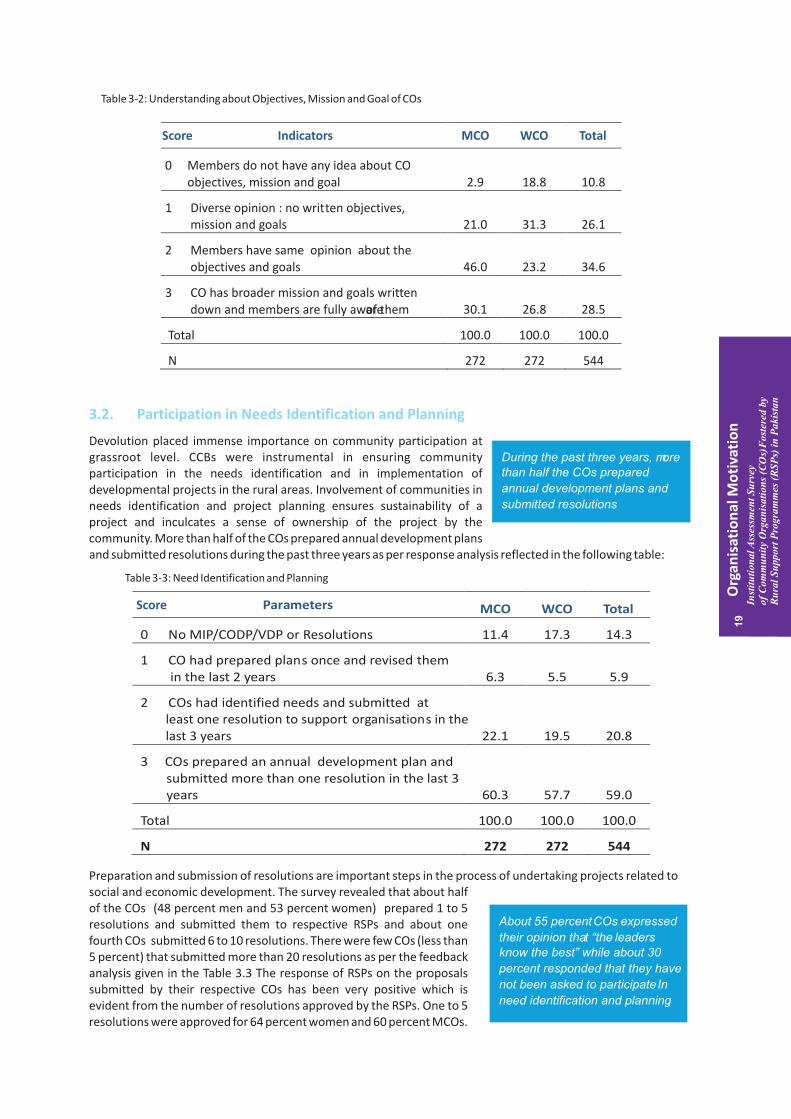
Table 3-2: Understanding about Objectives, Mission and Goal of COs
Devolution placed immense importance on community participation at grassroot level. CCBs were instrumental in ensuring community participation in the needs identification and in implementation of developmental projects in the rural areas. Involvement of communities in needs identification and project planning ensures sustainability of a project and inculcates a sense of ownership of the project by the community. More than half of the COs prepared annual development plans and submitted resolutions during the past three years as per response analysis reflected in the following table:
Table 3-3: Need Identification and Planning
Preparation and submission of resolutions are important steps in the process of undertaking projects related to social and economic development. The survey revealed that about half of the COs (48 percent men and 53 percent women) prepared 1 to 5 resolutions and submitted them to respective RSPs and about one fourth COs submitted 6 to 10 resolutions. There were few COs (less than 5 percent) that submitted more than 20 resolutions as per the feedback analysis given in the Table 3.3 The response of RSPs on the proposals submitted by their respective COs has been very positive which is evident from the number of resolutions approved by the RSPs. One to 5 resolutions were approved for 64 percent women and 60 percent MCOs.
3.2. Participation in Needs Identification and Planning
Parameters MCO WCO Total
0 No MIP/CODP/VDP or Resolutions 11.4 17.3 14.3
1 CO had prepared plans once and revised them in the last 2 years 6.3 5.5 5.9
2 COs had identified needs and submitted at s least one resolution to support organisation in the
last 3 years 22.1 19.5 20.8
3 COs prepared an annual development plan and submitted more than one resolution in the last 3 years 60.3 57.7 59.0
Total 100.0 100.0 100.0
N 272 272 544
During the past three years, more than half the COs prepared
annual development plans and
submitted resolutions
Indicators MCO WCO Total
0 Members do not have any idea about CO objectives, mission and goal 2.9 18.8 10.8
1 Diverse opinion : no written objectives, mission and goals 21.0 31.3 26.1
2 Members have same opinion about the objectives and goals 46.0 23.2 34.6
3 CO has broader mission and goals written down and members are fully aware of them 30.1 26.8 28.5
Total 100.0 100.0 100.0
N 272 272 544
About 55 percent COs expressed
their opinion that “the leaders know the best” while about 30
percent responded that they have
not been asked to participate In
need identification and planning.
19
Org
anis
atio
nal
Mo
tiva
tio
nIn
stit
uti
on
al A
sses
smen
t S
urv
eyo
f C
om
mu
nit
y O
rga
nis
ati
on
s (C
Os)
Fo
ster
ed b
y R
ura
l S
up
po
rt P
rog
ram
mes
(R
SP
s) i
n P
ak
ista
n
Score
Score

The majority of COs (48 percent women and 56 percent men) considered preparation of resolutions and plans as important. An analysis of the survey revealed that about half of the COs (61 percent women and 49 percent men) discussed the resolutions in CO meetings followed by signing of these resolutions. The preparation and signing of resolutions by WCOs was comparatively low. 51 to 75 percent members of 6 percent WCOs signed the resolutions compared to 25 percent MCOs. Needs identification and planning were seen as a difficult activity for CO members as was expressed by 42 percent men and 29 percent WCOs. About 17 percent COs stated that they did not think it necessary and a fairly large number of respondents stated that there was no point to undertake this activity.
An important outcome of the functioning of COs is that it provides an opportunity and promotes democratic processes in developing leadership at the grassroot level. The mode of selection or election of COs Presidents and Managers plays a vital role in the development process. A response analysis indicates that only about 15 percent COs conduct annual election/selection as given in Table 3.4
Table 3-4: Election of CO Office Bearers
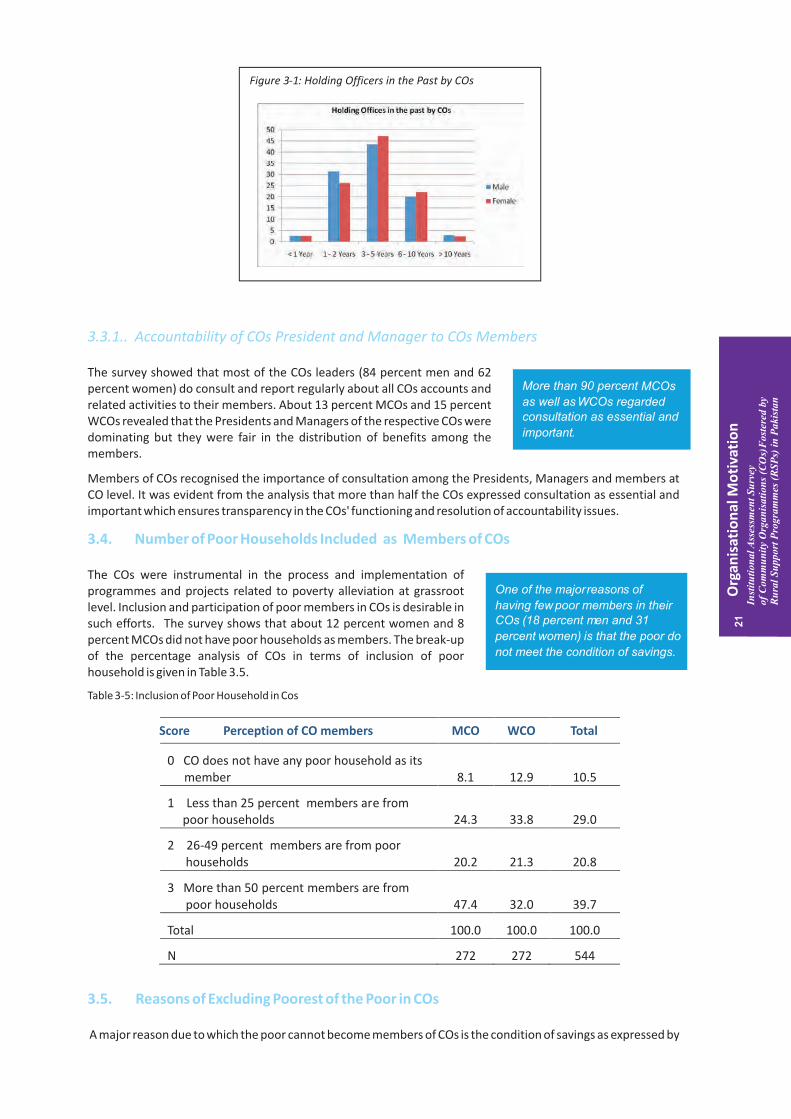
Although greater emphasis is now being given to democracy, RSPs have not advised COs that they should hold regular elections for the two Office Holder positions. A number of earlier studies have suggested that COs tend to be led by the existing elite, without strong evidence on whether this is a good or a bad thing. The survey shows that the leadership in 70 percent of COs has never changed. Between the different RSPs, there was a relatively high proportion i.e. over 40 percent - with leadership changes in AKRSP, SRSP and GBTI. However, there is no evidence to support the fact that leadership change is good or bad.
A comparative analysis is given in Fig 3.1. It indicates that above 40 percent of the office bearers of the COs (both men and women) are holding their office for 3 to 5 years.
3.3. Selection of COs President and Manager
Selection of CO Presidents and Managers MCO WCO Total
0 Office holders appointed by RSP staff 0.0 3.3 1.7
1 Office holders are appointed by important people in CO 3.3 4.0 3.7
2 President and Managers elected (selected by consensus ) by CO members once only 82.4 76.5 79.4
3 CO is conducting annual election/selection by consensus 14.3 16.2 15.3
Total 100.0 100.0 100.0
N 272 272 544
The major reason for not undertaking need identification and planning by the COs is
that it is too difficult of a process
In majority of the COs (82 percent men
and 77 percent women), President and Manager are elected (selected by
consensus) by CO members.
About 65 percent men and 55 percent WCOs did
not consider elections as necessary.
About half (47 percent) of COs have
their Presidents and Managers who hold their positions over 3 to 5 years.
20
Org
anis
atio
nal
Mo
tiva
tio
nIn
stit
uti
on
al A
sses
smen
t S
urv
eyo
f C
om
mu
nit
y O
rga
nis
ati
on
s (C
Os)
Fo
ster
ed b
y R
ura
l S
up
po
rt P
rog
ram
mes
(R
SP
s) i
n P
ak
ista
n
Score
3.3.1.. Accountability of COs President and Manager to COs Members
3.4. Number of Poor Households Included as Members of COs
3.5. Reasons of Excluding Poorest of the Poor in COs
The survey showed that most of the COs leaders (84 percent men and 62 percent women) do consult and report regularly about all COs accounts and related activities to their members. About 13 percent MCOs and 15 percent WCOs revealed that the Presidents and Managers of the respective COs were dominating but they were fair in the distribution of benefits among the members.
Members of COs recognised the importance of consultation among the Presidents, Managers and members at CO level. It was evident from the analysis that more than half the COs expressed consultation as essential and important which ensures transparency in the COs' functioning and resolution of accountability issues.
The COs were instrumental in the process and implementation of programmes and projects related to poverty alleviation at grassroot level. Inclusion and participation of poor members in COs is desirable in such efforts. The survey shows that about 12 percent women and 8 percent MCOs did not have poor households as members. The break-up of the percentage analysis of COs in terms of inclusion of poor household is given in Table 3.5.
Table 3-5: Inclusion of Poor Household in C s
A major reason due to which the poor cannot become members of COs is the condition of savings as expressed by
o
Perception of CO members MCO WCO Total
0 CO does not have any poor household as its member 8.1 12.9 10.5
1 Less than 25 percent members are from poor households 24.3 33.8 29.0
2 26-49 percent members are from poor households 20.2 21.3 20.8
3 More than 50 percent members are from poor households 47.4 32.0 39.7
Total 100.0 100.0 100.0
N 272 272 544
One of the major reasons of
having few poor members in their COs (18 percent men and 31
percent women) is that the poor do
not meet the condition of savings.
Figure 3-1: Holding Officers in the Past by COs
More than 90 percent MCOs
as well as WCOs regarded consultation as essential and
important.
Org
anis
atio
nal
Mo
tiva
tio
n21
Inst
itu
tio
na
l Ass
essm
ent
Su
rvey
of
Co
mm
un
ity
Org
an
isa
tio
ns
(CO
s) F
ost
ered
by
Ru
ral
Su
pp
ort
Pro
gra
mm
es (
RS
Ps)
in
Pa
kis
tan
Score
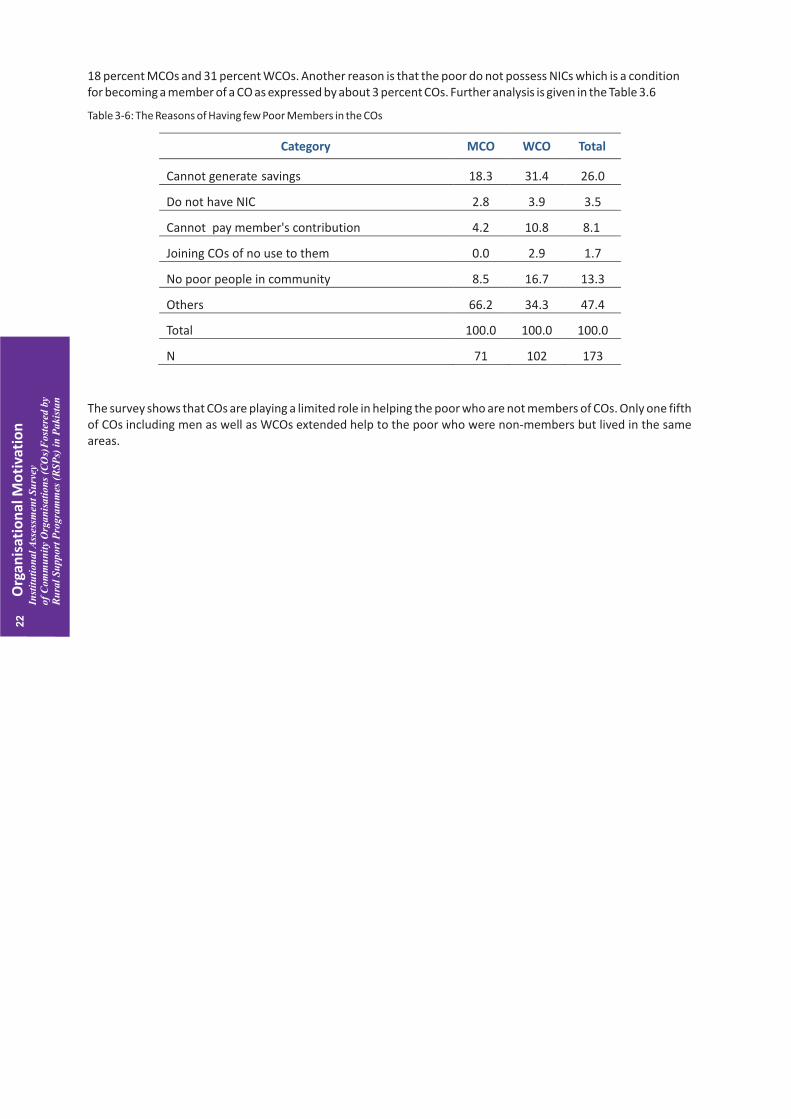
18 percent MCOs and 31 percent WCOs. Another reason is that the poor do not possess NICs which is a condition for becoming a member of a CO as expressed by about 3 percent COs. Further analysis is given in the Table 3.6
Table 3-6: The Reasons of Having few Poor Members in the COs
The survey shows that COs are playing a limited role in helping the poor who are not members of COs. Only one fifth of COs including men as well as WCOs extended help to the poor who were non-members but lived in the same areas.
Category MCO WCO Total
Cannot generate savings 18.3 31.4 26.0
Do not have NIC 2.8 3.9 3.5
Cannot pay member's contribution 4.2 10.8 8.1
Joining COs of no use to them 0.0 2.9 1.7
No poor people in community 8.5 16.7 13.3
Others 66.2 34.3 47.4
Total 100.0 100.0 100.0
N 71 102 173
22
Org
anis
atio
nal
Mo
tiva
tio
nIn
stit
uti
on
al A
sses
smen
t S
urv
eyo
f C
om
mu
nit
y O
rga
nis
ati
on
s (C
Os)
Fo
ster
ed b
y R
ura
l S
up
po
rt P
rog
ram
mes
(R
SP
s) i
n P
ak
ista
n
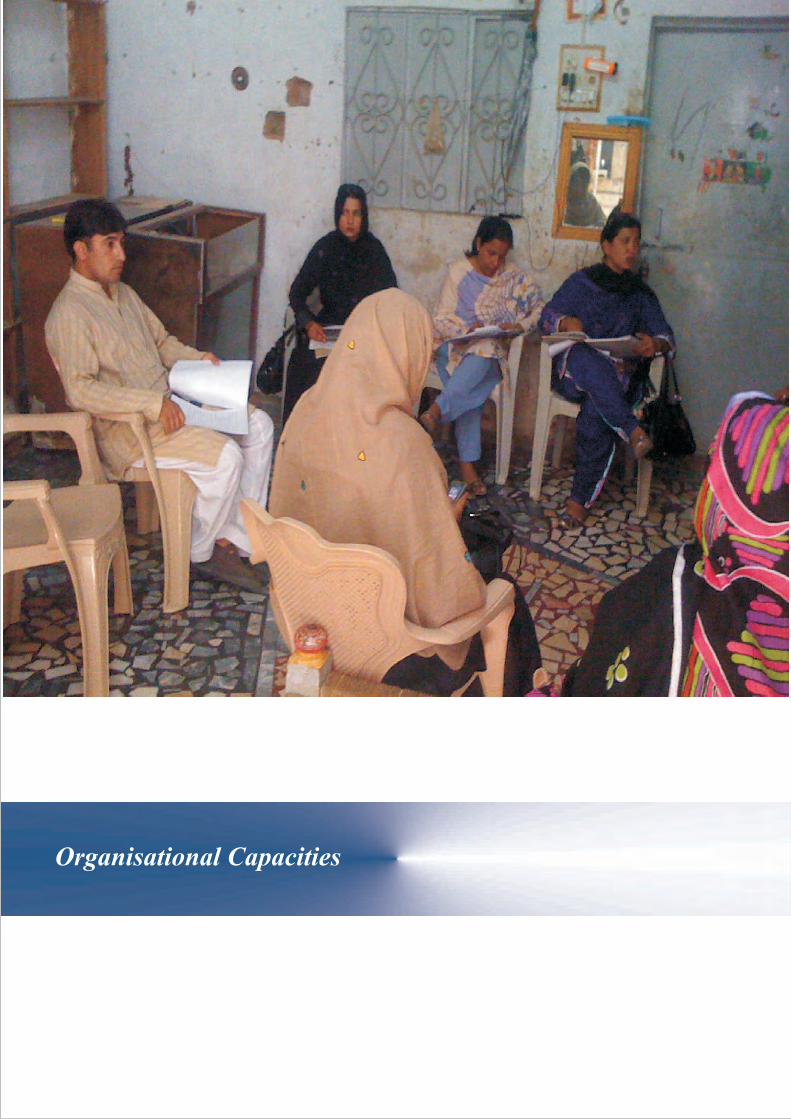
Organisational Capacities

IV Organisational Capacities
4.1.. Record Keeping at CO Level
COs records were reviewed against the list recommended by RSPs. The results were as follows:
- Nearly 90 percent of all COs, men's and women's, were able to show their Karwai and attendance registers, although BRSP, SRSP and GBTI had a fifth or more without them.
- 83 percent of MCOs and 72 percent of WCOs had their savings record, with BRSP, SRSP, GBTI and NRSP below the average.
- Less than half the COs had any other records: bank receipts (30 percent), loan register (25 percent), ledger register (15 percent), or cash book (12 percent). WCOs did better than MCOs, although still at a low level.
The survey enumerator was asked to give an assessment of the quality of the records. Overall, some 60 percent were classified as Good and most of the rest as Fair. On the main records, Karwai, attendance, savings and loan registers, WCOs scored slightly worse. For the other records, they scored better.
Analysis of the dates of last entry in each register gives a slightly different picture. At a minimum, it would be expected that an active CO would have made an entry in its Karwai register during 2010 i.e. in the last 9 months. On that basis, only 75 percent of COs had an up-to-date register, somewhat less in WCOs than in MCOs.
The record keeping instruments facilitated by RSPs required to be maintained at CO level included: Karwai Register, Attendance Register, Savings Register, Cash Book, Ledger Register, Loan Register and Bank Receipts.
An analysis shows that only one fifth COs maintained loan and bank records. Less than 5 percent COs maintained ledger registers while about 6 percent COs maintain cash registers as shown in Fig 4.1.
In terms of the quality of record keeping by COs to be ascertained as good, fair and not good, major parameters included: completeness, presentable, updated, properly signed eligible. An analysis of the quality of record keeping as assessed by remunerators is given in Table 4.1:
Figure 4-1: Record Keeping At CO Level (% of COs)
Karwai register, Attendance register
and Saving registers are the most common documents/instruments
maintained by almost all (90 percent)
COs.
WCOs (20 percent) had their record
properly maintained on specified registers while only 10 percent
MCOs kept and maintained their
records properly.
24
Org
anis
atio
nal
Cap
acit
ies
Inst
itu
tio
na
l Ass
essm
ent
Su
rvey
of
Co
mm
un
ity
Org
an
isa
tio
ns
(CO
s) F
ost
ered
by
Ru
ral
Su
pp
ort
Pro
gra
mm
es (
RS
Ps)
in
Pa
kis
tan
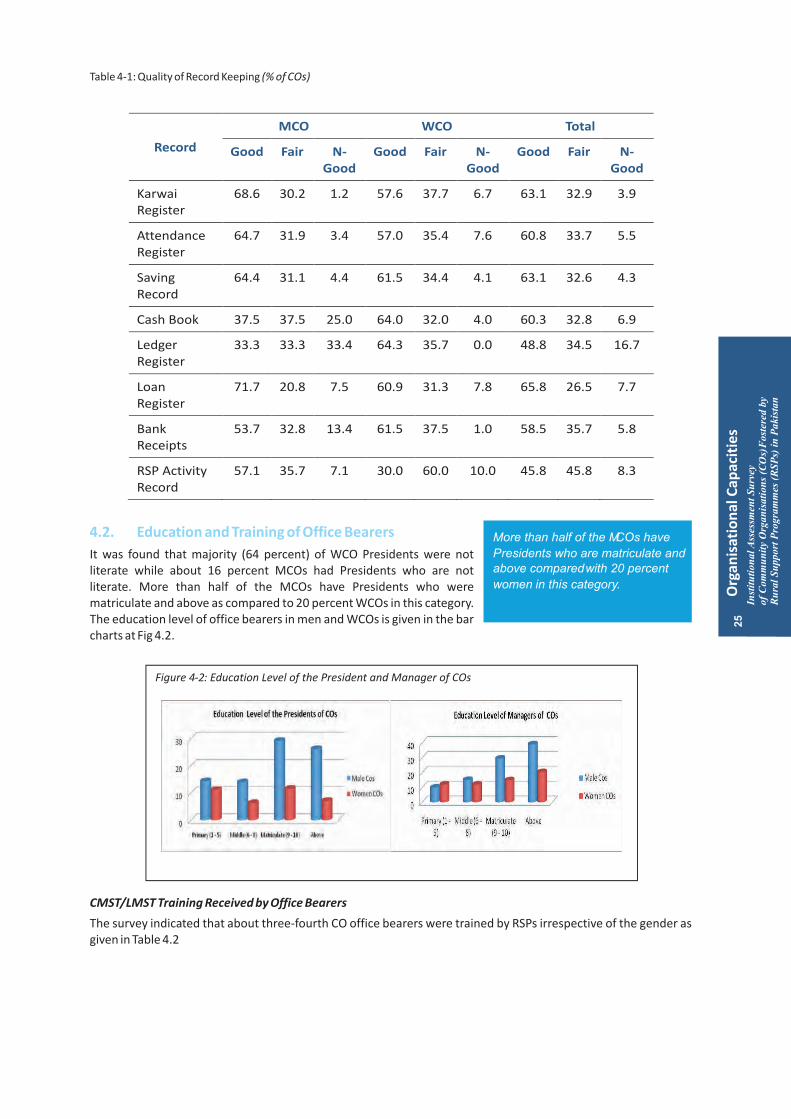
Table 4-1: Quality of Record Keeping
It was found that majority (64 percent) of WCO Presidents were not literate while about 16 percent MCOs had Presidents who are not literate. More than half of the MCOs have Presidents who were matriculate and above as compared to 20 percent WCOs in this category. The education level of office bearers in men and WCOs is given in the bar charts at Fig 4.2.
CMST/LMST Training Received by Office Bearers
The survey indicated that about three-fourth CO office bearers were trained by RSPs irrespective of the gender as given in Table 4.2
(% of COs)
4.2. Education and Training of Office Bearers
Record
MCO WCO Total
Good Fair N-Good
Good Fair N-Good
Good Fair N-Good
Karwai Register
68.6 30.2 1.2 57.6 37.7 6.7 63.1 32.9 3.9
Attendance Register
64.7 31.9 3.4 57.0 35.4 7.6 60.8 33.7 5.5
Saving Record
64.4 31.1 4.4 61.5 34.4 4.1 63.1 32.6 4.3
Cash Book 37.5 37.5 25.0 64.0 32.0 4.0 60.3 32.8 6.9
Ledger Register
33.3 33.3 33.4 64.3 35.7 0.0 48.8 34.5 16.7
Loan Register
71.7 20.8 7.5 60.9 31.3 7.8 65.8 26.5 7.7
Bank Receipts
53.7 32.8 13.4 61.5 37.5 1.0 58.5 35.7 5.8
RSP Activity Record
57.1 35.7 7.1 30.0 60.0 10.0 45.8 45.8 8.3
More than half of the MCOs have
Presidents who are matriculate and above compared with 20 percent
women in this category.
Figure 4-2: Education Level of the President and Manager of COs
25
Org
anis
atio
nal
Cap
acit
ies
Inst
itu
tio
na
l Ass
essm
ent
Su
rvey
of
Co
mm
un
ity
Org
an
isa
tio
ns
(CO
s) F
ost
ered
by
Ru
ral
Su
pp
ort
Pro
gra
mm
es (
RS
Ps)
in
Pa
kis
tan

Table 4-2: CMST/LMST Training Received by Office Bearers
An analysis of the survey showed that RSPs have given substantial importance to train COs in project management tools and techniques. Both the Presidents and Managers of about half the COs received training in community management and project management. Feedback about the usefulness of trainings for members indicated that a large number of COs (47 percent men and 39 percent women) rated training as “Useful”.
An overall analysis of the frequency of trainings shows that 62 percent MCOs and 59 percent WCOs had received trainings “once” only. About one fifth of the COs had received 2 to 3 trainings. The response analysis of the number of trainings received by COs is given in the bar chart
About one tenth of the COs responded that the reasons of not attending trainings were due to expenses involved. Women from about 18 percent COs said that they could not attend training because they were not allowed to do so by their families. Further analysis is given in Table 4.3.
Table 4-3: Why COs Had Few Trained Members: Reasons
(% of COs)
4.3. Capacity Building of COs
CMST/LMST Training
President Manager
MCO WCO Total MCO WCO Total
Yes 70.6 69.5 70.0 72.4 70.6 71.5
No 29.4 30.5 30.0 27.6 29.4 28.5
Total 100.0 100.0 100.0 100.0 100.0 100.0
N 272 272 544 272 272 544
The majority of COs (53 percent men
and 56 percent women) rated the CMST/LMST as “Very Useful” About 62
percent men and 59 percent WCOs had
received training “once” only.
Figure 4-3: Number of Trainings Received by COs
Description MCO WCO Total
Not offered 77.5 67.3 72.5
Did not want to take training 7.0 4.6 5.9
Costly 7.5 10.1 8.8
No permission from men 7.9 17.9 12.8
Total 100.0 100.0 100.0
N 227 217 444
26
Org
anis
atio
nal
Cap
acit
ies
Inst
itu
tio
na
l Ass
essm
ent
Su
rvey
of
Co
mm
un
ity
Org
an
isa
tio
ns
(CO
s) F
ost
ered
by
Ru
ral
Su
pp
ort
Pro
gra
mm
es (
RS
Ps)
in
Pa
kis
tan

About one fifth of the COs expressed their willingness to be provided more opportunities for trainings.
FGD reveals that :
· Trainings should be organised in villages
· Majority of women are not allowed by male family members to attend training at other venues
· Some members were not aware about the training schedules
· Accessibility to training venues and high cost for attending training.
The survey shows that to the extent of discussions, 14 percent COs both men and women discussed women issues but have not done anything about them. About 10 percent WCOs have implemented activities for women as per analysis given in Table 4.4:
Table 4-4: Women Issues What has the CO Done about Women's Issues
In terms of equality, the survey indicates that majority of COs (67 percent men and 51 percent women) treat women on an equitable basis i.e. all women at the same position as that of men.
Responding to a question, the majority of COs (50 percent men and 38 percent women) identified domestic violence issues under which women were treated unfairly. Other ways by which women were treated unfairly as revealed by the survey included: restricted participation in COs activities, male domination, not involved in decision-making processes, not being heard by male members, social/pardah constraints and restrictions on mobility.
A major reason for treating women unfairly was lack of education as identified by a vast majority of COs (64 percent men and 55 percent women) during the survey. Poverty was identified as another reason for unequal treatment of women.
4.4.. What COs H Done About Women Issuesave
A vast majority of COs (65 percent men
and 74 percent women) have not done anything about women issues.
Status of Women Issues MCO WCO Total
0 COs did not do anything about women issues 65.1 73.5 69.3
1 COs discussed women issues but did not do anything 14.3 14.3 14.3
2 COs have implemented activities for women 12.9 9.9 11.4
3 COs are actively lobbying for women s rights in the community 7.7 2.2 5.0
Total 100.0 100.0 100.0
N 272 272 544
“Male domination” was highlighted
by 36 percent WCOs as against just 8 percent MCOs.
27
Org
anis
atio
nal
Cap
acit
ies
Inst
itu
tio
na
l Ass
essm
ent
Su
rvey
of
Co
mm
un
ity
Org
an
isa
tio
ns
(CO
s) F
ost
ered
by
Ru
ral
Su
pp
ort
Pro
gra
mm
es (
RS
Ps)
in
Pa
kis
tan
Score


Organisational Performance
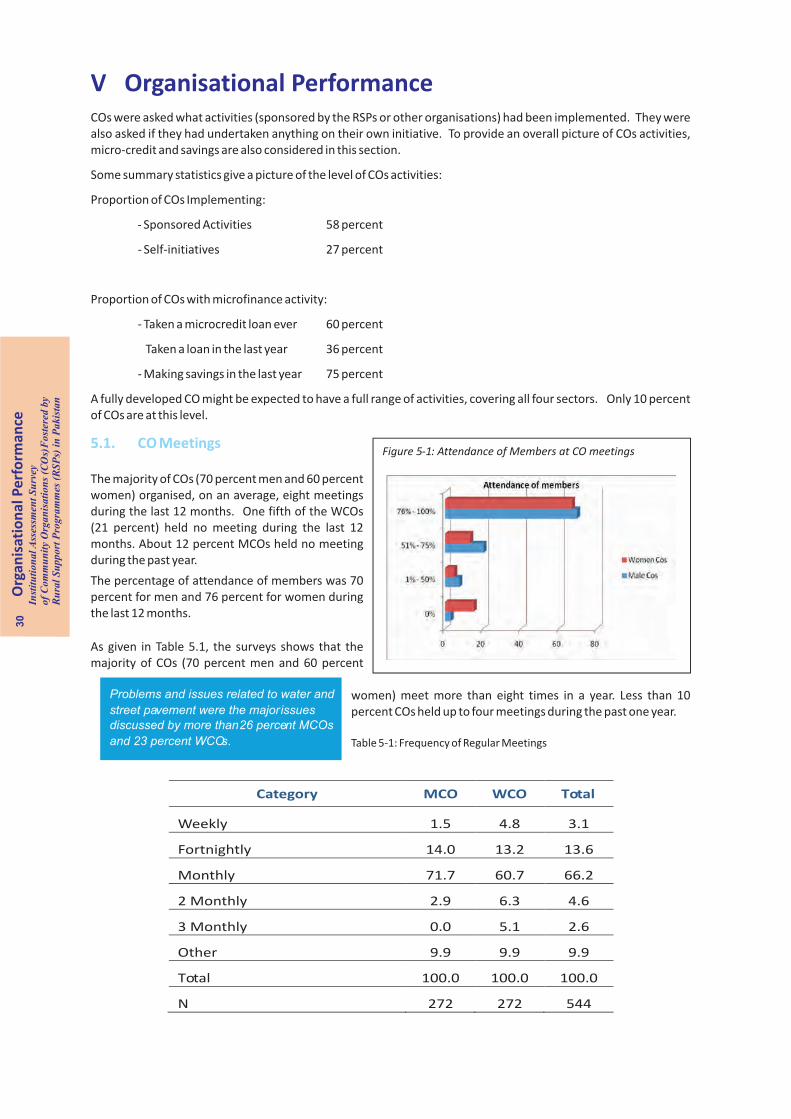
V Organisational Performance COs were asked what activities (sponsored by the RSPs or other organisations) had been implemented. They were also asked if they had undertaken anything on their own initiative. To provide an overall picture of COs activities, micro-credit and savings are also considered in this section.
Some summary statistics give a picture of the level of COs activities:
Proportion of COs Implementing:
- Sponsored Activities 58 percent
- Self-initiatives 27 percent
Proportion of COs with microfinance activity:
- Taken a microcredit loan ever 60 percent
Taken a loan in the last year 36 percent
- Making savings in the last year 75 percent
A fully developed CO might be expected to have a full range of activities, covering all four sectors. Only 10 percent of COs are at this level.
The majority of COs (70 percent men and 60 percent women) organised, on an average, eight meetings during the last 12 months. One fifth of the WCOs (21 percent) held no meeting during the last 12 months. About 12 percent MCOs held no meeting during the past year.
The percentage of attendance of members was 70 percent for men and 76 percent for women during the last 12 months.
As given in Table 5.1, the surveys shows that the majority of COs (70 percent men and 60 percent
women) meet more than eight times in a year. Less than 10 percent COs held up to four meetings during the past one year.
Table 5-1: Frequency of Regular Meetings
5.1. CO MeetingsFigure 5-1: Attendance of Members at CO meetings
Problems and issues related to water and
street pavement were the major issues discussed by more than 26 percent MCOs
and 23 percent WCOs.
Category MCO WCO Total
Weekly 1.5 4.8 3.1
Fortnightly 14.0 13.2 13.6
Monthly 71.7 60.7 66.2
2 Monthly 2.9 6.3 4.6
3 Monthly 0.0 5.1 2.6
Other 9.9 9.9 9.9
Total 100.0 100.0 100.0
N 272 272 544
30
Org
anis
atio
nal
Pe
rfo
rman
ceIn
stit
uti
on
al A
sses
smen
t S
urv
eyo
f C
om
mu
nit
y O
rga
nis
ati
on
s (C
Os)
Fo
ster
ed b
y R
ura
l S
up
po
rt P
rog
ram
mes
(R
SP
s) i
n P
ak
ista
n
The FGD revealed major issues discussed during the past three meetings included, that pavement of roads/streets, construction of safety walls, installation of drainage system, access to drinking water, need for vocational centers, provision of Sui gas facility, microcredit, identification of income generating activities, savings by members and women's issues. The most recent issues discussed during the last few meetings were related to fund-raising for affectees of the recent devastating floods.
The majority of COs (72 percent men and 61 percent women) expressed the need to hold meetings on a monthly basis as per analysis given in Table 5.2.
Table 5-2: How Frequently Does the CO Members Think They Should Meet
One of the major roles of COs is to undertake project activities leading towards socio-economic development of communities. The survey showed 40 percent MCO and 30 percent WCOs had undertaken different types of projects. At the same time, about 17 percent MCO and 42 percent WCOs said that no activities were undertaken by their COs. It was encouraging to see that about one-fifth of COs (21 percent men and 17 percent women) had undertaken project activities though self-initiatives.
The survey showed that majority of the COs (63 percent men and 57 percent women) have been executing micro credit programmes.
Regular saving is a central part of the social mobilisation approach. However, a quarter of COs had not made any savings in the last 12 months. There were significant numbers not saving across all RSPs, but the highest figures were for BRSP and GBTI: 38 percent. Where the CO has made savings in the last 12 months, participation was high: more than 75 percent of the membership. Savings performance is slightly but perceptibly weaker within WCOs. 29 percent of WCOs were not saving, and most of the COs with low participation was women's. When asked to explain why some members were not saving, the most frequent answer given was that they lacked the capacity to save. However, there was a group which said that there was no benefit in saving.
In the last 12 months, most COs, men's and women's, made relatively modest savings, between Rs.1,000 and 2,500 i.e. barely Rs.100 per member. Just 16 percent of COs saved more than Rs.10,000, and 8 percent more than Rs.20,000: equivalent to about Rs.1,000 per member.
An active savings operation involves withdrawals as well as deposits. Only 19 percent of COs recorded any withdrawals in the last 12 months; and almost all of these were by only one or two members. If more then five withdrawals in a year is taken as the indicator, just 6 percent of COs have an active savings operation.
Asked to describe the benefits of saving, over half the COs gave a general response, 'to use at time of need', but the next most common response (10 percent) was 'to help the poor'. Productive purposes, such as the purchase of livestock, and development of the community or the CO itself were also mentioned, but not so frequently. These findings indicate the relative importance of differing motivations for saving. Insurance is by far the most important, but charity comes next and investment and development come last. Internal lending was barely mentioned. As
5.2. Management of Project Activities by C s
5.3. Microcredit Activities of COs
O
An overwhelming majority of COs (76
percent) recommended for COs meetings to be held on a monthly basis.
Category MCO WCO Total
Weekly 4.1 7.6 5.8
Fortnightly 16.0 10.6 13.3
Monthly 75.5 74.5 75.0
2 monthly 2.2 3.4 2.8
3 monthly 1.1 1.9 1.5
Other 1.1 1.9 1.5
Total 100.0 100.0 100.0
N 269 263 532
31
Org
anis
atio
nal
Pe
rfo
rman
ceO
rgan
isat
ion
al P
erf
orm
ance
Inst
itu
tio
na
l Ass
essm
ent
Su
rvey
of
Co
mm
un
ity
Org
an
isa
tio
ns
(CO
s) F
ost
ered
by
Ru
ral
Su
pp
ort
Pro
gra
mm
es (
RS
Ps)
in
Pa
kis
tan

might be expected, insurance purposes were slightly more frequent at WCOs, and development purposes much more frequent at MCOs. Less obviously, the MCOs were also much more likely to give the charitable-purpose response.
Not all COs have been offered micro credit and 40 percent have never taken a loan, slightly more in the case of WCOs. The RSPs where the fewest COs have ever taken credit are BRSP (only 4 percent), AKRSP (13 percent) and SRSP (38 percent). Of the 325 COs which have taken an RSP loan, 132 (41 percent) have dropped out, in the sense that they took no loan in the last 12 months. With the result that only 36 percent of COs can be described as currently active in micro-credit. Even among those RSPs the major credit programmemes, such as NRSP, PRSP and SRSO, has been a significant fall in numbers. However, more than 70 percent of PRSP and SRSO COs are active borrowers. There is no significant difference in the drop out rate between MCOs and WCOs.
Member participation in COs credit varied widely. At the low end of the scale, less than half the members benefitted from the loans at 47 percent of the COs which took a loan in the last 12 months. At the other end, 75 percent of the membership benefitted from credit at 31 percent of COs. Asked if there were members who had stopped taking RSP loans, and why, by far the most frequent answer was that they did not need it. Other reasons included difficulty repaying earlier loans and unavailability of funds from the RSP. There were some members who found RSP loans too small, too expensive or too short a period for the repayment of a loan.
When asked about their general opinion of RSP loans, a majority was positive in all respects. However, 42 percent thought loan sizes were inadequate, and over 30 percent found service charges high and repayment periods too short. The best score was for ease of access, where only 17 percent were dissatisfied.
An analysis of the loan amount availed by COs (Fig 5.2) shows that more than half the COs (55 percent) borrowed a cumulative amount in the range of Rs.100,000 to 500,000. The number of COs borrowing between Rs.1 million to Rs.2 million was 9 percent in case of men and 4 percent in case of WCOs. Only about 3 percent COs had availed loans over Rs.2 million cumulatively.
The average loan per CO was Rs.167,000, slightly more at men's COs, less at women's. This worked out to Rs.17,500 per beneficiary, with little variation between men and women or across RSPs. As a distribution, 12 percent of mainly WCOs received less than Rs. 10,000 per household, and 63 percent got between Rs.10,000 and Rs.20,000. There were only a handful of larger loans, above Rs.30,000 per CO member.
Micro credit programmes have a great success rate in terms of repayment being more than 90 percent worldwide. RSPs are no exception. About 44 percent COs had defaulting members from 6 to 10 as given in Table 5.3 in case of MCOs while WCOs in the same category had no default.
5.3.1 Loan Amount
5.3.2 Rate of Repayment and Defaults
Figure 5-2: Amount of Loan Borrowed by COs from RSPs
About 56 percent COs did not return loan
because of waiver by government while about 22 percent MCO and 25 percent
WCOs did not return loans due to
disasters.
32
Org
anis
atio
nal
Pe
rfo
rman
ceIn
stit
uti
on
al A
sses
smen
t S
urv
eyo
f C
om
mu
nit
y O
rga
nis
ati
on
s (C
Os)
Fo
ster
ed b
y R
ura
l S
up
po
rt P
rog
ram
mes
(R
SP
s) i
n P
ak
ista
n

Table 5-3: Number of CO Members in Default
Default among WCOs was lower compared to MCOs. The default amount exceeded Rs 50,000 in MCOs.
Table 5-4: Main Reasons for Defaults
A major reason for default observed in the survey as given in Table 5.4 was man-made and natural disasters including conflicts and floods. About 22 percent MCOs and 25 percent WCOs did not return loans due to natural disasters. Migration was another reason for default which affected 11 percent MCOs while no default was observed in case of WCOs due to migration.
Out of 544 COs, 325 have received loans from RSPs including 171 men and 154 WCOs during the last 12 months. Among those that borrowed included 41 percent COs which borrowed loan amounts cumulative up to PRs.100,000 and 42 percent COs borrowed loan amounting between half to one million rupees as given in Fig 5.3. None of the COs received over Rs 2 million during the past year. Only one percent MCOs received loan amount between I and 2 million while just 0.5 percent WCOs received loans between 1 to 2 million rupees.
Out of 544, the number of COs that did not receive loans were 194 including 101 men and 93 WCOs. The majority of COs (72 percent men and 56 percent
5.4. Analysis of Loan Profile Over Past 12 Months
5.4.1 Amount of Loan
# of members MCO WCO Total
1 22.2 0.0 15.4
2 11.1 25.0 15.4
3 - 5. 11.1 50 23.1
6 - 10. 44.4 0 30.8
> 10. 11.1 25 15.3
Total 100.0 100.0 100.0
N 9 4 13
Category MCO WCO Total
Due to inflation cannot payback loan 0.0 25.0 7.7
Due to war & flood they are unable to pay 22.2 25.0 23.1
Govt wave off loan 55.6 0.0 38.5
Due to death of earning members 0.0 25.0 7.7
Migrated from village 11.1 0.0 7.7
Business insolvent 11.1 25.0 15.4
Total 100.0 100.0 100.0
N 9 4 13
About two third MCOs and 46
percent WCOs expressed the repayment period as
“reasonable”.
Figure 5-3: Amount of Loan Borrowed from RSPs during Past One Year
33
Org
anis
atio
nal
Pe
rfo
rman
ceO
rgan
isat
ion
al P
erf
orm
ance
Inst
itu
tio
na
l Ass
essm
ent
Su
rvey
of
Co
mm
un
ity
Org
an
isa
tio
ns
(CO
s) F
ost
ered
by
Ru
ral
Su
pp
ort
Pro
gra
mm
es (
RS
Ps)
in
Pa
kis
tan
(In Pak Rupees)

WCOs) revealed that they did not avail loans because they do not need them. About 7 percent revealed the reason of not availing loans because they do not have the capacity to pay back. Only about 2 percent declined accepting loans due to high interest rate charged by RSPs. About 6 percent COs was of the view that they could not fulfill loan requirements.
The survey revealed that about 47 percent men and 57 percent WCOs considered loan size as appropriate and adequate while 49 percent men and 34 percent WCOs considered the loan size as inadequate to meet their needs.
Access to Loan
The majority of the COs (68 percent men and 64 percent women) revealed that accessing RSP micro credit loan was “ easy” and 18 percent revealed “very easy”. About 14 percent men and 19 percent WCOs considered accessing RSP loans as “difficult”.
Repayment Period of Loans
The period was regarded as “Too Short” by 35 percent WCOs and 26 percent MCOs.
Analysis of savings of members revealed 83 percent men and 75 percent WCOs members save. The larger number of savings by COs both men and women fall in the category range of PRs.1001 to PRs.5000 as shown in Fig 5.4. The response to the question of why the members save showed that the reasons for savings included: to avoid loan burden, to get projects, to help the poor, to pay instal lments, mandatory for COs members, to purchase agricultural inputs.
Still, there were 17 percent men and 25 percent women members of COs who did not save. The reasons for not savings by and large (63 percent men and 69 percent women) was because they do not have the capacity to save. The other reasons for not saving by the members were no benefit (12 percent COs); due to mutual conflict; banks make deductions; non- active status of COs etc.
Number of Saving Members and Amount of Savings
NRSP has the largest number of saving members among SPs. About half of the COs have saving between Rs.1000 to Rs.10,000 after their first year of formation. Only 19 percent men and 14 percent WCOs had savings between Rs.10,000 to Rs.20,000 over their first year of formation. An almost similar pattern of savings behavior existed for the COs who had been saving over the past 12 months.
More than Rs.20,000 cumulative savings was found with 53 percent MCOs and 41 percent WCOs during this survey.
Generally, there was a tendency of non-withdrawal by COs having savings exceeding PRs.1000. Withdrawals by COs having savings of more than PRs.20,000 was negligible.
Withdrawals of Savings and Reasons
About 86 percent MCOs and 72 percent WCOs have withdrawn their savings which had saved just PRs.1000 over the past year. The trend observed in withdrawals during the last year was seen as inversely proportional to the increase of savings amount. Accordingly, the COs holding savings of more than PRs.20,000 were 3 percent for men and 6 percent for WCOs.
5.4.2 Terms of Loan
5.4.3 Savings by COs Members
The survey revealed that 45
percent WCOs and 29 percent MCOs consider service charges on
the higher side.
Figure 5-4: Savings by COs
34
Org
anis
atio
nal
Pe
rfo
rman
ceIn
stit
uti
on
al A
sses
smen
t S
urv
eyo
f C
om
mu
nit
y O
rga
nis
ati
on
s (C
Os)
Fo
ster
ed b
y R
ura
l S
up
po
rt P
rog
ram
mes
(R
SP
s) i
n P
ak
ista
n
Reasons of Withdrawals
The major reasons of withdrawals of savings by COs were domestic problems. About one fourth of men as well as WCOs have withdrawn their savings due to domestic problems. Marriage was another major reason for withdrawal particularly by women. About 12 percent had given loans to their friends which was the third major reason for withdrawals of savings observed in 17 percent men and 12 percent WCOs. The utility of savings was widely realized as was evident from the analysis that the withdrawals due to “no benefit of savings” was less than 2 percent for both men and WCOs .
Linkages and networking play an important role in resource mobilization leading towards socio economic development of the communities. COs are the catalyst in harvesting enormous benefits as a result of networking with government agencies particularly line departments, national and international NGOs and other relevant developmental agencies.
Developing formal links with other COs leading towards formation of VDO at village level is important. Feedback analysis of the survey showed that there existed limited progress in this regard. Only 4 percent men and 11 percent WCOs had discussed this issue in their meetings.
Majority of COs (61 percent MCOs and 43 percent WCOs) consider membership with VDO or LSO as essential. Only a fraction of COs (less than one percent men and 4 percent women) consider such linkages as “Not useful” against 31 percent men and 26 percent WCOs who considered this linkage as “very useful”. Another important aspect was the expectation of the members regarding networking. Among a number of possible benefits, a large number of COs (45 percent men and 21 percent women) said that networking provides an effective opportunity to undertake joint efforts to solve problems related to development of the area. Networking also provides an opportunity to share and create awareness and necessary support for new projects.
COs are grass root organisations comprising of local people. Their interactive role and consultative process are great strengths to resolve their mutual problems. Bilateral problems and issues may also be resolved in the COs forums by mutual discussions and consideration be made for possible solution and resolutions. The Presidents and Managers can lead this process independently and fairly bestowing trust and confidence demonstrating impartial treatments for all members on an equitable basis. The response analysis of a question of listing any three issues related to conflict resolution at COs level, showed that even murder cases were discussed for resolution at these meetings highlighting the importance of their role in conflict resolution.
A very important realization was seen from the analysis of responses that the COs members and their leaders should resolve internal conflicts as expressed by a vast majority of COs (81 percent men and 76 percent women). Less than 10 percent COs expressed an opinion to take their internal conflicts to external agencies or organisations for resolution. The COs members (11 percent men and 27 percent women) expressed their confidence in resolving their problems themselves.
5.5. Linkages and Networking
5.6. Role of COs in Conflict Resolutions and Women Issues
Inter COs coordination is weak
among COs. The survey shows that about 35 percent men and 54
percent WCOs had no contact with
any other COs.
About half of MCOs and 25 percent
WCOs highlighted that land disputes are the major conflicts in rural communities.
Conflicts related to roads, loans and
families problems were also resolved in
COs meetings.
35
Org
anis
atio
nal
Pe
rfo
rman
ceO
rgan
isat
ion
al P
erf
orm
ance
Inst
itu
tio
na
l Ass
essm
ent
Su
rvey
of
Co
mm
un
ity
Org
an
isa
tio
ns
(CO
s) F
ost
ered
by
Ru
ral
Su
pp
ort
Pro
gra
mm
es (
RS
Ps)
in
Pa
kis
tan


External Factors

VI External Factors
6.1. Participation of COs in the Survey
6.2. Profile of President and Managers of COs
IASCO covered 272 MCOs and 272 WCOs (MCO/WCO): 68 from each of eight RSPs. The sample includes districts from Azad Jammu Kashmir and Gilgit Baltistan, as well as the four main provinces of Pakistan. Data was collected using a detailed questionnaire, which was completed in discussion with a focus group of COs members, and cross-checked wherever possible against the COs written records.
An equal number of COs from each of the eight RSPs was included in the survey. This ensured unbiased analysis of parameters applied uniformly thus avoiding possible disparity. Similarly, the same number of men and women COs (272 each) as mentioned above had maintained gender equality.
NRSP had the largest outreach and geographic coverage nationwide. More than half the COs was formed by NRSP followed by PRSP being 19 percent. A breakup analysis is given in the following table.
Table 6-1: Province and Area wise distribution of COs (2000-2008)-Sampling Frame
About 90 percent (11,884) members who were respondents in this survey were resident of the same village of the respective CO.
In the governance structure at the CO level, two positions of the President and the Manager were prominent and common in all RSPs. Their roles have been defined by respective RSPs field offices. Usually, these positions are voluntary and unpaid. The office bearers of these positions are selected or elected by the members of the
Figure 6-1: Geographic Coverage of COs included in
Assessment Survey 2010
Name of RSP
Provinces
Total Percent AJK Baluchistan Gilgit-
Baltistan KPK Punjab Sindh
AKRSP 0 0 528 91 0 0 619 0.6
BRSP 0 2927 0 0 0 0 2927 2.7
GBTI 0 0 0 817 1091 0 1908 1.7
NRSP 4390 1135 0 4666 48087 6198 64476 59.1
PRSP 0 0 0 0 20852 0 20852 19.1
SRSO 0 0 0 0 0 4421 4421 4.1
SRSP 0 0 0 6219 0 0 6219 5.7
TRDP 0 0 0 0 0 7700 7700 7.1
Total 4390 4062 528 11793 70030 18319 109122 100.0
Percent 4.0 3.7 0.5 10.8 64.2 16.8 100.0
38
Exte
rnal
Fac
tors
Inst
itu
tio
na
l Ass
essm
ent
Su
rvey
of
Co
mm
un
ity
Org
an
isa
tio
ns
(CO
s) F
ost
ered
by
Ru
ral
Su
pp
ort
Pro
gra
mm
es (
RS
Ps)
in
Pa
kis
tan

Figure 6-2: Age Group of Managers of COs
respective COs. RSPs play a facilitating role in the election or selection process. The profile of a President and a Manager plays a vital role in achievements and overall performance of the respective COs.
The following sums up the characteristics of the two office bearers at each CO:
- Presidents are usually older (59 percent between 36 and 60) than Managers (44 percent between 26 and 35), but few are over 60 and some are less than 25. WCO office holders are generally younger, with 12 percent of Presidents and a fifth of Managers under 25.
- 55 percent of MCO Presidents and 68 percent of MCO Managers have matriculate level education or above. This is in strong contrast with WCOs, where 64 percent of Presidents and 40 percent of Managers have no education. Generally, Managers are likely to be better educated than Presidents and younger.
- Some 40 percent of MCO Presidents and Managers are 'farmers'. of the remaining members are traders (16 percent), teachers (10 percent) and government officials (8 percent). Unsurprisingly, 82 percent of WCO Presidents and 73 percent of Managers are homemakers.
- 99 percent of MCOs office holders live in the village. For WCOs, over 20 percent live 'nearby'. Large numbers live outside the village in two RSPs: SRSP and GBTI. This may reflect the difficulty of working with
WCOs in these districts; but it does raise questions about the possibility of real institutional impact. - A number of COs office bearers hold other public positions. 17 of 544 Presidents hold positions with an
LSO. There were also two Chairmen of Zakat, six Sardars and three Imams. A relatively large group were unpaid 'social workers': 46 were Presidents. It was not clear what this term means. The mix of Managers is very similar, including once again 47 'social workers'.
- 70 percent of office bearers have been given the RSP's CMST training.
As generations change, it is possible that younger office bearers are more likely to have higher levels of education, and less likely to follow the traditional occupations of farming for men, and housework for women. Both these changes might affect the institutional capacities of a CO. Statistical analysis supports the first idea. Presidents and Managers less than 40 years old are more likely to be matriculate, for both MCOs and WCOs. However, age does not appear to affect the office bearer's occupation: farming and housework are the dominant categories across all age groups.
The survey indicates that 61 percent men and 57 percent WCOs have Presidents in the age group between 36 and 60 years. The survey also indicates that about the same proportion of 44 percent COs in men as well as in women have Managers who fall in the age group between 26 to 35 years followed by 38 percent falling in the age group of 36 to 60 years.
Unfortunately the questionnaire did not distinguish landlords from those farming their own land, sharecroppers and tenants.
6.2.1. Age Groups of Office Bearers
Survey indicates that 61 percent
MCOs and 57 percent WCOs have Presidents and Managers who are in
the age group between 36 and 60
years.
22
39
Exte
rnal
Fac
tors
Inst
itu
tio
na
l Ass
essm
ent
Su
rvey
of
Co
mm
un
ity
Org
an
isa
tio
ns
(CO
s) F
ost
ered
by
Ru
ral
Su
pp
ort
Pro
gra
mm
es (
RS
Ps)
in
Pa
kis
tan
22
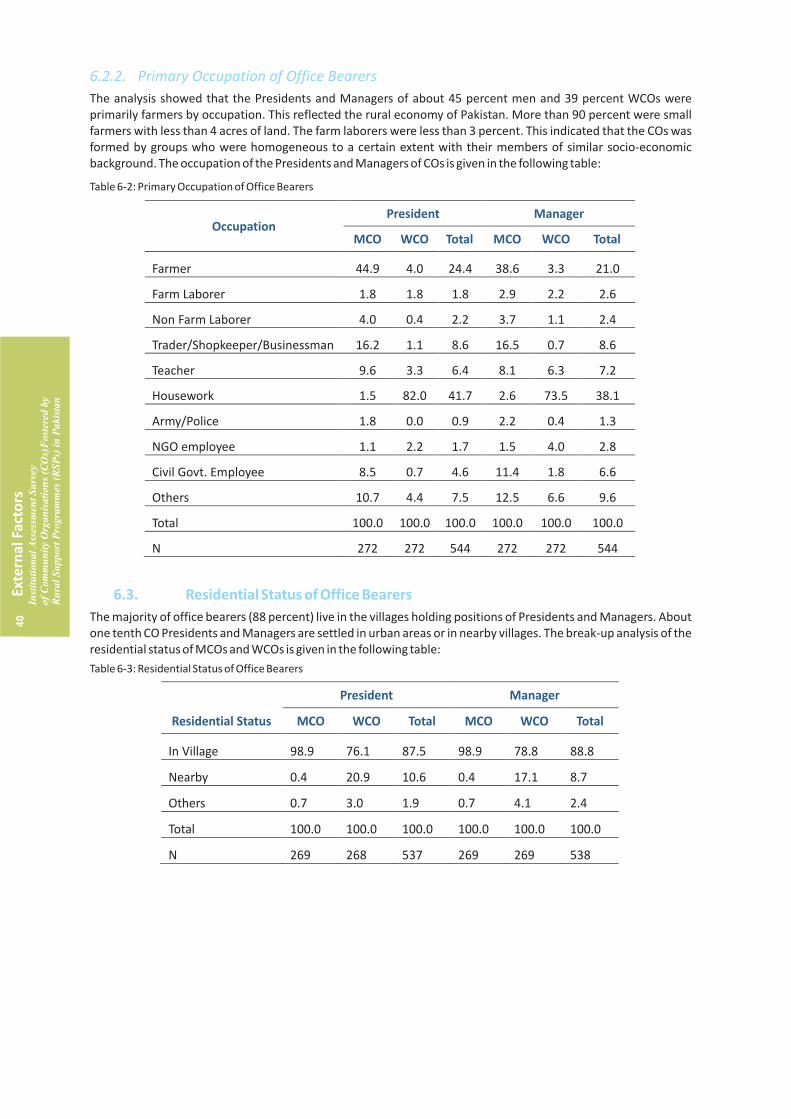
6.2.2. Primary Occupation of Office Bearers
6.3. Residential Status of Office Bearers
The analysis showed that the Presidents and Managers of about 45 percent men and 39 percent WCOs were primarily farmers by occupation. This reflected the rural economy of Pakistan. More than 90 percent were small farmers with less than 4 acres of land. The farm laborers were less than 3 percent. This indicated that the COs was formed by groups who were homogeneous to a certain extent with their members of similar socio-economic background. The occupation of the Presidents and Managers of COs is given in the following table:
Table 6-2: Primary Occupation of Office Bearers
The majority of office bearers (88 percent) live in the villages holding positions of Presidents and Managers. About one tenth CO Presidents and Managers are settled in urban areas or in nearby villages. The break-up analysis of the residential status of MCOs and WCOs is given in the following table:
Table 6-3: Residential Status of Office Bearers
Occupation President Manager
MCO WCO Total MCO WCO Total
Farmer 44.9 4.0 24.4 38.6 3.3 21.0
Farm Laborer 1.8 1.8 1.8 2.9 2.2 2.6
Non Farm Laborer 4.0 0.4 2.2 3.7 1.1 2.4
Trader/Shopkeeper/Businessman 16.2 1.1 8.6 16.5 0.7 8.6
Teacher 9.6 3.3 6.4 8.1 6.3 7.2
Housework 1.5 82.0 41.7 2.6 73.5 38.1
Army/Police 1.8 0.0 0.9 2.2 0.4 1.3
NGO employee 1.1 2.2 1.7 1.5 4.0 2.8
Civil Govt. Employee 8.5 0.7 4.6 11.4 1.8 6.6
Others 10.7 4.4 7.5 12.5 6.6 9.6
Total 100.0 100.0 100.0 100.0 100.0 100.0
N 272 272 544 272 272 544
Residential Status
President Manager
MCO WCO Total MCO WCO Total
In Village 98.9 76.1 87.5 98.9 78.8 88.8
Nearby 0.4 20.9 10.6 0.4 17.1 8.7
Others 0.7 3.0 1.9 0.7 4.1 2.4
Total 100.0 100.0 100.0 100.0 100.0 100.0
N 269 268 537 269 269 538
40
Exte
rnal
Fac
tors
Inst
itu
tio
na
l Ass
essm
ent
Su
rvey
of
Co
mm
un
ity
Org
an
isa
tio
ns
(CO
s) F
ost
ered
by
Ru
ral
Su
pp
ort
Pro
gra
mm
es (
RS
Ps)
in
Pa
kis
tan
6.4. Interactions among COs and RSPs
Interactions envisaging dialogue with communities through COs and their respective RSPs play an important role in the development process. It enables mutual understanding, confidence building and encourages joint efforts in resolving issues and operational problems. In order to assess interactions, a question was asked about the number of visits by RSPs to COs and vice versa. The response analysis showed that in about one third COs (33 percent men and 28 percent women), social organizers never visited during the past one year. In about one fifth COs (18 percent men and 20 percent women), SOs visited between 6 to 10 times during the year while some COs were visited by respective SOs more than 10 times in the past 12 months.
Member from more than 58 percent men and about 71 percent WCOs visited respective RSPs' officers during the past year.
Feedback analysis on RSP support shows that about half the COs (53 percent men and 47 percent women) expressed RSPs support as “Satisfactory” and more than a quarter of COs viewed RSPs support as “Very Satisfactory”. Still, there were about 18 percent COs who pointed out that the RSPs support was “Inadequate”.
In about one third COs (33
percent MCOs and 28 percent WCO), social organizers never
visited during the past one year.
About half the COs (53 percent
MCOs and 47 percent WCOs) expressed RSP’s support as
“Satisfactory” and more than
quarter of COs stated RSPs
support as “ Very Satisfactory”.
41
Exte
rnal
Fac
tors
Inst
itu
tio
na
l Ass
essm
ent
Su
rvey
of
Co
mm
un
ity
Org
an
isa
tio
ns
(CO
s) F
ost
ered
by
Ru
ral
Su
pp
ort
Pro
gra
mm
es (
RS
Ps)
in
Pa
kis
tan


Comparative Analysis among RSPs

VII Comparative Analysis among RSPsFindings of the comparative analysis of COs (Tables given as Annex III) formed by 8 RSPs included in this survey are summarized below:
1) The survey revealed that more than 85 percent of COs each from SRSO and TRDP has mission statements and goals written down and managers were fully aware about them. About half of the COs from AKRSP, NRSP,PRSP and GBTI had diverse opinions about the objectives, mission statements and goals and these were not written down.
2) Analysis to a question on need identification and planning revealed that about 90 percent of COs from
SRSO and TRDP prepared annual development plans and submitted more than one resolution in the last three
years. PRSP (54 percent of COs) and NRSP (38 percent of COs) had identified needs and submitted at least 1
resolution to their respective RSPs in the last three years.
3) The survey revealed that the majority (80 to 90 percent) of COs formed by PRSP and SRSO discussed
resolutions in COs meetings and all members signed the resolutions. Less than 50 percent members signed
resolutions by 15 percent COs formed by NRSP.
4) Networking of AKRSP and NRSP was found to be the best among the RSPs. About half of the COs (55 and
46 percent of COs) of these two RSPs were members of respective networks. More than three fourth COs of BRSP
and PRSP had no contacts with other COs.
5) About 65 percent COs of all the RSPs held more than 8 meetings in the last 12 months. However, the same
frequency of meetings held in the same period were more than 90 percent of COs formed by PRSP, SRSO and TRDP.
No meetings were held in BRSP (41 percent COs) and GBTI (32 percent COs) during the same period;
6) SRSO (96 percent COs) and TRDP (90 percent COs) had between 75 to 100 percent attendance on an
average during the past 3 meetings;
7) The election/selection of office bearers of COs were conducted on an annual basis by 44 percent and 24
percent of COs of NRSP and SRSO respectively. The survey revealed that in less than 4 percent of COs, office
bearers were appointed by the field staff of NRSP, SRSP, BRSP, TRDP and GBTI. In none of the COs of AKRSP and
SRSO were Presidents and Managers appointed by the field staff of the RSPs.
8) GBTI (19 percent COs), BRSP (15 percent COs) and SRSP (13 percent COs) took most of the decisions by
themselves and rarely consulted members. More than 90 percent of COs of TRDP, SRSO and PRSP consulted their
members and reported regularly about all COs accounts and activities.
9) Resolving internal conflict was a missing function prevailing equally in almost all RSPs. More than 80
percent COs among all the RSPs did not deal with or resolve any internal conflicts in the last three years. BRSP,
GBTI, SRSP and NRSP were among those RSPs that have played an important role in resolving both internal and
external conflicts. The proportion of their COs was still less than 10 percent each.
10) The survey indicated that more than half the COs of all RSPs had not done anything about women's
issues. NRSP, PRSP and SRSP had implemented activities for women in 18 percent of their COs respectively. SRSP
(12 percent of COs) and GBTI (13 percent of COs) had been lobbying for the rights of women which were
comparatively higher than in the rest of the RSPs.
11) In response to a question of proportion of poor members in COs, it was found that majority of COs (more
than 67 percent) that had more than 50 percent members from poor households in BRSP, TRDP and SRSO while
AKRSP, SRSP and PRSP had less than 25 percent poor members in the proportion of 46, 44 and 35 percent in their
respective COs.
12) A higher number of COs (among RSPs) that had received training in community management by their
Presidents, Managers and some members were SRSP, BRSP and SRSP. However, their percentage of COs were low
being 16,10 and 9 percent respectively.
13) GBTI, SRSP and TRDP had been executing six or more activities related to training in agriculture, forestry,
livestock, poultry, kitchen gardening and vocational skills received by their member from RSPs. These activities
44
Co
mp
arat
ive
An
alys
is a
mo
ng
RSP
sIn
stit
uti
on
al A
sses
smen
t S
urv
eyo
f C
om
mu
nit
y O
rga
nis
ati
on
s (C
Os)
Fo
ster
ed b
y R
ura
l S
up
po
rt P
rog
ram
mes
(R
SP
s) i
n P
ak
ista
n

were operational in 1,612 and 9 percent of COs respectively being the highest among all the RSPs surveyed in this
study.
14) GBTI, TRDP and SRSO had set up comparatively more functional committees among RSPs with 34, 27 and
21 percent of their respective COs. Almost all project activities were functional.
15) In PRSP and SRSO, necessary records/registers were available and updated regularly by 40 percent and 37
percent of their respective COs. Among RSPs, 96 percent COs of AKRSP were maintaining such records followed by
69 percent COs with BRSP.
45
Co
mp
arat
ive
An
alys
is a
mo
ng
RSP
sIn
stit
uti
on
al A
sses
smen
t S
urv
eyo
f C
om
mu
nit
y O
rga
nis
ati
on
s (C
Os)
Fo
ster
ed b
y R
ura
l S
up
po
rt P
rog
ram
mes
(R
SP
s) i
n P
ak
ista
n
During the visit, the following success case studies were documented:
7.1.1. Success Story No. 1:
7.1.2. Success Story No. 2:
CO NASIR KHAN with assistance from PPAF completed a project on irrigation pipeline with boring a well and installing a water pump fixed with engine in a nearby feasible location. The cost of the project was Rs 580,000. The CO members contributed about 38 % of the cost of the project while the rest was born by PPAF. After completion of this project, the members of the COs increased their apple produce by three times. It may be mentioned that this area is fertile and suitable for apple species called KALA KALOO which is a very delicious and of export quality apple. It is high grade apple being very expensive even in the local markets. The members informed that their income was considerably increased with the increased produce because of availability of water due this successful project. They informed that their income from the sale of apples increased from an average income of Rs 40,000 per annum to Rs 120,000 p.a. The members of CO have strong sense of ownership of this irrigation water project. It was interesting that when APEX team visited this CO on 21 August, 2010, the members were busy in repairing the engine by themselves. The team decided to hold meeting for data collection under a nearby tree (more than 100 years old SNOBER Tree) located near their apple gardens. Preservation and promotion of SNOBER trees was another successful initiative of this CO.
Mr Noor Mohammad , a member of CO Khidmat Gar was seen much motivated and enthusiastic. He was eager to invite the APEX team to visit his apple gardens. The team visited his gardens along with the gardens of other CO members. The CO president informed that Mr. Noor Mohammad mobilised the other members by taking initiatives of building a dam through APNI MADAD APP. All the CO members contributed their labour and worked hard and finally they built a big mud dam where plenty of water was seen on the spot. This water was distributed through water channels and pipe lines irrigating their apple gardens. The members after the completion of irrigation project realised tremendous increase in the produce of apple. Their income increased many fold from Rs 80,000 on average to Rs 200,000. Realising the miracle of their initiatives, the members took further steps. On the one hand they explored to increase the source of water with multiple options including repair of abandoned karez, construction of TALAB with APNI MADAD AP and more recently they completed a well with generator and diesel engine (costing investment of over Rs 600,000) which is incurring over 100,000 operational cost per month on maintenance. The members are now economist and know the cost benefit analysis very well. At the same time the member of CO are expanding irrigating areas. Mr Noor Mohammd was so much motivated and seems prosperous by revealing with pride that he earned Rs 1,600,000 this year from his apple gardens. He invited with pleasure all the members of visiting APEX team accompanied with BRSP Social Organiser (Mr Habib) to his apple gardens and gifted the team Kala Kaloo.
46
Co
mp
arat
ive
An
alys
is a
mo
ng
RSP
sIn
stit
uti
on
al A
sses
smen
t S
urv
eyo
f C
om
mu
nit
y O
rga
nis
ati
on
s (C
Os)
Fo
ster
ed b
y R
ura
l S
up
po
rt P
rog
ram
mes
(R
SP
s) i
n P
ak
ista
n

7.1.3. Success Story No. 3:
Another unique achievement was observed in CO Khidmat Gar, Pareza. The members informed that community built a primary school by APNI MADAD AP during the year 1997. The Education Department provided /appointed a teacher (Mr Mohammad Din) who was living about 7 km away from their village. The teacher was irregular and was attending this school only twice a week. The CO took this issue seriously in their meetings. The Education Department did not take any effective action on their complaintThe members realised the loss of education of their children. In one of their CO meeting, they decided to resolve this issue by helping themselves. One of the suggestions was to provide a motorcycle to Mr Mohammad Din, teacher of the school will ensure this attendance This suggestion was accepted by the CO members and materialised. The CO members purchased a motorcycle at a cost of Rs 45,000 and provided it to Mr Mohammad Din. With this facility the objective was achieved. After receiving motorcycle, the teacher is attending the school regularly. The quality of education has improved. The obvious impact seen in the lives of the members of CO Khidmat Gar was that they are now sending all their children exceeding 30 in number to school and those who completed their primary school are now continuing their further education in Khanozai as the members can now afford their educational expenses because their income has now increased and they have realised to visualise the return on social investment in the long run leading towards socio economic development.
47
Co
mp
arat
ive
An
alys
is a
mo
ng
RSP
sIn
stit
uti
on
al A
sses
smen
t S
urv
eyo
f C
om
mu
nit
y O
rga
nis
ati
on
s (C
Os)
Fo
ster
ed b
y R
ura
l S
up
po
rt P
rog
ram
mes
(R
SP
s) i
n P
ak
ista
n

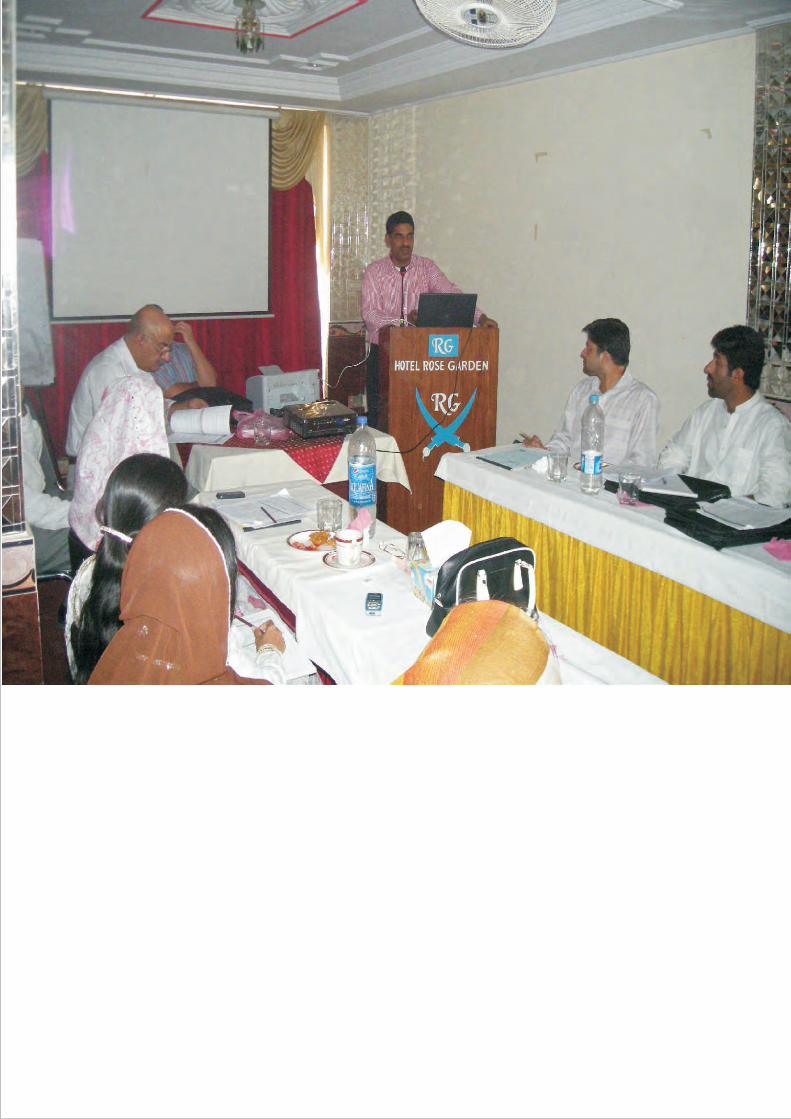
Conclusion and Way Forward
VIII Conclusion and Way ForwardAssessment of COs as an institution is a key task for the RSPs, for the COs themselves, as well as for the higher tier of organisations like VDOs, LSOs and LSONs or potential partners that would need to know the level of development reached by the COs. Thus far except for AKRSP, there is limited quantitative evidence and qualitative testimony available on the COs in terms of operational efficiency and effectiveness across the RSPs.
In order to undertake the survey of COs institutional assessment, APEX Consulting, with its independent status as a third party, was awarded this study on competitive bidding by the RSPN. Accordingly, a comprehensive survey of 544 sample COs was conducted by APEX field teams in September 2010. This report is the outcome of the survey envisaging qualitative and quantitative analysis and inferences drawn that will help facilitate not only the internal hierarchy among COs but will also be useful to RSPs management, donors and relevant policy makers of the country.
The unit of analysis in this study was CO. Therefore, there are 16 analytical domains for men and women COs by 8 RSPs. The survey took a minimum sample of 34 WCOs and 34 MCOs from each RSP (30 is usually considered as a minimum standard for statistical analysis in case of resource constraints for representative sampling). In this way, the total sample size turned out to be 544 COs. Keeping the RSP stratification in mind, all the districts were clustered into 8 RSPs. Given the proportion of the number of districts the team selected a total of 19 districts. The entire assignment, from design to field work to data analysis and report preparation, was carried out from July 26, 2010 to October 31, 2010.
The cumulative number of COs fostered by all RSPs since their inception up to the year 2009 is 145,588 including 32 percent women, 61 percent men and 7 percent mixed COs. With more than one third outreach in 35 districts of Pakistan, NRSP is the largest organisation among the 8 RSPs included in the survey of this study.
Most of the COs constituting three fourth of the 544 COs are 2 to 5 years old and the remaining COs are more than 5 years old. NRSP has the largest outreach and geographic coverage nationwide. More than half the COs (59 percent) were formed by NRSP followed by PRSP being 19 percent. The total number of members of 544 COs included in the survey were 11,996 out of which 7,925 members (66 percent of total) were present who responded to the questions and participated during this survey. The total number of households represented (one member from each household) were 96 percent. The maximum participation of members was seen in SRSP (62 percent), followed by PRSP being (56 percent), where as the attendance was between 11 to 15 members attending meetings during the survey.
Karwai, Attendance and Saving registers were the most common documents/instruments maintained by almost all (90 percent) COs. Analysis shows that only one fifth COs maintain loan and bank record. Less than 5 percent COs maintain ledger registers while about 6 percent COs maintain cash registers.
The majority of COs (70 percent men and 60 percent women) organised and participated in 8 meetings during a year. One fifth of the WCOs (21 percent) and about 12 percent of the MCOs held no meeting during 2009.
93 percent of the members were active while the remaining 7 percent members remained non-active as responded by the COs under study. Two third members were present in the COs' meetings conducted for this assessment. The survey analysis shows that the terms of RSPs office bearers were not fixed. The majority (47 percent) of COs had their men and women Presidents and Managers who held their key positions over 3 to 5 years.
Reflecting upon the literacy rate prevalent in the country, it is found in the survey that majority (64 percent) of WCO Presidents were illiterate while about 16 percent of MCOs had Presidents who were illiterate.
All 544 COs (surveyed in this study) were evaluated taking into account parameters related to COs assessment data, collected through the assessment tool.
8.1. Key Findings
8.1.1. Level and Categories of COs
50
Co
ncl
usi
on
an
d t
he
Way
Fo
rwar
dIn
stit
uti
on
al A
sses
smen
t S
urv
eyo
f C
om
mu
nit
y O
rga
nis
ati
on
s (C
Os)
Fo
ster
ed b
y R
ura
l S
up
po
rt P
rog
ram
mes
(R
SP
s) i
n P
ak
ista
n
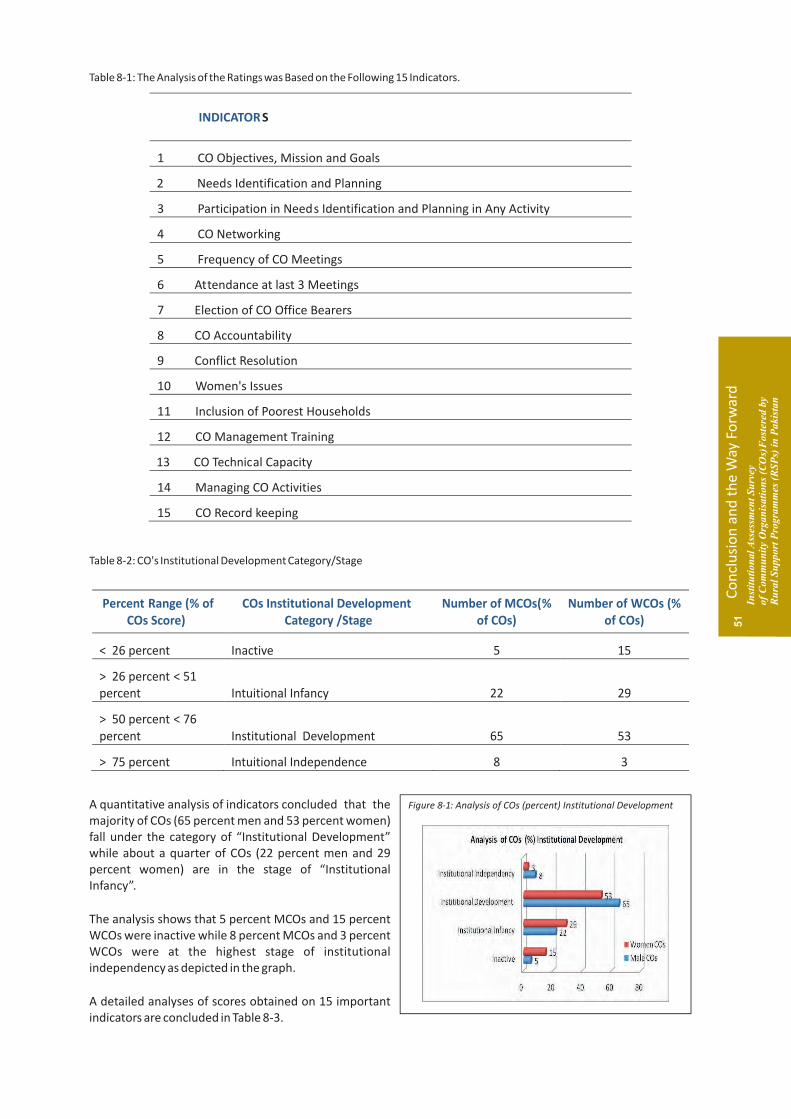
Table 8-1: The Analysis of the Ratings was Based on the Following 15 Indicators.
Table 8-2: CO's Institutional Development Category/Stage
A quantitative analysis of indicators concluded that the majority of COs (65 percent men and 53 percent women) fall under the category of “Institutional Development” while about a quarter of COs (22 percent men and 29 percent women) are in the stage of “Institutional Infancy”.
The analysis shows that 5 percent MCOs and 15 percent WCOs were inactive while 8 percent MCOs and 3 percent WCOs were at the highest stage of institutional independency as depicted in the graph.
A detailed analyses of scores obtained on 15 important indicators are concluded in Table 8-3.
INDICATORS
1 CO Objectives, Mission and Goals
2 Needs Identification and Planning
3 Participation in Needs Identification and Planning in Any Activity
4 CO Networking
5 Frequency of CO Meetings
6 Attendance at last 3 Meetings
7 Election of CO Office Bearers
8 CO Accountability
9 Conflict Resolution
10 Women's Issues
11 Inclusion of Poorest Households
12 CO Management Training
13 CO Technical Capacity
14 Managing CO Activities
15 CO Record keeping
Percent Range (% of COs Score)
COs Institutional Development Category /Stage
Number of MCOs(% of COs)
Number of WCOs (% of COs)
< 26 percent Inactive 5 15
> 26 percent < 51 percent Intuitional Infancy 22 29
> 50 percent < 76 percent Institutional Development 65 53
> 75 percent Intuitional Independence 8 3
Figure 8-1: Analysis of COs (percent) Institutional Development
51
Co
ncl
usi
on
an
d t
he
Way
Fo
rwar
dIn
stit
uti
on
al A
sses
smen
t S
urv
eyo
f C
om
mu
nit
y O
rga
nis
ati
on
s (C
Os)
Fo
ster
ed b
y R
ura
l S
up
po
rt P
rog
ram
mes
(R
SP
s) i
n P
ak
ista
n
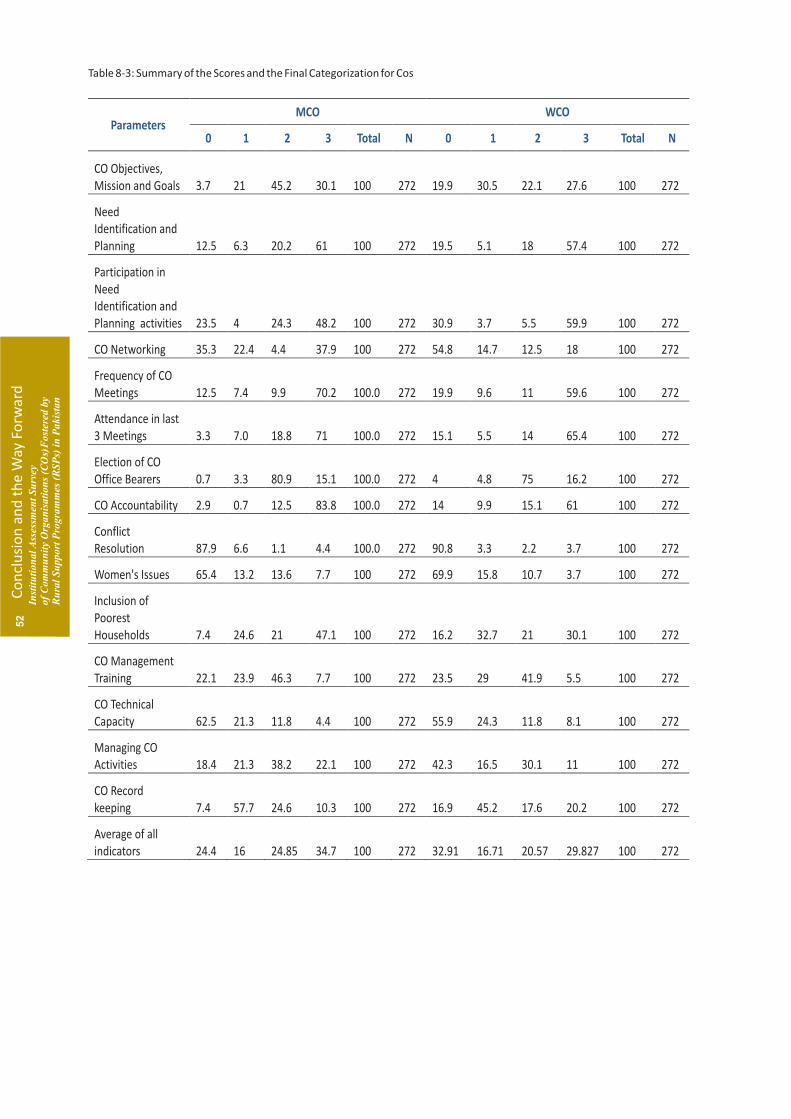
Table 8-3: Summary of the Scores and the Final Categorization for Cos
Parameters MCO WCO
0 1 2 3 Total N 0 1 2 3 Total N
CO Objectives, Mission and Goals 3.7 21 45.2 30.1 100 272 19.9 30.5 22.1 27.6 100 272
Need Identification and Planning 12.5 6.3 20.2 61 100 272 19.5 5.1 18 57.4 100 272
Participation in Need Identification and Planning activities 23.5 4 24.3 48.2 100 272 30.9 3.7 5.5 59.9 100 272
CO Networking 35.3 22.4 4.4 37.9 100 272 54.8 14.7 12.5 18 100 272
Frequency of CO Meetings 12.5 7.4 9.9 70.2 100.0 272 19.9 9.6 11 59.6 100 272
Attendance in last 3 Meetings 3.3 7.0 18.8 71 100.0 272 15.1 5.5 14 65.4 100 272
Election of CO Office Bearers 0.7 3.3 80.9 15.1 100.0 272 4 4.8 75 16.2 100 272
CO Accountability 2.9 0.7 12.5 83.8 100.0 272 14 9.9 15.1 61 100 272
Conflict Resolution 87.9 6.6 1.1 4.4 100.0 272 90.8 3.3 2.2 3.7 100 272
Women's Issues 65.4 13.2 13.6 7.7 100 272 69.9 15.8 10.7 3.7 100 272
Inclusion of Poorest Households 7.4 24.6 21 47.1 100 272 16.2 32.7 21 30.1 100 272
CO Management Training 22.1 23.9 46.3 7.7 100 272 23.5 29 41.9 5.5 100 272
CO Technical Capacity 62.5 21.3 11.8 4.4 100 272 55.9 24.3 11.8 8.1 100 272
Managing CO Activities 18.4 21.3 38.2 22.1 100 272 42.3 16.5 30.1 11 100 272
CO Record keeping 7.4 57.7 24.6 10.3 100 272 16.9 45.2 17.6 20.2 100 272
Average of all indicators 24.4 16 24.85 34.7 100 272 32.91 16.71 20.57 29.827 100 272
52
Co
ncl
usi
on
an
d t
he
Way
Fo
rwar
dIn
stit
uti
on
al A
sses
smen
t S
urv
eyo
f C
om
mu
nit
y O
rga
nis
ati
on
s (C
Os)
Fo
ster
ed b
y R
ura
l S
up
po
rt P
rog
ram
mes
(R
SP
s) i
n P
ak
ista
n
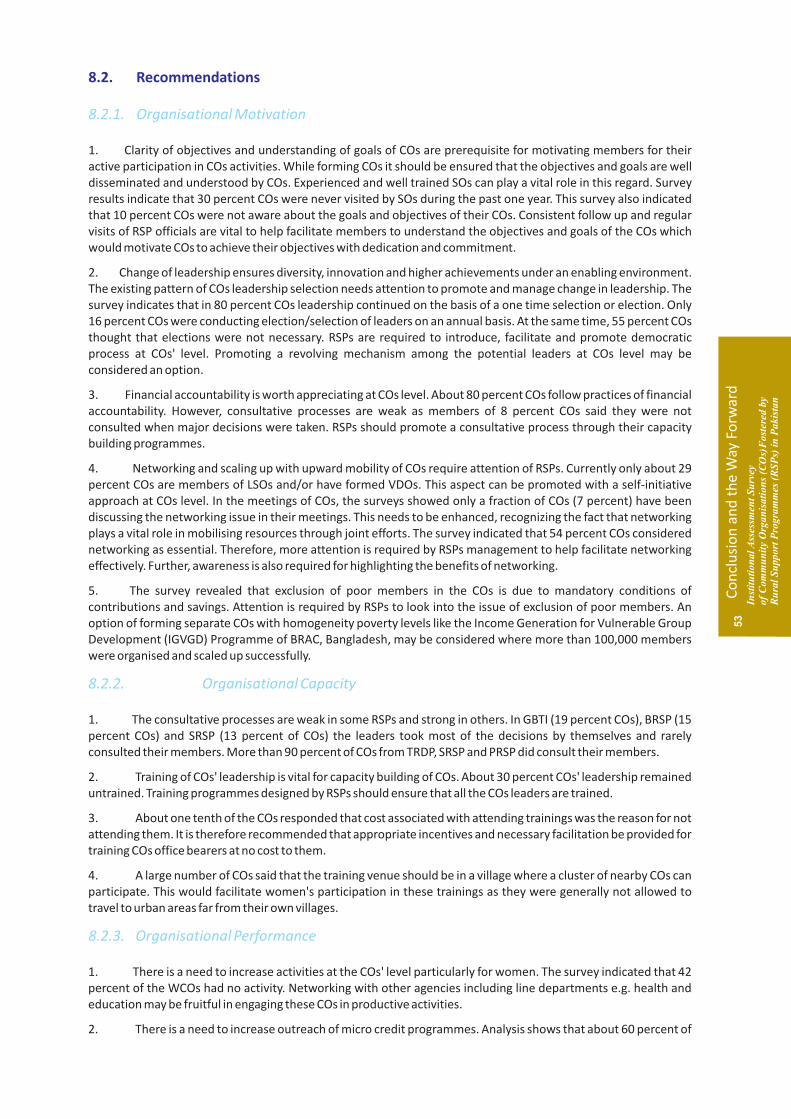
8.2. Recommendations
8.2.1. Organisational Motivation
8.2.2. Organisational Capacity
8.2.3. Organisational Performance
1. Clarity of objectives and understanding of goals of COs are prerequisite for motivating members for their active participation in COs activities. While forming COs it should be ensured that the objectives and goals are well disseminated and understood by COs. Experienced and well trained SOs can play a vital role in this regard. Survey results indicate that 30 percent COs were never visited by SOs during the past one year. This survey also indicated that 10 percent COs were not aware about the goals and objectives of their COs. Consistent follow up and regular visits of RSP officials are vital to help facilitate members to understand the objectives and goals of the COs which would motivate COs to achieve their objectives with dedication and commitment.
2. Change of leadership ensures diversity, innovation and higher achievements under an enabling environment. The existing pattern of COs leadership selection needs attention to promote and manage change in leadership. The survey indicates that in 80 percent COs leadership continued on the basis of a one time selection or election. Only 16 percent COs were conducting election/selection of leaders on an annual basis. At the same time, 55 percent COs thought that elections were not necessary. RSPs are required to introduce, facilitate and promote democratic process at COs' level. Promoting a revolving mechanism among the potential leaders at COs level may be considered an option.
3. Financial accountability is worth appreciating at COs level. About 80 percent COs follow practices of financial accountability. However, consultative processes are weak as members of 8 percent COs said they were not consulted when major decisions were taken. RSPs should promote a consultative process through their capacity building programmes.
4. Networking and scaling up with upward mobility of COs require attention of RSPs. Currently only about 29 percent COs are members of LSOs and/or have formed VDOs. This aspect can be promoted with a self-initiative approach at COs level. In the meetings of COs, the surveys showed only a fraction of COs (7 percent) have been discussing the networking issue in their meetings. This needs to be enhanced, recognizing the fact that networking plays a vital role in mobilising resources through joint efforts. The survey indicated that 54 percent COs considered networking as essential. Therefore, more attention is required by RSPs management to help facilitate networking effectively. Further, awareness is also required for highlighting the benefits of networking.
5. The survey revealed that exclusion of poor members in the COs is due to mandatory conditions of contributions and savings. Attention is required by RSPs to look into the issue of exclusion of poor members. An option of forming separate COs with homogeneity poverty levels like the Income Generation for Vulnerable Group Development (IGVGD) Programme of BRAC, Bangladesh, may be considered where more than 100,000 members were organised and scaled up successfully.
1. The consultative processes are weak in some RSPs and strong in others. In GBTI (19 percent COs), BRSP (15 percent COs) and SRSP (13 percent of COs) the leaders took most of the decisions by themselves and rarely consulted their members. More than 90 percent of COs from TRDP, SRSP and PRSP did consult their members.
2. Training of COs' leadership is vital for capacity building of COs. About 30 percent COs' leadership remained untrained. Training programmes designed by RSPs should ensure that all the COs leaders are trained.
3. About one tenth of the COs responded that cost associated with attending trainings was the reason for not attending them. It is therefore recommended that appropriate incentives and necessary facilitation be provided for training COs office bearers at no cost to them.
4. A large number of COs said that the training venue should be in a village where a cluster of nearby COs can participate. This would facilitate women's participation in these trainings as they were generally not allowed to travel to urban areas far from their own villages.
1. There is a need to increase activities at the COs' level particularly for women. The survey indicated that 42 percent of the WCOs had no activity. Networking with other agencies including line departments e.g. health and education may be fruitful in engaging these COs in productive activities.
2. There is a need to increase outreach of micro credit programmes. Analysis shows that about 60 percent of
53
Co
ncl
usi
on
an
d t
he
Way
Fo
rwar
dIn
stit
uti
on
al A
sses
smen
t S
urv
eyo
f C
om
mu
nit
y O
rga
nis
ati
on
s (C
Os)
Fo
ster
ed b
y R
ura
l S
up
po
rt P
rog
ram
mes
(R
SP
s) i
n P
ak
ista
n
the COs had access to micro credit programmes The remaining 40 percent without credit had expressed need for this facility.
3. About 40 percent of the MCOs had defaulters ranging from 6 to 10 members. Focused group discussions revealed that man-made and natural disasters as well as conflicts had rendered 23 percent borrowers delinquent.
1. The role of RSPs staff was recognised as helpful and supportive by the members as was expressed by 58 percent of the COs. RSPs may devise programmes and projects ensuring COs' participation with enhanced role of SOs.
2. Group dynamics observed in RSPs indicates that about 25 percent COs had included the poorest of the poor as their members.
8.2.4. External Factors
54
Co
ncl
usi
on
an
d t
he
Way
Fo
rwar
dIn
stit
uti
on
al A
sses
smen
t S
urv
eyo
f C
om
mu
nit
y O
rga
nis
ati
on
s (C
Os)
Fo
ster
ed b
y R
ura
l S
up
po
rt P
rog
ram
mes
(R
SP
s) i
n P
ak
ista
n
Annexes


Annex I:
Terms of Reference (TOR)
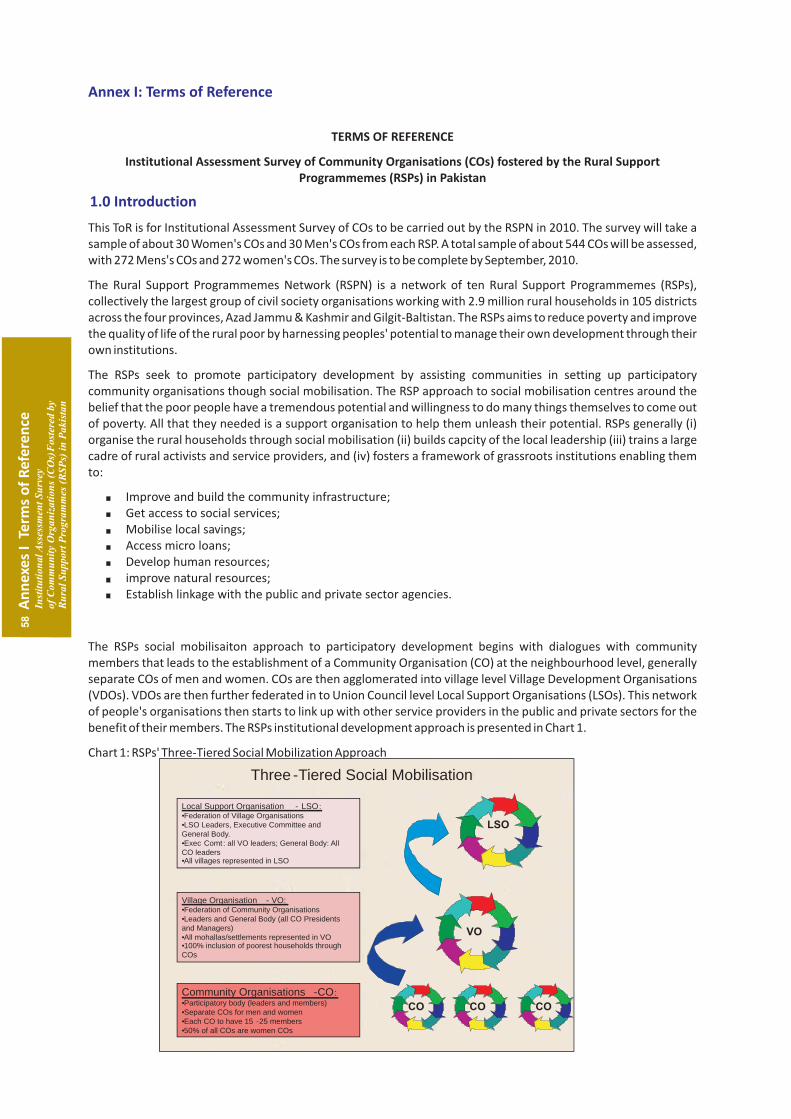
Annex I: Terms of Reference
TERMS OF REFERENCE
Institutional Assessment Survey of Community Organisations (COs) fostered by the Rural Support Programmemes (RSPs) in Pakistan
This ToR is for Institutional Assessment Survey of COs to be carried out by the RSPN in 2010. The survey will take a sample of about 30 Women's COs and 30 Men's COs from each RSP. A total sample of about 544 COs will be assessed, with 272 Mens's COs and 272 women's COs. The survey is to be complete by September, 2010.
The Rural Support Programmemes Network (RSPN) is a network of ten Rural Support Programmemes (RSPs), collectively the largest group of civil society organisations working with 2.9 million rural households in 105 districts across the four provinces, Azad Jammu & Kashmir and Gilgit-Baltistan. The RSPs aims to reduce poverty and improve the quality of life of the rural poor by harnessing peoples' potential to manage their own development through their own institutions.
The RSPs seek to promote participatory development by assisting communities in setting up participatory community organisations though social mobilisation. The RSP approach to social mobilisation centres around the belief that the poor people have a tremendous potential and willingness to do many things themselves to come out of poverty. All that they needed is a support organisation to help them unleash their potential. RSPs generally (i) organise the rural households through social mobilisation (ii) builds capcity of the local leadership (iii) trains a large cadre of rural activists and service providers, and (iv) fosters a framework of grassroots institutions enabling them to:
The RSPs social mobilisaiton approach to participatory development begins with dialogues with community members that leads to the establishment of a Community Organisation (CO) at the neighbourhood level, generally separate COs of men and women. COs are then agglomerated into village level Village Development Organisations (VDOs). VDOs are then further federated in to Union Council level Local Support Organisations (LSOs). This network of people's organisations then starts to link up with other service providers in the public and private sectors for the benefit of their members. The RSPs institutional development approach is presented in Chart 1.
Chart 1: RSPs' Three-Tiered Social Mobilization Approach
Three -Tiered Social Mobilisation
LSO
CO CO
VO
CO
Community Organisations -CO :•Participatory body (leaders and members)•Separate COs for men and women•Each CO to have 15 -25 members•50% of all COs are women COs
Village Organisation - VO:•Federation of Community Organisations•Leaders and General Body (all CO Presidents and Managers)•All mohallas/settlements represented in VO•100% inclusion of poorest households through COs
Local Support Organisation - LSO :•Federation of Village Organisations•LSO Leaders, Executive Committee and General Body. •Exec Comt: all VO leaders; General Body: All CO leaders•All villages represented in LSO
57
Term
s o
f R
efer
ence
1.0 Introduction
Improve and build the community infrastructure;Get access to social services;Mobilise local savings;Access micro loans;Develop human resources;improve natural resources;Establish linkage with the public and private sector agencies.
73
An
nex
es
I: T
erm
s o
f R
efe
ren
ce
Inst
itu
tio
na
l Ass
essm
ent
Su
rvey
of
Co
mm
un
ity
Org
an
iza
tio
ns
(CO
s) F
ost
ered
by
Ru
ral
Su
pp
ort
Pro
gra
mm
es (
RS
Ps)
in
Pa
kis
tan
Ru
ral
Su
pp
ort
Pro
gra
mm
es (
RS
Ps)
in
Pa
kis
tan
o
f C
om
mu
nit
y O
rga
niz
ati
on
s (C
Os)
Fo
ster
ed b
y In
stit
uti
on
al A
sses
smen
t S
urv
ey
58
An
nex
es
I Te
rms
of
Ref
ere
nce

Today, the RSPs supported community organisations are spread across the four provinces, AJK and Gilgit Baltistan. As of December 2009, the RSPs helped the local communities to form 190,398 COs with 2.98 million members in 3,468 union councils of 105 districts. These COs have saved PRs. 2,130 million, built 80,604 community physical infrastructure projects with an investment of PRs. 10.9 billion. The RSPs have given PRs. 51.9 billion as micro-credit to CO members for a variety of productive investments (RSPN Outreach Issue 3, 2009). Similarly the social mobilization approach is now also extended to health care, education, micro-insurance, to promotion of peace building and disaster preparedness and management.
The motive for this rapid expansion of COs by RSPs is manifold (i) a belief in the local actors of change, (ii) informational advantages regarding local needs and improve targeting, (iii) ownership and ability of the community to monitor the outcomes at lower cost, (iv) believe in collective action for managing their own development though grass root institutions of the people, and (v) enable services to be more efficiently delivered to poor communities
Monitoring the development of COs as an institution is therefore a key task for the RSPs and for the COs themselves, as well as for the higher tire of organisations like VDOs LSOs and LSONs or potential partner that would need to know the level of development reached by the COs.
At present except AKRSP, there is limited quantitative evidence available on the COs in terms of performance, functionality, maturity, and participation in benefits across the RSPs. This survey will thus try to collect evidence nationwide, across all RSPs, through a conducting large scale institutional assessment survey from a sample of COs. The survey will be complemented with an in-depth case study that how a sample of COs fit into the context of the larger village unit, for its institutional relevance, and including poverty and gender issues with in the COs. Thus the study would essentially have two parts:
1. A quantitative institutional assessment survey of sample COs and,
2. An in-depth case study on the social dynamic of CO with in larger context of a village.
This document outlines the ToR for the quantitative survey and separate ToRs attached for the case study.
One of the fundamental objective of RSPs social mobilisation effort is to foster COs as capable grassroots organisations, that are functional, transparent, accountable, and broadly representative; in other words, to invest in social capital of the local communities though collective action for a transformational change.
The aim of the survey is to assess how far COs have achieved this objective, however the specific objectives of the survey include:
§ To measure the current development status of COs using institutional development indicators identified in the following section.
§ To diagnose the CO's institutional strengths and weakness and determine the potential areas to be strengthened
§ To gain a better understanding about the 'variability between VOs'
§ To systematically generate baseline information for continuous monitoring of CO' development
§ Periodically collate the information on the CO assessment questionnaires to track changes in the institutional development of COs.
The process of community level Institutional Development (ID) is always complex and take longer time and greater effort to foster viable local grass roots level organisations. Keeping in view the complexity of the ID process, the IAI are developed around the institutional assessment model (See Figure 1). This model is based on four key institutional development aspects with a particular focus on community organisations fostered or supported by RSPs in Pakistan. These four organisational aspects are (i) organisational motivation, (ii) organisational capacity (iii) organisational performance and (iv) external factors possibly influencing the CO development and its performance.
By December 2009, 261 LSOs had also been fostered by RSPs.
2.0 CO Assessment Approach
3.0 Assessing CO Institutional Development
2.1 Objective and Scope of the institutional assessment survey of COs
3.1 Institutional Assessment Indicators (IAI)
23
23
59
An
nex
es
I Te
rms
of
Ref
ere
nce
Inst
itu
tio
na
l Ass
essm
ent
Su
rvey
of
Co
mm
un
ity
Org
an
iza
tio
ns
(CO
s) F
ost
ered
by
Ru
ral
Su
pp
ort
Pro
gra
mm
es (
RS
Ps)
in
Pa
kis
tan

Figure 1: Institutional Assessment Model
The CO assessment survey provides basis to diagnose the CO's strengths and weakness under each organisational development aspect and determine the potential areas to be strengthened. The main dimensions of the CO assessment models is further elaborated in Table 1 and indicators frame is presented in Annex - I.
External Factors influencing the organisational performance
· RSP staff visits· Age of CO · Geographic location of CO· Characteristic of CO leaders
Organisational Motivation
· CO objective, mission and Goals · CO culture in terms of :
s e l e c t i o n o f o f f i c e b e a r e r, participation of households in CO, inclusion of poor households and women issues.
Organisational Performance
Performance of the organisation to achieve the objectives of CO.
· Undertaking of livelihood and capacity building activities · Self initiated projects · Linkages and partnership with organisations other than RSPs· Creation of capital (savings and credits)· Regularity in meetings and record keeping
Organisational Capacity (capacity of the COs leadership and the members in terms of technical skills, knowledge and systems)
· Technical capacity · Systems for maintenance of projects,
CO records and conflict management
· CO Leadership
Ru
ral
Su
pp
ort
Pro
gra
mm
es (
RS
Ps)
in
Pa
kis
tan
o
f C
om
mu
nit
y O
rga
niz
ati
on
s (C
Os)
Fo
ster
ed b
y In
stit
uti
on
al A
sses
smen
t S
urv
ey
60
An
nex
es
I Te
rms
of
Ref
ere
nce

3.2 CO Institutional Assessment Tool (COIAT)
Base on the institutional assessment model presented in Figure 1. A CO Institutional Assessment Tool - matrix of indicators (see annex- I I) has been developed such that under each category and sub-category the researcher had to select one indicator out of a list of four mutually exclusive responses. Efforts will be made to objectively verifiable the selected indicators on the basis of means of verification. The CO Institutional Assessment Tool will be filled in a group meeting with at least 50% of CO members present. Efforts will be made to collect objectively verifiable quantitative and qualitative data. However the response will be recorded in quantitative way.
COs will be scored against each sub-indicator and main indicator, and then an aggregate score generated. Once the total scores have been calculated, these will be converted in to percentages against total possible score. Then COs will be classified according to the distribution of percentage of scores achieved.
Table 1: Components of CO Institutional Development
Organizational Dimension
Focus Variable Indicators
Organizational Motivation
Goal, mission and objectives of the CO as understood by the members. The CO has ownership of the community and systems inplace for need identification, prioritisations. CO has a culture of democratic process in selection of office bearers and ensuring participation of all households in community organization p lanning and implementation of CO activities that the members of the CO own their organization and play their role with commitment and dedication in the long run.
1. Objectives/mission/goal of the CO 2. Procedures for need identification and
planning 3. Participation in the collective analysis
of needs/problems and planning 4. Selection of the CO president and
manager 5. Efforts for CO networking 6. Inclusion of womens issues poorest
households 7. Accountablity of CO president and
manager to the CO members
Organizational Capacity
The organization has the capacity in terms of CO leadership, management, technical expertise, and ability to plan and manage the available resources for solving CO level needs/problems. Furthermore, CO has the mechanisms/systems and pro cedures and ability as well to utilize their capacity and their available resources.
1. CO leaders trained in CO management
2. CO record keeping
3. COs technical capacity (whether the CO has any technical experts in any field?)
4. COs project management (whether CO is in position to implement and maintain any project?)
5. COs conflict management (whether CO has any system to resolve internal conflicts?)
Organizational Performance
Organizational performance demonstrates in terms of undertaking and maintaining development activities, with the support of support organisations and self-help basis.
1. Frequency of the CO meetings (how often the CO meeting is held?) 2. Attendance in the CO meetings (percentage of total membership that attend the
meetings) 3. Undertaking
activities 4. Self-
initiated activities (if the CO took any self-initiatives) 5. CO savings
and utilisation of savings 6. Micro Credit 7. Linkages with Service Providers
61
An
nex
es
I Te
rms
of
Ref
ere
nce
Inst
itu
tio
na
l Ass
essm
ent
Su
rvey
of
Co
mm
un
ity
Org
an
iza
tio
ns
(CO
s) F
ost
ered
by
Ru
ral
Su
pp
ort
Pro
gra
mm
es (
RS
Ps)
in
Pa
kis
tan
A: Top quartile: Excellent category of COs: (institutional independence)
ndB: 2 quartile: Very good category of COs: (institutional development)
rdC: : 3 quartile: Good category of COs: (institutional infancy)
D: Bottom quartile: Poor category of COs: (inactive)
Given the time and budget limitation the survey will use a stratified cluster sampling approach to select the sample COs. The stratification will be done on the bases of Male and Female COs, while clustering will be done on the bases of geographic locations with in the RSPs. The survey will take a sample of minimum of 34 Women CO and 34 Male COs from each of the 8 RSP. In this way the total sample of size turn out to be 544 COs. Detailed sampling strategy is attached in Annex III.
RSPN will provide a list of sample COs to the third party with very basic specifications along with their location (village, Union Council, Tehsil, District and Province), once contract negotiations are concluded.
The survey is being managed by a team of national and international experts. RSPN Specialist Monitoring, Evaluation & Research (MER) is leading the overall effort with the RSPN Rural Economist as the Team Leader. The team is assisted by an M&E Advisor (International), who provides technical inputs on an intermittent basis through HTSPE Consulting. HTSPE is also providing the services of a Statistician to provide short-term inputs into sampling design and methodology for the survey. The RSPN Manager Gender and Development, Specialist Social Mobilisation and other members of the RSPN MER, SM and GAD team provide technical inputs and support at various stages of the survey.
The overall design, management, coordination, monitoring of data collection and entry, and dissemination of results will be carried out by the RSPN MER, GAD and Social mobilisation team with the technical assistance of HTSPE advisers.
The RSPN research team and HTSPE advisers will provide their input on the draft report and RSPN will also arrange peer-review of the report by a reputable international consultant and will then be finalised in the light of his/her feedback. The peer reviewer (international consultant) should also be able to visit Pakistan once to talk to the Steering Committee after h/she reviews the report and gives comments.
A study steering committee comprised of senior staff member of RSPs in addition to COO RSPN, Specialist M&E RSPN, Specialist SM RSPN, and Manager Gender and Development RSPN is formed primarily to oversee the process of evaluation and maintain credibility and neutrality of the Evaluation process. The ToR of the steering committee includes: (i) Approval of ToRs; (ii) Approval of consulting firm for conducting the data collection, entry and report writing; (iii) hold a de-briefing session after draft findings are submitted by the Evaluation Team and discuss comments on the draft; (iv) Hold final meeting to approve the study.
Data collection, data entry, analysis and reporting writing will be outsourced, through a competitive process, to a third party a local organisation with qualified and experienced staff and a proven track record of conducting large surveys. The proposals will be assessed in terms of strategy, knowledge of the subject matter, relevant experience, proposed staff's qualifications and experience, managerial and financial capacities, and references. Detailed scope of work, expected cost and evaluation criteria is outlined in the call for proposals.
3.3 Sampling Design and Sample Size
4.0 Management of the Impact Survey
4.1 Design, Methodology, CO Assessment Framework - by RSPN MER and SM section
4.2 Study Steering Committee
4.3 Data Collection, Entry, Analysis and report writing by Third Party consulting firm
Ru
ral
Su
pp
ort
Pro
gra
mm
es (
RS
Ps)
in
Pa
kis
tan
o
f C
om
mu
nit
y O
rga
niz
ati
on
s (C
Os)
Fo
ster
ed b
y In
stit
uti
on
al A
sses
smen
t S
urv
ey
62
An
nex
es
I Te
rms
of
Ref
ere
nce
Annex II:
Assessment Instrument


Annex II: Assessment Instrument
Rural Support Programmes Network (RSPN)
Serial Number: __|__|__
CO INSTITUTIONAL ASSESSMENT TOOL
Institutional Assessment Survey of Community Organizations (COs) fostered by RSPs in
Pakistan
APEX Consulting PakistanExecutive Business Center, Ground Floor
Saudi Pak Tower, Islamabad -Pakistan.Tel: +92 (051) 280-0397/98 Ext: 3110
65
An
nex
es
II A
sse
ssm
en
t In
stru
me
nt
Inst
itu
tio
na
l Ass
essm
ent
Su
rvey
of
Co
mm
un
ity
Org
an
iza
tio
ns
(CO
s) F
ost
ered
by
Ru
ral
Su
pp
ort
Pro
gra
mm
es (
RS
Ps)
in
Pa
kis
tan

1. CO Identification Data
Q101. CO Name: ____________________________________________________ __|__|__
D D M M Y Y Y Y
Q102.Date of formation: __|__:__|__:__|__|__|__
Q103.CO Type:
(Please circle any one)
MCO...............................................................1
WCO...............................................................2
Q104. Village-based or Hamlet/Mohallah-based:
(Please circle any one)
Village based................................................. .1
Hamlet based...................................................2
Codes
Q105 RSP (Name): ______________________________________________ __|__
Q106. RSP Field Unit (Name): ______________________________________ __|__|__
Q107. Village (Name): ____________________________________________ __|__|__
Q108. UC (Name): _______________________________________________ __|__|__
109. Tehsil /Taluka (Name): ______________________________________________ __|__
Q110. District (Name): ____________________________________________ __|__
Q111. Province (Name): __________________________________________ __|__
112. SMS Ref: __|__|__|__|__|__
D D M M Y Y Y Y
Q113. Assessment Date: __|__:__|__:__|__|__|__
Q114. Number of participants at this review meeting: __ __
Q115. Location where the this review meeting is held (Name): _________________________________
Q116. Name of Enumerator & Code: Name:__________________________________ Code: __ __
Q117. Name of Supervisor & Code: Name:___________________________________ Code: __ __
Q118. Name of Coordinator & Code: Name:__________________________________ Code: __ __
Checked by: __________________________________________
Coded by: ____________________________________________
Entered by: ___________________________________________
Ru
ral
Su
pp
ort
Pro
gra
mm
es (
RS
Ps)
in
Pa
kis
tan
o
f C
om
mu
nit
y O
rga
niz
ati
on
s (C
Os)
Fo
ster
ed b
y In
stit
uti
on
al A
sses
smen
t S
urv
ey
66
An
nex
es
II A
sse
ssm
en
t In
stru
me
nt

2. CO Records
(Complete the table detailing the records which the CO keeps.)
Record Q201. Register Exists
Yes........1
No.........2
N/A........3
Q202. Date of Last Entry
DD/MM/YYYY
Q203. Quality of Record Keeping
Good..........1
Fair.............2
Not Good....3
Q204.
Notes
a. Karwai Register
b. Attendance Record
c. Savings Record
d. Cash Book
e. Ledger Register
f. Loan Register
g. Bank Receipts
h. RSP activity records (Nos.)
Q205. Are there any of these records which CO members think are not necessary?
Yes.................................................1
No..................................................2
Q206. If yes, which ones (write name (s) from above CO records)?
Q207. Reason Why?
__________________________________________
__________________________________________
__________________________________________
__________________________________________
__________________________________________
__________________________________________
__ ____
67
An
nex
es
II A
sse
ssm
en
t In
stru
me
nt
Inst
itu
tio
na
l Ass
essm
ent
Su
rvey
of
Co
mm
un
ity
Org
an
iza
tio
ns
(CO
s) F
ost
ered
by
Ru
ral
Su
pp
ort
Pro
gra
mm
es (
RS
Ps)
in
Pa
kis
tan
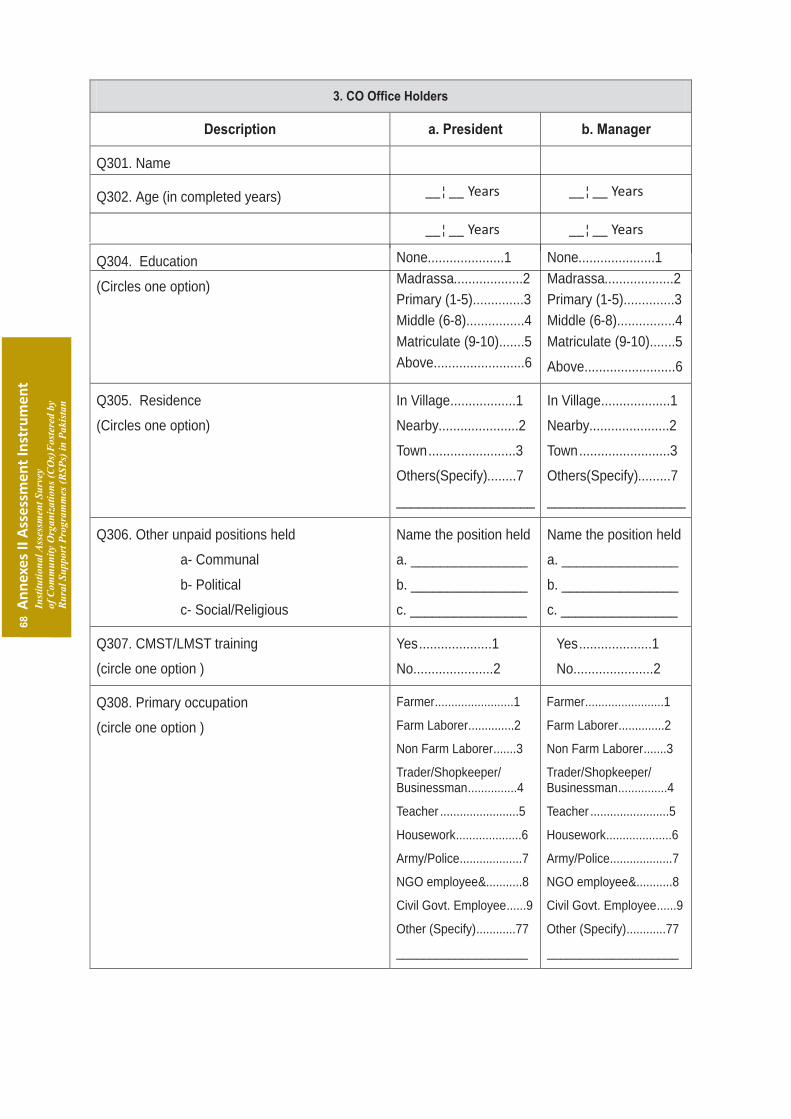
3. CO Office Holders
Description a. President b. Manager
Q301. Name
Q302. Age (in completed years)
Q304. Education
(Circles one option)
None.....................1
Madrassa...................2
Primary (1-5)..............3
Middle (6-8)................4
Matriculate (9-10).......5
Above.........................6
None.....................1
Madrassa...................2
Primary (1-5)..............3
Middle (6-8)................4
Matriculate (9-10).......5
Above.........................6
Q305. Residence
(Circles one option)
In Village..................1
Nearby......................2
Town........................3
Others(Specify)........7
___________________
In Village...................1
Nearby......................2
Town.........................3
Others(Specify).........7
___________________
Q306. Other unpaid positions held
a- Communal
b- Political
c- Social/Religious
Name the position held
a. ________________
b. ________________
c. ________________
Name the position held
a. ________________
b. ________________
c. ________________
Q307. CMST/LMST training
(circle one option )
Yes Yes....................1 ....................1
No......................2 No......................2
Q308. Primary occupation
(circle one option )
Farmer Farmer........................1 ........................1
Farm Laborer Farm Laborer..............2 ..............2
Non Fa Non Farm Laborer rm Laborer.......3 .......3
Trader/Shopkeeper/ Trader/Shopkeeper/ Businessman Businessman...............4 ...............4
Teacher Teacher........................5 ........................5
Housework Housework....................6 ....................6
Army/Police Army/Police...................7 ...................7
NG NGO employee O employee&...........8 &...........8
Civil Govt. Employee Civil Govt. Employee......9 ......9
Other (Specify) Other (Specify)............77 ............77
____________________
____________________
__¦ __ Years
__¦ __ Years __¦ __ Years
__¦ __ Years
Ru
ral
Su
pp
ort
Pro
gra
mm
es (
RS
Ps)
in
Pa
kis
tan
o
f C
om
mu
nit
y O
rga
niz
ati
on
s (C
Os)
Fo
ster
ed b
y In
stit
uti
on
al A
sses
smen
t S
urv
ey
68
An
nex
es
II A
sse
ssm
en
t In
stru
me
nt
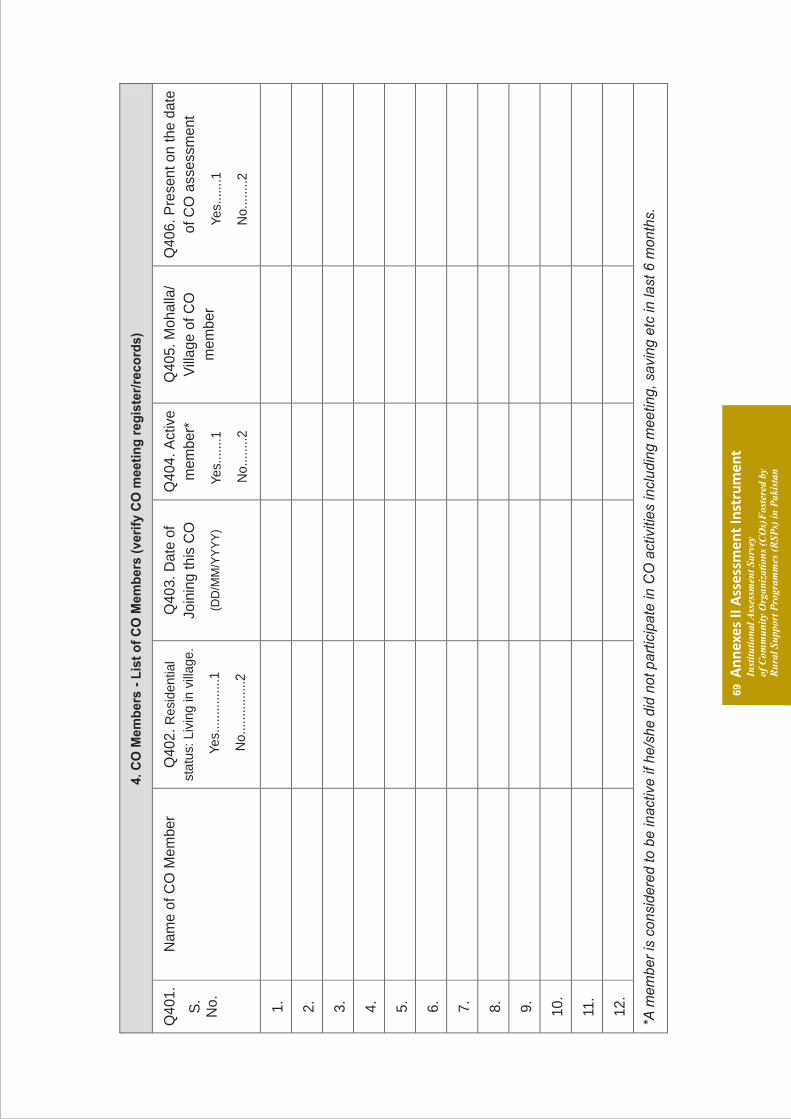
4. C
O M
em
bers
- L
ist
of
CO
Mem
bers
(veri
fy C
O m
eeti
ng
reg
iste
r/re
co
rds)
Q401.
S.
No.
Nam
e o
f C
O M
em
ber
Q402.
Resi
dentia
l
statu
s: L
ivin
g in
vill
age.
Yes.
..............1
No...............2
Q403. D
ate
of
Join
ing this
CO
(DD
/MM
/YY
YY
)
Q404. A
ctiv
e
mem
ber*
Yes.
......1
No........2
Q405. M
ohalla
/
Vill
age
of C
O
mem
ber
Q406. P
rese
nt on the d
ate
of C
O a
ssess
ment
Yes.
......1
No........2
1.
2.
3.
4.
5.
6.
7.
8.
9.
10.
11.
12.
*A m
em
ber
is c
onsi
dere
d to b
e in
act
ive if
he/s
he d
id n
ot part
icip
ate
in C
O a
ctiv
ities
incl
udin
g m
eetin
g, sa
ving e
tc in
last
6 m
onth
s.
69
An
nex
es
II A
sse
ssm
en
t In
stru
me
nt
Inst
itu
tio
na
l Ass
essm
ent
Su
rvey
of
Co
mm
un
ity
Org
an
iza
tio
ns
(CO
s) F
ost
ered
by
Ru
ral
Su
pp
ort
Pro
gra
mm
es (
RS
Ps)
in
Pa
kis
tan

Q401.
S. N
o.
Nam
e o
f C
O M
em
ber
Q402. R
esi
dentia
l
statu
s: L
ivin
g in
vill
age.
Yes.
.........1
No..........2
Q403. D
ate
of Jo
inin
g
this
CO
(DD
/MM
/YY
YY
)
Q404. A
ctiv
e
mem
ber*
Yes.
.....1
No.......2
Q405. M
ohalla
/ V
illage o
f
CO
mem
ber
Q406. P
rese
nt on the d
ate
of C
O a
ssess
ment
Yes.
............1
No..............2
13.
14.
15.
16.
17.
18.
19.
20.
21.
22.
23.
24.
*A m
em
ber
is c
onsi
dere
d to b
e in
act
ive if
he/s
he d
id n
ot part
icip
ate
in C
O a
ctiv
ities
incl
udin
g m
eetin
g, sa
ving e
tc in
last
6 m
onth
s.
Q407. H
ouse
hold
-wis
e p
art
icip
atio
n H
Hs
havi
ng
1 M
em
ber
in this
CO
b.
HH
s havi
ng 2
M
em
bers
in C
O
c. H
Hs
havi
ng
More
than 2
m
em
bers
in C
O
Tota
l num
ber
of house
hold
s
____H
H (
s)
____H
H (
s)
____ H
H (
s)
____ H
H (
s)
70
70
An
nex
es
II A
sse
ssm
en
t In
stru
me
nt
An
nex
es
II A
sse
ssm
en
t In
stru
me
nt
Inst
itu
tio
na
l Ass
essm
ent
Su
rvey
Inst
itu
tio
na
l Ass
essm
ent
Su
rvey
of
of
Co
mm
un
ity
Co
mm
un
ity
Org
an
iza
tio
ns
Org
an
iza
tio
ns
((CCOO
ss) ) F
ost
ered
F
ost
ered
by
by
Ru
ral
Su
pp
ort
Pro
gra
mm
es (
RS
Ps)
in
Pa
kis
tan
R
ura
l S
up
po
rt P
rog
ram
mes
(R
SP
s) i
n P
ak
ista
n
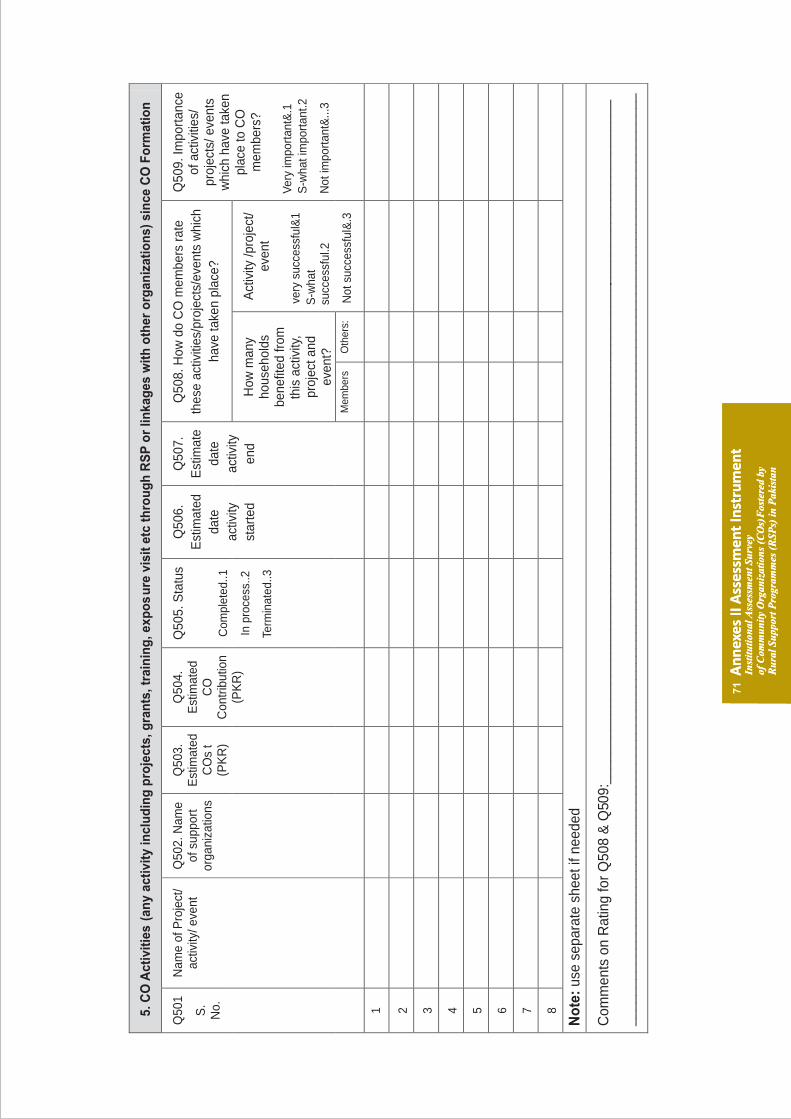
5.
CO
Ac
tiv
itie
s (
an
y a
cti
vit
y i
nc
lud
ing
pro
jec
ts,
gra
nts
, tr
ain
ing
, e
xp
os
ure
vis
it e
tc t
hro
ug
h R
SP
or
lin
ka
ge
s w
ith
oth
er
org
an
iza
tio
ns
) s
inc
e C
O F
orm
ati
on
Q5
08
. H
ow
do
CO
me
mb
ers
ra
te
the
se a
ctiv
itie
s/p
roje
cts/
eve
nts
wh
ich
ha
ve t
ake
n p
lace
?
Ho
w m
an
y h
ou
seh
old
s b
en
efit
ed
fro
m
this
act
ivity
, p
roje
ct a
nd
e
ven
t?
Q501
S.
No.
Nam
e o
f P
roje
ct/
act
ivity
/ eve
nt
Q502. N
am
e
of su
pport
org
aniz
atio
ns
Q503.
Est
imate
d
CO
s t
(PK
R)
Q504.
Est
imate
d
CO
C
ontr
ibutio
n
(PK
R)
Q5
05
. S
tatu
s
Co
mp
lete
d..
1
In p
roce
ss..
2
Term
ina
ted
..3
Q5
06
.
Est
ima
ted
da
te
act
ivity
sta
rte
d
Q5
07
.
Est
ima
te
da
te
act
ivity
en
d
Me
mb
ers
O
the
rs:
Act
ivity
/p
roje
ct/
eve
nt
very
su
cce
ssfu
l&1
S-w
ha
t su
cce
ssfu
l.2
No
t su
cce
ssfu
l&.3
Q5
09
. Im
po
rta
nce
o
f a
ctiv
itie
s/
pro
ject
s/ e
ven
ts
wh
ich
ha
ve t
ake
n
pla
ce t
o C
O
me
mb
ers
?
Ve
ry im
po
rta
nt&
.1
S-w
ha
t im
po
rta
nt.
2
No
t im
po
rta
nt&
...3
1
2
3
4
5
6
7
8
No
te:
use
se
pa
rate
sh
ee
t if
ne
ed
ed
Co
mm
en
ts o
n R
atin
g f
or
Q5
08
& Q
509
:__
__
__
__
__
__
__
__
__
__
__
__
__
__
__
__
__
__
__
__
__
__
__
____________________
_______________________
__
__
__
__
__
__
__
__
__
__
__
__
__
__
__
__
__
__
__
__
__
__
__
__
__
__
__
__
__
__
__
__
__
__
__
__
__
__
_____________________________________________
71
An
nex
es
II A
sse
ssm
en
t In
stru
me
nt
An
nex
es
II A
sse
ssm
en
t In
stru
me
nt
Inst
itu
tio
na
l Ass
essm
ent
Su
rvey
Inst
itu
tio
na
l Ass
essm
ent
Su
rvey
of
of
Co
mm
un
ity
Co
mm
un
ity
Org
an
iza
tio
ns
Org
an
iza
tio
ns
((CCOO
ss) ) F
ost
ered
F
ost
ered
by
by
Ru
ral
Su
pp
ort
Pro
gra
mm
es (
RS
Ps)
in
Pa
kis
tan
R
ura
l S
up
po
rt P
rog
ram
mes
(R
SP
s) i
n P
ak
ista
n
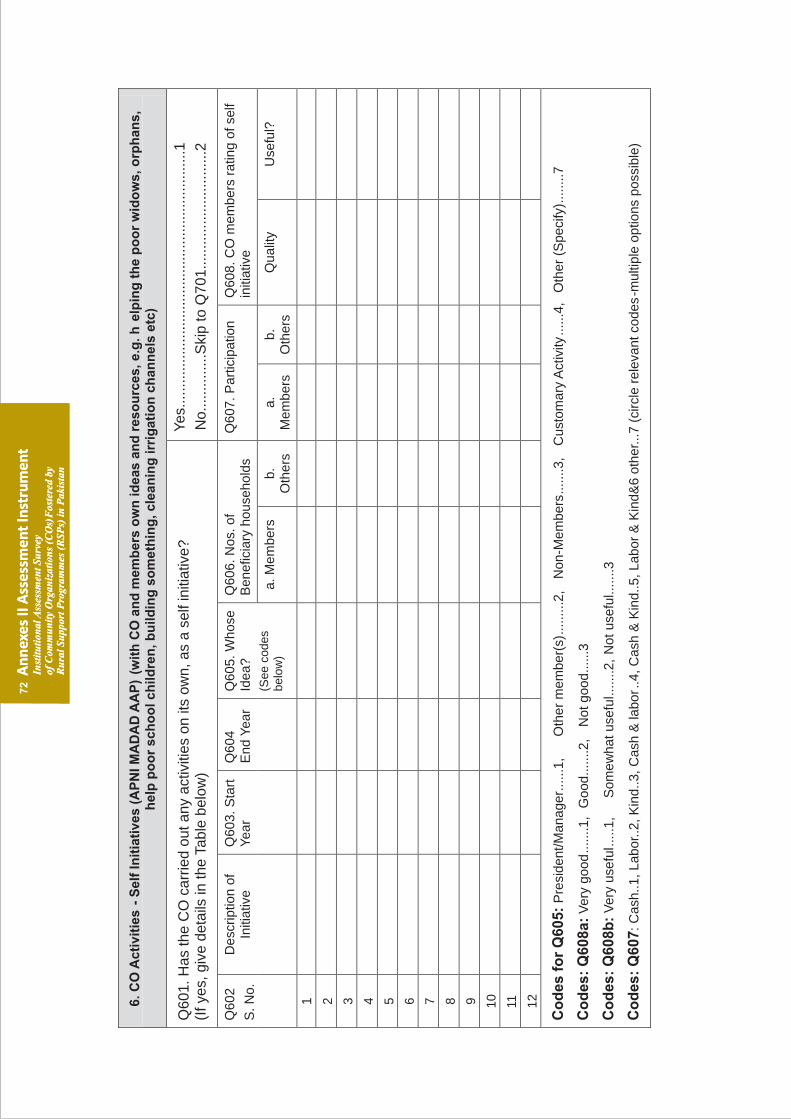
72
An
nex
es
II A
sse
ssm
en
t In
stru
me
nt
An
nex
es
II A
sse
ssm
en
t In
stru
me
nt
Inst
itu
tio
na
l Ass
essm
ent
Su
rvey
Inst
itu
tio
na
l Ass
essm
ent
Su
rvey
of
of
Co
mm
un
ity
Co
mm
un
ity
Org
an
iza
tio
ns
Org
an
iza
tio
ns
((CCOO
ss) ) F
ost
ered
F
ost
ered
by
by
Ru
ral
Su
pp
ort
Pro
gra
mm
es (
RS
Ps)
in
Pa
kis
tan
R
ura
l S
up
po
rt P
rog
ram
mes
(R
SP
s) i
n P
ak
ista
n
6. C
O A
cti
vit
ies -
Self
In
itia
tives (
AP
NI
MA
DA
D A
AP
) (w
ith
CO
an
d m
em
bers
ow
n i
deas a
nd
re
so
urc
es
, e
.g. h
elp
ing
th
e p
oo
r w
ido
ws
, o
rph
an
s,
help
po
or
sch
oo
l ch
ild
ren
, b
uil
din
g s
om
eth
ing
, cle
an
ing
irr
iga
tio
n c
ha
nn
els
etc
)
Q6
01
. H
as
the
CO
ca
rrie
d o
ut
an
y a
ctiv
itie
s o
n it
s o
wn
, a
s a
se
lf in
itia
tive
? (I
f ye
s, g
ive
de
tails
in t
he
Ta
ble
be
low
)
Ye
s...
....
....
....
....
....
....
....
....
....
....
....
....
....
....
....
1
No
....
....
....
..S
kip
to
Q7
01
....
....
....
....
....
....
....
.2
Q606. N
os.
of
Benefic
iary
house
hold
s
Q6
07
. P
art
icip
atio
n
Q6
08
. C
O m
em
be
rs r
atin
g o
f se
lf in
itia
tive
Q
602
S. N
o.
Desc
riptio
n o
f In
itiativ
e
Q603. S
tart
Y
ear
Q604
End Y
ear
Q605.
Whose
Id
ea?
(Se
e c
od
es
be
low
) a.
Mem
bers
b.
Oth
ers
a
. M
em
be
rs
b.
Oth
ers
Q
ua
lity
U
sefu
l?
1
2
3
4
5
6
7
8
9
10
11
12
Co
de
s f
or
Q6
05:
Pre
sident/M
anager.
....
.1,
Oth
er
mem
ber(
s)..
....
...2
, N
on
-Mem
bers
....
...3
, C
ust
om
ary
Act
ivity
......4
, O
the
r (S
pe
cify
)........7
Co
de
s:
Q6
08
a:
Very
good
.......1
, G
ood
....
...2
, N
ot
good
....
..3
Co
de
s:
Q6
08
b:
Very
use
ful.
....1,
Som
ew
hat
use
ful...
....
2,
Not
use
ful..
....
.3
Co
de
s:
Q6
07
: C
ash
..1, Labor..2
, K
ind..3,
Cash
& la
bor.
.4,
Cash
& K
ind..
5,
Labor
& K
ind&
6 o
ther.
..7
(ci
rcle
re
leva
nt co
de
s-m
ulti
ple
op
tion
s p
oss
ible
)

7. CO Activities Micro Credit (Verify with CO Loan registers)
Q701. Has the CO ever taken any RSP micro credit loans?
Yes...........................................................1
No............Skip to Q 703..........................2
Q702. If Yes:
a. Total number of loans taken from RSP so far: ______
b. Total number of households member benefited so far: ______
c. Total accumulative amount borrowed from RSP so far: Rs.____________
d. Number of CO members in default now (if any): ______
e. Total amount in default of these CO members (if any): Rs.____________
f. Main reasons for these defaults?
_______________________________________________________________________________
_______________________________________________________________________________
g. If there are some CO members in default now, what is the CO doing about these defaulters, what is CO doing to make a recovery?
_______________________________________________________________________________
_______________________________________________________________________________
Q703. Has the CO taken RSP loan in the last 12 months?
Yes....................................................1
No............... Skip to Q705.................2
Q704. If yes, then
a. Number of loans taken from RSP in the last 12 months: ______
b. Number of CO member households benefited from these loans in the last 12 months: ______
c. Total amount from RSP in the last 12 months: Rs.____________
d. Are there some CO member households who have not taken RSP loans from C O in the last 12 months?
Yes............................1
No.............................2
e. If yes, what are the main reasons for not taking RSP loans in last 12 months?
_______________________________________________________________________________
_______________________________________________________________________________
f. If CO has ever borrowed from RSP but not borrowed in last 12 months, why have they stopped borrowing from the RSP?
_______________________________________________________________________________
_______________________________________________________________________________
Q705. CO members views about the general terms and conditions of RSP micro credit loans (compared to other sources):
a. Amount of loan/size of loan per member to meet the need of CO members:
More than adequate ................1
73
An
nex
es
II A
sse
ssm
en
t In
stru
me
nt
Inst
itu
tio
na
l Ass
essm
ent
Su
rvey
of
Co
mm
un
ity
Org
an
iza
tio
ns
(CO
s) F
ost
ered
by
Ru
ral
Su
pp
ort
Pro
gra
mm
es (
RS
Ps)
in
Pa
kis
tan

Q704. If yes, then
a. Number of loans taken from RSP in the last 12 months: ______
b. Number of CO member households benefited from these loans in the last 12 months: ______
c. Total amount from RSP in the last 12 months: Rs.____________
d. Are there some CO member households who have not taken RSP loans from C O in the last 12 months?
Yes.............................1.
No...............................2
e. If yes, what are the main reasons for not taking RSP loans in last 12 months?
_______________________________________________________________________________
_______________________________________________________________________________
f. If CO has ever borrowed from RSP but not borrowed in last 12 months, why have they stopped borrowing from the RSP?
_______________________________________________________________________________
_______________________________________________________________________________
Q705. CO members views about the general terms and conditions of RSP micro credit loans (compared to other sources):
a. Amount of loan/size of loan per member to meet the need of CO members:
More than adequate ...........1
Adequate..............................2
Inadequate...........................3
b. Service charges charged by RSPs for providing micro credit loansat the door step of clients
Service charge is quite reasonable................................1
Reasonable.....................................................................2
On the higher side..........................................................3
c. Accessing RSP micro credit loans is:
Very easy........................................................................1
Easy................................................................................2
Difficult............................................................................3
d. Repayment period for RSP micro credit loans:
Quite Reasonable...........................................................1
Reasonable.....................................................................2
Too short period..............................................................3
8. CO Activities Savings (verify with CO saving register)
Description a. The first year after
CO formation b. In last 12
months c. Total
cumulative
Q801. CO Savings (Rs):
Q802. Number of member s saving
Q803. Withdrawals (Rs)
Ru
ral
Su
pp
ort
Pro
gra
mm
es (
RS
Ps)
in
Pa
kis
tan
o
f C
om
mu
nit
y O
rga
niz
ati
on
s (C
Os)
Fo
ster
ed b
y In
stit
uti
on
al A
sses
smen
t S
urv
ey
74
An
nex
es
II A
sse
ssm
en
t In
stru
me
nt

Q804. Withdrawals (Nos.)
Q805. Main reasons for withdrawal from savings?
_______________________________________________________________________________
_______________________________________________________________________________
Q806. What are the major benefits of CO savings to members? Why do CO members save?
_______________________________________________________________________________
_______________________________________________________________________________
Q807. Are there some members without any savings? Yes....................................................1
No............Skip to Q809....................2
Q808. If YES, what are their reasons for not saving?
_______________________________________________________________________________
_______________________________________________________________________________
Q809. Does the CO do anything to encourage these
non-saving members to make savings?
Yes.....................................................1
No............Skip to section II...............2
Q810. If YES, what does it do?
_______________________________________________________________________________
_______________________________________________________________________________
75
An
nex
es
II A
sse
ssm
en
t In
stru
me
nt
Inst
itu
tio
na
l Ass
essm
ent
Su
rvey
of
Co
mm
un
ity
Org
an
iza
tio
ns
(CO
s) F
ost
ered
by
Ru
ral
Su
pp
ort
Pro
gra
mm
es (
RS
Ps)
in
Pa
kis
tan
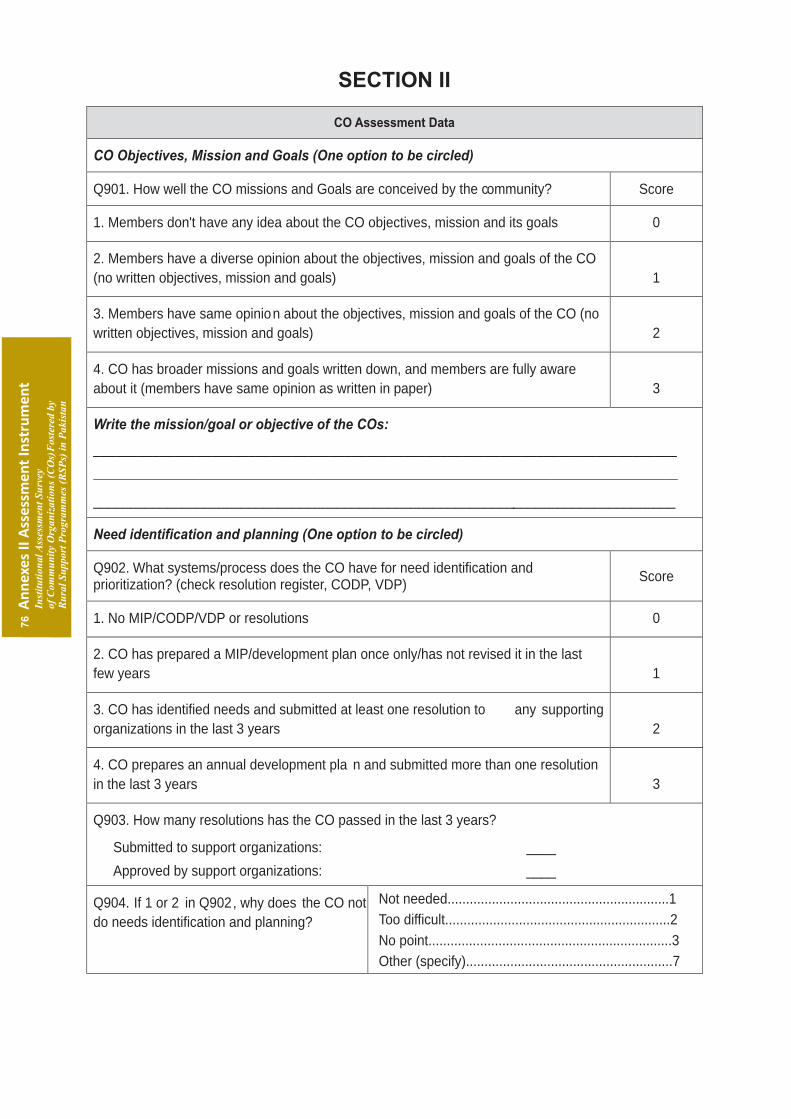
SECTION II
CO Assessment Data
CO Objectives, Mission and Goals (One option to be circled)
Q901. How well the CO missions and Goals are conceived by the community? Score
1. Members don't have any idea about the CO objectives, mission and its goals 0
2. Members have a diverse opinion about the objectives, mission and goals of the CO
(no written objectives, mission and goals) 1
3. Members have same opinion about the objectives, mission and goals of the CO (no
written objectives, mission and goals) 2
4. CO has broader missions and goals written down, and members are fully aware
about it (members have same opinion as written in paper) 3
Write the mission/goal or objective of the COs:
_______________________________________________________________________________
________________________________________________________________________________________
_______________________________________________________________________________
Need identification and planning (One option to be circled)
Q902. What systems/process does the CO have for need identification and prioritization? (check resolution register, CODP, VDP)
Score
1. No MIP/CODP/VDP or resolutions 0
2. CO has prepared a MIP/development plan once only/has not revised it in the last
few years 1
3. CO has identified needs and submitted at least one resolution to any supporting
organizations in the last 3 years 2
4. CO prepares an annual development pla n and submitted more than one resolution
in the last 3 years 3
Q903. How many resolutions has the CO passed in the last 3 years?
Submitted to support organizations: ____
Approved by support organizations: ____
Q904. If 1 or 2 in Q902, why does the CO not
do needs identification and planning?
Not needed............................................................1
Too difficult.............................................................2
No point..................................................................3
Other (specify)........................................................7
Ru
ral
Su
pp
ort
Pro
gra
mm
es (
RS
Ps)
in
Pa
kis
tan
o
f C
om
mu
nit
y O
rga
niz
ati
on
s (C
Os)
Fo
ster
ed b
y In
stit
uti
on
al A
sses
smen
t S
urv
ey
76
An
nex
es
II A
sse
ssm
en
t In
stru
me
nt

Q905. If 3 or 4 in Q902 , how does the CO
rate its resolutions and plans?
Essential.......................................................1
Essential.......................................................1
Very usefu.....................................................2l
Very usefu.....................................................2l
Useful............................................................3
Useful............................................................3
Participation in need identification and planning in any activity (One option to be circled)
Q906. Does the CO ensure member participation in needs identification & planning? Score
1. No proof of participation 0
2. Less than 50% of membership signed latest resolution, MIP/CODP or VDP. 1
3. 51-75% of membership signed latest resolution, MIP/CODP or VDP. 2
4. Resolution discussed in CO meeting and all CO members signed 3
Q907. If 1 or 2 in Q906 , why do CO
members not participate more?
Not asked........................................................1
Leader knows best..........................................2
Other (specify)................................................7
CO Networking (One option to be circled)
Q908. What contacts does the CO have with other COs? Score
1. CO has had no contact with any other COs. 0
2. CO has created informal linkages with _______# of neighboring COs.
Explain what for _______________________________________________________ 1
3. CO has discussed formal links with other COs to form VDO or LSO. 2
4. CO is member of a VDO or LSO. 3
Q909. If 3 or 4 in Q908 , how does the CO
rate membership of the VDO or LSO?
Q910. What do they hope to get from it?
_______________________________________________________________________________
Frequency of CO Meetings (check records) (One option is to be circled)
Q911. How many CO meetings were held in the last 12 months? Score
1. None 0
2. Up to four 1
3. Five to eight 2
77
An
nex
es
II A
sse
ssm
en
t In
stru
me
nt
Inst
itu
tio
na
l Ass
essm
ent
Su
rvey
of
Co
mm
un
ity
Org
an
iza
tio
ns
(CO
s) F
ost
ered
by
Ru
ral
Su
pp
ort
Pro
gra
mm
es (
RS
Ps)
in
Pa
kis
tan

4. More than eight 3
Q912. If NONE, give date of last meeting: D D M M Y Y Y Y
__|__:__|__:__|__|__|__
Attendance at last 3 meetings
How well the members take interest in CO meetings?
Q913. S. No. a. Date Total Members Attendance
1
D D M M Y Y Y Y
__|__:__|__:__|__|__|__ __|__ __|__
2
D D M M Y Y Y Y
__|__:__|__:__|__|__|__ __|__ __|__
3
D D M M Y Y Y Y
__|__:__|__:__|__|__|__ __|__ __|__
Total __|__ __|__
*Percentage =(Total attendance/Total Members)*100
Q914. Percentage (%) of Attendance Score
(One score is to be circled)
0% 0
1% - 50% 1
51% - 75% 2
76% - 100% 3
Q915. Were any major issue discussed in the last three meetings?
Yes.........................................................1
No..........................................................2
Q916. If YES, what were they?
_______________________________________________________________________________
Q917. Where does the CO usually the meetings held
_______________________________________________________________________________
_______________________________________________________________________________
Q918. What is the frequency of regular meeting? Weekly........................................................1
Fortnightly...................................................2
Monthly.......................................................3
2 monthly....................................................4
3 monthly....................................................5
Other (Specify)...........................................7
Ru
ral
Su
pp
ort
Pro
gra
mm
es (
RS
Ps)
in
Pa
kis
tan
o
f C
om
mu
nit
y O
rga
niz
ati
on
s (C
Os)
Fo
ster
ed b
y In
stit
uti
on
al A
sses
smen
t S
urv
ey
78
An
nex
es
II A
sse
ssm
en
t In
stru
me
nt
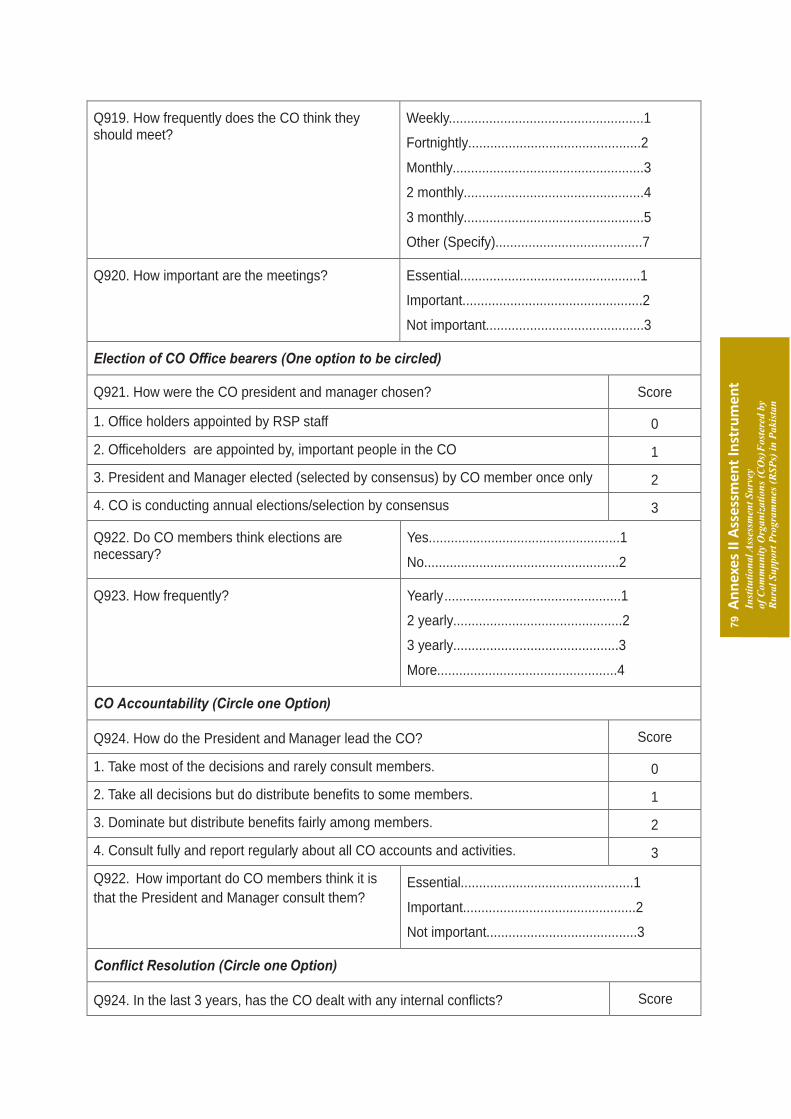
Q919. How frequently does the CO think they should meet?
Weekly.....................................................1
Fortnightly...............................................2
Monthly....................................................3
2 monthly.................................................4
3 monthly.................................................5
Other (Specify)........................................7
Q920. How important are the meetings? Essential.................................................1
Important.................................................2
Not important...........................................3
Election of CO Office bearers (One option to be circled)
Q921. How were the CO president and manager chosen? Score
1. Office holders appointed by RSP staff 0
2. Officeholders are appointed by, important people in the CO 1
3. President and Manager elected (selected by consensus) by CO member once only 2
4. CO is conducting annual elections/selection by consensus 3
Q922. Do CO members think elections are necessary?
Yes....................................................1
No.....................................................2
Q923. How frequently? Yearly................................................1
2 yearly..............................................2
3 yearly.............................................3
More.................................................4
CO Accountability (Circle one Option)
Q924. How do the President and Manager lead the CO? Score
1. Take most of the decisions and rarely consult members. 0
2. Take all decisions but do distribute benefits to some members. 1
3. Dominate but distribute benefits fairly among members. 2
4. Consult fully and report regularly about all CO accounts and activities. 3
Q922. How important do CO members think it is
that the President and Manager consult them? Essential...............................................1
Important...............................................2
Not important.........................................3
Conflict Resolution (Circle one Option)
Q924. In the last 3 years, has the CO dealt with any internal conflicts? Score
79
An
nex
es
II A
sse
ssm
en
t In
stru
me
nt
Inst
itu
tio
na
l Ass
essm
ent
Su
rvey
of
Co
mm
un
ity
Org
an
iza
tio
ns
(CO
s) F
ost
ered
by
Ru
ral
Su
pp
ort
Pro
gra
mm
es (
RS
Ps)
in
Pa
kis
tan

1. No 0
2. Internal conflicts dealt with informally. 1
3. Internal conflicts dealt with through formal procedures. 2
4. CO has played an important role in resolving both internal external conflicts. 3
Q924. List any last three conflicts dealt with:
_________________________________________________________________________________
_________________________________________________________________________________
Q925. Who do CO members think should resolve
internal conflicts?\ The CO members?.............................................1
The CO members and CO leaders?...................2
The outsiders (outside the CO)?.........................3
Womens Issues (Ci rcle one Option)
Q926. What has the CO done about womens issues? Score
1. CO has not done anything about womens issues. 0
2. CO members have discussed womens issues but not done anything about them. 1
3. The CO has implemented activities for women. 2
4. The CO is actively lobbying for womens rights in the community. 3
Q927. List the COs Activities and Lobbying efforts : Number of women Benefitted
a. _________________________________________________ __|__
b. _________________________________________________ __|__
c. _________________________________________________ __|__
d. _________________________________________________ __|__
Q928. What do CO members think about womens
socio-economic position in their community? All women have same position as men&&&&1
some women have same position as men&&...2
No woman has same position as men&&&&.3
Q929. In what ways are they treated unfairly?
_________________________________________________________________________________
_________________________________________________________________________________
Q930. If women are treated unfairly, what is the biggest cause of it?
_________________________________________________________________________________
Inclusion of poor households (Circle one Option)
Q931. What proportion of CO members are poor? Score Notes
1. CO doesn't have any poor household as its
member 0
2. Less than 25% of the members are from poor 1
Total number of households in
CO :_____________________
Ru
ral
Su
pp
ort
Pro
gra
mm
es (
RS
Ps)
in
Pa
kis
tan
o
f C
om
mu
nit
y O
rga
niz
ati
on
s (C
Os)
Fo
ster
ed b
y In
stit
uti
on
al A
sses
smen
t S
urv
ey
80
An
nex
es
II A
sse
ssm
en
t In
stru
me
nt
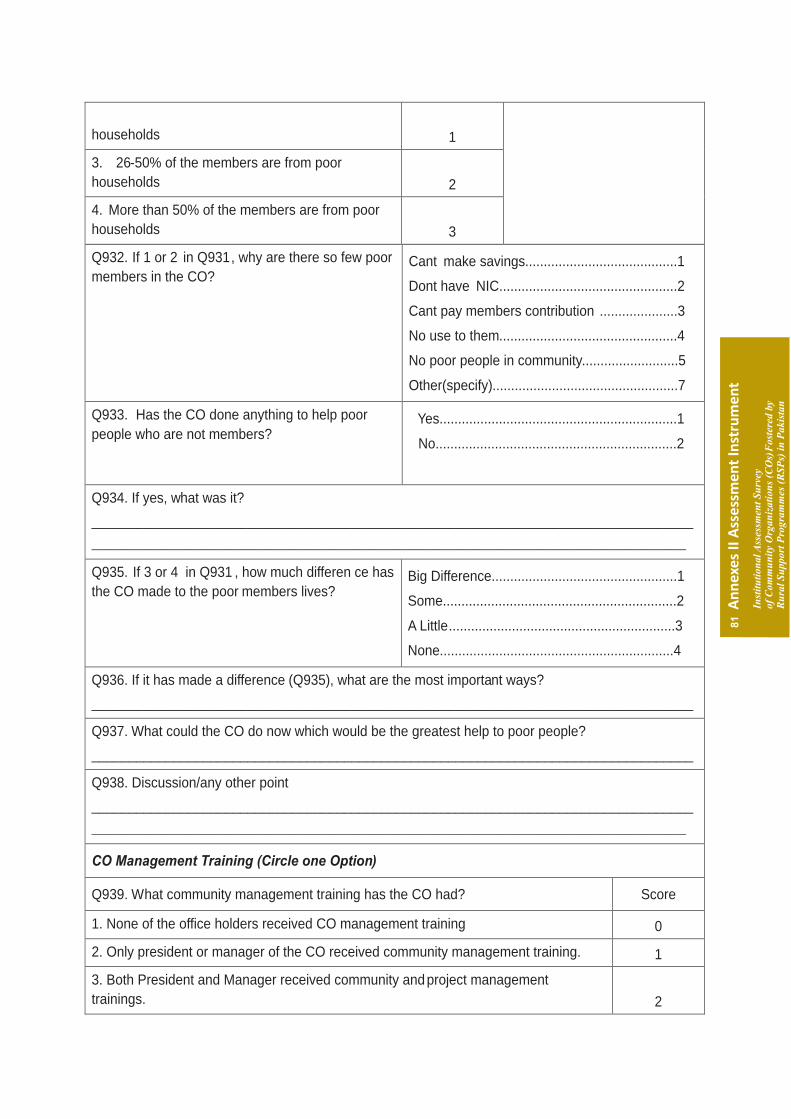
households 1
3. 26-50% of the members are from poor
households 2
4. More than 50% of the members are from poor
households 3
Q932. If 1 or 2 in Q931, why are there so few poor
members in the CO? Cant make savings.........................................1
Dont have NIC................................................2
Cant pay members contribution .....................3
No use to them................................................4
No poor people in community..........................5
Other(specify)..................................................7
Q933. Has the CO done anything to help poor
people who are not members? Yes................................................................1
No.................................................................2
Q934. If yes, what was it?
_________________________________________________________________________________
_________________________________________________________________________________________
Q935. If 3 or 4 in Q931 , how much differen ce has
the CO made to the poor members lives? Big Difference..................................................1
Some...............................................................2
A Little.............................................................3
None...............................................................4
Q936. If it has made a difference (Q935), what are the most important ways?
_________________________________________________________________________________
Q937. What could the CO do now which would be the greatest help to poor people?
_________________________________________________________________________________
Q938. Discussion/any other point
_________________________________________________________________________________
_________________________________________________________________________________________
CO Management Training (Circle one Option)
Q939. What community management training has the CO had? Score
1. None of the office holders received CO management training 0
2. Only president or manager of the CO received community management training. 1
3. Both President and Manager received community and project management
trainings. 2
81
An
nex
es
II A
sse
ssm
en
t In
stru
me
nt
Inst
itu
tio
na
l Ass
essm
ent
Su
rvey
of
Co
mm
un
ity
Org
an
iza
tio
ns
(CO
s) F
ost
ered
by
Ru
ral
Su
pp
ort
Pro
gra
mm
es (
RS
Ps)
in
Pa
kis
tan

4. The President/Manager and some other members received community and project
management trainings. 3
Q940. If 2, 3 or 4 in Q939, how useful do CO members think the trainings have been?
a. For the Trainees Very Useful......................................................1
Useful..............................................................2
Not Useful.......................................................3
b. For the CO Very Useful......................................................1
Useful..............................................................2
Not Useful.......................................................3
CO Technical Capacity (Circle relevant option from 1-7 and then circle one score)
Q941. Number of Activity Score
1 0
2 -3 1
4 5 2
6 or more 3
1. CO has some members trained by RSP and other organizations in agriculture.
2. CO has some members trained by RSP and other organizations in forestry.
3. CO has some members trained by RSP and other organizations in livestock and poultry.
4. CO has some members trained by RSP and other organizations in fruit and vegetable production and processing.
5.CO has some members trained by RSP and other organizations in health, education and sanitation.
6. CO has some members trained by RSP and other organizations in vocational and technical skills (plumbing, electrician, welding, tailoring, beautification, candle making etc).
7. Some CO leaders/members visited other COs or VOs or LSO or RSP areas for experience sharing.
Q942. If score 0 or 1 in Q941, why CO have so few
trained members?
Not offered......................................................1
Did not want....................................................2
Costly..............................................................3
Other (Specify)................................................7
Q943. Discussion/ any other point:
_________________________________________________________________________________
_________________________________________________________________________________
Q944. If score 2 or 3 in Q941, how does the CO rate the training?
Very Useful......................................................1
Useful..............................................................2
Ru
ral
Su
pp
ort
Pro
gra
mm
es (
RS
Ps)
in
Pa
kis
tan
o
f C
om
mu
nit
y O
rga
niz
ati
on
s (C
Os)
Fo
ster
ed b
y In
stit
uti
on
al A
sses
smen
t S
urv
ey
82
An
nex
es
II A
sse
ssm
en
t In
stru
me
nt
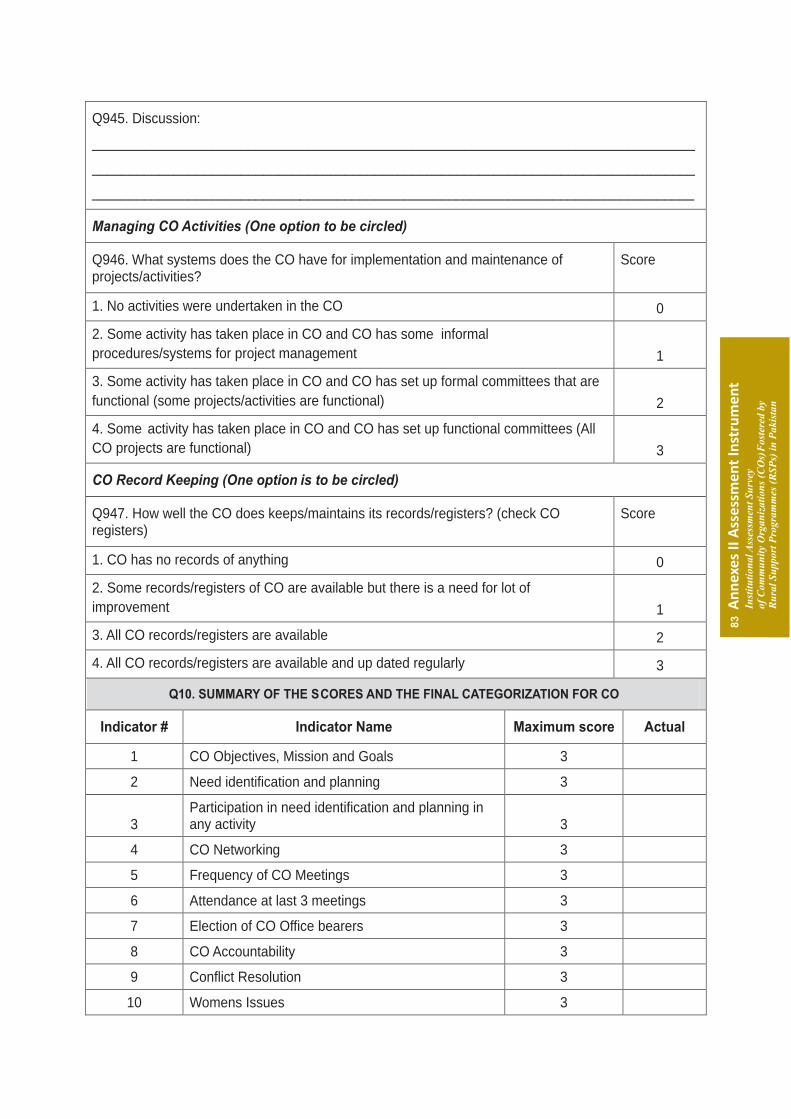
Q945. Discussion:
_________________________________________________________________________________
_________________________________________________________________________________
_________________________________________________________________________________
Managing CO Activities (One option to be circled)
Q946. What systems does the CO have for implementation and maintenance of projects/activities?
Score
1. No activities were undertaken in the CO 0
2. Some activity has taken place in CO and CO has some informal
procedures/systems for project management 1
3. Some activity has taken place in CO and CO has set up formal committees that are
functional (some projects/activities are functional) 2
4. Some activity has taken place in CO and CO has set up functional committees (All
CO projects are functional) 3
CO Record Keeping (One option is to be circled)
Q947. How well the CO does keeps/maintains its records/registers? (check CO registers)
Score
1. CO has no records of anything 0
2. Some records/registers of CO are available but there is a need for lot of
improvement 1
3. All CO records/registers are available 2
4. All CO records/registers are available and up dated regularly 3
Q10. SUMMARY OF THE SCORES AND THE FINAL CATEGORIZATION FOR CO
Indicator # Indicator Name Maximum score Actual
1 CO Objectives, Mission and Goals 3
2 Need identification and planning 3
3 Participation in need identification and planning in any activity 3
4 CO Networking 3
5 Frequency of CO Meetings 3
6 Attendance at last 3 meetings 3
7 Election of CO Office bearers 3
8 CO Accountability 3
9 Conflict Resolution 3
10 Womens Issues 3
83
An
nex
es
II A
sse
ssm
en
t In
stru
me
nt
Inst
itu
tio
na
l Ass
essm
ent
Su
rvey
of
Co
mm
un
ity
Org
an
iza
tio
ns
(CO
s) F
ost
ered
by
Ru
ral
Su
pp
ort
Pro
gra
mm
es (
RS
Ps)
in
Pa
kis
tan

11 Inclusion of poorest households 3
12 CO Management Training 3
13 CO Technical Capacity 3
14 Managing CO activities 3
15 CO Record Keeping 3
Total Score 45
% of CO's actual score (Obtained Marks/Total Marks * 100)
% Range CO Institutional Development Category CO Category (mark one)
Less than 25%
CO Institutional Development Category 1 (Inactive)
26% - 50% CO Institutional Development Category 2 (Institutional Infancy)
51% - 75% CO Institutional Development Category 3 (Institutional Development )
76% & Above CO Institutional Development Category 4 (Institutional Independence )
11. RSP Staff visits to CO in last 12 months
Q1101. Number of visits made by Social Organizer (SO) in the last 12 months ____
Q1102. Number of visits made by other RSP staff in the last 12 months ____
Q1103. Do CO members have to visit the RSP office often? Yes.......................................1
No........................................2
Q1104. If yes in Q1103, when was the last visit made? D D M M Y Y Y Y
__|__:__|__:__|__|__|__
Q1105. What for?
_________________________________________________________________________________
_________________________________________________________________________________
Q1106. CO members views about RSP support since date of formation
Very satisfactory..................1
Satisfactory..........................2
Inadequate..........................3
Q1107. Discussion/ any other point:
_________________________________________________________________________________
_________________________________________________________________________________
12. Final Discussion
Ru
ral
Su
pp
ort
Pro
gra
mm
es (
RS
Ps)
in
Pa
kis
tan
o
f C
om
mu
nit
y O
rga
niz
ati
on
s (C
Os)
Fo
ster
ed b
y In
stit
uti
on
al A
sses
smen
t S
urv
ey
84
An
nex
es
II A
sse
ssm
en
t In
stru
me
nt

1201. General Discussion among CO members, additional points they wish to add about the CO, CO assessment, reasons for activeness or inactiveness and future plans. Etc.
_________________________________________________________________________________
_________________________________________________________________________________
_________________________________________________________________________________
_________________________________________________________________________________
_________________________________________________________________________________
_________________________________________________________________________________
_________________________________________________________________________________
_________________________________________________________________________________
_________________________________________________________________________________
_________________________________________________________________________________
_________________________________________________________________________________
_________________________________________________________________________________
_________________________________________________________________________________
_________________________________________________________________________________
_________________________________________________________________________________
13. CONFIDENTIAL FACILITATOR ONLY
Q1301. Rank the Quality of the CO Members Discussion
Only one or two members spoke. All others silent unless directly questioned...............................1
b. One or two dominant but a minority of others also spoke up......................................................2
c. Small group dominated discussion but most members involved................................................3
d. Fully open discussion with a majority actively involved..............................................................4
Notes:___________________________________________________________________________
_________________________________________________________________________________
Q1302. How would you assess the CO members? Very much interested in CO............................1
Some interest in CO.......................................2
Not interest in CO...........................................3
Q1303. How would you assess the CO leaders? CO leaders are committed, dedicated, making efforts to meet the objectives of CO:
Quite clearly....................................................1
Somewhat clearly............................................2
Not at all..........................................................3
Q1304. if 3 in Q1303, then why they came to this meeting?
_________________________________________________________________________________
_________________________________________________________________________________
85
An
nex
es
II A
sse
ssm
en
t In
stru
me
nt
Inst
itu
tio
na
l Ass
essm
ent
Su
rvey
of
Co
mm
un
ity
Org
an
iza
tio
ns
(CO
s) F
ost
ered
by
Ru
ral
Su
pp
ort
Pro
gra
mm
es (
RS
Ps)
in
Pa
kis
tan
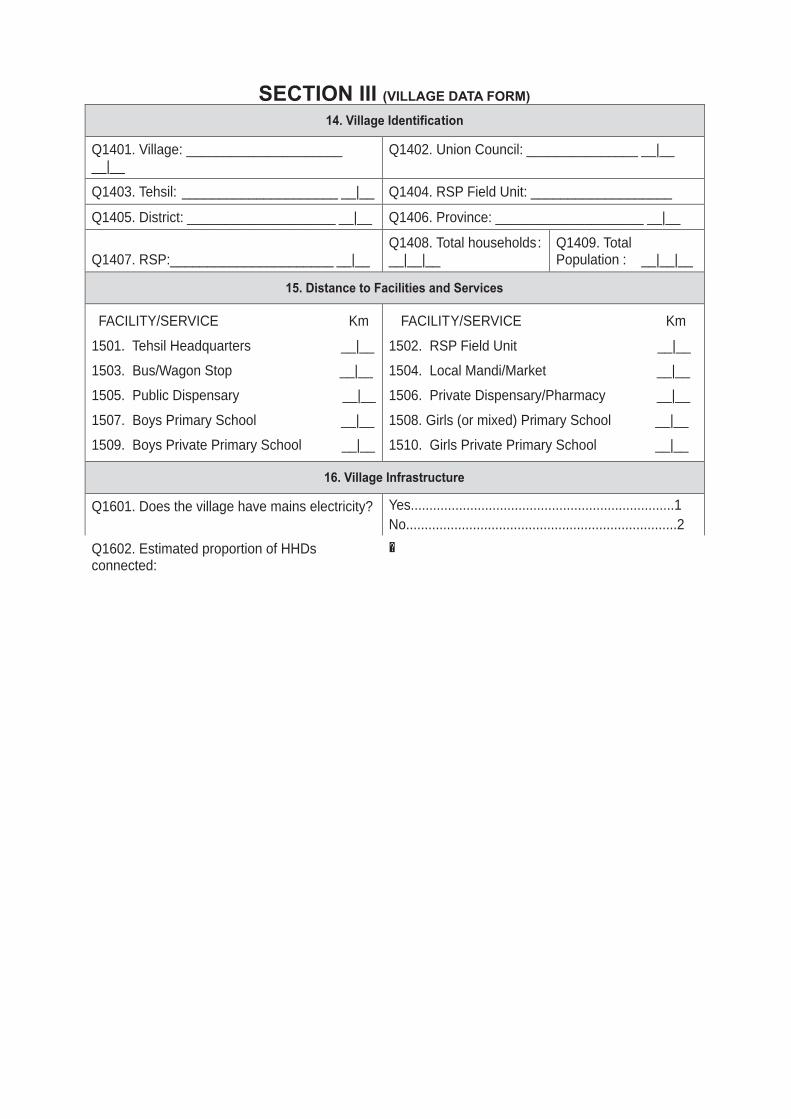
SECTION III (VILLAGE DATA FORM)
14. Village Identification
Q1401. Village: _____________________ __|__
Q1402. Union Council: _______________ __|__
Q1403. Tehsil: _____________________ __|__ Q1404. RSP Field Unit: ___________________
Q1405. District: ____________________ __|__ Q1406. Province: ____________________ __|__
Q1407. RSP:______________________ __|__ Q1408. Total households: __|__|__
Q1409. Total Population : __|__|__
15. Distance to Facilities and Services
FACILITY/SERVICE Km
1501. Tehsil Headquarters __|__
1503. Bus/Wagon Stop __|__
1505. Public Dispensary __|__
1507. Boys Primary School __|__
1509. Boys Private Primary School __|__
FACILITY/SERVICE Km
1502. RSP Field Unit __|__
1504. Local Mandi/Market __|__
1506. Private Dispensary/Pharmacy __|__
1508. Girls (or mixed) Primary School __|__
1510. Girls Private Primary School __|__
16. Village Infrastructure
Q1601. Does the village have mains electricity? Yes.......................................................................1
No.........................................................................2
Q1602. Estimated proportion of HHDs connected:
�¼.........................................................................1
¼.........................................................................1
�½..........................................................................2
½..........................................................................2
�3/4.......................................................................3
3/4.......................................................................3
All
All
.........................................................................4
.........................................................................4
Q1603. What is the villages main source of drinking water? (Circle 1)
Tap Water (water supply).....................................1
Spring...................................................................2
River.....................................................................3
Canal....................................................................4
Karez....................................................................5
Motor pump..........................................................6
Tube Well.............................................................7
Dug Well..............................................................8
Hand pump..........................................................9
Reservoir...........................................................10
Other (sPecify)...................................................77
Q1604. Is water piped to some houses? Yes.......................................................................1
No.......................................................................2
Q1605. Proportion of HHDs connected: �
�
�
Q1606. Does the village have telephones (landline)
Yes.......................................................................1
No.......................................................................2
Ru
ral
Su
pp
ort
Pro
gra
mm
es (
RS
Ps)
in
Pa
kis
tan
o
f C
om
mu
nit
y O
rga
niz
ati
on
s (C
Os)
Fo
ster
ed b
y In
stit
uti
on
al A
sses
smen
t S
urv
ey
86
An
nex
es
II A
sse
ssm
en
t In
stru
me
nt

Q1606. Does the village have telephones (landline)
Yes......................................................................1
No.......................................................................2
Q1607. Proportion of HHDs connected: �
�
�
Q1608. Does the village have mobile/wireless loop coverage?
Yes......................................................................1
No.......................................................................2
Q1609. Proportion of HHDs connected: �
�
�
Q1610. Are there any streets paved/soled? Yes......................................................................1
No.......................................................................2
Q1611. Proportion of all streets paved: �
�
�
Q1612. Is there a Lady Health Worker? Yes......................................................................1
No.......................................................................2
Q1613. How many shops are there? __|__|__
17. Village Income
Q1701. What are the 5most important sources of income for the people of the village? (Circle in order of importance)
(1 is highest and five is the lowest)
a. Irrigated Farming.............................1
b. Dryland Farming..............................1
c. Livestock..........................................1
d. Crafts...............................................1
e. Trade...............................................1
f. Transport..........................................1
g. Farm Labour....................................1/ 2 / 3 / 4 / 5
/ 2 / 3 / 4 / 5
/ 2 / 3 / 4 / 5
/ 2 / 3 / 4 / 5
/ 2 / 3 / 4 / 5
/ 2 / 3 / 4 / 5
/ 2 / 3 / 4 / 5
/ 2 / 3 / 4 / 5
/ 2 / 3 / 4 / 5
/ 2 / 3 / 4 / 5
h. Non Farm Labour ............................1
i. Remittances.....................................1
j. Other................................................1
½..........................................................................2
All
�
�
�
¼.........................................................................1
3/4.......................................................................3
.........................................................................4
½..........................................................................2
½..........................................................................2
All
All
�
�
�
�
�
�
¼.........................................................................1
¼.........................................................................1
3/4.......................................................................3
3/4.......................................................................3
.........................................................................4
.........................................................................4
87
An
nex
es
II A
sse
ssm
en
t In
stru
me
nt
Inst
itu
tio
na
l Ass
essm
ent
Su
rvey
of
Co
mm
un
ity
Org
an
iza
tio
ns
(CO
s) F
ost
ered
by
Ru
ral
Su
pp
ort
Pro
gra
mm
es (
RS
Ps)
in
Pa
kis
tan

Annex III:
Comparative analysis of COs

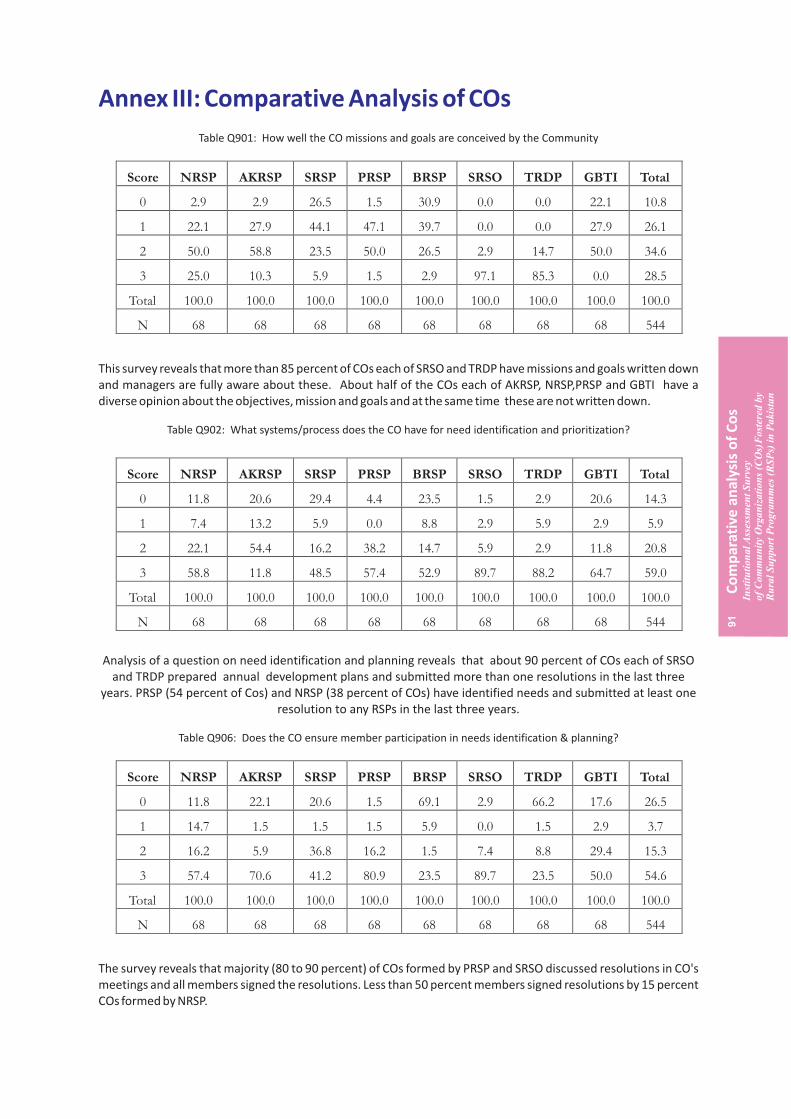
Annex III: Comparative Analysis of COs
Table Q901: How well the CO missions and goals are conceived by the Community
This survey reveals that more than 85 percent of COs each of SRSO and TRDP have missions and goals written down and managers are fully aware about these. About half of the COs each of AKRSP, NRSP,PRSP and GBTI have a diverse opinion about the objectives, mission and goals and at the same time these are not written down.
Table Q902: What systems/process does the CO have for need identification and prioritization?
Analysis of a question on need identification and planning reveals that about 90 percent of COs each of SRSO and TRDP prepared annual development plans and submitted more than one resolutions in the last three
years. PRSP (54 percent of Cos) and NRSP (38 percent of COs) have identified needs and submitted at least one resolution to any RSPs in the last three years.
Table Q906: Does the CO ensure member participation in needs identification & planning?
The survey reveals that majority (80 to 90 percent) of COs formed by PRSP and SRSO discussed resolutions in CO's meetings and all members signed the resolutions. Less than 50 percent members signed resolutions by 15 percent COs formed by NRSP.
Score NRSP AKRSP SRSP PRSP BRSP SRSO TRDP GBTI Total
0 2.9 2.9 26.5 1.5 30.9 0.0 0.0 22.1 10.8
1 22.1 27.9 44.1 47.1 39.7 0.0 0.0 27.9 26.1
2 50.0 58.8 23.5 50.0 26.5 2.9 14.7 50.0 34.6
3 25.0 10.3 5.9 1.5 2.9 97.1 85.3 0.0 28.5
Total 100.0 100.0 100.0 100.0 100.0 100.0 100.0 100.0 100.0
N 68 68 68 68 68 68 68 68 544
Score NRSP AKRSP SRSP PRSP BRSP SRSO TRDP GBTI Total
0 11.8 20.6 29.4 4.4 23.5 1.5 2.9 20.6 14.3
1 7.4 13.2 5.9 0.0 8.8 2.9 5.9 2.9 5.9
2 22.1 54.4 16.2 38.2 14.7 5.9 2.9 11.8 20.8
3 58.8 11.8 48.5 57.4 52.9 89.7 88.2 64.7 59.0
Total 100.0 100.0 100.0 100.0 100.0 100.0 100.0 100.0 100.0
N 68 68 68 68 68 68 68 68 544
Score NRSP AKRSP SRSP PRSP BRSP SRSO TRDP GBTI Total
0 11.8 22.1 20.6 1.5 69.1 2.9 66.2 17.6 26.5
1 14.7 1.5 1.5 1.5 5.9 0.0 1.5 2.9 3.7
2 16.2 5.9 36.8 16.2 1.5 7.4 8.8 29.4 15.3
3 57.4 70.6 41.2 80.9 23.5 89.7 23.5 50.0 54.6
Total 100.0 100.0 100.0 100.0 100.0 100.0 100.0 100.0 100.0
N 68 68 68 68 68 68 68 68 544
91
Co
mp
arat
ive
an
alys
is o
f C
os
Inst
itu
tio
na
l Ass
essm
ent
Su
rvey
of
Co
mm
un
ity
Org
an
iza
tio
ns
(CO
s) F
ost
ered
by
Ru
ral
Su
pp
ort
Pro
gra
mm
es (
RS
Ps)
in
Pa
kis
tan

Table Q908: What contacts does the CO has with other COS?
Networking of AKRSP and NRSP is comparatively found best among rest of the RSPs. About half of the COs (55 BRSP and PRSP have no contacts with other Cos. and 46 percent of COs) of these tow RSPs are members of respective networks. More than three fourth COs of BRSP and PRSP have no contacts with other COs.
Table Q911: How many CO meetings were held in the last 12 months?
Overall about 65 percent COs of all the RSPs held more than eight meetings in the last 12 months. However, the same frequency of meetings held in the same period were more than 90 percent of COs formed each by PRSP, SRSO and TRDP. No meetings held in BRSP (41 percent COs), GBTI (32 percent) during the same period.
Table Q914: Percentage of Attendance?
SRSO (96 percent COs) and TRDP (90 percent COs) have attendance found in CO's meeting between 75 to 100 percent of their members on average during the past three meetings.
Score NRSP AKRSP SRSP PRSP BRSP SRSO TRDP GBTI Total
0 36.8 26.5 41.2 64.7 75.0 45.6 32.4 35.3 44.7
1 8.8 5.9 23.5 16.2 14.7 32.4 42.6 7.4 18.9
2 8.8 13.2 4.4 13.2 1.5 2.9 1.5 14.7 7.5
3 45.6 54.4 30.9 5.9 8.8 19.1 23.5 42.6 28.9
Total 100.0 100.0 100.0 100.0 100.0 100.0 100.0 100.0 100.0
N 68 68 68 68 68 68 68 68 544
Score NRSP AKRSP SRSP PRSP BRSP SRSO TRDP GBTI Total
0 17.6 8.8 25.0 1.5 41.2 1.5 1.5 32.4 16.2
1 4.4 19.1 10.3 0.0 11.8 0.0 2.9 16.2 8.1
2 2.9 11.8 29.4 0.0 19.1 0.0 1.5 20.6 10.7
3 75.0 60.3 35.3 98.5 27.9 98.5 94.1 30.9 65.1
Total 100.0 100.0 100.0 100.0 100.0 100.0 100.0 100.0 100.0
N 68 68 68 68 68 68 68 68 544
Score NRSP AKRSP SRSP PRSP BRSP SRSO TRDP GBTI Total
0 11.8 2.9 25.0 1.5 10.3 0.0 0.0 20.6 9.0
1 4.4 25.0 7.4 2.9 1.5 0.0 1.5 5.9 6.1
2 16.2 39.7 14.7 22.1 16.2 4.4 8.8 11.8 16.7
3 67.6 32.4 52.9 73.5 72.1 95.6 89.7 61.8 68.2
Total 100.0 100.0 100.0 100.0 100.0 100.0 100.0 100.0 100.0
N 68 68 68 68 68 68 68 68 544
92
Co
mp
arat
ive
an
alys
is o
f C
os
Inst
itu
tio
na
l Ass
essm
ent
Su
rvey
of
Co
mm
un
ity
Org
an
iza
tio
ns
(CO
s) F
ost
ered
by
Ru
ral
Su
pp
ort
Pro
gra
mm
es (
RS
Ps)
in
Pa
kis
tan
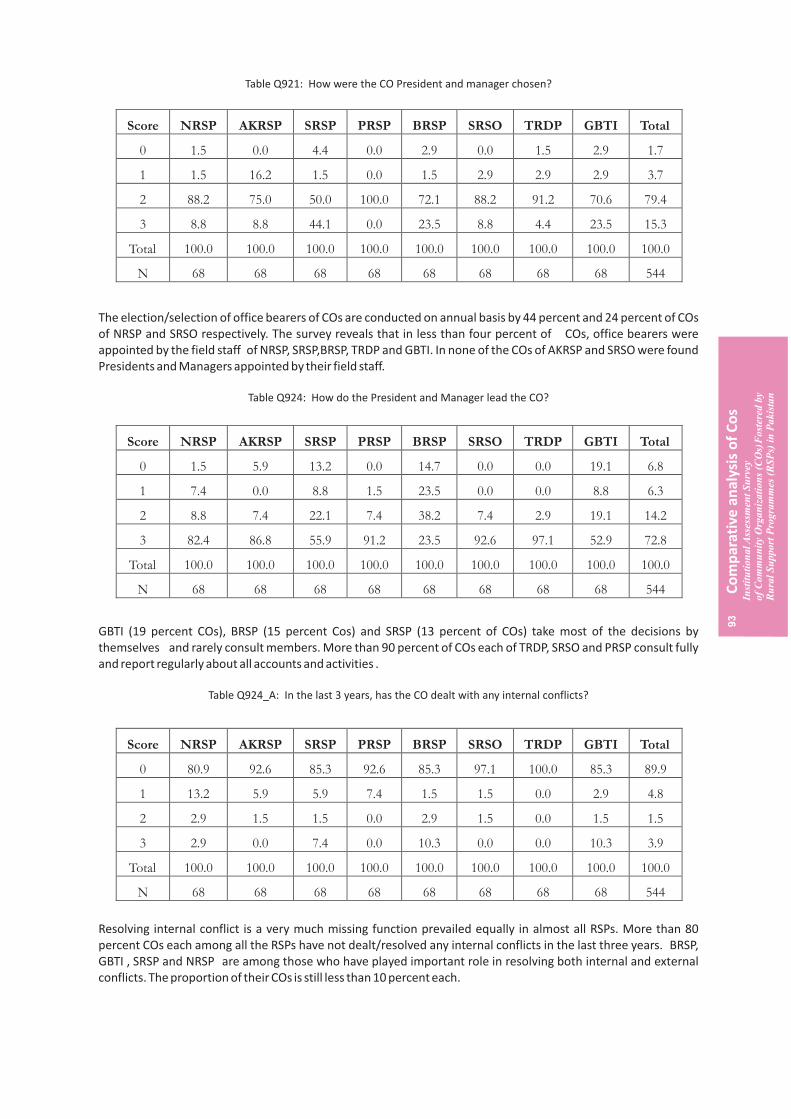
Table Q921: How were the CO President and manager chosen?
The election/selection of office bearers of COs are conducted on annual basis by 44 percent and 24 percent of COs of NRSP and SRSO respectively. The survey reveals that in less than four percent of COs, office bearers were appointed by the field staff of NRSP, SRSP,BRSP, TRDP and GBTI. In none of the COs of AKRSP and SRSO were found Presidents and Managers appointed by their field staff.
Table Q924: How do the President and Manager lead the CO?
GBTI (19 percent COs), BRSP (15 percent Cos) and SRSP (13 percent of COs) take most of the decisions by themselves and rarely consult members. More than 90 percent of COs each of TRDP, SRSO and PRSP consult fully and report regularly about all accounts and activities .
Table Q924_A: In the last 3 years, has the CO dealt with any internal conflicts?
Resolving internal conflict is a very much missing function prevailed equally in almost all RSPs. More than 80 percent COs each among all the RSPs have not dealt/resolved any internal conflicts in the last three years. BRSP, GBTI , SRSP and NRSP are among those who have played important role in resolving both internal and external conflicts. The proportion of their COs is still less than 10 percent each.
Score NRSP AKRSP SRSP PRSP BRSP SRSO TRDP GBTI Total
0 1.5 0.0 4.4 0.0 2.9 0.0 1.5 2.9 1.7
1 1.5 16.2 1.5 0.0 1.5 2.9 2.9 2.9 3.7
2 88.2 75.0 50.0 100.0 72.1 88.2 91.2 70.6 79.4
3 8.8 8.8 44.1 0.0 23.5 8.8 4.4 23.5 15.3
Total 100.0 100.0 100.0 100.0 100.0 100.0 100.0 100.0 100.0
N 68 68 68 68 68 68 68 68 544
Score NRSP AKRSP SRSP PRSP BRSP SRSO TRDP GBTI Total
0 1.5 5.9 13.2 0.0 14.7 0.0 0.0 19.1 6.8
1 7.4 0.0 8.8 1.5 23.5 0.0 0.0 8.8 6.3
2 8.8 7.4 22.1 7.4 38.2 7.4 2.9 19.1 14.2
3 82.4 86.8 55.9 91.2 23.5 92.6 97.1 52.9 72.8
Total 100.0 100.0 100.0 100.0 100.0 100.0 100.0 100.0 100.0
N 68 68 68 68 68 68 68 68 544
Score NRSP AKRSP SRSP PRSP BRSP SRSO TRDP GBTI Total
0 80.9 92.6 85.3 92.6 85.3 97.1 100.0 85.3 89.9
1 13.2 5.9 5.9 7.4 1.5 1.5 0.0 2.9 4.8
2 2.9 1.5 1.5 0.0 2.9 1.5 0.0 1.5 1.5
3 2.9 0.0 7.4 0.0 10.3 0.0 0.0 10.3 3.9
Total 100.0 100.0 100.0 100.0 100.0 100.0 100.0 100.0 100.0
N 68 68 68 68 68 68 68 68 544
Ru
ral
Su
pp
ort
Pro
gra
mm
es (
RS
Ps)
in
Pa
kis
tan
o
f C
om
mu
nit
y O
rga
niz
ati
on
s (
) b
y C
Os
Fo
ster
ed
Inst
itu
tio
na
l Ass
essm
ent
Su
rvey
93
Co
mp
arat
ive
an
alys
is o
f C
os
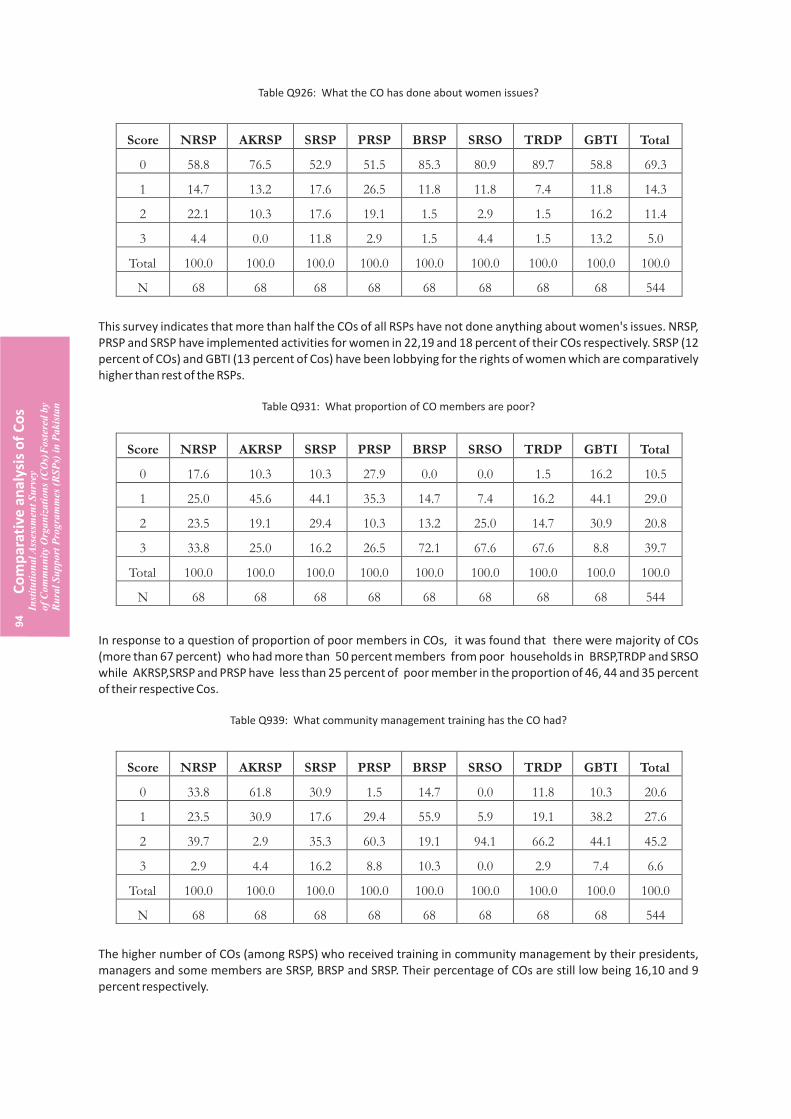
Table Q926: What the CO has done about women issues?
This survey indicates that more than half the COs of all RSPs have not done anything about women's issues. NRSP, PRSP and SRSP have implemented activities for women in 22,19 and 18 percent of their COs respectively. SRSP (12 percent of COs) and GBTI (13 percent of Cos) have been lobbying for the rights of women which are comparatively higher than rest of the RSPs.
Table Q931: What proportion of CO members are poor?
In response to a question of proportion of poor members in COs, it was found that there were majority of COs (more than 67 percent) who had more than 50 percent members from poor households in BRSP,TRDP and SRSO while AKRSP,SRSP and PRSP have less than 25 percent of poor member in the proportion of 46, 44 and 35 percent of their respective Cos.
Table Q939: What community management training has the CO had?
The higher number of COs (among RSPS) who received training in community management by their presidents, managers and some members are SRSP, BRSP and SRSP. Their percentage of COs are still low being 16,10 and 9 percent respectively.
Score NRSP AKRSP SRSP PRSP BRSP SRSO TRDP GBTI Total
0 58.8 76.5 52.9 51.5 85.3 80.9 89.7 58.8 69.3
1 14.7 13.2 17.6 26.5 11.8 11.8 7.4 11.8 14.3
2 22.1 10.3 17.6 19.1 1.5 2.9 1.5 16.2 11.4
3 4.4 0.0 11.8 2.9 1.5 4.4 1.5 13.2 5.0
Total 100.0 100.0 100.0 100.0 100.0 100.0 100.0 100.0 100.0
N 68 68 68 68 68 68 68 68 544
Score NRSP AKRSP SRSP PRSP BRSP SRSO TRDP GBTI Total
0 17.6 10.3 10.3 27.9 0.0 0.0 1.5 16.2 10.5
1 25.0 45.6 44.1 35.3 14.7 7.4 16.2 44.1 29.0
2 23.5 19.1 29.4 10.3 13.2 25.0 14.7 30.9 20.8
3 33.8 25.0 16.2 26.5 72.1 67.6 67.6 8.8 39.7
Total 100.0 100.0 100.0 100.0 100.0 100.0 100.0 100.0 100.0
N 68 68 68 68 68 68 68 68 544
Score NRSP AKRSP SRSP PRSP BRSP SRSO TRDP GBTI Total
0 33.8 61.8 30.9 1.5 14.7 0.0 11.8 10.3 20.6
1 23.5 30.9 17.6 29.4 55.9 5.9 19.1 38.2 27.6
2 39.7 2.9 35.3 60.3 19.1 94.1 66.2 44.1 45.2
3 2.9 4.4 16.2 8.8 10.3 0.0 2.9 7.4 6.6
Total 100.0 100.0 100.0 100.0 100.0 100.0 100.0 100.0 100.0
N 68 68 68 68 68 68 68 68 544
94
Co
mp
arat
ive
an
alys
is o
f C
os
Inst
itu
tio
na
l Ass
essm
ent
Su
rvey
of
Co
mm
un
ity
Org
an
iza
tio
ns
(CO
s) F
ost
ered
by
Ru
ral
Su
pp
ort
Pro
gra
mm
es (
RS
Ps)
in
Pa
kis
tan
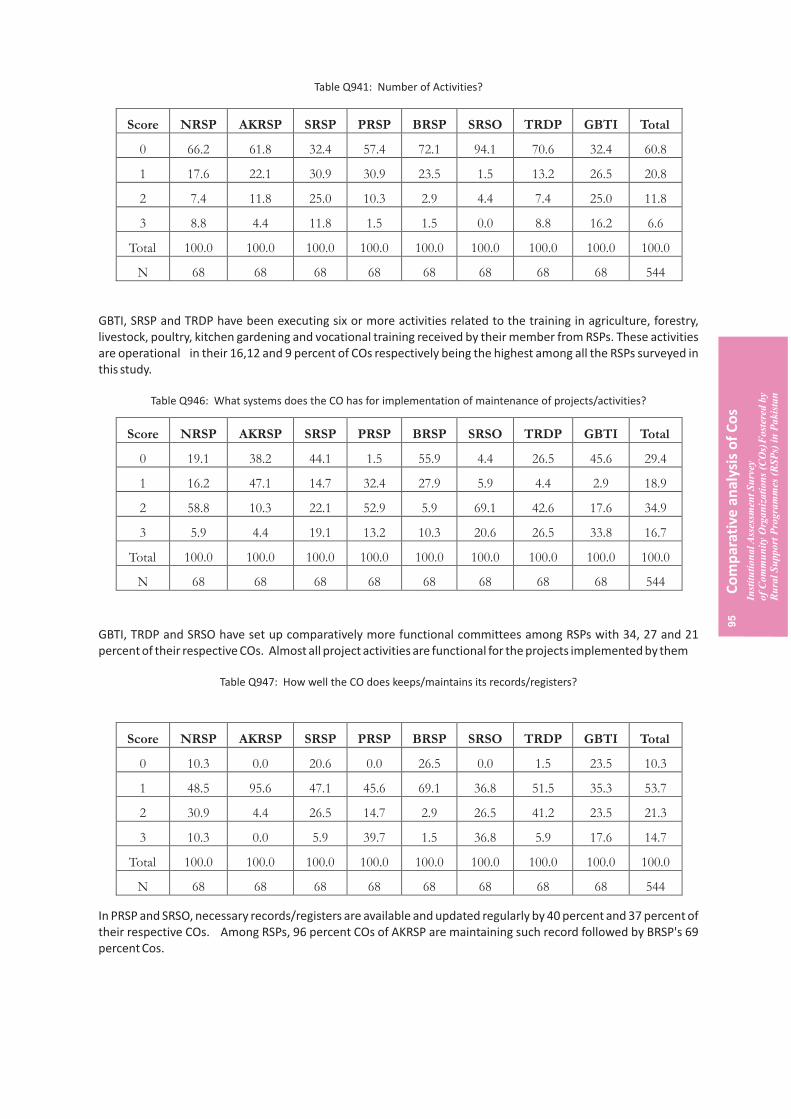
Table Q941: Number of Activities?
GBTI, SRSP and TRDP have been executing six or more activities related to the training in agriculture, forestry, livestock, poultry, kitchen gardening and vocational training received by their member from RSPs. These activities are operational in their 16,12 and 9 percent of COs respectively being the highest among all the RSPs surveyed in this study.
Table Q946: What systems does the CO has for implementation of maintenance of projects/activities?
GBTI, TRDP and SRSO have set up comparatively more functional committees among RSPs with 34, 27 and 21 percent of their respective COs. Almost all project activities are functional for the projects implemented by them
Table Q947: How well the CO does keeps/maintains its records/registers?
In PRSP and SRSO, necessary records/registers are available and updated regularly by 40 percent and 37 percent of their respective COs. Among RSPs, 96 percent COs of AKRSP are maintaining such record followed by BRSP's 69 percent Cos.
Score NRSP AKRSP SRSP PRSP BRSP SRSO TRDP GBTI Total
0 66.2 61.8 32.4 57.4 72.1 94.1 70.6 32.4 60.8
1 17.6 22.1 30.9 30.9 23.5 1.5 13.2 26.5 20.8
2 7.4 11.8 25.0 10.3 2.9 4.4 7.4 25.0 11.8
3 8.8 4.4 11.8 1.5 1.5 0.0 8.8 16.2 6.6
Total 100.0 100.0 100.0 100.0 100.0 100.0 100.0 100.0 100.0
N 68 68 68 68 68 68 68 68 544
Score NRSP AKRSP SRSP PRSP BRSP SRSO TRDP GBTI Total
0 19.1 38.2 44.1 1.5 55.9 4.4 26.5 45.6 29.4
1 16.2 47.1 14.7 32.4 27.9 5.9 4.4 2.9 18.9
2 58.8 10.3 22.1 52.9 5.9 69.1 42.6 17.6 34.9
3 5.9 4.4 19.1 13.2 10.3 20.6 26.5 33.8 16.7
Total 100.0 100.0 100.0 100.0 100.0 100.0 100.0 100.0 100.0
N 68 68 68 68 68 68 68 68 544
Score NRSP AKRSP SRSP PRSP BRSP SRSO TRDP GBTI Total
0 10.3 0.0 20.6 0.0 26.5 0.0 1.5 23.5 10.3
1 48.5 95.6 47.1 45.6 69.1 36.8 51.5 35.3 53.7
2 30.9 4.4 26.5 14.7 2.9 26.5 41.2 23.5 21.3
3 10.3 0.0 5.9 39.7 1.5 36.8 5.9 17.6 14.7
Total 100.0 100.0 100.0 100.0 100.0 100.0 100.0 100.0 100.0
N 68 68 68 68 68 68 68 68 544
Ru
ral
Su
pp
ort
Pro
gra
mm
es (
RS
Ps)
in
Pa
kis
tan
o
f C
om
mu
nit
y O
rga
niz
ati
on
s (
) b
y C
Os
Fo
ster
ed
Inst
itu
tio
na
l Ass
essm
ent
Su
rvey
95
Co
mp
arat
ive
an
alys
is o
f C
os

Annex IV:
Sample Design, Sampling Frame, Sample Size and Project Management
Team

Annex IV: Sample Design, Sampling Frame, Sample Size and Project Management Team
Sample Design
Sampling Frame
Universe
Age of COs
Sample Size and Selection Strategy
The sample design included sampling frame, sample size and sample selection criteria. A sample design must have the quality of being statistically representative with required levels of precision. The sample design must also generate information that yields the level and kind of analysis appropriate for the Project. Finally, all these qualities have to be balanced with the available financial and time constraints.
For this Survey, the Consultants adopted the following sampling methodology as proposed by the RSPN.
The recently-developed Social Mobilization Snapshot (SMS) database was used as a sampling frame for the survey. The SMS database included the list of all COs fostered by the RSPs since their inception till June 2009. The SMS database included a list of 145,588 COs. This includes 32 percent women, 61 percent men and 7 percent mix COs. The sampling frame was sub-divided for WCOs and MCOs.
The universe of the Survey consisted of all COs fostered by the RSPs in of all provinces and AJK. FATA was excluded from the scope of the survey for security reasons.
The RSPs have been fostering COs since 1983. However, in this survey COs included those formed during the period 2000-2008. Some COs taken were those formed before or after this period. The reason for taking 2008 as the cut-off year was to allow for an adequate time lag between the CO formation and its assessment. The total number of COs formed in the period 2000-2008 were 109,122 with 64.7 percent MCOs, 28.2 percent WCos and 7.1 percent mixed COs.
The unit of analysis was sex disaggregated COs within RSPs. Therefore there are 16 analytical domains of MCOs and WCOs by eight RSPs.
This survey took a minimum sample of 34 WCOs and 34 MCOs from each RSP (30 is usually considered as minimum standard for statistical analysis in case of resource constraints for representative sample). In this way, the total sample size turned out to be 544 COs. A tentative distribution of the sample size is given in Table 4. RSP-wise and gender-wise stratification of COs will allow for meaningful statistical analysis.
Initially, it was thought that a stepping interval should be created across the whole analytical domain, but it was felt that this would result in a large number of districts required to be visited creating extensive logistical operation. Therefore, it was decided that the districts within RSPs should be organized geographically and the cumulative number of COs within each district be created so that the stepping interval would select the larger districts more often with a larger number of COs. Conversely, the smaller districts with a smaller number of COs would be more likely to be excluded.
Within the selected districts, COs were selected using a systematic random sampling method of organizing COs within UCs in alphabetical ascending order with a random start.
A shadow sampling of 10 percent COs has also been generated to be used for replacements where a particular CO could not be surveyed. The reasons for a Cos not being surveyed must be clearly captured so that non-response biases could be avoided. When a sample CO could not be surveyed, a replacement was taken from the geographically nearest area in the shadow sample column in the sample spreadsheet.
According to the SMS database in the period 2000-2008, RSPs have formed COs in 97 (excluding overlapping districts) districts across the country. Keeping the RSP stratification in mind, all the districts are clustered into eight
99
Sam
ple
De
sign
, Sam
plin
g Fr
ame
,In
stit
uti
on
al A
sses
smen
t S
urv
eyo
f C
om
mu
nit
y O
rga
niz
ati
on
s (C
Os)
Fo
ster
ed b
y R
ura
l S
up
po
rt P
rog
ram
mes
(R
SP
s) i
n P
ak
ista
n

RSPs. Given the proportion of the number of districts we selected a total of 19 districts.
Figure: Study Framework
Various activities within a coordinated framework are depicted in Figure-2.1 which provides an overall outline of the process accomplished in this study.
APEX Consulting maintains a nation-wide database of enumerators, supervisors and field researchers belonging to all linguistic groups and distinct localities of Pakistan and all other administrative regions. Based on a recently-completed data collection for another nationwide survey covering all five provinces and AJK, Apex has established a database of qualified, experienced and competent field staff. In order to ensure quality of data collection, qualified and experienced field staff were deployed for this survey.
Based upon the requirements, ten survey teams (5 female and 5 male teams) were selected, representing all parts of Pakistan. Each team consisted of one supervisor, one enumerator and a coordinator who was responsible for the coordination of two teams (one female team and the other male team). Five extra field staff members were also included as back-up support. Field teams were constituted in a manner so that enumerators and supervisors had adequate knowledge and understanding of local language(s), geography and culture. This enabled the teams to conduct their field work in local languages.
After hiring female and male field survey teams, a four days training (from July 30, 2010 to August 2, 2010) was organized in Islamabad. All participants were trained at one location to ensure interactions, creating harmony and uniformity in understanding data collection methodology and procedures and attaining same wave lengths in knowledge of various technical terms of data collection instruments This training helped to reduce possible variations in recording data in the field.
Mr. Khaleel Ahmed Tetlay, Chief Operating Officer, RSPN and Mr. Fazal Ali Saadi, Specialist, Monitoring Evaluation and Research, RSPN, provided background information and a brief introduction of the project to the trainees. Syed Muhammad Sardar Ali, Senior Partner & Assignment Manager, Apex Consulting, highlighted the importance of
Selection of Field Teams
Training
Data Entry,
Cleaning
Analysis
using SPSS
Report
writing
Field Visits
Reports by
senior
members of
the team
Case Studies
Work plan
Data Collection
Schedule
Validation &
Verification Field Visits
10 percent sample
(54 Cos)
Field Visits for data
collection from 544
COs as identified by
RSPN/respective
RSPs
DDeelliivveerraabblleess
§§ IInncceeppttiioonn RReeppoorrtt
§§ DDrraafftt RReeppoorrtt
§§ FFiinnaall RReeppoorrtt
Hiring of Team Leader
(s) Data Collectors,
Supervisors and
Coordinators
QQuuaannttiittaattiivvee AAnnaallyyssiiss
4 Days Workshop on
Data Collection
Instrument
Literature
Review on
Institutional
Assessment
Ru
ral
Su
pp
ort
Pro
gra
mm
es (
RS
Ps)
in
Pa
kis
tan
o
f C
om
mu
nit
y O
rga
niz
ati
on
s (
) b
y C
Os
Fo
ster
ed
Inst
itu
tio
na
l Ass
essm
ent
Su
rvey
100
Sam
ple
De
sign
, Sam
plin
g Fr
ame
,
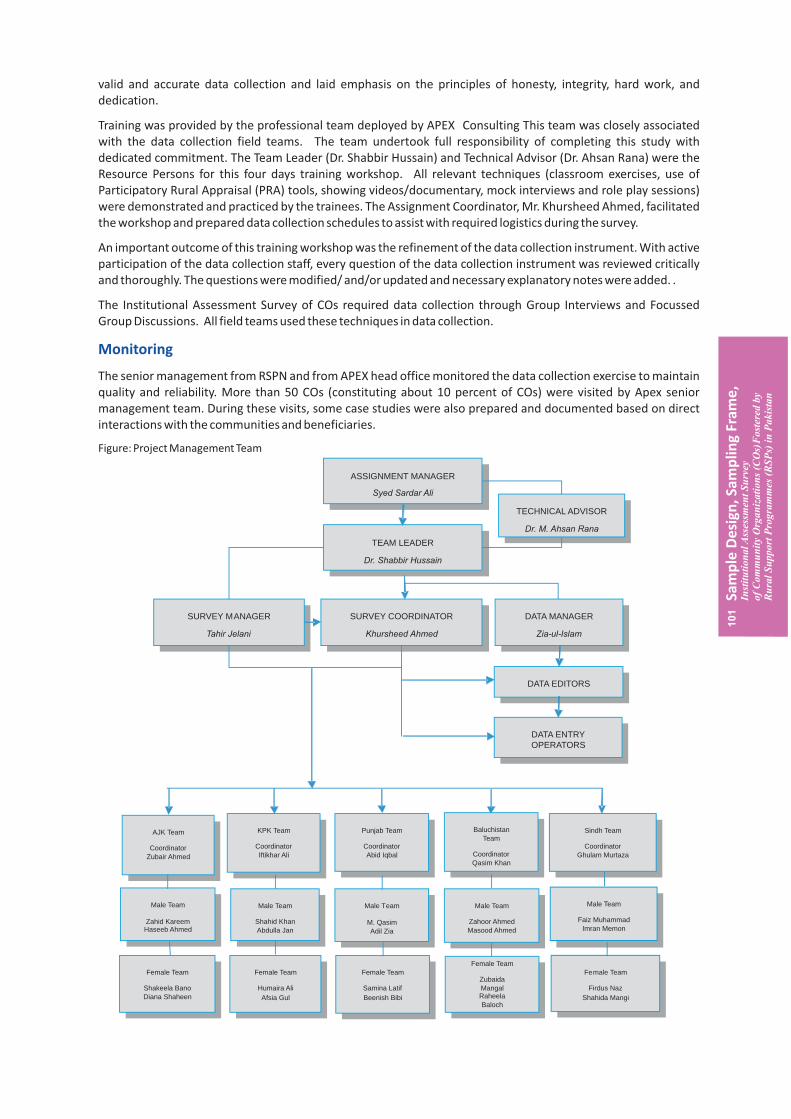
valid and accurate data collection and laid emphasis on the principles of honesty, integrity, hard work, and dedication.
Training was provided by the professional team deployed by APEX Consulting This team was closely associated with the data collection field teams. The team undertook full responsibility of completing this study with dedicated commitment. The Team Leader (Dr. Shabbir Hussain) and Technical Advisor (Dr. Ahsan Rana) were the Resource Persons for this four days training workshop. All relevant techniques (classroom exercises, use of Participatory Rural Appraisal (PRA) tools, showing videos/documentary, mock interviews and role play sessions) were demonstrated and practiced by the trainees. The Assignment Coordinator, Mr. Khursheed Ahmed, facilitated the workshop and prepared data collection schedules to assist with required logistics during the survey.
An important outcome of this training workshop was the refinement of the data collection instrument. With active participation of the data collection staff, every question of the data collection instrument was reviewed critically and thoroughly. The questions were modified/ and/or updated and necessary explanatory notes were added. .
The Institutional Assessment Survey of COs required data collection through Group Interviews and Focussed Group Discussions. All field teams used these techniques in data collection.
The senior management from RSPN and from APEX head office monitored the data collection exercise to maintain quality and reliability. More than 50 COs (constituting about 10 percent of COs) were visited by Apex senior management team. During these visits, some case studies were also prepared and documented based on direct interactions with the communities and beneficiaries.
Figure: Project Management Team
Monitoring
101
Sam
ple
De
sign
, Sam
plin
g Fr
ame
,In
stit
uti
on
al A
sses
smen
t S
urv
eyo
f C
om
mu
nit
y O
rga
niz
ati
on
s (C
Os)
Fo
ster
ed b
y R
ura
l S
up
po
rt P
rog
ram
mes
(R
SP
s) i
n P
ak
ista
n
Sindh Team
Coordinator
Ghulam Murtaza
Male Team
Faiz Muhammad
Imran Memon
Female Team
Firdus Naz
Shahida Mangi
AJK Team
Coordinator
Zubair Ahmed
Male Team
Zahid Kareem Haseeb Ahmed
Baluchistan
Team
Coordinator
Qasim Khan
KPK Team
Coordinator
Iftikhar Ali
Punjab Team
Coordinator
Abid Iqbal
Male Team
Shahid Khan
Abdulla Jan
Female Team
Humaira Ali
Afsia Gul
Male Team
M. Qasim
Adil Zia
Female Team
Samina Latif
Beenish Bibi
Male Team
Zahoor Ahmed
Masood Ahmed
Female Team
Zubaida
Mangal Raheela
Baloch
Female Team
Shakeela Bano
Diana Shaheen
TEAM LEADER
Dr. Shabbir Hussain
SURVEY COORDINATOR
Khursheed Ahmed
SURVEY MANAGER
Tahir Jelani
DATA MANAGER
Zia-ul-Islam
TECHNICAL ADVISOR
Dr. M. Ahsan Rana
ASSIGNMENT MANAGER
Syed Sardar Ali
DATA EDITORS
DATA ENTRY OPERATORS


Rurl Support ProgrammesThe RSPs’ aim is to reduce poverty and improve the quality of life of the rural poor byharnessing the potential of peple to mange their own development, through their own institutions.
Monitoring Evaluation and Research SectionRural Support Programmes Network (RSPN)House Number 7, Street 49, F-6/4, Islamabad, PakistanTel: (92-51)2822476,2821 736, Fax:(92-51)2829115 www.rspn.org
Inst
itu
tio
nal
Ass
essm
ent
Surv
ey o
f C
os
Fors
tere
d b
y R
SPs’
in P
akis
tan