institutional coherence and macroeconomic performance · pdf fileinstitutional coherence. both...
TRANSCRIPT

Socio-Economic Review (2006) 4, 69–91 doi:10.1093/SER/mwj032Advance Access publication October 18, 2005
Institutional coherence andmacroeconomic performance
Lane Kenworthy*
Department of Sociology, University of Arizona, AZ, USA
Correspondence: [email protected]
Peter Hall and David Soskice suggest that institutional coherence is conducive
to successful macroeconomic outcomes. Countries with corporate governance
arrangements, industrial relations systems and other institutions that are congru-
ent either with those of a coordinated market economy or with those of a liberal
market economy are expected to perform better, while nations with less coherent
institutional frameworks are expected to fare worse. I use a measure of
institutional coherence devised by Peter Hall and Daniel Gingerich and another I
develop here to assess the impact of institutional coherence on variation in
economic growth and employment growth across 18 affluent countries over
the period 1974–2000. The results offer little support for the institutional
coherence hypothesis.
Keywords: varieties of capitalism, institutions, economic performance, growth,
employment
JEL classification: O40, O57, P17
1. Introduction
In their ‘Introduction’ to Varieties of Capitalism, Peter Hall and David Soskice
(2001) suggest that affluent capitalist economies can usefully be grouped into
two types according to their institutional frameworks: ‘coordinated market eco-
nomies’ and ‘liberal market economies’. Neither of these types, according to Hall
and Soskice, is inherently better at generating good macroeconomic outcomes.
Instead, they posit that superior macroeconomic performance is a product of
*The data used in this paper and a set of supplementary charts are available at www.u.arizona.edu/
~lkenwor. Earlier versions were presented at the 2002 American Political Science Association annual
meeting and the 2002 Society for the Advancement of Socio-Economics annual meeting. I am grateful
to participants in those sessions, to Peter Hall, and to the Socio-Economic Review reviewers for helpful
comments.
� The Author 2005. Published by Oxford University Press and the Society for the Advancement of Socio-Economics.
All rights reserved. For Permissions, please email: [email protected]

institutional coherence. Both coordinated market economies (such as Germany
and Japan) and liberal market economies (such as the United States and the
United Kingdom) can be coherent. Both within and across the two types of eco-
nomies, countries with more coherent sets of institutions—i.e. with consistently
non-market-oriented or consistently market-oriented institutions—should
perform better.
Hall and Gingerich (2004) have recently created a measure of institutional
coherence. I use their measure, along with an alternative measure I develop
here, to assess the impact of institutional coherence on variation in economic
growth and employment growth across 18 affluent countries over the period
1974–2000. The results are not particularly supportive of the Hall–Soskice
hypothesis.
2. Varieties of capitalism and institutional coherence
Research on institutional variation across affluent nations differs in a number of
respects, one of which is the choice about whether to focus on quantitative or
qualitative variation in institutions. Many researchers prefer scales or country
rankings for the institution(s) of interest. Most studies of the effects of left gov-
ernment, wage-setting centralization/coordination and central bank independ-
ence fall into this camp. Others focus on categorical differences. Early studies
of corporatism (Crouch, 1985) and research inspired by Esping-Andersen’s
(1990) ‘three worlds’ welfare-regime typology are illustrative.
The ‘varieties of capitalism’ perspective advanced by Hall and Soskice (2001)
at first glance appears to fall squarely into the latter camp. Hall and Soskice focus
on the distinction between economic coordination that is primarily market-
based and coordination that occurs mainly via non-market institutions. They
examine five economic ‘spheres’: (a) industrial relations (bargaining over wages
and working conditions); (b) vocational training and education; (c) corporate
governance (relations between firms and their investors); (d) inter-firm relations
(between firms and their suppliers, clients and competitors); (e) relations with
employees (information-sharing, work effort incentives). Their core thesis is that
political economies tend to be characterized by ‘institutional complementarities’.
A complementarity exists when ‘the presence (or efficiency) of one institution
increases the returns from (or efficiency of) the other’ (Hall and Soskice, 2001,
p. 17). For instance, ‘long-term employment is more feasible where the financial
system provides capital on terms that are not sensitive to current profitability.
Conversely, fluid labour markets may be more effective at sustaining employ-
ment in the presence of financial markets that transfer resources readily among
endeavors thereby maintaining a demand for labour’ (Hall and Soskice, 2001,
p. 18). Because institutional complementarities generate beneficial returns,
70 L. Kenworthy
‘nations with a particular type of coordination in one sphere of the economy
should tend to develop complementary practices in other spheres as well’ (Hall
and Soskice, 2001, p. 18).
Hall and Soskice find that institutional complementarities do indeed tend
to be present in the affluent Organization for Economic Cooperation and
Development (OECD) economies, and they suggest that these economies fall
into two groups. Coordination is market-based in six ‘liberal market economies’:
Australia, Canada, Ireland, New Zealand, the United Kingdom and the United
States. Coordination is based largely on non-market or extramarket institutions
in 10 ‘coordinated market economies’: Austria, Belgium, Denmark, Finland,
Germany, Japan, The Netherlands, Norway, Sweden and Switzerland. These
two labels are somewhat misleading. Hall and Soskice make it clear that economic
processes are coordinated in both groups. The difference lies in the type of insti-
tutions doing the coordinating. A more accurate (if perhaps less elegant) set of
labels would be ‘market-coordinated economies’ and ‘non-market-coordinated
economies’. France and Italy—also Greece, Portugal, Spain and Turkey—are
‘in more ambiguous positions’ (Hall and Soskice, 2001, p. 21). They do not fit
into either group.
Hall and Soskice are not, of course, the first to assert that the institutional
frameworks of affluent OECD nations consist of two principal types.
Predecessors include Albert’s (1993) notion of a ‘Rhine model’ of organized cap-
italism versus Anglo-Saxon free-market capitalism, Crouch and Streeck’s (1997)
reference to ‘institutional capitalism’ versus market-oriented capitalism, and
Rueda and Pontusson’s (2000) distinction between ‘social market economies’
and ‘liberal market economies’. The Hall–Soskice formulation, however, is the
most clearly specified.1
Hall and Soskice, and others who have used the varieties-of-capitalism
approach, tend to be interested in it mainly as an explanatory device (rather
than for merely descriptive purposes). That is my interest as well. Taken as an
assertion of categorical difference, the varieties of capitalism perspective predicts
that institutions, policies or shocks will have different effects in the two groups of
countries. A standard way to test this hypothesis in quantitative analysis is to
interact a dichotomous ‘coordination regime’ variable with one or more other
independent variables of interest. To my knowledge, only a few such tests
have been conducted. Rueda and Pontusson (2000) find that the effect of
1 As always, questions can be raised about the classification of particular countries: Should the Nordic
and/or Mediterranean countries be separated from those of northern continental Europe? Should
Japan be distinguished from the European coordinated market economies? Should Australia and/or
New Zealand be separated from other liberal market economies? See, e.g. Amable (2003).
Institutional coherence and macroeconomic performance 71
wage-setting centralization on earnings inequality is more pronounced in social
market economies than in liberal market economies. Kenworthy (2003) finds
that the effect of earnings inequality on private-sector service employment
growth is stronger in liberal market economies than in coordinated market
economies. In a qualitative analysis, Thelen (2001) finds that globalization and
heightened competition have had different effects on developments in labour
relations in Germany, Sweden and Italy than in the United Kingdom and the
United States.
However, my aim in this paper is not to assess the merits of the Hall–Soskice
classification. Instead, I want to suggest that the varieties-of-capitalism perspect-
ive also is in the camp of comparative political economy research that focuses on
variation in degree—rather than in kind—across countries. With respect to
performance outcomes, the key claim made by Hall and Soskice (2001) is not
that there are two fundamentally distinct groups of countries, but rather
that successful macroeconomic performance is a function of institutional
coherence: ‘When firms coordinate effectively, their performance will be better,
and the result will be better overall economic performance’ (Hall and Soskice,
2001, p. 45).2
Hall and Soskice assert that institutional coherence, and thus effective
coordination, can exist in both coordinated market economies and liberal
market economies. Indeed, they refer to both Germany and the United States
as examples of political economies that are highly coherent (Hall and Soskice,
2001, pp. 21–33). Both non-market- and market-oriented institutions can work
well, in this view, provided they are coupled with complementary institutions
in other spheres: ‘Although each type of capitalism has its partisans, we are not
arguing here that one is superior to another. Despite some variation over specific
periods, both liberal and coordinated market economies seem capable of provid-
ing satisfactory levels of long-run economic performance. . .’ (Hall and Soskice,
2001, p. 21). Thus, for economic performance outcomes the decisive question
for national economies is not ‘Which group are you in?’ but rather ‘How
coherent are your institutions?’.
Note that ‘coherence’ applies both within and across economic spheres.
A country’s institutional mix is deemed more coherent, and thus better coordin-
ated, to the extent that (a) its institutions within each sphere are closer to one or
the other of the two poles (liberal market or coordinated market) rather than in
between and (b) its institutions are consistent across spheres. Incoherence can be
a product either of being in the middle within each sphere or of having liberal
2 In the terminology suggested by Hopner (2005), this is a claim that institutional coherence increases
the benefits from institutional complementarity.
72 L. Kenworthy
market institutions in some spheres and coordinated market institutions in
others.
There are several precedents in the comparative political economy literature
for the notion that coherence affects national economic performance. Perhaps
the best-known is Lange and Garrett’s (1985) argument about the interaction
between labour strength and government partisanship. Lange and Garrett sugges-
ted that strong unions and wage centralization generate rapid economic growth
when coupled with leftist government, and that weak unions and decentralized
wage setting also generate fast growth when coupled with rightist government.
‘Incoherent’ arrangements—strong labour with rightist government, weak
labour with leftist government—were predicted to yield slower growth. In
contrast, the typical assertion, and empirical finding, in comparative political
economy research has been that the effects of the particular institution (or group
of institutions) of interest are linear. Thus, more corporatism, left government,
or central bank independence is thought to be better for rapid growth, low
unemployment or low inflation. And intermediate levels are presumed to be
better than low levels.
3. Measuring institutional coherence
To test the Hall–Soskice hypothesis, we need a measure of institutional coher-
ence. In a recent paper that considerably advances empirical assessment of the
varieties of capitalism perspective, Hall and Gingerich (2004) provide such a
measure. They develop a ‘coordination index’ that attempts to gauge the degree
to which countries rely on non-market economic institutions. (This label too is
somewhat misleading; it would be better labeled a ‘non-market coordination
index’ or ‘strategic coordination index’.) The index is created via factor analysis
of six indicators, each measured as of the early- or mid-1990s (Hall and
Gingerich, 2004, p. 11): (a) shareholder power (‘legal protection and likely influ-
ence over firms of ordinary shareholders relative to managers or dominant share-
holders’); (b) dispersion of control (‘how many firms in the country are widely
held relative to the number with controlling shareholders’); (c) size of the stock
market (‘market valuation of equities on the stock exchanges of a nation as a
percentage of its gross domestic product’); (d) level of wage coordination (‘level
at which unions normally coordinate wage claims and employers coordinate
wage offers’); (e) degree of wage coordination [‘degree to which wage bargaining
is (strategically) coordinated by unions and employers’]; (f) labour turnover
(‘number of employees who had held their jobs for less than one year as a per-
centage of all employees’). The factor analysis yielded a single factor, which is
highly correlated with each of these six indicators.
Institutional coherence and macroeconomic performance 73

The country scores are shown here in Table 1. They are the factor scores,
adjusted to vary between zero and one. Countries with a high or low score are
those deemed to have the most coherent institutional framework. Hall and
Gingerich enter this variable into economic growth regressions in curvilinear
form—the variable itself and its square. They predict, and find, faster rates
of growth over the period 1971–97 in countries with high or low levels of the
variable (Hall and Gingerich, 2004, pp. 22–9).
Hall and Gingerich’s attempt to utilize ‘hard’ indicators in measuring institu-
tional coherence is laudable, as it reduces the influence of subjective judgment.
And their factor analysis suggests strongly that types of corporate governance
arrangements and industrial relations systems do tend to cohere in a number
of countries (see also Hopner, 2005). However, as a measure of institutional
coherence their coordination index has several problematic features. One is
that the six indicators are measured as of 1990–95, creating a potential time-
ordering problem (the effect precedes the cause) in attempting to explain
performance outcomes over the past several decades. More important, the six
indicators used in the factor analysis cover only three of the five spheres
Table 1 Indexes of coordination/cooperation
Hall-Gingerich coordination index,1990–95
Hicks-Kenworthy cooperationindex, 1960–89
Austria 1.00 Japan 0.82
Germany 0.95 Norway 0.75
Italy 0.87 Sweden 0.74
Norway 0.76 Austria 0.70
Belgium 0.74 Finland 0.68
Japan 0.74 Germany 0.66
Finland 0.72 Denmark 0.58
Denmark 0.70 Belgium 0.56
France 0.69 Switzerland 0.44
Sweden 0.69 The Netherlands 0.43
The Netherlands 0.66 Italy 0.42
Switzerland 0.51 France 0.28
Australia 0.36 Australia 0.14
Ireland 0.29 New Zealand 0.13
New Zealand 0.21 United Kingdom 0.10
Canada 0.13 Ireland 0.08
United Kingdom 0.07 United States 0.07
United States 0.00 Canada 0.06
Note: For data definitions and sources, see the Appendix section.
74 L. Kenworthy

highlighted by Hall and Soskice (2001). The first three of Hall and Gingerich’s
indicators focus on corporate governance, the fourth and fifth on industrial
relations, and the sixth on relations with employees. Two of the five Hall–
Soskice spheres, vocational training/education and inter-firm relations, are not
represented at all. And one of the five spheres, corporate governance, accounts
for half of the six indicators. It is quite possible that, across countries, institutions
in the other two spheres are relatively closely correlated with those in the spheres
of corporate governance and industrial relations/wage setting. If that is the case,
the Hall–Gingerich index may be fairly accurate. Yet there certainly is room for
skepticism.
Although the coordination index arrays countries more or less as the Hall–
Soskice dichotomous classification would lead us to expect, there are several
surprises. One is that Japan, which is frequently cited as an example of a highly
coherent non-market-coordinated economy (e.g. Aoki, 1988; Dore, 1997), scores
in the middle of the pack among the ‘high coordination’ countries. Another is
that Italy and (to a lesser extent) France have relatively high scores. These two
countries are classified as ‘ambiguous’ by Hall and Soskice (2001, p. 21), which
suggests that their scores ought to be in the middle.
For purposes of comparison, I also include in Table 1 a ‘cooperation index’
calculated from data in Hicks and Kenworthy (1998). This is based on a
scoring of the degree of cooperation in nine spheres: (a) relations among firms
across industries; (b) relations among unions; (c) relations between the state
and interest groups; (d) relations among firms and investors; (e) relations among
firms and suppliers; (f) relations among competing firms; (g) relations between
labour and management; (h) relations among workers; and (i) relations among
functional departments within firms. For each sphere, in each year from 1960
to 1989, each nation was scored 0, 0.5, or 1—representing weak, moderate and
strong cooperation, respectively. The scores were then averaged to form the
index, which ranges from 0 to 1. These scores are subjective. They were created
based on the authors’ reading of secondary and primary sources.
The Hall–Gingerich and Hicks–Kenworthy indexes are relatively consistent
with one another. Indeed, they correlate at 0.85. Among the Hall–Soskice coord-
inated market economies (what I refer to here as non-market-coordinated
economies), the main differences are that Japan and Sweden score higher and
Germany and Austria score lower on the Hicks–Kenworthy index than on the
Hall–Gingerich index. Italy (and to a lesser degree France) scores in the middle
on the Hicks–Kenworthy index, which is more consistent with the assessment
of Hall and Soskice (2001, p. 21).
An alternative is to take a ‘softer’—more subjective—approach to measuring
institutional coherence. Doing so reduces the reliability of the measure, but
may heighten its validity. I attempt to create a simple ranked grouping of
Institutional coherence and macroeconomic performance 75

countries in terms of their degree of institutional coherence. Because of the
paucity of hard data and the lack of clarity regarding how to weight various
indicators that do exist, I use just three groups: high coherence, intermediate
coherence and low coherence.
I focus on the five spheres identified by Hall and Soskice (2001) as critical in
differentiating modern political economies. Other spheres could be added—e.g.
relations between divisions/departments within firms and relations between
firms and the government. But the Hall–Soskice five are, in my view, reasonable
enough. Like Hall and Gingerich (2004), I ignore changes in the degree of coher-
ence within countries over time and focus on differences across countries.
In order to make this simplification justifiable, I focus on the period since the
mid-1970s. I include 18 OECD countries (abbreviations listed in parentheses):
Australia (Asl), Austria (Aus), Belgium (Bel), Canada (Can), Denmark (Den),
Finland (Fin), France (Fr), Germany (Ger), Ireland (Ire), Italy (It), Japan (Ja),
The Netherlands (Nth), New Zealand (NZ), Norway (Nor), Sweden (Swe),
Switzerland (Swi), the United Kingdom (UK) and the United States (US).
Table 2 shows two measures of institutional coherence. In the first column is
a ‘linearized’ version of the Hall–Gingerich coordination index: the index is
transformed so that more coherent countries have higher scores and less coherent
Table 2 Measures of institutional coherence
Hall–Gingerich institutionalcoherence index
Kenworthy institutionalcoherence ranked grouping
Austria 1.00 High
United States 1.00 High
Germany 0.90 High
United Kingdom 0.86 High
Canada 0.74 High
Italy 0.74 Low
New Zealand 0.58 Intermediate
Norway 0.52 High
Belgium 0.48 Intermediate
Japan 0.48 High
Finland 0.44 Intermediate
Ireland 0.42 Low
Denmark 0.40 Intermediate
France 0.38 Low
Sweden 0.38 High
The Netherlands 0.32 Low
Australia 0.28 Intermediate
Switzerland 0.02 Low
Note: For data definitions and sources, see the Appendix section.
76 L. Kenworthy

countries have lower scores (see the Appendix section for details). I refer to this as
the ‘Hall–Gingerich institutional coherence index’.
My ranked grouping is shown in the second column. Surely Germany, Austria,
Japan, the United States and the (post-1979) United Kingdom should be classi-
fied as highly coherent. Most observers would probably add Sweden, Norway
and Canada to this group. The only one of these eight countries that is scored
significantly differently on the Hall–Gingerich institutional coherence index is
Sweden, which is lower on that index than might have been expected. In contrast,
on the Hicks–Kenworthy cooperation index (Table 1) Sweden scores near the
top, behind only Japan and Norway.
France and Italy seem clearly to belong in the low-coherence group. As noted
earlier, Hall and Soskice consider these to be ‘ambiguous’ cases, and I fully con-
cur. Italy is less coherent than other affluent countries in terms of its deep divi-
sions between north and south, between the formal and informal economies,
and between large and small firms. The French economy has been characterized
by a unique mix of close and stable relationships, short-term atomistic ties and
heavy-handed government intervention.
I include three other countries in the low-coherence group: The Netherlands,
Switzerland and Ireland. The Netherlands is in certain respects a paradigmatic
coordinated market economy. This applies in particular to its tradition of
relatively coordinated wage setting (formally centralized through the 1970s,
informally centralized since then). Yet investor–firm relationships and relations
among companies and their suppliers have tended to be comparatively short-
term and arms-length (van Iterson and Olie, 1992, pp. 102–3, 109–10; Kurzer,
1993, pp. 50, 122, 146–7). With respect to relations with employees, median
job tenure in The Netherlands is closer to the liberal market economies than to
the coordinated market economies (Estevez-Abe et al., 2001, p. 170). Switzerland
has a high level of wage coordination (Soskice, 1990) and close relationships
between firms (Porter, 1990, pp. 319–24), but little employment protection
and relatively short median job tenure (Blaas, 1992, p. 369; Estevez-Abe et al.,
2001, pp. 165, 170). The Hall–Gingerich institutional coherence index
scores The Netherlands and Switzerland as among the least coherent countries
(Table 2).
What about Ireland? In terms of corporate governance and interfirm relations,
Ireland is a typical ‘liberal market economy’. But beginning in the late 1980s and
continuing throughout the 1990s, it has had a highly coordinated system of wage
setting (Baccaro and Simoni, 2004). In addition, Ireland has a higher level of
employment protection than other liberal market economies and longer median
job tenure (Estevez-Abe et al., 2001, pp. 165, 168, 170). Why, then, does Ireland
not score lower on the Hall–Gingerich institutional coherence index? The main
reason is that the wage coordination indicators used in Hall and Gingerich’s
Institutional coherence and macroeconomic performance 77
factor analyses do not include the 1990s. One, from Layard et al. (1991), is based
on the 1980s and the other, from the OECD (1997), provides no score at all for
Ireland. Were the extensive Irish wage coordination during the late 1980s and
the 1990s taken into account, Ireland would almost certainly move down on
the Hall–Gingerich institutional coherence index to join Switzerland and
The Netherlands at the bottom.
I score the remaining five countries—Belgium, Denmark, Finland, Australia
and New Zealand—as intermediate. The first three are classified by Hall and
Soskice (2001) as coordinated market economies and the latter two as liberal
market economies. However, these countries tend to be less coherent in their
institutional mix than nations such as Japan and the United States. At the same
time, they are less incoherent than France, Ireland, Italy, The Netherlands and
Switzerland.
Plainly there is room for disagreement about the assignment of particular
countries. Yet I believe the ranked grouping shown in Table 2 is the one most
consistent with the discussion in Hall and Soskice (2001), with the Hall–
Gingerich (2004) and Hicks–Kenworthy (1998) indexes, and with my reading
of the comparative and case study literatures. The measurement approach pur-
sued by Hall and Gingerich has considerable merit, in that they rely mainly on
‘hard’ indicators. This seems to me, however, to come at potentially considerable
cost in terms of validity. One of the five spheres emphasized by Hall and Soskice,
corporate governance, accounts for half of the indicators used to create the
Hall–Gingerich factor analytical index; and two of the five Hall–Soskice spheres
are not represented at all. Of course, there is no perfectly accurate measure of
institutional coherence. But given the limited available data and the lack of clarity
regarding how to properly weight indicators that do exist, a ranked grouping
along the lines of that in Table 2 may be preferable.
4. The impact of institutional coherence on macroeconomicperformance
The three most commonmeasures of macroeconomic performance are economic
growth, employment (or unemployment) and inflation. Owing to financial
globalization and the requirements for European monetary integration, there
was relatively little cross-country variation in inflation rates in the 1990s. I
therefore focus on growth and employment.
Economic growth can be measured in various ways, including growth of real
gross domestic product (GDP), growth of real GDP per capita and growth of
real GDP per employed person. Hall and Gingerich use growth of nominal
GDP per capita, but they control for inflation in their regressions, so in effect
their measure is the second: growth of real GDP per capita. I focus on the
78 L. Kenworthy

third: growth of real GDP per employed person. Commonly referred to as
‘productivity growth’, it is perhaps the best macro-level indicator of efficiency.
I also show (in Table 3) results for growth of real GDP per capita, which do
not differ substantially.
Employment is measured as employed persons as a share of the population
aged 15–64. I focus on growth of employment.
I examine the post-‘golden age’ period of 1974–2000. This covers three com-
plete business cycles—1974–79, 1980–89 and 1990–2000—which I also examine
separately to see if there have been period-specific patterns. For the full 1974–
2000 period I show the data in scatterplot form, in Figures 1–4. I also present
regression results in Table 3. For the subperiods I show only the regression
results. Scatterplots for the subperiods are available at www.u.arizona.edu/
�lkenwor, as are all of the data used in the analyses.
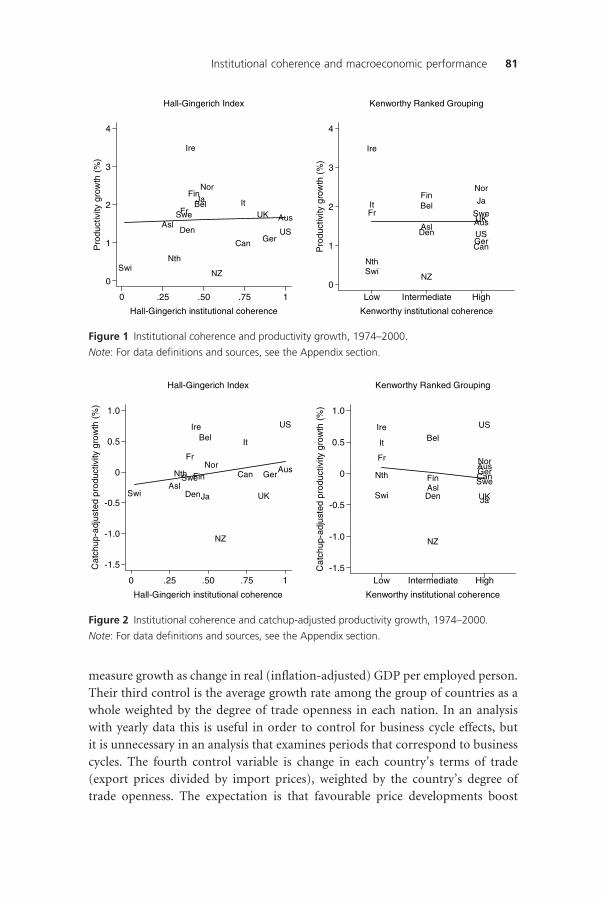
Figure 1 shows two scatterplots, each with the average rate of productivity
growth over 1974–2000 on the vertical axis and a measure of institutional
coherence (from Table 2) on the horizontal axis. The first chart uses the Hall–
Gingerich institutional coherence index. The institutional coherence hypothesis
predicts a positive relationship: productivity growth should be higher in coun-
tries scoring high on the index. But there is no indication of a positive associ-
ation. The regression line is essentially flat. And as reported in Table 3, the R2
is 0.00. The second chart in Figure 1 substitutes my institutional coherence
ranked grouping for the Hall–Gingerich index. Again there is no association.
The regression coefficients in Table 3 indicate that in the 1974–79 period
productivity growth is positively associated with the Hall–Gingerich measure
but negatively associated with my measure. However, these associations are quite
weak.
Hall and Gingerich’s (2004) analysis is based on annual data rather than per-
iod averages. There are two advantages to using yearly data. One is that it permits
a control for ‘fixed effects’ (‘unobserved heterogeneity’)—stable country-specific
factors, such as culture or geography, which may be correlated with the
independent variable of interest. But the fixed effects concern is that an apparent
relationship between an independent variable and the outcome may be spurious.
This is an issue only if the analyses do suggest a relationship between the
independent variable and the outcome. The patterns in Figure 1 do not suggest
a relationship, so there is no particular reason to worry about the lack of control
for fixed effects.
The second advantage to yearly data is that it greatly increases the number of
observations, allowing use of a larger number of control variables. Here, however,
the number of observations is not a critical factor. Hall and Gingerich include five
control variables in their regressions. Two of them—inflation and the share of the
population younger than age 15 and older than age 64—are unnecessary if we
Institutional coherence and macroeconomic performance 79

Table 3 Regression results: estimated impact of institutional coherence on productivity growth,
per capita GDP growth, and employment growth
Hall–Gingerichinstitutionalcoherence index
Kenworthyinstitutional coherenceranked grouping
Coefficient R2 Coefficient R2
Economic growth
Productivity growth
1974–2000 0.15 0.00 0.01 0.00
1974–9 0.31 0.00 �0.35 0.01
1980–9 0.32 0.01 0.08 0.00
1990–2000 �0.15 0.00 0.09 0.00
Catchup-adjusted productivity growth
1974–2000 0.38 0.05 �0.18 0.03
1974–9 0.52 0.02 �0.51 0.04
1980–9 0.69 0.07 �0.15 0.01
1990–2000 0.23 0.01 �0.03 0.00
Per capita GDP growth
1974–2000 0.42 0.02 �0.01 0.00
1974–9 1.56 0.12 0.53 0.03
1980–9 0.07 0.00 0.21 0.03
1990–2000 0.12 0.00 �0.49 0.03
Catchup-adjusted per capita GDP growth
1974–2000 �0.05 0.00 �0.02 0.00
1974–9 0.98 0.08 0.51 0.05
1980–9 0.03 0.00 0.27 0.05
1990–2000 0.05 0.00 �0.11 0.00
Employment growth
Employment growth
1974–2000 0.03 0.00 0.06 0.00
1974–9 0.97 0.12 0.94 0.28
1980–9 �0.28 0.02 0.26 0.03
1990–2000 �0.20 0.01 �0.71 0.05
Catchup-adjusted employment growth
1974–2000 �0.10 0.01 0.08 0.01
1974–9 0.91 0.10 0.97 0.02
1980–9 �0.20 0.01 0.10 0.01
1990–2000 �0.50 0.07 �0.24 0.04
Note: Unstandardized coefficients from bivariate OLS regressions. Both of the institutional coherence measuresrange from zero to one. For data definitions and sources, see the Appendix section.
80 L. Kenworthy
measure growth as change in real (inflation-adjusted) GDP per employed person.
Their third control is the average growth rate among the group of countries as a
whole weighted by the degree of trade openness in each nation. In an analysis
with yearly data this is useful in order to control for business cycle effects, but
it is unnecessary in an analysis that examines periods that correspond to business
cycles. The fourth control variable is change in each country’s terms of trade
(export prices divided by import prices), weighted by the country’s degree of
trade openness. The expectation is that favourable price developments boost
Asl
Aus
Bel
Can
Den
Fin
Fr
Ger
Ire
It
Ja
Nth
NZ
Nor
Swe
Swi UK
US
-1.5
-1.0
-0.5
0
0.5
1.0
Cat
chup
-adj
uste
dpr
oduc
tivity
grow
th(%
)
0 .25 .50 .75 1
Hall-Gingerich institutional coherence
Hall-Gingerich Index
Asl
Aus
Bel
Can
Den
Fin
Fr
Ger
Ire
It
Ja
Nth
NZ
Nor
Swe
Swi UK
US
-1.5
-1.0
-0.5
0
0.5
1.0
Cat
chup
-adj
uste
dpr
oduc
tivity
grow
th(%
)
Low Intermediate High
Kenworthy institutional coherence
Kenworthy Ranked Grouping
Figure 2 Institutional coherence and catchup-adjusted productivity growth, 1974–2000.
Note: For data definitions and sources, see the Appendix section.
AslAus
Bel
Can
Den
Fin
Fr
Ger
Ire
ItJa
Nth
NZ
Nor
Swe
Swi
UK
US
0
1
2
3
4
Pro
duct
ivity
grow
th(%
)
0 .25 .50 .75 1
Hall-Gingerich institutional coherence
Hall-Gingerich Index
Asl Aus
Bel
Can
Den
Fin
Fr
Ger
Ire
It Ja
Nth
NZ
Nor
Swe
Swi
UK
US
0
1
2
3
4
Pro
duct
ivity
grow
th(%
)
Low Intermediate High
Kenworthy institutional coherence
Kenworthy Ranked Grouping
Figure 1 Institutional coherence and productivity growth, 1974–2000.
Note: For data definitions and sources, see the Appendix section.
Institutional coherence and macroeconomic performance 81
growth. However, this variable has the ‘wrong’ sign in almost all of the Hall–
Gingerich regressions. The same was true in regressions I tried, and the variable’s
inclusion had no impact on the results for the institutional coherence measures
(not shown here). Hence, this control seems unnecessary.
The fifth control variable used by Hall and Gingerich is each country’s level
of economic output in the initial year. Among the rich OECD nations there
has been a strong ‘catchup’ process operating since World War II, whereby less
affluent nations tend to grow faster than richer ones because the former are
AslAus
Bel
Can
Den
Fin
FrGer
Ire
It
Ja
Nth
NZ
Nor
Swe
Swi
UK
US
-0.8
-0.4
0
0.4
0.8
Cat
chup
-adj
uste
dem
ploy
men
tgro
wth
(%)
0 .25 .50 .75 1
Hall-Gingerich institutional coherence
Hall-Gingerich Index
AslAus
Bel
Can
Den
Fin
Fr Ger
Ire
It
Ja
Nth
NZ
Nor
Swe
Swi
UK
US
-0.8
-0.4
0
0.4
0.8
Cat
chup
-adj
uste
dem
ploy
men
tgro
wth
(%)
Low Intermediate High
Kenworthy institutional coherence
Kenworthy Ranked Grouping
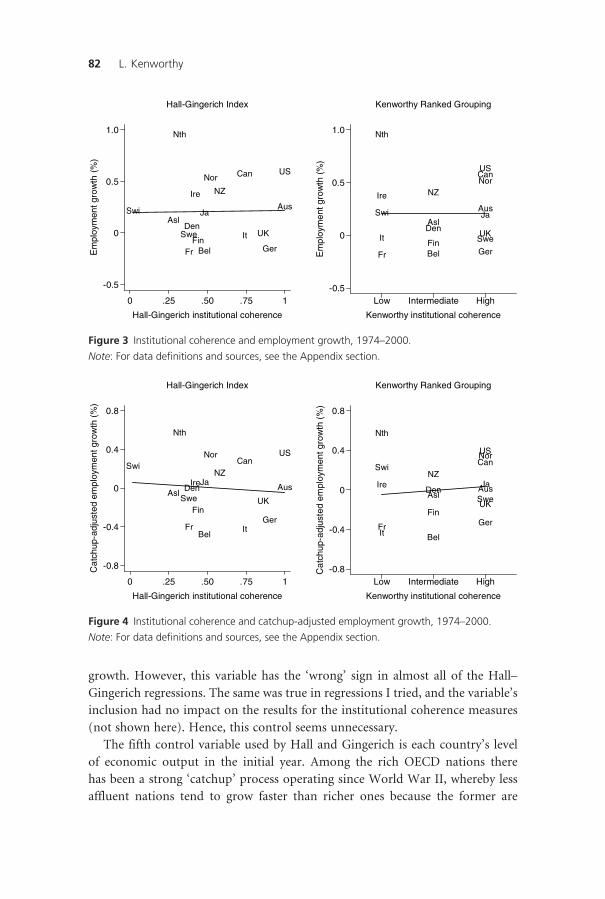
Figure 4 Institutional coherence and catchup-adjusted employment growth, 1974–2000.
Note: For data definitions and sources, see the Appendix section.
Asl
Aus
Bel
Can
Den
FinFr Ger
Ire
It
Ja
Nth
NZ
Nor
Swe
Swi
UK
US
-0.5
0
0.5
1.0
Em
ploy
men
tgro
wth
(%)
0 .25 .50 .75 1
Hall-Gingerich institutional coherence
Hall-Gingerich Index
Asl
Aus
Bel
Can
Den
FinFr Ger
Ire
It
Ja
Nth
NZNor
Swe
Swi
UK
US
-0.5
0
0.5
1.0
Em
ploy
men
tgro
wth
(%)
Low Intermediate High
Kenworthy institutional coherence
Kenworthy Ranked Grouping
Figure 3 Institutional coherence and employment growth, 1974–2000.
Note: For data definitions and sources, see the Appendix section.
82 L. Kenworthy

able to benefit from technological developments and larger markets in the latter
(Baumol et al., 1994). Thus, for instance, Ireland stands out in the charts in
Figure 1 as having had by far the fastest productivity growth, but that could be
due to the fact that as of the mid-1970s it was by far the poorest of these coun-
tries. Why might this affect the association between institutional coherence and
productivity growth? Cross-country differences in institutional coherence have
persisted over long periods of time; those with greater coherence today may
also have had greater coherence half a century ago. If so, and if institutional
coherence has in fact contributed to faster productivity growth, countries with
greater institutional coherence may have had higher levels of productivity enter-
ing the 1970s than countries with less coherent institutions. The catchup effect
would permit countries with less institutional coherence and, therefore, lower
‘initial’ productivity levels to enjoy faster productivity growth during the ensuing
decades than their level of institutional coherence would otherwise make pos-
sible. This catchup boost might offset their otherwise less rapid growth rates,
making it appear in the raw data as though institutional coherence had no impact
on productivity growth.
Figure 2 shows another set of scatterplots with institutional coherence on the
horizontal axis, but now the vertical axis measure is productivity growth adjusted
for catchup effects. The vertical-axis data are residuals from regressions of pro-
ductivity growth on initial year level of productivity. (For the 1974–2000 period
overall and for each business cycle the regression coefficient for the initial year
level is negative and substantively strong, suggesting that catchup effects were
relevant.) The first chart uses the Hall–Gingerich index. Here there is some
indication of the predicted positive relationship between institutional coherence
and productivity growth. The magnitude of the estimated effect, while by no
means large, is not inconsequential. In a regression of catchup-adjusted produc-
tivity growth on the Hall–Gingerich institutional coherence index, the regression
coefficient is 0.38 (Table 3), suggesting that, on average, a county scoring one on
the index enjoyed a rate of productivity growth about four-tenths of a percentage
point faster than a country scoring zero on the index. Over a long enough period
of time this seemingly small difference can matter. In a country with an annual
growth rate of 1.6%, productivity will double in 45 years, whereas with a growth
rate of 2.0% it will double in 36 years. However, the association is confined to the
1970s and 1980s. More important, it is heavily dependent on the US case: if the
United States is omitted, the regression coefficient drops to just 0.09 and the R2
is 0.00 (not shown here).
The second chart in Figure 2 replaces the Hall–Gingerich institutional
coherence index with my ranked grouping. Here there is no positive relationship.
This is a product of the different scoring of particular countries. Several countries
that had not-so-high rates of catchup-adjusted productivity growth, such as
Institutional coherence and macroeconomic performance 83

Sweden and Japan, are scored intermediate on the Hall–Gingerich measure but
high on my measure. And several countries that had comparatively high rates
of catchup-adjusted productivity growth, such as Ireland and Italy, are scored
intermediate on the Hall–Gingerich measure but low on my measure. I leave it
to others to decide which of the two measures of institutional coherence is pre-
ferable. The point is simply that the conclusion that institutional coherence is
good for economic growth appears to hinge not only on the years examined
and on the inclusion of the United States but also on the coding of particular
countries.
Figure 3 performs the same exercise for employment growth. The first chart
shows the average annual rate of growth in employment over 1974–2000 by the
Hall–Gingerich institutional coherence index. Again the institutional coherence
hypothesis predicts a positive relationship, but again it finds no support. As the
regression coefficients in Table 3 indicate, in the 1974–79 period we do see the
expected pattern. But the fit is poor: the R2 for a regression of 1974–79 employ-
ment growth on the institutional coherence index is just 0.12, and it drops to
0.03 if Switzerland is removed (not shown here).
In the second chart in Figure 3 the Hall–Gingerich institutional coherence
measure is replaced with my measure. Again there is no indication of an associ-
ation in either direction. The regression coefficients reported in Table 3 suggest
evidence of a positive association in the 1974–79 period, and here that association
does not hinge on Switzerland’s inclusion. However, this positive effect appears
to have been offset by a similarly strong negative association between coherence
and employment growth in the 1990–2000 period.
In Figure 4 employment growth is adjusted for initial levels of employment,
since countries that began with low employment rates may have found it easier
to achieve increases. This produces very little change in the patterns for either
the Hall–Gingerich institutional coherence measure or my institutional coher-
ence measure. The regression lines in the charts (and the coefficients in Table 3)
suggest a possible negative relationship for the Hall–Gingerich measure and a
possible positive relationship for my measure, but these associations, if genuine,
are extremely weak.
Aside from the initial level of productivity or employment, there are additional
factors that should perhaps be controlled for in analyses of productivity growth
and employment growth. But a number of them would be considered endogen-
ous in the varieties of capitalism approach. For instance, educational attainment
among the working-age population could well influence productivity growth, but
in the varieties of capitalism framework this is likely to be affected by the type of
economic coordination in the country: coordinated market economies tend to
rely more on firm-specific skills acquired through on-the-job training, whereas
liberal market economies rely more on general skills acquired through the school
84 L. Kenworthy

system (Hall and Soskice, 2001). Employment protection regulations and the
generosity of the unemployment benefit system may influence employment
growth, but these too are expected to be a function of the type of coordination
(Estevez-Abe et al., 2001).
I estimated a series of regressions with various combinations of four control
variables that seem less likely to be endogenous and potentially likely to alter
the association between institutional coherence and productivity growth or
employment growth: trade-adjusted changes in terms of trade (discussed earlier),
real interest rates, tax revenues (as a share of GDP) and left government. How-
ever, none of these variables is correlated with the Hall–Gingerich institutional
coherence index (r ¼ 0.00, 0.10, �0.08, �0.17 over 1974–2000), with my institu-
tional coherence measure (r ¼ 0.14, 0.09, �0.01, 0.11 over 1974–2000), or with
the two macroeconomic performance measures. Hence, controlling for them
did not substantively alter the regression results for either of the institutional
coherence variables (not shown here; available on request).
On the whole, then, patterns of productivity growth and employment growth
among these 18 countries over the period 1974–2000 appear to offer little, if any,
support for the notion that institutional coherence—as conceptualized by Hall
and Soskice (2001) and Hall and Gingerich (2004)—has contributed to healthy
macroeconomic performance.3
5. Future research on coherence and performance
Institutional coherence is certainly not the first broad, general feature of political-
economic institutions to be posited as influential for macroeconomic per-
formance outcomes in the world’s most affluent countries. Others include free
markets (Hayek, 1960; Friedman, 1962), distributional coalitions (Olson, 1982),
corporatism (Cameron, 1984; Katzenstein, 1985), flexible specialization (Piore
3One other attempt to assess the impact of institutional coherence on economic performance out-
comes is by Amable (2003, pp. 213–24). Like Hall and Gingerich, Amable uses factor analysis to create
country scores for the degree of non-market coordination in various economic spheres (product mar-
kets, the wage–labour nexus, financial systems, social protection and education). Rather than using
these coordination scores to create a measure of overall institutional coherence, Amable regresses
macroeconomic performance indicators (economic growth, productivity growth and unemployment)
on interactions between the measures of sphere-specific coordination. He finds that some of these
interactions have the expected positive sign, suggesting for instance that economic growth has been
more rapid in countries in which product market regulation and labour market regulation are either
both high or both low. However, it is not clear why we should expect only coherence between some
spheres, rather than across all spheres, to boost macroeconomic performance. If overall coherence is
what is predicted to matter, then the hypothesis is best tested using a measure of the overall degree
of coherence, as in Hall and Gingerich (2004).
Institutional coherence and macroeconomic performance 85

and Sabel, 1984), competition (Porter, 1990), social capital (Putnam, 1993),
cooperation (Kenworthy, 1995; Hicks and Kenworthy, 1998) and policy
coherence (Wilensky, 2002), to mention but a few. However, there is reason to
be skeptical about the veracity of empirical findings that appear to support
linkages between aggregated concepts such as these and aggregated outcomes
such as growth, employment and inflation. Assessing such claims requires clear
specification and testing of the purported causal mechanisms (Elster, 1989,
ch. 1; Hedstrom and Swedberg, 1996; Goldthorpe, 2001). Finding associations
may or may not tell us something interesting. I am not suggesting that aggregate
analyses are useless, but rather that they should be considered only a preliminary,
partial step in the investigation of causal linkages.
This might be a useful route for further research on the influence of institu-
tional coherence. If institutional coherence is good for macroeconomic perform-
ance, how exactly does the causal process work? Hall and Soskice (2001, p. 45)
suggest that ‘When firms coordinate effectively, their performance will be
better. . .’. Does this mean those firms will have higher productivity? If so,
that presumably can be tested, at least for firms in certain sectors.4 The evidence
reviewed here suggests no aggregate-level association between coherence and suc-
cessful macroeconomic performance. Yet if the causal pathways were investig-
ated, it might turn out that there is a beneficial effect. Such an effect could be
hidden in the analyses here due to the impact of some additional variable for
which I have not controlled. Or it could be that institutional coherence has
both positive and negative effects on productivity or employment, which offset
each other.
Another potentially fruitful avenue for empirical evaluation of the institu-
tional coherence hypothesis is exploration of the US case. Notwithstanding its
post-1999 stock market and employment declines, the American economy has
experienced comparatively strong macroeconomic performance over the past
several decades. Figure 5 shows rates of catchup-adjusted productivity growth
and catchup-adjusted employment growth over 1974–2000. On the combination
of these two measures, the position of the United States in the chart suggests that
it had the best performance record among the 18 countries. (The United States
also features well-known distributional maladies such as high poverty and
inequality.) We lack a convincing account of recent US macroeconomic success.
A host of factors surely have contributed, among them effective countercyclical
monetary policy, robust demand owing to growing personal indebtedness along
4 Ernst (2002) examines industry performance in three ‘high-coherence’ countries (Germany, Japan
and the United States), but does not analyse differences across countries that have varying degrees
of institutional coherence.
86 L. Kenworthy

with the real estate and stock market booms, and first-mover advantages in
various information technology industries. Advocates of the institutional
coherence approach might emphasize growing marketization of the American
economy since the late 1970s—most notably, deregulation of various industries,
weakening of unions and reduced commitment to job security. As Hall and
Soskice (2001, p. 49) suggest ‘Because of the bluntness of the instruments avail-
able to states and the importance of markets to these economies, deregulation
is often the most effective way to improve coordination in LMEs [liberal market
economies]’.
Yet at the same time, other developments in the US economy during
this period seemingly have heightened the importance of non-market institu-
tional coordination. Many of these developments stem from the influence of
Japanese practices on American management strategy in the 1980s and 1990s.
They include greater reliance on stable long-term relationships between firms
and suppliers, research and development alliances among competitors, and
participatory work teams and multidivisional research-design-production teams
within firms. Various accounts attribute some of the recent success of the US eco-
nomy to these developments (e.g. Angel, 1994; Applebaum and Batt, 1994;
Waterman, 1994; Hollingsworth, 1997). How does this fit in with the institu-
tional coherence perspective? Are these developments in fact consistent with
the accentuation of market-oriented coordination in the US economy? Are they
of little or no relevance in explaining recent US macroeconomic success? Or is
institutional coherence perhaps not so critical to that success?
AslAus
Bel
Can
Den
Fin
FrGer
Ire
It
Ja
Nth
NZ
Nor
Swe
Swi
UK
US
-.75
0
.75
Cat
chup
-adj
uste
dem
ploy
men
tgro
wth
(%)
-1 0 1
Catchup-adjusted productivity growth (%)
Figure 5 Catchup-adjusted productivity growth and catchup-adjusted employment growth,
1974–2000.
Note: For data definitions and sources, see the Appendix section.
Institutional coherence and macroeconomic performance 87
References
Albert, M. (1993) Capitalism Against Capitalism, London, Whurr.
Amable, B. (2003) The Diversity of Modern Capitalism, Oxford, Oxford University Press.
Angel, D. P. (1994) Restructuring for Innovation: The Remaking of the U.S. Semiconductor
Industry, New York, The Guilford Press.
Aoki, M. (1988) Information, Incentives, and Bargaining in the Japanese Economy,
Cambridge, Cambridge University Press.
Applebaum, E. and Batt, R. (1994) The New American Workplace, Ithaca, NY, ILR Press.
Baccaro, L. and Simoni, M. (2004) ‘The Irish Social Partnership and the ‘‘Celtic Tiger’’
Phenomenon’, Discussion Paper 154/2004, International Institute for Labour Studies,
Geneva, International Labour Organization (ILO). Available at www.ilo.org/inst
Baumol, W. J., Nelson, R. R. and Wolff, E. N. (eds) (1994) Convergence of Productivity,
Oxford, Oxford University Press.
Blaas, W. (1992) ‘The Swiss Model: Corporatism or Liberal Capitalism?’. In Pekkarinen, J.,
Pohjola, M. and Rowthorn, B. (eds) Social Corporatism: A Superior Economic System?,
Oxford, Clarendon Press, pp. 363–76.
Cameron, D. R. (1984) ‘Social Democracy, Corporatism, Labour Quiescence and
the Representation of Economic Interest in Advanced Capitalist Society’. In
Goldthorpe, J. H. (ed) Order and Conflict in Contemporary Capitalism, Oxford,
Clarendon Press, pp. 143–78.
Crouch, C. (1985) ‘Conditions for Trade Union Wage Restraint’. In Lindberg, L. N. and
Maier, C. S. (eds) The Politics of Inflation and Economic Stagnation, Washington DC,
Brookings Institution, pp. 105–39.
Crouch, C. and Streeck, W. (1997) ‘Introduction: The Future of Capitalist Diversity’. In
Crouch, C. and Streeck, W. (eds) Political Economy of Modern Capitalism, London,
Sage, pp. 1–18.
Dore, R. (1997) ‘The Distinctiveness of Japan’. In Crouch, C. and Streeck, W. (eds)
Political Economy of Modern Capitalism, London, Sage, pp. 19–32.
Elster, J. (1989) Nuts and Bolts for the Social Sciences, Cambridge, Cambridge University
Press.
Ernst, E. C. (2002) ‘Financial Systems, Industrial Relations, and Industry Specialization:
An Econometric Analysis of Institutional Complementarities’, Unpublished.
Esping-Andersen, G. (1990) The Three Worlds of Welfare Capitalism, Princeton, NJ,
Princeton University Press.
Estevez-Abe, M., Iversen, T. and Soskice, D. (2001) ‘Social Protection and the Formation
of Skills: A Reinterpretation of the Welfare State’. In Hall, P. A. and Soskice, D. (eds)
Varieties of Capitalism: The Institutional Foundations of Comparative Advantage, Oxford,
Oxford University Press, pp. 145–83.
Friedman, M. (1962) Capitalism and Freedom, Chicago, University of Chicago Press.
88 L. Kenworthy

Goldthorpe, J. H. (2001) ‘Causation, Statistics, and Sociology’, European Sociological
Review, 17, 1–20.
Hall, P. A. and Gingerich, D. W. (2004) ‘Varieties of Capitalism and Institutional
Complementarities in the Macroeconomy: An Empirical Analysis’, Discussion Paper
04/5, Cologne, Germany, Max Planck Institute for the Study of Societies. Available at
www.mpi-fg-koeln.mpg.de
Hall, P. A. and Soskice, D. (2001) ‘An Introduction to Varieties of Capitalism’. In
Hall, P. A. and Soskice, D. (eds) Varieties of Capitalism: The Institutional Foundations
of Comparative Advantage, Oxford, Oxford University Press, pp. 1–68.
Hayek, F. A. (1960) The Constitution of Liberty, Chicago, University of Chicago Press.
Hedstrom, P. and Swedberg, R. (1996) ‘Social Mechanisms’, Acta Sociologica, 39, 281–308.
Hicks, A. and Kenworthy, L. (1998) ‘Cooperation and Political Economic Performance in
Affluent Democratic Capitalism’, American Journal of Sociology, 103, 1631–72.
Hollingsworth, J. R. (1997) ‘The Institutional Embeddedness of American Capitalism’.
In Crouch, C. and Streeck, W. (eds) Political Economy of Modern Capitalism, London,
Sage, pp. 133–47.
Hopner, M. (2005) ‘What Connects Industrial Relations and Corporate Governance?
Explaining Institutional Complementarity’, Socio-Economic Review, 3, 331–58.
Katzenstein, P. J. (1985) Small States in World Markets, Ithaca, NY, Cornell University
Press.
Kenworthy, L. (1995) In Search of National Economic Success: Balancing Competition and
Cooperation, Thousand Oaks, CA, Sage.
Kenworthy, L. (2003) ‘Do Affluent Countries Face an Incomes-Jobs Tradeoff?’, Comparat-
ive Political Studies, 36, 1180–209.
Kurzer, P. (1993) Business and Banking: Political Change and Economic Integration in
Western Europe, Ithaca, NY, Cornell University Press.
Lange, P. and Garrett, G. (1985) ‘The Politics of Growth’, Journal of Politics, 47, 794–809.
Layard, R., Nickell, S. and Jackman, R. (1991) Unemployment, Oxford, Oxford University
Press.
OECD (1997) ‘Economic Performance and the Structure of Collective Bargaining’.
In OECD Employment Outlook, Paris, OECD, pp. 63–93.
OECD (2004a) OECD Labour Force Statistics Database. Available at www1.oecd.org/
scripts/cde/members/lfsdataauthenticate.asp
OECD (2004b) OECD Statistical Compendium, Edition 01#2004, Paris, OECD.
OECD (2004c) Revenue Statistics, 1965–2003, Paris, OECD.
Olson, M. (1982) The Rise and Decline of Nations, New Haven, CT, Yale University Press.
Piore, M. J. and Charles, F. S. (1984) The Second Industrial Divide, New York, Basic Books.
Porter, M. E. (1990) The Competitive Advantage of Nations, New York, Free Press.
Institutional coherence and macroeconomic performance 89

Putnam, R. D. (1993) ‘The Prosperous Community: Social Capital and Public Life’, The
American Prospect, Spring, pp. 35–42.
Rueda, D. and Pontusson, J. (2000) ‘Wage Inequality and Varieties of Capitalism’, World
Politics, 52, 350–83.
Soskice, D. (1990) ‘Wage Determination: The Changing Role of Institutions in Advanced
Industrialized Societies’, Oxford Review of Economic Policy, 6(4), 36–61.
Swank, D. (2002) ‘21-Nation Pooled Time-Series Data Set: Political Strength of Political
Parties by Ideological Group in Capitalist Democracies’, Department of Political
Science, Marquette University.
Thelen, K. (2001) ‘Varieties of Labor Politics in the Developed Democracies’. In Hall, P. A.
and Soskice, D. (eds) Varieties of Capitalism: The Institutional Foundations of Compar-
ative Advantage, Oxford, Oxford University Press, pp. 71–103.
van Iterson, A. and Olie, R. (1992) ‘European Business Systems: The Dutch Case’.
In Whitley, R. (ed) European Business Systems, London, Sage, pp. 98–116.
Waterman, R. H., Jr. (1994) What America Does Right, New York, Penguin Books.
Wilensky, H. L. (2002) Rich Democracies, Berkeley, University of California Press.
Appendix: variable descriptions and data sources
Catchup-adjusted employment growth. Residuals from a regression of employment
growth on level of employment in the period’s initial year.
Catchup-adjusted productivity growth. Residuals from a regression of
productivity growth on level of productivity in the period’s initial year.
Employment growth. Average annual rate of change in employed persons as a
share of the population aged 15–64. Source: Author’s calculations from data in
OECD (2004a).
Hall–Gingerich coordination index. Factor scores, adjusted to vary from zero
to one, from a factor analysis of six indicators (see the text). Measured as of
1990–95. Source: Hall and Gingerich (2004, Table 2, p. 14).
Hall–Gingerich institutional coherence index. ‘Linearized’ version of the
Hall–Gingerich coordination index. Calculated as follows: (absolute value of
[0.50 minus the Hall–Gingerich coordination index score]) divided by 0.50.
Ranges from zero to one.
Hicks–Kenworthy cooperation index. Average of scores on nine indicators of
economic cooperation (see the text). Measured over 1960–89. Source: Hicks
and Kenworthy (1998, Table 3, pp. 1642–3).
Kenworthy institutional coherence ranked grouping. See text and Table 2. Three
categories: low coherence, intermediate coherence and high coherence. Scored as
0, 0.5 and 1 when used in regressions.
Left government. Left party cabinet portfolios as a share of all cabinet port-
folios. Source: Author’s calculations from data in Swank (2002, variable: LEFTC).
90 L. Kenworthy

Per capita GDP growth. Average annual rate of change in inflation-adjusted
gross domestic product per person. Source: Author’s calculations from data in
OECD (2004b).
Productivity growth. Average annual rate of change in inflation-adjusted gross
domestic product per employed person. Source: Author’s calculations from real
GDP and consumer price data in OECD (2004b) and employment data in
OECD (2004a).
Real long-term interest rates. Yield on long-term government bonds adjusted
for inflation. Source: Author’s calculations from data in OECD (2004b).
Tax revenues. Government tax revenues as a share of GDP. Source: Author’s
calculations from data in OECD (2004c, Table 3, pp. 67–8).
Trade-adjusted change in terms of trade. Average annual rate of change in the
ratio of export prices to import prices, multiplied by exports plus imports as a
proportion of GDP. Source: Author’s calculations from data in OECD (2004b).
Institutional coherence and macroeconomic performance 91