institutional equity research q3fy19 results...
TRANSCRIPT

INSTITUTIONAL EQUITY RESEARCH
Page | 1 | PHILLIPCAPITAL INDIA RESEARCH
Q3FY19 Results Preview
Banks to contribute positively; other sector trends persist
INDIA | Result Preview
9 January 2019
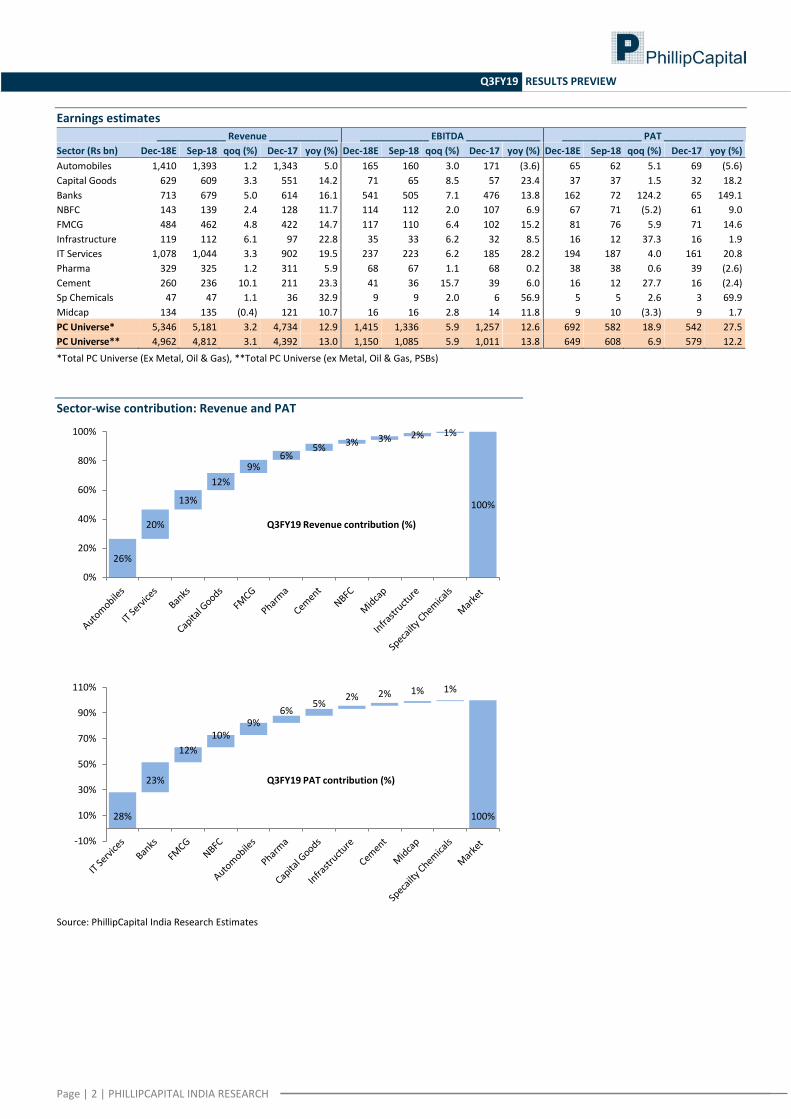
PAT growth will be driven by banks (mainly PSUs), IT, capital goods, and FMCG. We expect contraction for auto, pharma, and cement and muted performance from NBFC and infra segments. Banks will benefit from lower G-sec yields/robust trading income. NPAs are likely to drop, even if banks recognize ILFS exposure in Q3. We see robust deal-flow in IT, strong execution in capital goods. As the entire festive season was in one quarter, price hikes for the FMCG sector will also drive earnings growth for 3Q. We forecast PC-universe* EBITDA growth of 13%. 3Q: Key drivers for the PC universe:
++ Financials – Stable NIMs and strong credit growth to result in robust NII growth (+16% yoy). Higher trading incomes and gains from NPA resolutions to positively influence earnings. GNPA expected to fall, even after accounting for ILFS NPA recognition in Q3.
++Speciality chemicals – Will continue to deliver strong performance led by improved domestic and external demand scenario. Better product mix, favourable currency, and increased realisation from value-added products will drive operating performance.
+ Capital goods – Robust earnings growth to continue, led by strong operating profitability and margin expansion. Order flows to turn weak. We will be closely tracking election impact on order flow guidance, margins, and working capital.
+ FMCG – Retail and consumer discretionary companies will see strong growth vs. staples due to formalisation. Strong revenue growth due to the festive season. Margins are under pressure due to RM cost escalation.
- Automobiles – Tepid festive sales caused broad-based weakness; margins come under pressure due to higher incentives and negative leverage.
- NBFCs – Earnings growth muted at 13% due to margin contraction and moderation in AUM growth. Asset quality to remain stable.
-- Pharma – Earnings to contract by 3% due to weak operating performance. Margins to decline led by on-going price pressure in the US generics business, and higher raw material cost due to Chinese supply disruption.
GNPAs to fall, lower yields are a positive: Within financials, retail banks will continue to report strong performance with NII growth of +23% yoy. Services (NBFCs) and retail (unsecured) will keep driving credit growth. Deposit growth was also strong. MCLR rates have increased by c.10bps on average, while FD rates have increased by c.5-10bps. Slippage should remain in line with Q2FY19. Higher slippages likely from the corporate segment while those in retail and agri should moderate. Key plays: SBI, HDFC Bank, ICICI Bank, Mahindra Finance, Manappuram Finance. Capital goods – operationally strong, order inflows to decline: We estimate 18% yoy rise in earnings in Q3, but adjusting for BHEL and BDL (favourable base) this tapers to 11%, down substantially. After strong 1HFY19 (+50% yoy), we expect order inflows to contract by 21% yoy on a high base – this is because of a significant decline in new orders of L&T (ex-services -40% yoy) and BHEL (-55%), which contributed 78% of 3Q orders. Our key earnings play: Positive: ABB, TMX. Negative: L&T, BHE, VATW, COCHIN. Consumption – FMCG to gain from festive season, not automobiles: FMCG revenues to accelerate due to festive season, price hikes, recovery in CSD channel, and higher penetration. However, margins will moderate due to commodity inflation, no GST related savings. Our earnings play: Jubilant Foodworks, Titan, Nestle, Asian Paints, Marico. Broad-based weakness (in revenues and margins) expected in the auto sector. Tyre companies to see sequential margin pressure due to high-cost inventory. Our earnings play: Escorts.
PAT growth distribution: Q3FY19
Source: PhillipCapital India Research Estimates
Anjali Verma (+ 9122 6246 4115) [email protected] Neeraj Chadawar (+91 22 6246 4116)
PhillipCapital India Research
(6)
(3)
(2)
2
2
9
15
18
21
28
70
149
(50) 0 50 100
Automobiles
Pharma
Cement
Midcap
Infrastructure
NBFC
FMCG
Capital Goods
IT Services
PC - Universe
Specailty Chemicals
Banks
PAT - YoY
Page | 2 | PHILLIPCAPITAL INDIA RESEARCH
Q3FY19 RESULTS PREVIEW
Earnings estimates
_____________ Revenue _____________ _____________ EBITDA ______________ _______________ PAT _______________
Sector (Rs bn) Dec-18E Sep-18 qoq (%) Dec-17 yoy (%) Dec-18E Sep-18 qoq (%) Dec-17 yoy (%) Dec-18E Sep-18 qoq (%) Dec-17 yoy (%)
Automobiles 1,410 1,393 1.2 1,343 5.0 165 160 3.0 171 (3.6) 65 62 5.1 69 (5.6)
Capital Goods 629 609 3.3 551 14.2 71 65 8.5 57 23.4 37 37 1.5 32 18.2
Banks 713 679 5.0 614 16.1 541 505 7.1 476 13.8 162 72 124.2 65 149.1
NBFC 143 139 2.4 128 11.7 114 112 2.0 107 6.9 67 71 (5.2) 61 9.0
FMCG 484 462 4.8 422 14.7 117 110 6.4 102 15.2 81 76 5.9 71 14.6
Infrastructure 119 112 6.1 97 22.8 35 33 6.2 32 8.5 16 12 37.3 16 1.9
IT Services 1,078 1,044 3.3 902 19.5 237 223 6.2 185 28.2 194 187 4.0 161 20.8
Pharma 329 325 1.2 311 5.9 68 67 1.1 68 0.2 38 38 0.6 39 (2.6)
Cement 260 236 10.1 211 23.3 41 36 15.7 39 6.0 16 12 27.7 16 (2.4)
Sp Chemicals 47 47 1.1 36 32.9 9 9 2.0 6 56.9 5 5 2.6 3 69.9
Midcap 134 135 (0.4) 121 10.7 16 16 2.8 14 11.8 9 10 (3.3) 9 1.7
PC Universe* 5,346 5,181 3.2 4,734 12.9 1,415 1,336 5.9 1,257 12.6 692 582 18.9 542 27.5
PC Universe** 4,962 4,812 3.1 4,392 13.0 1,150 1,085 5.9 1,011 13.8 649 608 6.9 579 12.2
*Total PC Universe (Ex Metal, Oil & Gas), **Total PC Universe (ex Metal, Oil & Gas, PSBs)
Sector-wise contribution: Revenue and PAT
Source: PhillipCapital India Research Estimates
26%
20%
13%
12%
9% 6%
5% 3% 3% 2% 1%
100%
0%
20%
40%
60%
80%
100%
Q3FY19 Revenue contribution (%)
28%
23%
12%
10% 9%
6% 5%
2% 2% 1% 1%
100%
-10%
10%
30%
50%
70%
90%
110%
Q3FY19 PAT contribution (%)

Page | 3 | PHILLIPCAPITAL INDIA RESEARCH
Q3FY19 RESULTS PREVIEW
Revenue, EBITDA, PAT growth (yoy)
Source: PhillipCapital India Research Estimates
PC universe: Sector-wise EPS (Rs)
Source: PhillipCapital India Research Estimates
(20)
-
20
40
60
80
100
120
140
160 Revenue (Rs mn) EBITDA (Rs mn) PAT (Rs mn)
0
50
100
150
200
250
Q3FY19E Q3FY18

Page | 4 | PHILLIPCAPITAL INDIA RESEARCH
Q3FY19 RESULTS PREVIEW
Key sector highlights
Sector Key observations / outlook Earnings plays
Auto Weak volumes across OEMs as festive season sales fizzle out. Positive: Escorts
Margins to be under pressure across the board led by higher incentives and
negative leverage.
Tyre companies to see some qoq margin pressure due to high cost inventory.
Banking Our banking universe will see +16% yoy (+5% qoq) growth in NIIs, driven by credit
growth and stable NIMs.
Positive: SBI, ICICI Bank and HDFC Bank
Decline in G-Sec yields in the quarter should lead to higher trading income.
Expect GNPAs (%) to decline by c.40bps qoq in Q3 to 11% for the system.
Cement Industry volume growth seen at +8% yoy, 10% qoq. Positive: Shree Cement, JK Cement
Realisations expected to remain flattish qoq in most regions.
Opex/tonne expected to reduce by 1-2% qoq.
EBITDA/tonne for the sector seen at c.Rs 750/tonne (6% yoy; -2% qoq).
Capital Goods Expect our coverage of capital-goods companies to report 18% yoy growth in earnings in Q3. However, excluding BHEL and BDL, which have a low base yoy, the sector PAT growth would be 11% yoy. Revenues should rise 14%. EBITDA growth of 23% yoy is skewed by strong operational results for L&T’s IT Services and Development Project segments and improved margins for majority of the companies (led by BDL, BHEL, GETD). The key highlight for the quarter is weak order inflows announced by L&T and BHEL.
Positive: ABB, TMX
Key monitorables would be: (1) Management outlook on any slowdown on execution and award of new orders due to general election in 1QFY20, (2) impact of lower raw material costs on gross margins, and (3) pressure on working capital.
Negative: L&T, BHE, VATW, COCHIN
Consumer/FMCG Consumer sector’s revenue growth to accelerate qoq on: (1) Entire festive season
falling in 3QFY19, (2) judicious price hikes in key segment, (3) CSD channel on a
recovery path, and (4) increased distribution reach.
Positive: Titan, Jubilant Foods, Nestle, Asian Paints,
Marico
Retail and consumer discretionary companies should see strong growth vs. staples
as the larger theme of formalization remains intact.
Negative: Bajaj Corp, Emami, GCPL
Margins to moderate significantly on: (1) Inflationary pressure in key commodities,
(2) late start to the winter season, and (3) anniversary of GST-related savings.
IT Services Moderate topline growth in constant currency terms – negative CC impact will
lower reported growth.
Positive: TCS, Wipro, LTTS
Margins to expand for most companies due to INR depreciation. Negative: Persistent, TechM
Guidance by Infosys, HCLT, and Wipro will be keenly watched.
Management commentary on deal flow and digital business will be of utmost
importance.
Infrastructure Strong revenue growth for most EPC companies – driven by strong orderbooks. Negative: KNR, IRB, ADSEZ
Margins to decline yoy due to exceptionally high margins last year (GST impact). Positive: NCC, PNC, Ahluwalia
Earnings to report strong yoy growth - topline growth partly mitigated by lower
margins and higher tax.
NBFC We see NII growth for NBFCs under our coverage at a moderate 13% yoy due to
margin contraction and moderation in AUM growth.
Positive: Mahindra Finance and Manappuram
Finance
Margin to see 5-25bps contraction in Q3 as cost of funds shot up after IL&FS’
default in September.
Negative: Shriram City Union
Asset-quality to remain stable.
Pharmaceutical We estimate muted 6% yoy growth in revenues for our coverage universe due to
adverse impact of ongoing pricing pressure and incremental competition in the US
generics business.
Positive BIOS IN: Ramp-up in biologic sales will help
earnings to double.
We estimate EBITDA margin to decline at 20.5% for PC’s Pharma universe as
elevated RM prices from China keep operating profits under pressure. As a result,
EBITDA to see flat yoy growth.
Positive DIVI IN: Recovery in overall profitability, led
by reduction in remediation expenses and advantage
of supply disruptions in China.
On weak operating performance, PC’s pharma universe should see an earnings
decline of 3% yoy.
Positive SUNP IN: Stable performance in the US and
currency to support earnings growth.
Negative CIPLA IN: Slow ramp-up in the US and
business challenges in ROW will impact earnings.
Negative LPC IN: Competition in its key drugs and
lack of new launches will cause a fall in earnings.
Specialty Chem Sales to grow by 33%, led by sustained growth across the board and improved
demand scenario in domestic and exports markets. However, due to a lean period
in the global market, revenues will remain muted qoq.
Positive Aarti: Strong performance in the specialty
chemicals segment, led by rising contribution from
value-added products and improved realisation in its
key products, will lead to 30%/70% yoy growth in
overall sales/PAT
Better product mix, favourable currency, and increased realisation from value- Positive VO: Robust sales growth led by the strong

Page | 5 | PHILLIPCAPITAL INDIA RESEARCH
Q3FY19 RESULTS PREVIEW
added products will drive operating performance. EBITDA margin to expand by
c.295bps yoy, but due to no growth in product pricing qoq and INR appreciation,
there would be no expansion in margin sequentially.
performance in ATBS business, despite temporary
demand issue in IBB business, will result in 42% yoy
growth in sales. On a low base, earnings to double
yoy (+2% qoq).
In line with strong sales/operating performance, earnings growth should be
healthy at 70% yoy, but it will remain muted qoq – with a growth of 3%.
Positive CFIN: Sales growth of 9% yoy, led by strong
performance in the blends operations and
incremental sales from its China vanillin facility.
Margin to see smart recovery at 9.7% with improved
product mix, resulting in continuous improvement in
profitability
Positive ATLP: Healthy growth in both life sciences
and performance chemicals will lead to a 21% yoy
growth in sales. Mainly strong prices in agro and
aromatics will expand margin by 300bps yoy, which
will lead to strong yoy earnings growth of 31% yoy (-
2% qoq)
Source: PhillipCapital India Research

Page | 6 | PHILLIPCAPITAL INDIA RESEARCH
Q3FY19 RESULTS PREVIEW
Automobiles
Earnings estimates
(Rs mn) Dec-18E Sep-18 qoq (%) Dec-17 yoy (%) Key expectations
Maruti Suzuki
Revenues 195443 222332 -12.1% 192832 1.4% Revenue to improve 1% yoy led by realisation.
EBITDA margin to compress 150bps qoq led by higher incentives,
negative leverage, and adverse forex impact.
EBITDA 25450 32313 -21.2% 30378 -16.2%
EBITDA margin (%) 13.0% 14.5% 15.8%
PAT 15753 20404 -22.8% 17990 -12.4%
EPS (Rs) 52 68 -22.8% 60 -12.4%
JLR
Revenues 6628 5635 17.6% 6310 5.0% Revenue to grow by 5% yoy led by 4% realisation improvement.
EBITDA margin to rebound 230bps qoq, led by operating leverage and
cost saving.
EBITDA 755 511 47.7% 685 10.2%
EBITDA margin (%) 11.4% 9.1% 10.9%
PAT 142 -101 -240.8% 89 59.7%
Tata Motors
Revenues 158555 177587 -10.7% 161016 -1.5% Revenue to decline by 2% yoy due to flat volumes and higher
discounts.
Margin to decrease by 150bps qoq due to operating leverage.
EBITDA 8360 12000 -30.3% 15200
EBITDA margin (%) 5.3% 6.8% 9.4%
PAT -1084 1091 -199.3% 1837 -159.0%
EPS (Rs) 0 0 1
Mahindra & Mahindra
Revenues 129096 127902 0.9% 114915 12.3% 12% yoy revenue growth backed by 11% growth in automotive and
tractor volumes.
Operating leverage to aid EBIDTA margin increase of 30bps qoq.
EBITDA 19080 18493 3.2% 16926 12.7%
EBITDA margin (%) 14.8% 14.5% 14.7%
PAT 10346 17788 -41.8% 13057 -20.8%
EPS (Rs) 17 29 -40.2% 20 -11.9%
Ashok Leyland
Revenues 62799 76080 -17.5% 71132 -11.7% Revenue to decrease by 12% yoy led 17% decrease in MHCV volume.
Margins to shrink by 250 bps qoq on higher discounting and negative
leverage.
EBITDA 5065 8059 -37.2% 7884 -35.8%
EBITDA margin (%) 8.1% 10.6% 11.1%
PAT 2623 4596 -42.9% 4499 -41.7%
EPS (Rs) 0.9 1.7 -44.8% 1.6 -41.7%
Bajaj Auto
Revenues 75085 79868 -6.0% 63693 17.9% 26% yoy jump in volumes helps revenue grow by 18%.
Margins to decline by 70bps qoq, despite higher volumes, due to
weak mix and high discount.
EBITDA 12062 13422 -10.1% 12315 -2.1%
EBITDA margin (%) 16.1% 16.8% 19.3%
PAT 10569 11517 -8.2% 9524 11.0%
EPS (Rs) 37 40 -8.2% 33 11.0%
Hero MotoCorp
Revenues 76802 90909 -15.5% 73055 5.1% Revenue to increase by 5% sequentially led by volume.
Margin to decline 120bps qoq due to high RM cost pressure and
operating leverage.
EBITDA 10780 13787 -21.8% 11580 -6.9%
EBITDA margin (%) 14.0% 15.2% 15.9%
PAT 7736 9763 -20.8% 8054 -4.0%
EPS (Rs) 39 49 -20.8% 40 -4.0%
Apollo Tyres
Revenues 46881 42574 10.1% 40501 15.8% We expect consolidated revenue to grow by 16% yoy. Standalone
revenue growth momentum to slowdown to 15% yoy.
EBITDA margin to remain flat. Margin pressure in India due to high
cost inventory, abetted by operating leverage, and seasonality in
Europe.
EBITDA 5157 4672 10.4% 4964 3.9%
EBITDA margin (%) 11.0% 11.0% 12.3%
PAT 2209 1460 51.3% 2453 -9.9%
EPS (Rs) 4 3 18.8% 4 -9.9%
Bharat Forge
Revenues 15474 16792 -7.9% 13580 14.0% Revenue to rise 14% yoy led by realisation.
Margins to increase by 50 bps qoq. EBITDA 4464 4754 -6.1% 3837 16.3%
EBITDA margin (%) 28.8% 28.3% 28.3%
PAT 2426 2685 -9.7% 1956 24.0%
EPS (Rs) 10 12 -9.7% 8 24.0%
Mahindra CIE
Revenues 18834 19326 -2.5% 16184 16.4% Revenue of European business to grow 20% yoy, India business up 9%
yoy.
Margins to decline by 60bps qoq led by negative operating leverage.
EBITDA 2429 2610 -6.9% 2419 0.4%
EBITDA margin (%) 12.9% 13.5% 14.9%

Page | 7 | PHILLIPCAPITAL INDIA RESEARCH
Q3FY19 RESULTS PREVIEW
(Rs mn) Dec-18E Sep-18 qoq (%) Dec-17 yoy (%) Key expectations
Ceat
Revenues 17901 17546 2.0% 15742 13.7% Revenue to rise 14% yoy, led by 8% yoy volume growth, as OEM sales
slowed.
EBITDA margins to decline 50bps qoq due to existing high cost
inventory.
EBITDA 1543 1592 -3.1% 1870 -17.4%
EBITDA margin (%) 8.6% 9.1% 11.9%
PAT 604 657 -8.1% 831 -27.3%
EPS (Rs) 15 16 -8.1% 20 -27.3%
Escorts
Revenues 16138 13984 15.4% 12050 33.9% Revenue growth of 34% yoy led by 36% yoy tractor volume growth.
Margin to improve led by operating leverage. EBITDA 2005 1575 27.3% 1450 38.2%
EBITDA margin (%) 12.4% 11.3% 12.0%
PAT 1272 1027 23.9% 920 38.3%
EPS (Rs) 11 9 23.9% 8 38.5%
RK Forgings
Revenues 4329 4615 -6.2% 4001 8.2% Revenues to grow by 8% yoy led by strong exports and weak
domestics. EBITDA 913 979 -6.7% 771 18.4%
EBITDA margin (%) 21.1% 21.2% 19.3%
PAT 293 328 -10.7% 277 5.6%
EPS (Rs) 10 11 -10.7% 10 5.6%
Source: Company, PhillipCapital India Research
Page | 8 | PHILLIPCAPITAL INDIA RESEARCH
Q3FY19 RESULTS PREVIEW
Banking
Earnings estimates – Banks
(Rs mn) Dec-18E Sep-18 QoQ (%) Dec-17
yoy (%) Key expectations
Axis Bank
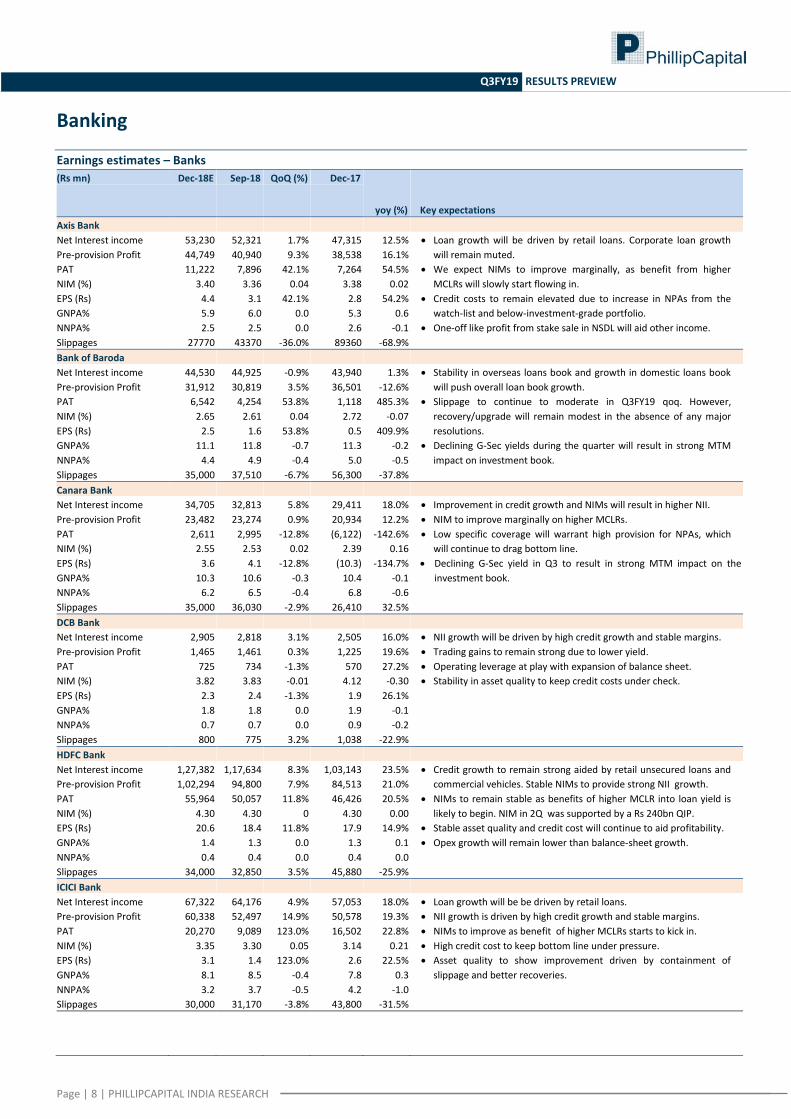
Net Interest income 53,230 52,321 1.7% 47,315 12.5% Loan growth will be driven by retail loans. Corporate loan growth
will remain muted.
We expect NIMs to improve marginally, as benefit from higher
MCLRs will slowly start flowing in.
Credit costs to remain elevated due to increase in NPAs from the
watch-list and below-investment-grade portfolio.
One-off like profit from stake sale in NSDL will aid other income.
Pre-provision Profit 44,749 40,940 9.3% 38,538 16.1%
PAT 11,222 7,896 42.1% 7,264 54.5%
NIM (%) 3.40 3.36 0.04 3.38 0.02
EPS (Rs) 4.4 3.1 42.1% 2.8 54.2%
GNPA% 5.9 6.0 0.0 5.3 0.6
NNPA% 2.5 2.5 0.0 2.6 -0.1
Slippages 27770 43370 -36.0% 89360 -68.9%
Bank of Baroda
Net Interest income 44,530 44,925 -0.9% 43,940 1.3% Stability in overseas loans book and growth in domestic loans book
will push overall loan book growth.
Slippage to continue to moderate in Q3FY19 qoq. However,
recovery/upgrade will remain modest in the absence of any major
resolutions.
Declining G-Sec yields during the quarter will result in strong MTM
impact on investment book.
Pre-provision Profit 31,912 30,819 3.5% 36,501 -12.6%
PAT 6,542 4,254 53.8% 1,118 485.3%
NIM (%) 2.65 2.61 0.04 2.72 -0.07
EPS (Rs) 2.5 1.6 53.8% 0.5 409.9%
GNPA% 11.1 11.8 -0.7 11.3 -0.2
NNPA% 4.4 4.9 -0.4 5.0 -0.5
Slippages 35,000 37,510 -6.7% 56,300 -37.8%
Canara Bank
Net Interest income 34,705 32,813 5.8% 29,411 18.0% Improvement in credit growth and NIMs will result in higher NII.
NIM to improve marginally on higher MCLRs.
Low specific coverage will warrant high provision for NPAs, which
will continue to drag bottom line.
Declining G-Sec yield in Q3 to result in strong MTM impact on the
investment book.
Pre-provision Profit 23,482 23,274 0.9% 20,934 12.2%
PAT 2,611 2,995 -12.8% (6,122) -142.6%
NIM (%) 2.55 2.53 0.02 2.39 0.16
EPS (Rs) 3.6 4.1 -12.8% (10.3) -134.7%
GNPA% 10.3 10.6 -0.3 10.4 -0.1
NNPA% 6.2 6.5 -0.4 6.8 -0.6
Slippages 35,000 36,030 -2.9% 26,410 32.5%
DCB Bank
Net Interest income 2,905 2,818 3.1% 2,505 16.0% NII growth will be driven by high credit growth and stable margins.
Trading gains to remain strong due to lower yield.
Operating leverage at play with expansion of balance sheet.
Stability in asset quality to keep credit costs under check.
Pre-provision Profit 1,465 1,461 0.3% 1,225 19.6%
PAT 725 734 -1.3% 570 27.2%
NIM (%) 3.82 3.83 -0.01 4.12 -0.30
EPS (Rs) 2.3 2.4 -1.3% 1.9 26.1%
GNPA% 1.8 1.8 0.0 1.9 -0.1
NNPA% 0.7 0.7 0.0 0.9 -0.2
Slippages 800 775 3.2% 1,038 -22.9%
HDFC Bank
Net Interest income 1,27,382 1,17,634 8.3% 1,03,143 23.5% Credit growth to remain strong aided by retail unsecured loans and
commercial vehicles. Stable NIMs to provide strong NII growth.
NIMs to remain stable as benefits of higher MCLR into loan yield is
likely to begin. NIM in 2Q was supported by a Rs 240bn QIP.
Stable asset quality and credit cost will continue to aid profitability.
Opex growth will remain lower than balance-sheet growth.
Pre-provision Profit 1,02,294 94,800 7.9% 84,513 21.0%
PAT 55,964 50,057 11.8% 46,426 20.5%
NIM (%) 4.30 4.30 0 4.30 0.00
EPS (Rs) 20.6 18.4 11.8% 17.9 14.9%
GNPA% 1.4 1.3 0.0 1.3 0.1
NNPA% 0.4 0.4 0.0 0.4 0.0
Slippages 34,000 32,850 3.5% 45,880 -25.9%
ICICI Bank
Net Interest income 67,322 64,176 4.9% 57,053 18.0% Loan growth will be be driven by retail loans.
NII growth is driven by high credit growth and stable margins.
NIMs to improve as benefit of higher MCLRs starts to kick in.
High credit cost to keep bottom line under pressure.
Asset quality to show improvement driven by containment of
slippage and better recoveries.
Pre-provision Profit 60,338 52,497 14.9% 50,578 19.3%
PAT 20,270 9,089 123.0% 16,502 22.8%
NIM (%) 3.35 3.30 0.05 3.14 0.21
EPS (Rs) 3.1 1.4 123.0% 2.6 22.5%
GNPA% 8.1 8.5 -0.4 7.8 0.3
NNPA% 3.2 3.7 -0.5 4.2 -1.0
Slippages 30,000 31,170 -3.8% 43,800 -31.5%
Page | 9 | PHILLIPCAPITAL INDIA RESEARCH
Q3FY19 RESULTS PREVIEW
(Rs mn) Dec-18E Sep-18 QoQ (%) Dec-17 yoy (%) Key expectations
Indian Bank
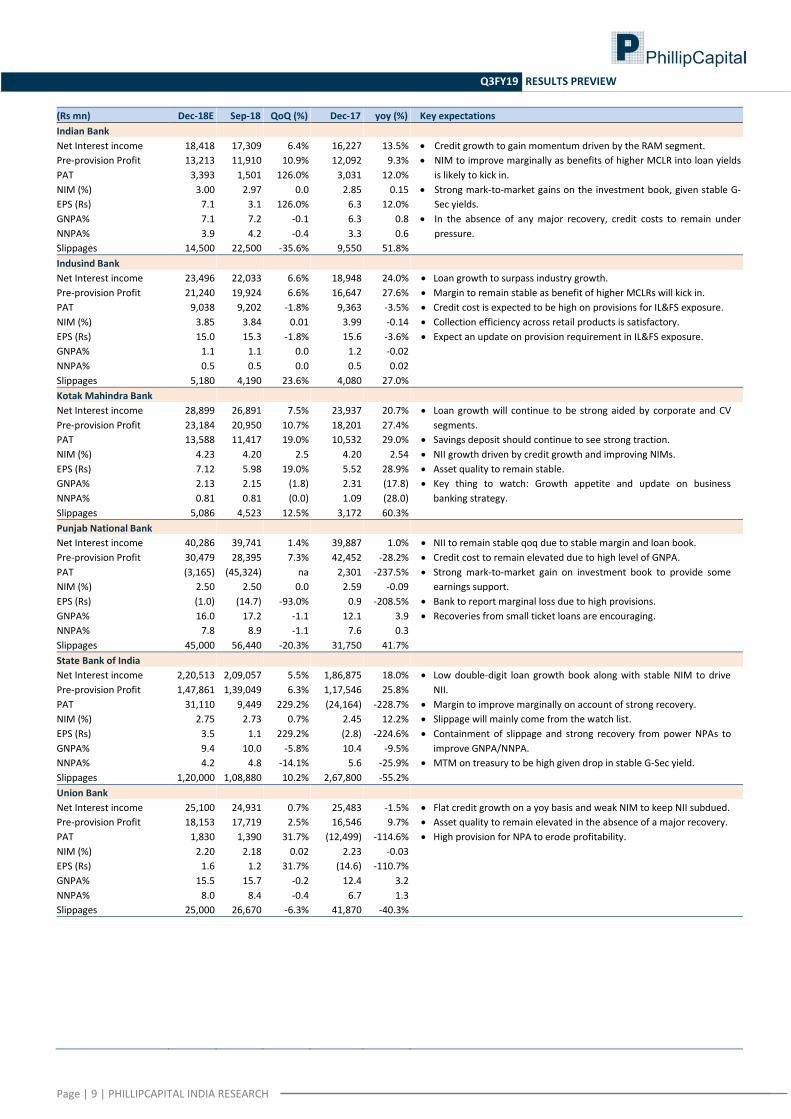
Net Interest income 18,418 17,309 6.4% 16,227 13.5% Credit growth to gain momentum driven by the RAM segment.
NIM to improve marginally as benefits of higher MCLR into loan yields
is likely to kick in.
Strong mark-to-market gains on the investment book, given stable G-
Sec yields.
In the absence of any major recovery, credit costs to remain under
pressure.
Pre-provision Profit 13,213 11,910 10.9% 12,092 9.3%
PAT 3,393 1,501 126.0% 3,031 12.0%
NIM (%) 3.00 2.97 0.0 2.85 0.15
EPS (Rs) 7.1 3.1 126.0% 6.3 12.0%
GNPA% 7.1 7.2 -0.1 6.3 0.8
NNPA% 3.9 4.2 -0.4 3.3 0.6
Slippages 14,500 22,500 -35.6% 9,550 51.8%
Indusind Bank
Net Interest income 23,496 22,033 6.6% 18,948 24.0% Loan growth to surpass industry growth.
Margin to remain stable as benefit of higher MCLRs will kick in.
Credit cost is expected to be high on provisions for IL&FS exposure.
Collection efficiency across retail products is satisfactory.
Expect an update on provision requirement in IL&FS exposure.
Pre-provision Profit 21,240 19,924 6.6% 16,647 27.6%
PAT 9,038 9,202 -1.8% 9,363 -3.5%
NIM (%) 3.85 3.84 0.01 3.99 -0.14
EPS (Rs) 15.0 15.3 -1.8% 15.6 -3.6%
GNPA% 1.1 1.1 0.0 1.2 -0.02
NNPA% 0.5 0.5 0.0 0.5 0.02
Slippages 5,180 4,190 23.6% 4,080 27.0%
Kotak Mahindra Bank
Net Interest income 28,899 26,891 7.5% 23,937 20.7% Loan growth will continue to be strong aided by corporate and CV
segments.
Savings deposit should continue to see strong traction.
NII growth driven by credit growth and improving NIMs.
Asset quality to remain stable.
Key thing to watch: Growth appetite and update on business
banking strategy.
Pre-provision Profit 23,184 20,950 10.7% 18,201 27.4%
PAT 13,588 11,417 19.0% 10,532 29.0%
NIM (%) 4.23 4.20 2.5 4.20 2.54
EPS (Rs) 7.12 5.98 19.0% 5.52 28.9%
GNPA% 2.13 2.15 (1.8) 2.31 (17.8)
NNPA% 0.81 0.81 (0.0) 1.09 (28.0)
Slippages 5,086 4,523 12.5% 3,172 60.3%
Punjab National Bank
Net Interest income 40,286 39,741 1.4% 39,887 1.0% NII to remain stable qoq due to stable margin and loan book.
Credit cost to remain elevated due to high level of GNPA.
Strong mark-to-market gain on investment book to provide some
earnings support.
Bank to report marginal loss due to high provisions.
Recoveries from small ticket loans are encouraging.
Pre-provision Profit 30,479 28,395 7.3% 42,452 -28.2%
PAT (3,165) (45,324) na 2,301 -237.5%
NIM (%) 2.50 2.50 0.0 2.59 -0.09
EPS (Rs) (1.0) (14.7) -93.0% 0.9 -208.5%
GNPA% 16.0 17.2 -1.1 12.1 3.9
NNPA% 7.8 8.9 -1.1 7.6 0.3
Slippages 45,000 56,440 -20.3% 31,750 41.7%
State Bank of India
Net Interest income 2,20,513 2,09,057 5.5% 1,86,875 18.0% Low double-digit loan growth book along with stable NIM to drive
NII.
Margin to improve marginally on account of strong recovery.
Slippage will mainly come from the watch list.
Containment of slippage and strong recovery from power NPAs to
improve GNPA/NNPA.
MTM on treasury to be high given drop in stable G-Sec yield.
Pre-provision Profit 1,47,861 1,39,049 6.3% 1,17,546 25.8%
PAT 31,110 9,449 229.2% (24,164) -228.7%
NIM (%) 2.75 2.73 0.7% 2.45 12.2%
EPS (Rs) 3.5 1.1 229.2% (2.8) -224.6%
GNPA% 9.4 10.0 -5.8% 10.4 -9.5%
NNPA% 4.2 4.8 -14.1% 5.6 -25.9%
Slippages 1,20,000 1,08,880 10.2% 2,67,800 -55.2%
Union Bank
Net Interest income 25,100 24,931 0.7% 25,483 -1.5% Flat credit growth on a yoy basis and weak NIM to keep NII subdued.
Asset quality to remain elevated in the absence of a major recovery.
High provision for NPA to erode profitability.
Pre-provision Profit 18,153 17,719 2.5% 16,546 9.7%
PAT 1,830 1,390 31.7% (12,499) -114.6%
NIM (%) 2.20 2.18 0.02 2.23 -0.03
EPS (Rs) 1.6 1.2 31.7% (14.6) -110.7%
GNPA% 15.5 15.7 -0.2 12.4 3.2
NNPA% 8.0 8.4 -0.4 6.7 1.3
Slippages 25,000 26,670 -6.3% 41,870 -40.3%

Page | 10 | PHILLIPCAPITAL INDIA RESEARCH
Q3FY19 RESULTS PREVIEW
(Rs mn) Dec-18E Sep-18 QoQ (%) Dec-17 yoy (%) Key expectations
Yes Bank
Net Interest income 25,812 24,176 6.8% 18,888 36.7% Credit growth expected to slow down to 3.6% qoq vs. 11% in 2Q.
NIMs to remain stable; we see NIMs to begin rising from FY20.
Slippage to spike up due to RBI’s AQR report. We have built in Rs
40bn divergence in our numbers. Credit cost to be higher.
Watch: Divergence, update on management transition.
Pre-provision Profit 23,024 23,664 -2.7% 20,018 15.0%
PAT 8,992 9,646 -6.8% 10,769 -16.5%
NIM (%) 3.28 3.30 -2.17 3.50 -22.17
EPS (Rs) 3.9 4.1 -3.8% 4.6 -15.3%
GNPA% 3.1 1.6 146.5 1.7 135.8
NNPA% 2.0 0.8 113.6 0.9 104.9
Slippages 47,925 16,316 193.7% 4,949 868.3%
Earnings estimates – Housing Finance Companies
(Rs mn) Dec-18E Sep-18 qoq (%) Dec-17 yoy (%) Key expectations
HDFC Limited
Net Interest income 34,437 30,261 13.8% 29,687 16.0% Has adopted Ind-AS accounting standard. Our estimates are based
on Indian GAAP.
Loan growth driven by individual segment. Sold loans worth Rs
69.6bn to HDFC Bank.
Spread to remain stable as rise in cost would be offset by an increase
in rate and high corporate loan growth.
Dividend received is Rs 20mn vs. Rs 1,510mn last year. Asset quality
to remain stable.
Watch: Management commentary on capital allocation.
Pre-provision Profit 32,843 28,904 13.6% 28,805 14.0%
PAT 22,609 24,671 -8.4% 19,934 13.4%
EPS (Rs) 13.3 14.5 -8.4% 12.5 6.8%
LIC Housing Finance
Net Interest income 10,233 10,123 1.1% 8,976 14.0% Has adopted Ind AS. Our estimate is based on Indian GAAP.
Loan growth of 15% to be driven housing loans.
Favourable base to reflect NII growth.
Asset quality likely to remain stable.
Pre-provision Profit 9,252 9,633 -4.0% 8,050 14.9%
PAT 5,881 5,732 2.6% 4,911 19.8%
EPS (Rs) 11.7 11.4 2.6% 9.7 19.8%
Repco Home Finance
Net Interest income 1,200 1,115 7.6% 1,071 12.0% Adopted Ind AS. Our estimate is based on Indian GAAP.
Disbursement to improve yoy but decline qoq.
Loan growth seen in lower double digits.
NIM will remain stable as increase in yields offset rise in cost of
funds.
Seasonally weak quarter in terms of asset quality. Expect some spike
in GNPA.
Pre-provision Profit 1,041 969 7.4% 935 11.2%
PAT 634 666 -4.8% 485 30.7%
EPS (Rs) 10.1 10.6 -4.8% 7.7 30.8%
Indiabulls Housing Fin
Net Interest income 14,321 14,240 0.6% 13,960 2.6% Adopted Ind AS. Our estimate is based on Indian GAAP.
Loan book to moderate due to the liquidity crisis in Q3.
NIM to contract as cost of fund rose sharply.
Some loan segments such as home loan and construction finance
may remain flat qoq.
Pre-provision Profit 12,280 14,266 -13.9% 18,867 -34.9%
PAT 8,807 10,442 -15.7% 11,677 -24.6%
EPS (Rs) 20.7 24.5 -15.3% 21.9 -5.3%
Dewan Housing Finance
Net Interest income 4,595 8,310 -44.7% 6,256 -26.5% Adopted Ind AS. Our estimate is based on Indian GAAP.
Loan growth to see de-growth qoq due to standstill in new business
impacted by liquidity crisis.
Sharp decline in disbursement and sell down of loan will lead to
decline in loan book qoq.
NIMs under pressure, but asset quality stable.
Pre-provision Profit 6,055 7,656 -20.9% 5,617 7.8%
PAT 3,301 4,387 -24.8% 3,060 7.9%
EPS (Rs) 10.5 14.0 -24.8% 9.8 7.8%
Source: Company, PhillipCapital India Research Estimates

Page | 11 | PHILLIPCAPITAL INDIA RESEARCH
Q3FY19 RESULTS PREVIEW
Earnings estimates – NBFC
(Rs mn) Dec-18E Sep-18 qoq (%) Dec-17 yoy (%) Key expectations
Shriram Transport Fin
Net Interest income 20,482 20,553 -0.3% 17,094 19.8% NIIs to decline qoq as disbursement declines and margin contracts.
Operating profit growth broadly in line with topline growth.
Asset quality to remain stable.
Higher cost of funds to drive contraction in NIMs.
Pre-provision Profit 16,044 16,226 -1.1% 13,486 19.0%
PAT 5,942 6,096 -2.5% 4,956 19.9%
NIM (%) 7.8 8.0 -0.27 7.8 0.00
EPS (Rs) 26.2 26.9 -2.5% 21.8 19.9%
Cholamandalam Fin.
Net Interest income 8,362 8,119 3.0% 7,930 5.5% Lower NIMs due to higher cost of funds leads to lower NII growth, even
as AUM growth remains healthy at 26%.
Favourable base helps drive operating profit growth.
Asset quality to remain stable.
Higher cost of funds to lead to lower NIMs.
Pre-provision Profit 5,378 5,207 3.3% 4,694 14.6%
PAT 2,878 3,047 -5.5% 2,492 15.5%
NIM (%) 6.9 7.0 -0.10 8.4 -1.50
EPS (Rs) 18.4 19.5 -5.5% 15.9 15.5%
Mah & Mah Finance
Net Interest income 12,809 11,666 9.8% 10,711 19.6% Strong growth in disbursements to drive growth in NII.
With lower increase in opex, operating profit growth to be higher at
27%.
Asset quality to improve helped by higher collections.
Higher cost of funds to lead to lower NIMs.
Pre-provision Profit 8,364 7,869 6.3% 6,553 27.6%
PAT 4,096 3,814 7.4% 3,420 19.8%
NIM (%) 8.4 7.9 0.50 8.7 -0.26
EPS (Rs) 6.7 6.2 7.4% 5.6 19.8%
Shriram City Union Fin
Net Interest income 9,913 10,197 -2.8% 9,157 8.3% Decline in disbursement and lower NIMs to lead to moderation in NII
growth.
NIMs to contract 71bps yoy led by higher cost of funds.
Asset quality to remain stable.
Decline in disbursement and lower NIMs to lead to moderation in NII
growth.
Pre-provision Profit 6,143 6,243 -1.6% 5,449 12.7%
PAT 2,106 2,493 -15.5% 2,255 -6.6%
NIM (%) 13.6 13.8 -0.24 14.3 -0.71
EPS (Rs) 31.9 37.8 -15.5% 34.2 -6.6%
Manappuram Finance
Net Interest income 6,915 6,971 -0.8% 6,153 12.4% Lower NIMs to keep NII growth moderate.
Implementation of cellular vaults to drive further reduction in opex.
Asset quality to remain stable.
Rising share of lower yielding products and higher cost of funds driving
margin contraction.
Pre-provision Profit 3,850 3,662 5.1% 3,056 26.0%
PAT 2,350 2,240 4.9% 1,733 35.6%
NIM (%) 15.7 16.2 -0.52 16.8 -1.10
EPS (Rs) 2.8 2.7 4.9% 2.1 35.6%
Muthoot Finance
Net Interest income 11,416 11,143 2.4% 10,538 8.3% Higher base to impact NII growth.
Higher opex growth to keep operating level growth muted.
Rising share of lower yielding products and higher cost of funds driving
margin contraction.
Pre-provision Profit 7,703 7,478 3.0% 7,767 -0.8%
PAT 5,141 4,838 6.3% 4,637 10.9%
NIM (%) 14.0 14.1 -0.08 15.1 -1.09
EPS (Rs) 12.8 12.1 6.3% 11.6 10.8%
Magma Finance
Net Interest income 3,602 3,498 3.0% 3,593 0.3% NII growth flat as AUM remains broadly stable.
NIMs to contract due to higher cost of funds.
Favourable base to drive strong earnings growth.
NII growth flat as AUM remains broadly stable.
Pre-provision Profit 2,018 1,913 5.5% 1,942 3.9%
PAT 852 766 11.3% 650 31.1%
NIM (%) 8.6 8.6 -0.04 9.3 -0.74
EPS (Rs) 3.6 3.3 11.3% 2.8 31.1%
Source: Company, PhillipCapital India Research Estimates

Page | 12 | PHILLIPCAPITAL INDIA RESEARCH
Q3FY19 RESULTS PREVIEW
Capital Goods & Engineering
Earnings estimates
(Rs mn) Dec-18E Sep-18 qoq (%) Dec-17 yoy (%) Key expectations / assumptions
Capital goods
Order inflows 6,08,185 7,86,515 -22.7% 7,68,281 -20.8% 21% yoy decline in new orders mainly due to weak L&T (-31%) and BHEL (-
55%) order inflows.
Revenue likely to grow 14% yoy driven by strong order book of 2.7x TTM
sales. Execution will be driven by L&T, ENGR, BHE, TMX, and SIEM.
EBITDA growth of 23% yoy, mainly on strong operational results for L&T’s IT
Services and Development Project segments and improved margins on a low
base in most of the companies (led by BDL, BHEL, GETD, KKC, TMX).
Excluding L&T services, our coverage EBITDA should grow by 14% yoy.
PAT to grow 18% yoy; excluding BDL and BHEL, PAT growth would be 11%.
Order book 53,09,923 52,93,169 0.3% 48,90,275 8.6%
Revenues 6,28,981 6,08,786 3.3% 5,50,858 14.2%
EBITDA 70,901 65,323 8.5% 57,458 23.4%
EBITDA Margin (%) 11.3% 10.7% 54bps 10.4% 84bps
PAT 37,307 36,760 1.5% 31,562 18.2%
ABB India
Order inflows 31,026 23,550 31.7% 29,111 6.6% Expect slow growth in new orders due to weak Power Grids segment orders.
Revenues to be driven by strong execution on a weak base across all
segments excluding Power Grids.
EBITDA margins to improve 45bps yoy, supported by improved gross
margins.
Order book 1,13,471 1,13,680 -0.2% 1,15,340 -1.6%
Revenues 31,235 25,154 24.2% 27,794 12.4%
EBITDA 3,436 1,940 77.1% 2,937 17.0%
EBITDA Margin (%) 11.0% 7.7% 329bps 10.6% 43bps
PAT 2,085 1,083 92.5% 1,715 21.6%
EPS (Rs) 9.8 5.1 92.5% 8.1 21.6%
Bharat Dynamics
Revenues 9,047 6,060 49.3% 8,225 10.0% Revenues to be supported by pick up in production of missiles which was
impacted due to a technical snag during 2Q.
Expect strong expansion in EBITDA margins as gross margins will improve
because of better sales mix.
EBITDA 1,508 660 128.4% 445 239.1%
EBITDA Margin (%) 16.7% 10.9% 577bps 5.4% 1126bps
PAT 1,035 283 265.1% 62 1574.5%
EPS (Rs) 5.6 1.5 265.1% 0.3 1574.5%
Bharat Electronics Order inflows 57,300 1,07,550 -46.7% 11,460 400.0% Robust new orders led by award of Akash 7 sqdn project (Rs 53bn).
Expect strong growth in revenues on a high base yoy led by execution of
EVM/VVPAT orders.
EBITDA margins likely to shrink on a weaker sales mix.
PAT will be further impacted by lower other income.
Order book 5,16,596 4,89,950 5.4% 4,04,690 27.7%
Revenues 30,904 33,814 -8.6% 25,128 23.0%
EBITDA 5,184 8,544 -39.3% 4,852 6.9%
EBITDA Margin (%) 16.8% 25.3% -849bps 19.3% -253bps
PAT 3,260 5,713 -42.9% 3,308 -1.5%
EPS (Rs) 1.3 2.3 -42.9% 1.3 -1.5%
BHEL
Order inflows 54,594 51,590 5.8% 1,21,320 -55.0% Order inflows likely to be weak on a strong base yoy on a delay in award of
large L1 projects.
Revenue growth to be supported by strong execution in industrials on a
weak base and healthy growth in the power segment.
Improved gross margins on better sales mix and operating leverage benefits
will lead to a 270bps expansion in EBITDA margin.
Consequently, PAT would grow at 71% yoy.
Order book 11,32,956 11,53,300 -1.8% 10,22,000 10.9%
Revenues 74,938 67,799 10.5% 67,052 11.8%
EBITDA 6,223 (332) nm 3,741 66.3%
EBITDA Margin (%) 8.3% -0.5% 879bps 5.6% 272bps
PAT 3,605 (772) nm 2,108 71.0%
EPS (Rs) 1.0 (0.2) nm 0.6 80.3%
CG POWER
Order inflows 18,918 20,010 -5.5% 17,090 10.7% Expect growth in order inflows driven by overseas power systems.
Revenues growth to be driven by strong growth in industrial systems and
overseas power systems segment sales.
Margins to expand by 80bps yoy supported by higher gross margins
Consequently, recurring PAT from continued operations to report a strong
growth on a weak base.
Order book 56,364 54,720 3.0% 45,610 23.6%
Revenues 17,271 16,500 4.7% 15,161 13.9%
EBITDA 1,588 1,624 -2.2% 1,271 24.9%
EBITDA Margin (%) 9.2% 9.8% -65bps 8.4% 81bps
PAT 479 502 -4.6% 327 46.6%
EPS (Rs) 0.8 0.8 -4.6% 0.5 46.6%
Cochin Shipyard
Revenues 6,773 7,994 -15.3% 6,150 10.1% Revenues would be supported by strong healthy growth in the shipbuilding
segment while ship-repair sales will remain flat yoy.
Expect 270bps yoy contraction in margins, as shipbuilding margins will
contract because of unfavourable sales mix.
EBITDA 1,328 1,881 -29.4% 1,372 -3.2%
EBITDA Margin (%) 19.6% 23.5% -393bps 22.3% -270bps
PAT 1,088 1,477 -26.3% 1,138 -4.3%
EPS (Rs) 8.3 10.9 -23.8% 8.4 -1.1%
Cummins
Revenues 15,144 14,869 1.8% 13,547 11.8% Expect healthy growth in revenues on a low base led by both domestic sales
across all segments, as well as exports sales, partly supported by favourable
exchange rates.
Margins to expand 120bps yoy.
EBITDA 2,377 2,509 -5.3% 1,967 20.9%
EBITDA Margin (%) 15.7% 16.9% -118bps 14.5% 118bps
PAT 1,981 2,116 -6.4% 1,722 15.1%
EPS (Rs) 7.1 7.6 -6.4% 6.2 15.1%
Source: PhillipCapital India Research

Page | 13 | PHILLIPCAPITAL INDIA RESEARCH
Q3FY19 RESULTS PREVIEW
(Rs mn) Dec-18E Sep-18 qoq (%) Dec-17 yoy (%) Key expectations / assumptions
Engineers India
Order inflows 1,392 49,623 -97.2% 1,161 19.9% Revenue growth to be driven by strong execution in the turnkey segment.
EBITDA margins to contract 355bps yoy due to a higher share of low-margin
turnkey revenues, partly offset by improved consultancy margins.
Do not expect any major provision write backs in 3QFY19.
Order book 1,09,598 1,14,640 -4.4% 83,010 32.0%
Revenues 6,434 6,814 -5.6% 4,034 59.5%
EBITDA 885 915 -3.3% 698 26.8%
EBITDA Margin (%) 13.7% 13.4% 32bps 17.3% -355bps
PAT 797 959 -17.0% 665 19.8%
EPS (Rs) 1.3 1.5 -17.0% 1.0 27.7%
GE T&D
Order inflows 9,790 7,235 35.3% 7,832 25.0% Expect good growth in new orders on a weak base yoy.
Muted growth in revenues on a high base yoy due to depleting opening
order book (-24% yoy in 2QFY19).
EBITDA margins to expand 410bps yoy driven by improved gross margins.
Expect 30% yoy growth in PAT led by strong operating performance.
Order book 57,620 62,000 -7.1% 72,000 -20.0%
Revenues 14,170 9,933 42.7% 14,386 -1.5%
EBITDA 1,295 921 40.6% 728 77.9%
EBITDA Margin (%) 9.1% 9.3% -13bps 5.1% 408bps
PAT 764 515 48.4% 589 29.7%
EPS (Rs) 3.0 2.0 48.4% 2.3 29.7%
KEC
Order inflows 45,050 21,700 107.6% 43,540 3.5% Expect muted growth in new orders – announced Rs 45bn orders in 3QFY19.
Likely to miss its FY19 order-inflow guidance.
Revenue to be supported by growth in railways, civil, and solar, as power
T&D to be muted due to slow /deferment of execution in some projects.
EBITDA margins to remain flat yoy.
PAT would decline due to higher in interest costs and effective tax rate.
Order book 1,89,388 1,71,210 10.6% 1,40,180 35.1%
Revenues 26,672 24,085 10.7% 24,049 10.9%
EBITDA 2,702 2,532 6.7% 2,441 10.7%
EBITDA Margin (%) 10.1% 10.5% -38bps 10.2% -2bps
PAT 1,095 963 13.7% 1,118 -2.0%
EPS (Rs) 4.3 3.7 13.7% 4.3 -2.0%
L&T
Order inflows 3,32,180 4,19,210 -20.8% 4,81,300 -31.0% Expect a 30% yoy (-40% ex-services) decline in new orders – announced Rs
214bn of orders in 3Q contributed by hydrocarbons, power T&D, and water.
Revenue to grow at 15% yoy aided by strong growth in IT and financial
services, while its core E&C segment will grow 12%.
EBITDA margins to expand 60bps yoy, led by expansion in IT services and
development projects margins.
Order book 28,11,852 28,11,660 0.0% 27,07,270 3.9%
Revenues 3,31,988 3,20,808 3.5% 2,87,475 15.5%
EBITDA 38,257 37,705 1.5% 31,430 21.7%
EBITDA Margin (%) 11.5% 11.8% -23bps 10.9% 59bps
PAT 16,903 19,357 -12.7% 15,037 12.4%
EPS (Rs) 6.0 6.9 -12.7% 5.4 12.3%
Siemens
Order inflows 35,176 37,187 -5.4% 32,570 8.0% Revenue growth would be driven by strong growth in mobility and digital
factory segments along with healthy growth across all others.
EBITDA margins to contract 50bps yoy due to decline in Power & Gas and
Energy Management segments’ margins.
Order book 1,30,573 1,23,520 5.7% 1,30,905 -0.3%
Revenues 28,123 38,947 -27.8% 24,295 15.8%
EBITDA 3,011 3,741 -19.5% 2,724 10.5%
EBITDA Margin (%) 10.7% 9.6% 110bps 11.2% -51bps
PAT 2,137 2,509 -14.8% 1,905 12.2%
EPS (Rs) 6.0 7.0 -14.8% 5.3 12.2%
Thermax
Order inflows 14,616 13,440 8.7% 14,130 3.4% Expect 24% yoy revenue growth driven by strong growth across all
segments.
EBITDA margins to expand 90bps yoy, driven by operating leverage benefits.
Order book 64,694 64,110 0.9% 55,560 16.4%
Revenues 13,812 14,276 -3.3% 11,170 23.7%
EBITDA 1,307 1,100 18.8% 955 36.9%
EBITDA Margin (%) 9.5% 7.7% 176bps 8.5% 92bps
PAT 867 745 16.4% 586 48.0%
EPS (Rs) 7.7 6.6 16.4% 5.2 48.0%
VA Tech Wabag
Order inflows 2,200 24,620 -91.1% 3,187 -31.0% Order inflows to be weak due to a delay in awarding large domestic orders.
Revenue to decline 18% yoy as large PETRONAS order nearing completion
and execution yet to pick up for new orders won YTD (35% of order book).
EBITDA margins to contract 135bps yoy due to weak execution resulting in
negative operating leverage.
Key monitorable will be progress on the receivables from TSGENCO (post
state election) as well as from APGENCO.
Order book 80,702 85,549 -5.7% 65,210 23.8%
Revenues 7,096 7,520 -5.6% 8,647 -17.9%
EBITDA 524 498 5.3% 757 -30.7%
EBITDA Margin (%) 7.4% 6.6% 77bps 8.8% -136bps
PAT 194 274 -29.3% 288 -32.7%
EPS (Rs) 3.6 5.0 -29.3% 5.3 -32.7%
Voltas
MEP Order inflows 5,943 10,800 -45.0% 5,580 6.5% Revenue growth to be driven by strong execution in MEP (projects) business
along with Engineering Products (on a low base); while UCP (AC business) to
report a moderate growth of c.8% yoy.
Margins to remain flat as impact of contraction in UCP margins (10% vs.
13%) is likely to be neutralize by improved margins in the MEP segment.
PAT growth to be muted due to higher effective tax rate.
MEP Order book 46,109 48,830 -5.6% 48,500 -4.9%
Revenues 15,374 14,214 8.2% 13,747 11.8%
EBITDA 1,276 1,085 17.5% 1,142 11.7%
EBITDA Margin (%) 8.3% 7.6% 66bps 8.3% -1bps
PAT 1,017 1,035 -1.7% 995 2.2%
EPS (Rs) 3.1 3.1 -1.7% 3.0 2.2%
Source: PhillipCapital India Research

Page | 14 | PHILLIPCAPITAL INDIA RESEARCH
Q3FY19 RESULTS PREVIEW
Cement
Earnings estimates
(Rs mn) Dec-18E Sep-18 qoq (%) Dec-17 yoy (%) Key expectations
ACC
Revenues 37,805 33,640 12% 34,171 11% Volume growth: 7% yoy; 13% qoq.
Realisations: Flattish.
EBITDA/tonne at Rs 657 (37% yoy; 15% qoq).
EBITDA 4,839 3,743 29% 3,317 46%
EBITDA margin (%) 12.8% 11.1% 9.7%
PAT 2,836 2,091 36% 1,715 65%
EPS (Rs) 15.1 11.1 9.1
Ambuja Cements
Revenues 30,486 26,139 17% 27,126 12% Volume growth: 8% yoy; 15% qoq.
Realisations: 1% qoq.
EBITDA/tonne at Rs 782 (-15% yoy; 20% qoq).
EBITDA 4,959 3,582 38% 5,406 -8%
EBITDA margin (%) 16.3% 13.7% 19.9%
PAT 2,765 1,786 55% 3,345 -17%
EPS (Rs) 1.4 0.9 1.7
UltraTech Cement
Revenues 92,783 81,515 14% 80,192 16% Volume growth: 13% yoy; 15% qoq.
Realisations: -1% qoq.
EBITDA/tonne at Rs 731 (-8% yoy; 1% qoq)
EBITDA 13,958 12,263 14% 13,376 4%
EBITDA margin (%) 15.0% 15.0% 16.7%
PAT 4,810 3,768 28% 4,563 5%
EPS (Rs) 17.5 13.7 16.6
Shree Cement
Revenues 27,376 25,866 6% 22,962 Volume growth: 12% yoy; 6% qoq.
Realisations: Flattish qoq.
EBITDA/tonne (blended) at Rs1,110 (12% yoy; 4% qoq).
EBITDA 6,618 6,037 10% 5,293
EBITDA margin (%) 24.2% 23.3% 23.1%
PAT 3,219 3,115 3% 2,930
EPS (Rs) 92 89 84
Dalmia Bharat
Revenues 22,785 21,580 6% 20,905 19% Volume growth: 7% yoy; 8% qoq.
Realisations: -1% qoq.
EBITDA/tonne at Rs893 (-18% yoy; -5% qoq)
EBITDA 3,966 3,900 2% 4,546 25%
EBITDA margin (%) 17.4% 18.1% 21.7%
PAT 45 20 123% 1,181 10%
EPS (Rs) 0.5 0.2 13.3
JK Cements
Revenues 11,702 10,881 8% 11,261 9% Volume growth: flat yoy; -7% qoq.
Realisations: -1% yoy; 1% qoq.
EBITDA/tonne: Rs 659 (-27% yoy; 1% qoq).
EBITDA 1,938 1,572 23% 1,702 -9%
EBITDA margin (%) 16.6% 14.4% 15.1%
PAT 881 647 36% 731 -85%
EPS (Rs) 12.6 9.3 10.4
JK Lakshmi
Revenues 9,337 8,514 10% 8,374 4% Volume growth: 9% yoy and qoq.
Realisations: Flattish
EBITDA/tonne: Rs 475 (6% yoy; 9% qoq).
EBITDA 1,088 916 19% 943 14%
EBITDA margin (%) 11.6% 10.8% 11.3%
PAT 189 78 142% 84 21%
EPS (Rs) 1.6 0.7 0.7
India Cements
Revenues 12,921 13,871 -7% 12,131 11% Volume growth: 7% yoy; -5% qoq.
Realisations: -2% qoq.
EBITDA/tonne at Rs 506 (-18% yoy; flat qoq).
EBITDA 1,472 1,549 -5% 1,673 15%
EBITDA margin (%) 11.4% 11.2% 13.8%
PAT 4 15 -73% 152 125%
EPS (Rs) 0.0 0.0 0.5
Heidelberg Cement
Revenues 4,891 4,795 2% 4,839 7% Volume growth: -6% yoy; 2% qoq.
Realisations: Flattish
EBITDA/tonne: Rs 1000 (61% yoy; 2% qoq).
EBITDA 1,147 1,102 4% 754 -12%
EBITDA margin (%) 23.5% 23.0% 15.6%
PAT 530 501 6% 329 -97%
EPS (Rs) 2.3 2.2 1.5

Page | 15 | PHILLIPCAPITAL INDIA RESEARCH
Q3FY19 RESULTS PREVIEW
(Rs mn) Dec-18E Sep-18 qoq (%) Dec-17 yoy (%) Key expectations
Mangalam Cement
Revenues 2,969 2,888 3% 2,920 1% Volume growth: -1% yoy; 2% qoq.
Realisations: 1% qoq
EBITDA/tonne: Rs 310 (185% yoy; 33% qoq).
EBITDA 229 169 35% 81 52%
EBITDA margin (%) 7.7% 5.9% 2.8%
PAT 91 31 192% 27 61%
EPS (Rs) 3.4 1.2 1.0
Sanghi Cement
Revenues 2,466 2,441 1% 2,796 2% Volume growth: -17% yoy; flat qoq.
Realisations: 1% qoq.
EBITDA/tonne: Rs 630 (-24% yoy; 21% qoq).
EBITDA 391 324 21% 618 182%
EBITDA margin (%) 15.9% 13.3% 22.1%
PAT 86 20 340% 322 238%
EPS (Rs) 0.3 0.1 1.5
Star Cement
Revenues 4,063 3,623 12% 3,774 -12% Volume growth: 15% yoy; 1% qoq.
Realisations: flat qoq.
EBITDA/tonne: Rs 1,323 (-48% yoy; 12% qoq).
EBITDA 852 687 24% 1,413 -37%
EBITDA margin (%) 21.0% 19.0% 37.4%
PAT 444 382 16% 914 -73%
EPS (Rs) 1.1 0.9 2.2
Source: Company, PhillipCapital India Research

Page | 16 | PHILLIPCAPITAL INDIA RESEARCH
Q3FY19 RESULTS PREVIEW
Consumer
Earnings Estimates
(Rs mn) Dec-18E Sep-18 qoq (%) Sec-17 yoy (%) Comments
ITC
Volume growth (est.) 3.0 7.0 (4.0) Cigarette volume growth to bounce back (6-7%) due to favourable
base (4% decline).
Cigarette EBIT growth to inch-up to double-digits on operating
efficiencies, price hikes (1%) taken in selected brands. Despite not
taking meaningful price hikes in cigarettes, EBITDA margins to expand
marginally due to positive contribution from FMCG and significant
improvement in cyclical and capex -intensive (hotels, paper)
businesses on an industry upturn.
Net income growth to be lower than EBITDA growth due to higher
taxation.
Revenues 1,07,202 1,08,912 -1.6% 96,726 10.8%
Gross Profit 66,251 66,116 0.2% 60,761 9.0%
Gross margin (%) 61.8 60.7 109bps 62.8 -102bps
EBITDA 43,168 42,060 2.6% 38,891 11.0%
EBITDA margin (%) 40.3 38.6 165bps 40.2 6bps
PAT 30,916 29,547 4.6% 28,202 9.6%
EPS (Rs) 2.5 2.4 4.6% 2.31 9.6%
Hindustan Unilever
Volume growth (est.) 8.0 10.0 11.0 Volume growth to taper to high single digits after seeing four
consecutive quarters of double-digit growth, as GST-related benefit
completes one year.
Gross margin to remain flat yoy due to lower contribution from
personal care because of a late start to winter and RM inflation for a
significant part of the quarter.
EBITDA margin expansion to continue yoy on healthy volume growth
and premiumization trends panning out.
Net income to be lower than EBITDA growth due to higher taxation.
Revenues 94,023 91,380 2.9% 83,230 13.0%
Gross Profit 49,926 47,030 6.2% 44,180 13.0%
Gross margin (%) 53.1 51.5 163bps 53.1 2bps
EBITDA 19,757 20,190 -2.1% 16,800 17.6%
EBITDA margin (%) 21.0 22.1 -108bps 20.2 83bps
PAT 13,916 15,220 -8.6% 11,980 16.2%
EPS (Rs) 6.4 7.0 -8.6% 5.5 16.2%
Dabur India Ltd
Volume growth 10.0 8.1 13.0 Volume growth to just inch-upto 10% as rural has not picked up as
expected
Gross margin to remain almost flat yoy due to higher contribution
from low-margin juice, limited price hikes.
EBITDA margin to remain flat yoy due to: (1) investment behind
creation of distribution infrastructure and higher A&P spends.
Revenues 22,010 21,250 3.6% 19,664 11.9%
Gross Profit 11,335 10,491 8.0% 10,141 11.8%
Gross margin (%) 51.5 49.4 213bps 51.6 -7bps
EBITDA 4,516 4,508 0.2% 4,035 11.9%
EBITDA margin (%) 20.5 21.2 -70bps 20.5 0bps
PAT 3,740 3,766 -0.7% 3,330 12.3%
EPS (Rs) 2.1 2.1 -0.7% 1.9 12.3%
Godrej Cons. Products
Revenues 28,708 26,418 8.7% 26,037 10.3% Domestic business: HI to remain weak due to increase penetration of
incense sticks from the unorganised sector; soaps and hair colours to
see moderate growth due to high base effect.
Reported international growth to look muted despite gradual
recovery in Indonesia, Africa, because of divestment of the UK
business.
Ebitda growth to remain subdued due to high ad intensity.
Gross Profit 15,933 13,860 15.0% 14,774 7.8%
Gross margin (%) 55.5 52.5 303bps 56.7 -124bps
EBITDA 6,168 4,865 26.8% 5,987 3.0%
EBITDA margin (%) 21.5 18.4 307bps 23.0 -151bps
PAT 4,326 3,180 36.0% 4,322 0.1%
EPS (Rs) 6.3 8.5 -25.1% 6.3 0.6%
Marico Industries
Volume growth (est.) 7 6 7 Volume growth of 7% on back of healthy recovery in coconut hair oil.
International business is likely to clock double digit sales growth
Gross margin pressure to ease qoq due to correction in copra price,
price hikes taken in the VAHO portfolio.
EBITDA margin to expand yoy on operating leverage & relatively soft
RM costs.
Revenues 19,817 18,368 7.9% 16,243 22.0%
Gross Profit 8,918 8,081 10.3% 7,556 18.0%
Gross margin (%) 45.0 44.0 100bps 46.5 -152bps
EBITDA 3,743 2,941 27.3% 3,021 23.9%
EBITDA margin (%) 18.9 16.0 288bps 18.6 29bps
PAT 2,651 2,142 23.8% 2,205 20.2%
EPS (Rs) 2.1 1.7 23.8% 1.7 20.2%
Jubilant Foodworks
SSSG 16.0 20.5 17.8 Solid SSS growth to continue as (1) entire festival season falls in 3Q
and (2) supply to railway stations seeing decent traction.
Gross margin to see some pressure due to higher discounting towards
the later part of the festive season.
PAT growth to be above EBITDA due to higher other income.
Revenues 9425 8814 6.9% 7952 18.5%
Gross Profit 7003 6575 6.5% 5926 18.2%
Gross margin (%) 74.3 74.6 -31bps 74.5 -22bps
EBITDA 1673 1475 13.4% 1369 22.2%
EBITDA margin (%) 17.8 16.7 101bps 17.2 54bps
PAT 912 777 17.4% 660 38.1%
EPS (Rs) 7.0 5.9 17.4% 5.0 38.1%

Page | 17 | PHILLIPCAPITAL INDIA RESEARCH
Q3FY19 RESULTS PREVIEW
(Rs mn) Dec-18E Sep-18 qoq (%) Sec-17 yoy (%) Comments
Colgate
Volume growth 8.0 7.0 12.0 Volume growth to inch-up despite high base on: (1) market share
gains in natural portfolio and (2) aggression on driving core product
portfolio.
Gross margin to decline c.70bps yoy due to higher corn (Sorbitol) price
and packaging costs.
Distribution expansion initiatives, higher promotion, RM inflation to
weigh on operating profitability.
Revenues 11,535 11,606 -0.6% 10,270 12.3%
Gross Profit 7,411 7,491 -1.1% 6,672 11.1%
Gross margin (%) 64.3 64.5 -29bps 65.0 -72bps
EBITDA 3,120 3,296 -5.3% 2,838 9.9%
EBITDA margin (%) 27.0 28.4 -135bps 27.6 -59bps
PAT 1,852 1,964 -5.7% 1,707 8.5%
EPS (Rs) 6.8 7.2 -5.7% 6.3 7.7%
Nestle
Volume growth 10.0 0.0 18.0 Innovation in existing categories, entry into new categories and
distribution revamp to drive high single-digit volume growth.
Margin expansion journey to continue on: (1) benign input costs, (2)
cost efficiencies, and (3) operating leverage.
Revenues 29,292 29,220 0% 25896 13.1%
Gross Profit 17,062 17,379 -1.8% 15204 12.2%
Gross margin (%) 58.3 59.5 -123bps 58.7 -46bps
EBITDA 6766 7252 -6.7% 5639 20.0%
EBITDA margin (%) 23.1 24.8 -172bps 21.8 132bps
PAT 3976 4461 -11% 3118 27.5%
EPS (Rs) 41.2 46.3 -10.9% 32.3 27.5%
Glaxo Smithkline Cons
Volume 8.0 13.7 16.0 High single-digit volume growth driven by good traction on sachets
portfolio, high-science based portfolio, and pick-up in Horlicks variants
& Boost
Gross expansion to moderate on inflationary pressure in barley,
packaging costs.
EBITDA margin to see healthy expansion on operating leverage.
Revenues 11437 12720 -10.1% 10382 10.2%
Gross Profit 7971 8861 -10.0% 7159 11.4%
Gross margin (%) 69.7 69.7 4bps 69.0 75bps
EBITDA 2540 3537 -28.2% 2075 22.4%
EBITDA margin (%) 22.2 27.8 -560bps 20.0 222bps
PAT 2045 2755 -25.8% 1637 25.0%
EPS (Rs) 48.6 65.5 -25.8% 38.9 25.0%
Britannia
Volume growth (est.) 8.0 12.0 13.0 High single-digit volume growth on foray into newer categories,
increasing distribution network in weaker areas, and premiumisation.
Gross margin to expand yoy as it has already covered RM at lower
costs.
EBITDA margin to see a c.100bps expansion on account of cost-savings
initiatives.
Revenues 28,459 28,548 0% 25,583 11%
Gross Profit 11,383 11,343 0% 9,838 16%
Gross margin (%) 40.0 39.7 27bps 38.5 154bps
EBITDA 4,730 4,544 4% 3,984 19%
EBITDA margin (%) 16.6 15.9 70bps 15.6 105bps
PAT 3,116 3,030 3% 2,636 18%
EPS (Rs) 26 25 3% 22 18%
Emami
Volume growth (est.) 2.0 (4.0) 6.0 Volume growth to be dented due to a late start to the winter season
and continued pressure on the wholesale channel.
Gross margin to remain under pressure due to higher mentha oil
prices, LLP, and packaging costs.
Negative operating leverage to weigh on operating profitability.
Net income to be lower than EBITDA growth despite lower interest
costs due to higher taxation.
Revenues 8,011 6,280 28% 7,552 6%
Gross Profit 5,528 4,308 28% 5,357 3%
Gross margin (%) 69.0 68.6 40bps 70.9 -193bps
EBITDA 2,611 1,894 38% 2,647 -1%
EBITDA margin (%) 32.6 30.2 244bps 35.0 -245bps
PAT 1,386 827 68% 1,472 -6%
EPS (Rs) 3.0 1.8 67% 3.2 -6%
Asian Paints
Volume growth (est.) 15.0 12.5 6.0 Mid-teen volume growth due to: (1) festival season falling entirely in
3Q vs. split in the base quarter, and (2) market share gains in the
distemper segment.
Gross margin pressure to ease qoq, despite spiralling Tio2 price,
because of annualized weighted average price hike of 5%.
Benefits of healthy volume growth to be negated by start -up costs
because of the Mysuru plant starting operations.
Revenues 51,446 46,391 11% 42,605 21%
Gross Profit 21,093 18,467 14% 17,995 17%
Gross margin (%) 41.0 39.8 119bps 42.2 -124bps
EBITDA 10,782 7,842 38% 8,912 21%
EBITDA margin (%) 21.0 16.9 406bps 20.9 4bps
PAT 6,870 4,928 39% 5,546 24%
EPS (Rs) 7.2 5.1 39% 5.8 24%
Page | 18 | PHILLIPCAPITAL INDIA RESEARCH
Q3FY19 RESULTS PREVIEW
(Rs mn) Dec-18E Sep-18 qoq (%) Sec-17 yoy (%) Comments
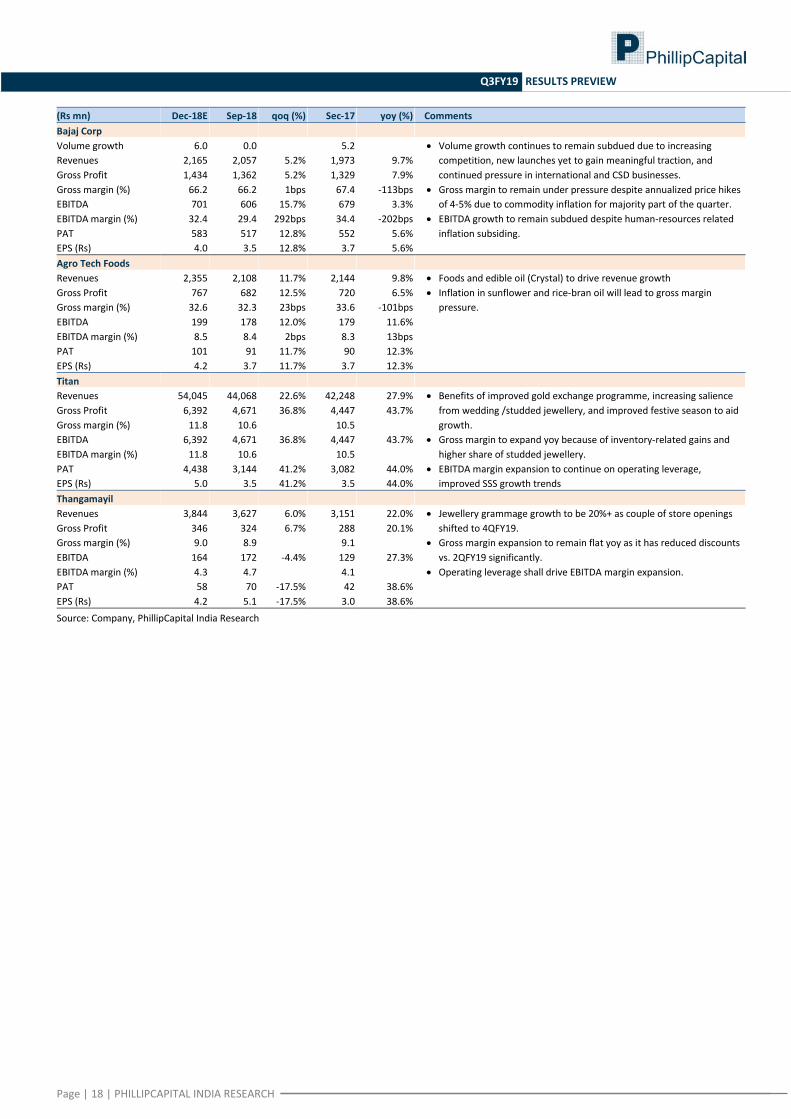
Bajaj Corp
Volume growth 6.0 0.0 5.2 Volume growth continues to remain subdued due to increasing
competition, new launches yet to gain meaningful traction, and
continued pressure in international and CSD businesses.
Gross margin to remain under pressure despite annualized price hikes
of 4-5% due to commodity inflation for majority part of the quarter.
EBITDA growth to remain subdued despite human-resources related
inflation subsiding.
Revenues 2,165 2,057 5.2% 1,973 9.7%
Gross Profit 1,434 1,362 5.2% 1,329 7.9%
Gross margin (%) 66.2 66.2 1bps 67.4 -113bps
EBITDA 701 606 15.7% 679 3.3%
EBITDA margin (%) 32.4 29.4 292bps 34.4 -202bps
PAT 583 517 12.8% 552 5.6%
EPS (Rs) 4.0 3.5 12.8% 3.7 5.6%
Agro Tech Foods
Revenues 2,355 2,108 11.7% 2,144 9.8% Foods and edible oil (Crystal) to drive revenue growth
Inflation in sunflower and rice-bran oil will lead to gross margin
pressure.
Gross Profit 767 682 12.5% 720 6.5%
Gross margin (%) 32.6 32.3 23bps 33.6 -101bps
EBITDA 199 178 12.0% 179 11.6%
EBITDA margin (%) 8.5 8.4 2bps 8.3 13bps
PAT 101 91 11.7% 90 12.3%
EPS (Rs) 4.2 3.7 11.7% 3.7 12.3%
Titan
Revenues 54,045 44,068 22.6% 42,248 27.9% Benefits of improved gold exchange programme, increasing salience
from wedding /studded jewellery, and improved festive season to aid
growth.
Gross margin to expand yoy because of inventory-related gains and
higher share of studded jewellery.
EBITDA margin expansion to continue on operating leverage,
improved SSS growth trends
Gross Profit 6,392 4,671 36.8% 4,447 43.7%
Gross margin (%) 11.8 10.6 10.5
EBITDA 6,392 4,671 36.8% 4,447 43.7%
EBITDA margin (%) 11.8 10.6 10.5
PAT 4,438 3,144 41.2% 3,082 44.0%
EPS (Rs) 5.0 3.5 41.2% 3.5 44.0%
Thangamayil
Revenues 3,844 3,627 6.0% 3,151 22.0% Jewellery grammage growth to be 20%+ as couple of store openings
shifted to 4QFY19.
Gross margin expansion to remain flat yoy as it has reduced discounts
vs. 2QFY19 significantly.
Operating leverage shall drive EBITDA margin expansion.
Gross Profit 346 324 6.7% 288 20.1%
Gross margin (%) 9.0 8.9 9.1
EBITDA 164 172 -4.4% 129 27.3%
EBITDA margin (%) 4.3 4.7 4.1
PAT 58 70 -17.5% 42 38.6%
EPS (Rs) 4.2 5.1 -17.5% 3.0 38.6%
Source: Company, PhillipCapital India Research

Page | 19 | PHILLIPCAPITAL INDIA RESEARCH
Q3FY19 RESULTS PREVIEW
IT Services
Earnings estimates – Large-cap companies
(Rs mn) Dec-18E Sep-18 qoq (%) Dec-17 yoy (%) Key expectations
Tata Consultancy
US$ Revenues ($mn) 5,284 5,215 1.3% 4,787 10.4% CC revenue growth of 1.7% and negative CC impact of 40bps.
Margins to expand 30bps qoq due to INR depreciation and operational
efficiencies.
Watch: Commentary on client budgets, Diligenta, and outlook of BFSI
and retail.
Revenues 380,460 368,540 3.2% 309,040 23.1%
EBIT 101,878 97,710 4.3% 77,810 30.9%
EBIT margin (%) 26.8 26.5 30bps 25.2 160bps
PAT 81,560 79,050 3.2% 65,310 24.9%
EPS (Rs) 21.7 21.1 3.2% 17.1 27.2%
Infosys
US$ Revenues ($mn) 2,951 2,921 1.0% 2,755 7.1% CC revenue growth of 1.5% and negative CC impact of 50bps.
Margins to decline 20bps despite INR depreciation due to front-ended
variable bonus to curb attrition.
To maintain revenue growth guidance for FY19 with a brighter outlook
on dealflow.
Revenues 212,491 206,090 3.1% 177,940 19.4%
EBIT 50,100 48,940 2.4% 43,190 16.0%
EBIT margin (%) 23.6 23.7 -20bps 24.3 -70bps
PAT 41,511 41,100 1.0% 36,970 12.3%
EPS (Rs) 9.6 9.5 1.0% 8.1 17.6%
Wipro
$ Revenue – IT ($mn) 2,043 2,041 0.1% 2,013 1.5% IT services CC revenue growth of +2.5% (adjusting for India
PSU/Government business carve-out) - near the higher-end of adjusted
guidance of 1% to 3% and negative cross currency impact of 80bps.
Contribution from Alight Solutions to be US$ 25mn (incl. in CC growth)
EBIT margins to expand 340bps qoq due to the absence of settlement
impact with National Grid in the last quarter.
We expect 1-3% qoq growth guidance for 4QFY19
Watch: Commentary on BFSI, healthcare, E&U, and retail.
Revenues 147,832 145,410 1.7% 136,690 8.2%
EBIT 25,988 20,616 26.1% 19,775 31.4%
EBIT margin (%) 17.6 14.2 340bps 14.5 310bps
PAT 23,304 18,869 23.5% 19,361 20.4%
EPS (Rs) 5.2 4.2 23.3% 4.4 18.5%
HCL Technologies
US$ Revenues ($mn) 2,161 2,099 3.0% 1,988 8.8% CC growth of 3.7% (organic CC growth of 2.7%) and negative CC impact
of 70bps.
H&D acquisitions to provide US$ 21mn for the quarter.
Margins to expand 40bps qoq due to INR depreciation and better
growth in high-margin IP business.
Outlook, esp on IMS and ERD businesses, to be keenly watched – also
any details on IBM deals and the latest acquisition of H&D in Germany.
Revenues 155,628 148,610 4.7% 128,080 21.5%
EBIT 31,616 29,660 6.6% 25,090 26.0%
EBIT margin (%) 20.3 20.0 40bps 19.6 70bps
PAT 25,483 25,400 0.3% 21,940 16.1%
EPS (Rs) 18.8 18.2 3.3% 15.7 19.3%
Tech Mahindra
US$ Revenues ($mn) 1,243 1,218 2.0% 1,209 2.8% CC revenue growth of +2.5% and negative CC impact of 50bps.
Growth will be driven by the Telecom segment (+4.5% qoq) while
Enterprise will grow at a modest 1% due to furloughs.
Margins to expand 30bps qoq mainly due to INR depreciation.
Watch: Commentary on Telecom (5G spend).
Revenues 89,505 86,298 3.7% 77,760 15.1%
EBIT 13,997 13,243 5.7% 9,904 41.3%
EBIT margin (%) 15.6 15.3 30bps 12.7 290bps
PAT 11,382 10,559 7.8% 9,244 23.1%
EPS (Rs) 12.9 11.9 8.2% 10.7 20.0%
Source: Company, PhillipCapital India Research

Page | 20 | PHILLIPCAPITAL INDIA RESEARCH
Q3FY19 RESULTS PREVIEW
Earnings estimates – Mid-cap companies
(Rs mn) Dec-18E Sep-18 qoq (%) Dec-17 yoy (%) Key expectations
L&T Infotech
US$ Revenues ($mn) 335 329 2.0% 294 14.2% CC revenue growth of 2.7% and negative CC impact of 70bps.
Margins to decline 60bps qoq due to the investments.
Commentary on BFSI and top clients growth to be keenly watched.
Revenues 24,124 23,312 3.5% 18,838 28.1%
EBIT 4,430 4,423 0.2% 2,813 57.5%
EBIT margin (%) 18.4 19.0 -60bps 14.9 340bps
PAT 3,639 4,003 -9.1% 2,828 28.7%
EPS (Rs) 21.3 23.5 -9.1% 16.5 29.4%
L&T Tech
US$ Revenues ($mn) 180 177 1.5% 151 19.1% CC revenue growth of 2.2% and negative CC impact of 50bps.
Margins to expand 40bps due to INR depreciation and operational
efficiencies.
Management commentary on future margin trajectory and
monetization of IP platforms will be important.
Revenues 12,952 12,661 2.3% 9,691 33.6%
EBIT 2,123 2,019 5.1% 1,340 58.4%
EBIT margin (%) 16.4 15.9 40bps 13.8 260bps
PAT 1,735 1,911 -9.2% 1,263 37.4%
EPS (Rs) 17.1 18.9 -9.6% 12.4 37.1%
MindTree
US$ Revenues ($mn) 250 246 1.4% 214 16.6% CC revenue growth of 2.1% and negative cross currency impact of
70bps.
Margins to expand 30bps qoq due to INR depreciation.
Commentary on digital growth and TCV to be keenly watched.
Revenues 17,989 17,554 2.5% 13,777 30.6%
EBIT 2,414 2,296 5.1% 1,655 45.9%
EBIT margin (%) 13.4 13.1 30bps 12.0 140bps
PAT 1,961 2,063 -5.0% 1,415 38.6%
EPS (Rs) 12.0 12.6 -5.0% 8.6 38.6%
Cyient
US$ Revenues ($mn) 169 169 -0.1% 152 11.0% IT services CC revenue growth of +1.9% qoq and negative cross
currency impact of 50bps.
DLM to decline 10% qoq, due to seasonality.
Margins to expand 100bps due to INR depreciation and lower
investments.
Watch: Guidance for FY19, outlook on DLM, and new deal wins.
Revenues 12,143 11,870 2.3% 9,834 23.5%
EBIT 1,488 1,339 11.2% 1,157 28.6%
EBIT margin (%) 12.3 11.3 100bps 11.8 50bps
PAT 1,342 1,267 5.9% 876 53.2%
EPS (Rs) 11.9 11.3 5.9% 7.8 53.2%
Persistent Systems
US$ Revenues ($mn) 123 118 3.7% 123 0.1% USD revenue growth of +3.7% qoq
Margins to expand 60bps due to INR depreciation.
Watch: Revenue growth outlook from the IBM-Watson deal.
Revenues 8,831 8,356 5.7% 7,919 11.5%
EBIT 1,151 1,038 10.9% 983 17.1%
EBIT margin (%) 13.0 12.4 60bps 12.4 60bps
PAT 967 881 9.7% 917 5.5%
EPS (Rs) 12.1 11.0 9.7% 11.5 5.5%
NIIT Tech
US$ Revenues ($mn) 135 131 2.8% 117 15.3% USD revenue growth of +2.8%, driven by strong growth in insurance,
travel, and digital segments.
Margins to expand 100bps driven by INR depreciation and operational
efficiencies.
Commentary on new order intake and strategy to be keenly watched.
Revenues 9,686 9,074 6.7% 7,565 28.0%
EBIT 1,497 1,315 13.9% 985 52.0%
EBIT margin (%) 15.5 14.5 100bps 13.0 240bps
PAT 1,201 1,118 7.4% 757 58.6%
EPS (Rs) 19.6 18.3 7.4% 12.4 58.6%
Intellect Design
US$ Revenues ($mn) 54 54 -0.6% 42 29.0% USD revenue to remain flat qoq, after strong growth in the last quarter.
Margins to expand 40bps due to INR depreciation and lower R&D cost.
Watch: Outlook on new deal wins and DSO improvement.
Revenues 3,886 3,804 2.2% 2,707 43.5%
EBIT 297 275 8.0% 96 211.1%
EBIT margin (%) 7.7 7.2 40bps 3.5 410bps
PAT 301 315 -4.5% 122 147.1%
EPS (Rs) 2.3 2.4 -4.5% 1.0 135.6%
Majesco
US$ Revenues ($mn) 35 34 2.8% 32 10.2% USD revenue growth of 2.8%, driven by organic growth and IBM IP
deal.
Margins to contract 230bps qoq, after strong expansion in the last
quarter.
Watch: Outlook on cloud segment traction. Management commentary
on IBM IP deal and new deal wins.
Revenues 2,520 2,425 3.9% 2,073 21.6%
EBIT 181 230 -21.6% 51 251.5%
EBIT margin (%) 7.2 9.5 -230bps 2.5 470bps
PAT 139 264 -47.2% -90 NA
EPS (Rs) 4.9 9.4 -47.2% -3.8 NA
Source: Company, PhillipCapital India Research

Page | 21 | PHILLIPCAPITAL INDIA RESEARCH
Q3FY19 RESULTS PREVIEW
Infrastructure
Earnings estimates
(Rs mn) Dec-18E Sep-18 qoq (%) Dec-17 yoy (%) Key expectations
NCC
Revenues 27,758 31,048 -10.6% 18,507 50.0% Strong yoy growth in topline, driven by execution and low base.
Progress on FY19 revenue growth guidance of 45% will be keenly
watched.
Margins to remain stable in the 11.0-11.5% range - yoy decline due to
high base last year (GST impact).
Strong yoy earnings growth due to topline growth.
EBITDA 3,145 3,651 -13.8% 2,551 23.3%
EBITDA margin (%) 11.3% 11.8% -43 13.8% -245
PAT 1,303 1,257 3.7% 1,004 29.8%
EPS (Rs) 2.17 2.09 3.7% 1.81 20.1%
KNR Construction
Revenues 4,603 4,163 10.6% 4,332 6.3% Weak orderbook at the beginning of the quarter will lead to muted
growth in topline.
Margins to remain stable in the 15-17% range – yoy margins were
exceptionally high due to closure of few projects.
Yoy decline in earnings due to higher tax rate; 80IA benefits going away.
EBITDA 799 831 -3.9% 984 -18.8%
EBITDA margin (%) 17.4% 20.0% -261 22.7% -535
PAT 374 353 5.8% 483 -22.7%
EPS (Rs) 2.66 3.20 -17.0% 4.67 -43.1%
PNC Infratech
Revenues 6,127 5,586 9.7% 4,725 29.7% Strong topline growth with execution of 7 of the new/stuck projects.
Margins to remain stable in 13.5 14.0%.
Yoy decline in earnings due to higher tax rate, with 80IA benefit going
away.
EBITDA 824 746 10.5% 663 24.4%
EBITDA margin (%) 13.5% 13.4% 10 14.0% -57
PAT 401 351 14.2% 432 -7.2%
EPS (Rs) 1.56 1.37 14.2% 3.63 -56.9%
ITD Cementation
Revenues 6,758 6,204 8.9% 5,749 17.6% We expect decent topline growth, in line with last two quarters and the
annual run-rate expectations.
Margins expected to stabilize now, with the impact of legacy low-margin
orders moving out of the orderbook complete.
Strong earnings growth due to better execution and low base yoy.
EBITDA 791 781 1.2% 786 0.7%
EBITDA margin (%) 11.7% 12.6% -89 13.7% -196
PAT 303 274 10.8% 177 71.6%
EPS (Rs) 1.76 1.59 10.8% 1.14 55.0%
J Kumar Infra
Revenues 6,132 5,147 19.1% 4,572 34.1% Decent topline growth after strong performance in the last quarter,
which came after a string of disappointing quarters.
Margins to remain stable in 16-17% range.
Earnings to decline yoy due to exceptionally high margins in 2QFY18,
and higher interest/depreciation this quarter.
EBITDA 1,012 910 11.2% 776 30.3%
EBITDA margin (%) 16.5% 17.7% -117 17.0% -48
PAT 361 354 1.9% 329 9.5%
EPS (Rs) 4.77 4.68 1.9% 4.35 9.5%
Ahluwalia Contracts
Revenues 4,940 4,392 12.5% 3,611 36.8% Decent topline growth, driven by order won in 2HFY18 and 1HFY19.
Margins to remain stable in the range of 13-14%.
Strong yoy earnings growth - driven by topline growth and lower
interest expense (exceptionally high in 3QFY18).
EBITDA 655 574 13.9% 625 4.8%
EBITDA margin (%) 13.3% 13.1% 17 17.3% -405
PAT 374 312 20.2% 292 28.4%
EPS (Rs) 5.59 4.65 20.2% 4.35 28.4%
Adani Ports & SEZ
Revenues 28,097 26,080 7.7% 26,889 4.5% Decent 10% yoy growth in cargo volumes, driven by growth in container
and ramp-up at Dhamra and Katupalli.
Muted topline yoy growth - as 3QFY18 had exceptional SEZ income.
Port margins are likely to remain stable.
Updates on the FY19 cargo and revenue guidance will be keenly sought
– along with outlook for FY20.
EBITDA 18,438 17,035 8.2% 17,842 3.3%
EBITDA margin (%) 65.6% 65.3% 30 66.4% -74
PAT 9,636 6,142 56.9% 9,941 -3.1%
EPS (Rs) 4.65 2.97 56.9% 4.80 -3.1%
IRB Infrastructure
Revenues 16,491 14,854 11.0% 13,417 22.9% Toll collection to report strong yoy growth due to a ramp-up in
Rajasthan projects.
Like-for-like toll collection to report muted 5-7% growth
EPC revenues to report muted yoy growth due to weak executable
orderbook in the quarter.
Earnings to remain flat yoy, due to higher interest and depreciation.
EBITDA 7,225 6,701 7.8% 6,303 14.6%
EBITDA margin (%) 43.8% 45.1% -130 47.0% -317
PAT 2,065 1,729 19.4% 2,073 -0.4%
EPS (Rs) 5.87 4.92 19.4% 5.90 -0.4%

Page | 22 | PHILLIPCAPITAL INDIA RESEARCH
Q3FY19 RESULTS PREVIEW
(Rs mn) Dec-18E Sep-18 qoq (%) Dec-17 yoy (%) Key expectations
Ashoka Buildcon
Revenues 8,339 7,644 9.1% 6,589 26.6% Strong topline growth - with execution picking up on HAM projects.
Margins to remain stable in 12-13% range.
Strong yoy earnings driven by topline growth.
EBITDA 1,098 1,037 5.9% 796 38.0%
EBITDA margin (%) 13.2% 13.6% -40 12.1% 109
PAT 669 621 7.7% 520 28.7%
EPS (Rs) 3.57 3.32 7.7% 2.78 28.7%
Sadbhav Engineering
Revenues 9,590 6,906 38.9% 8,394 14.3% Decent topline growth driven by execution on new HAM projects.
Margins to remain stable in 11-12% range.
Muted yoy growth in earnings due to higher tax rate, with 80IA benefit
going away.
EBITDA 1,163 833 39.6% 1,056 10.1%
EBITDA margin (%) 12.1% 12.1% 6 12.6% -46
PAT 687 383 79.3% 618 11.1%
EPS (Rs) 4.00 2.23 79.3% 3.60 11.1%
Source: Company, PhillipCapital India Research

Page | 23 | PHILLIPCAPITAL INDIA RESEARCH
Q3FY19 RESULTS PREVIEW
Midcaps
Earnings estimates
(Rs mn) Dec-18E Sep-18 qoq (%) Dec-17 yoy (%) Key expectations
Concor
Revenues 16,350 17,223 -5.1% 14,537 12.5% Volume growth of 12% yoy – both in exim and domestic.
Yoy margin improvement with pricing and volume growth.
Assumed tax @ 28% in 3Q; SIES other income at c.Rs 900mn.
EBITDA 3,581 4,042 -11.4% 2,597 37.9%
EBITDA margin (%) 21.9 23.5 17.9
PAT 2,980 3,361 -11.3% 2,891 3.1%
EPS (Rs) 6.1 6.9 -11.3% 5.9 3.1%
Praj Inds.
Revenues 2,850 2,510 13.5% 2,483 14.8% Orderbook of Rs 9bn, recovery in execution.
Operating leverage due to employee cost. EBITDA 213 169 25.4% 168 26.6%
EBITDA margin (%) 7.5 6.7 6.8
PAT 139 121 15.5% 74 87.2%
EPS (Rs) 0.8 0.7 15.5% 0.4 87.2%
Pennar Inds.
Revenues 5,250 5,182 1.3% 4,149 26.5% Growth in railways, tubes; recovery in PEBS with OB of Rs 4.2bn.
Margins impact due to PEBS, raw material inflation.
Assumed tax provision of 30%. EBITDA 385 322 19.3% 435 -11.6%
EBITDA margin (%) 7.3 6.2 10.5
PAT 119 122 -2.7% 133 -10.2%
EPS (Rs) 1.0 1.0 -2.7% 1.1 -10.2%
Allcargo
Revenues 17,390 17,373 0.1% 14,799 17.5% Growth in MTO, recovery in P&E and CFS.
Impact of DPD on CFS and lower profitability MTO with growth in FCL. EBITDA 1,141 1,249 -8.6% 1,141 0.0%
EBITDA margin (%) 6.6 7.2 7.7
PAT 517 618 -16.4% 348 48.7%
EPS (Rs) 2.1 2.5 -16.4% 1.4 48.7%
Sintex Plastic
Revenues 13,044 11,722 11.3% 13,327 -2.1% Decline in Prefab; CM to see marginal growth.
Impact of prefab business yoy. EBITDA 1,809 1,663 8.8% 1,849 -2.2%
EBITDA margin (%) 13.9 14.2 13.9
PAT 403 404 -0.1% 518 -22.2%
EPS (Rs) 0.6 0.6 -0.1% 0.9 -25.6%
KDDL
Revenues 1,635 1,565 4.5% 1,422 15.0% 15% yoy recovery in retail, 14% yoy growth in mgf.
High base effect in retail margins, revenue mix in mgf. EBITDA 148 134 10.4% 179 -17.2%
EBITDA margin (%) 9.0 8.6 12.6
PAT 48 53 -9.5% 92 -47.5%
EPS (Rs) 4.5 4.9 -9.5% 8.5 -47.5%
VRL Logistics
Revenues 5,333 5,170 3.2% 4,893 9.0% Good transport growth of 13% yoy.
Increase in fuel cost and seasonal benefit in the bus segment. EBITDA 628 541 16.2% 618 1.6%
EBITDA margin (%) 11.8 10.5 12.6
PAT 253 206 22.7% 252 0.4%
EPS (Rs) 2.8 2.3 23.1% 2.8 0.4%
Gateway Distriparks
Revenues 878 885 -0.8% 804 9.2% Marginal recovery in container volume; capacity addition at
Krishnapattnam.
DPD, pressure on CFS profitability. EBITDA 148 147 0.7% 160 -7.3%
EBITDA margin (%) 16.9 16.6 19.9
PAT 58 55 5.0% 102 -43.8%
EPS (Rs) 0.5 0.5 5.0% 0.9 -43.8%
Navkar
Revenues 1,150 1,121 2.6% 1,065 8.0% Recovery in Vapi volume + weakness at JNPT.
Operating impact due Vapi volumes. EBITDA 352 272 29.4% 376 -6.4%
EBITDA margin (%) 30.6 24.3 35.3
PAT 116 33 250.9% 235 -50.5%
EPS (Rs) 0.8 0.2 250.9% 1.6 -50.5%

Page | 24 | PHILLIPCAPITAL INDIA RESEARCH
Q3FY19 RESULTS PREVIEW
(Rs mn) Dec-18E Sep-18 qoq (%) Dec-17 yoy (%) Key expectations
Indo Count Industries
Revenues 4,917 4,860 1.2% 4,600 6.9% Volumes up 8% yoy to 15.4mn mtr; higher in-house yarn consumption.
Yoy impact of lower export incentive and pressure on realization. EBITDA 583 498 17.2% 693 -15.9%
EBITDA margin (%) 11.9 10.2 15.1
PAT 273 218 25.5% 364 -25.0%
EPS (Rs) 1.4 1.1 25.5% 1.8 -25.0%
Havells
Revenues 22,719 21,910 3.7% 19,658 15.6% Havells S.A. to report a growth of 16% yoy, majorly driven by the CD
segment. We expect margin of 13.6% in 3QFY19.
In Lloyd, we expect revenue growth of 15% (channel stocking in ACs and
strong growth in LED driven by a festive season). EBITDA margin of 8.7%.
EBITDA 2,922 2,625 11.3% 2,622 11.4%
EBITDA margin (%) 12.9 12.0 13.3
PAT 1,956 1,786 9.5% 1,734 12.8%
EPS (Rs) 3.1 2.9 9.5% 2.8 12.8%
Finolex Cables
Revenues 7,269 7,140 1.8% 6,568 10.7% In Electrical Cables lower commodity prices (-5%) resulted in volume
growth (PC estimate: 8%).
In Communication Cables, strong volume growth of 13%.
Margins dip yoy mainly because of commodity prices.
EBITDA 1,022 858 19.1% 981 4.2%
EBITDA margin (%) 14.1 12.0 14.9
PAT 767 929 -17.4% 749 2.5%
EPS (Rs) 5.0 6.1 -17.4% 4.9 2.5%
Bajaj Electricals
Revenues 14,831 15,984 -7% 11,451 29.5% Strong distribution network to result in strong growth of 20% in
consumer durables. Improvement in execution of the UP order will
result in strong E&P revenue of 40%.
Lower margin in E&P to result in lower overall margins.
EBITDA 875 799 9% 703 24.5%
EBITDA margin (%) 5.9 5.0 6.1
PAT 417 341 22.5% 368 13.3%
EPS (Rs) 4.1 3.3 22.5% 3.6 13.3%
V-Guard
Revenues 6,141 5,976 2.8% 5,297 15.9% Increasing penetration in the non-south market and rebuilding Kerala
will result in strong growth of 16%.
Higher advertisement and tight control on other cost to improve qoq
numbers.
EBITDA 556 498 11.6% 494 12.6%
EBITDA margin (%) 9.1 8.3 9.3
PAT 416 382 9.0% 358 16.4%
EPS (Rs) 1.4 1.3 9.0% 1.2 16.4%
KEI
Revenues 10,209 9,968 2.4% 8,887 14.9% Higher revenue from the B2B segment and LT led to growth.
Improving product mix to result in better margin yoy. EBITDA 1,016 1,008 0.7% 842 20.6%
EBITDA margin (%) 9.9 10.1 9.5
PAT 469 414 13.5% 390 20.3%
EPS (Rs) 6.0 5.3 13.5% 5.0 20.3%
Orient Electric
Revenues 3,902 3,752 4.0% 3,463 12.7% Season stocking by the channel in fans and premiumisation will result in
c.9% growth in fans. Strong winter season and increasing penetration
will result in 15% growth in appliances. In lighting, price hike, improving
product mix, and increasing penetration will lead to 17% growth.
Tight control on cost to result in strong OPM. Reduction in debt to result
in lower interest cost.
EBITDA 315 171 83.9% 265 18.8%
EBITDA margin (%) 8.1 4.6 7.6
PAT 154 69 124.4% 122 26.9%
EPS (Rs) 0.7 0.3 124.4% 0.6 26.9%
CG Consumer
Revenues 10,532 10,378 1.5% 9,382 12.3% Season stocking by the channel in fans, strong growth in products such
as water heaters – to lead to 14% growth in ECD.
We expect c.9% growth in lighting.
Higher incentives, price cut, and higher RM to dent margin.
EBITDA 1,203 1,239 -2.9% 1,165 3.3%
EBITDA margin (%) 11.4 11.9 12.4
PAT 738 769 -4.0% 695 6.2%
EPS (Rs) 1.18 1.23 -4.0% 1.11 6.2%
Orient Paper
Revenues 1,989 1,867 6.5% 1,687 17.9% Strong Realisation in Paper Business and higher volume growth in Tissue
segment result in growth.
Product mix and improved realisation in margin improvement.
Reduction in debt, result in lower interest outgo.
EBITDA 431 400 7.7% 261 65.5%
EBITDA margin (%) 21.7 21.4 15.5
PAT 250 297 -16.0% 105 137.6%
EPS (Rs) 1.2 1.4 -16.0% 0.5 137.6%
Uniply Industries
Revenues 1,350 1,170 15% 1,025 31.7% Improvement in execution of affordable housing orders to result in
growth.
Lower-margin orders to lower overall margins.
EBITDA 196 181 8% 179 9.6%
EBITDA margin (%) 14.5 15.5 17.4
PAT 86 78 10% 80 6.6%
EPS (Rs) 86 78 10% 80 6.6%
Source: Company, PhillipCapital India Research
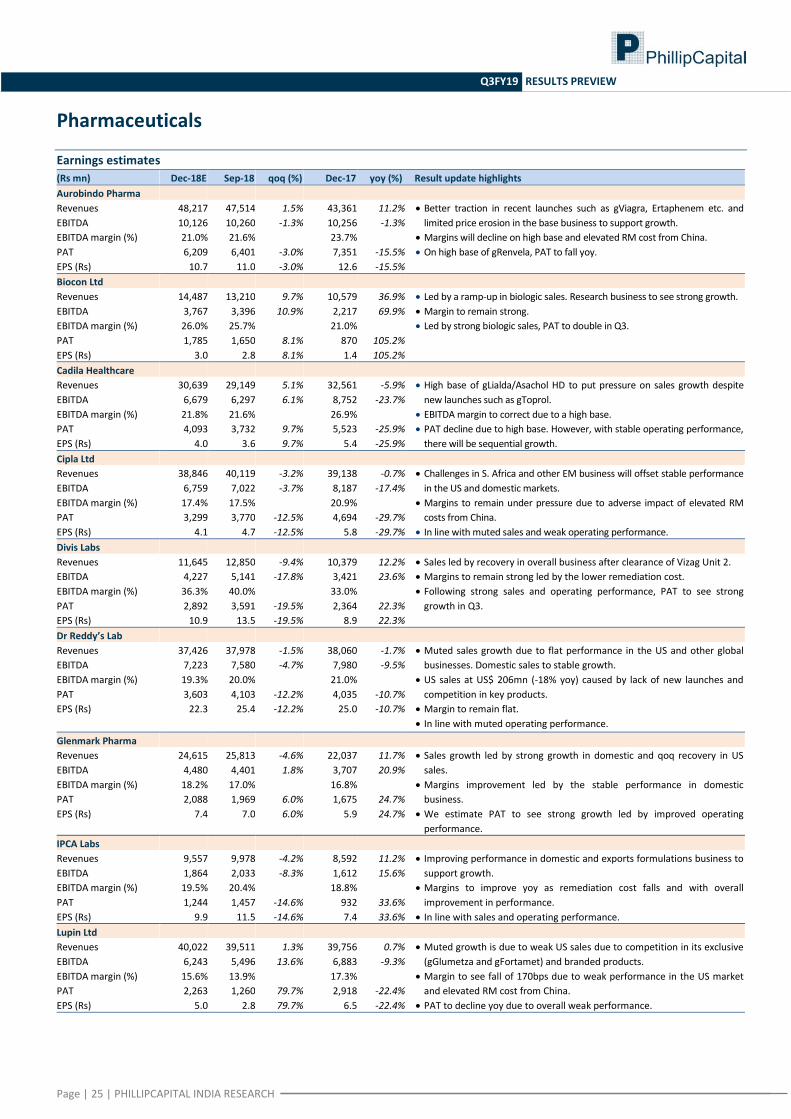
Page | 25 | PHILLIPCAPITAL INDIA RESEARCH
Q3FY19 RESULTS PREVIEW
Pharmaceuticals
Earnings estimates
(Rs mn) Dec-18E Sep-18 qoq (%) Dec-17 yoy (%) Result update highlights
Aurobindo Pharma
Revenues 48,217 47,514 1.5% 43,361 11.2% Better traction in recent launches such as gViagra, Ertaphenem etc. and
limited price erosion in the base business to support growth.
Margins will decline on high base and elevated RM cost from China.
On high base of gRenvela, PAT to fall yoy.
EBITDA 10,126 10,260 -1.3% 10,256 -1.3%
EBITDA margin (%) 21.0% 21.6% 23.7%
PAT 6,209 6,401 -3.0% 7,351 -15.5%
EPS (Rs) 10.7 11.0 -3.0% 12.6 -15.5%
Biocon Ltd
Revenues 14,487 13,210 9.7% 10,579 36.9% Led by a ramp-up in biologic sales. Research business to see strong growth.
Margin to remain strong.
Led by strong biologic sales, PAT to double in Q3.
EBITDA 3,767 3,396 10.9% 2,217 69.9%
EBITDA margin (%) 26.0% 25.7% 21.0%
PAT 1,785 1,650 8.1% 870 105.2%
EPS (Rs) 3.0 2.8 8.1% 1.4 105.2%
Cadila Healthcare
Revenues 30,639 29,149 5.1% 32,561 -5.9% High base of gLialda/Asachol HD to put pressure on sales growth despite
new launches such as gToprol.
EBITDA margin to correct due to a high base.
PAT decline due to high base. However, with stable operating performance,
there will be sequential growth.
EBITDA 6,679 6,297 6.1% 8,752 -23.7%
EBITDA margin (%) 21.8% 21.6% 26.9%
PAT 4,093 3,732 9.7% 5,523 -25.9%
EPS (Rs) 4.0 3.6 9.7% 5.4 -25.9%
Cipla Ltd
Revenues 38,846 40,119 -3.2% 39,138 -0.7% Challenges in S. Africa and other EM business will offset stable performance
in the US and domestic markets.
Margins to remain under pressure due to adverse impact of elevated RM
costs from China.
In line with muted sales and weak operating performance.
EBITDA 6,759 7,022 -3.7% 8,187 -17.4%
EBITDA margin (%) 17.4% 17.5% 20.9%
PAT 3,299 3,770 -12.5% 4,694 -29.7%
EPS (Rs) 4.1 4.7 -12.5% 5.8 -29.7%
Divis Labs
Revenues 11,645 12,850 -9.4% 10,379 12.2% Sales led by recovery in overall business after clearance of Vizag Unit 2.
Margins to remain strong led by the lower remediation cost.
Following strong sales and operating performance, PAT to see strong
growth in Q3.
EBITDA 4,227 5,141 -17.8% 3,421 23.6%
EBITDA margin (%) 36.3% 40.0% 33.0%
PAT 2,892 3,591 -19.5% 2,364 22.3%
EPS (Rs) 10.9 13.5 -19.5% 8.9 22.3%
Dr Reddy’s Lab
Revenues 37,426 37,978 -1.5% 38,060 -1.7% Muted sales growth due to flat performance in the US and other global
businesses. Domestic sales to stable growth.
US sales at US$ 206mn (-18% yoy) caused by lack of new launches and
competition in key products.
Margin to remain flat.
In line with muted operating performance.
EBITDA 7,223 7,580 -4.7% 7,980 -9.5%
EBITDA margin (%) 19.3% 20.0% 21.0%
PAT 3,603 4,103 -12.2% 4,035 -10.7%
EPS (Rs) 22.3 25.4 -12.2% 25.0 -10.7%
Glenmark Pharma
Revenues 24,615 25,813 -4.6% 22,037 11.7% Sales growth led by strong growth in domestic and qoq recovery in US
sales.
Margins improvement led by the stable performance in domestic
business.
We estimate PAT to see strong growth led by improved operating
performance.
EBITDA 4,480 4,401 1.8% 3,707 20.9%
EBITDA margin (%) 18.2% 17.0% 16.8%
PAT 2,088 1,969 6.0% 1,675 24.7%
EPS (Rs) 7.4 7.0 6.0% 5.9 24.7%
IPCA Labs
Revenues 9,557 9,978 -4.2% 8,592 11.2% Improving performance in domestic and exports formulations business to
support growth.
Margins to improve yoy as remediation cost falls and with overall
improvement in performance.
In line with sales and operating performance.
EBITDA 1,864 2,033 -8.3% 1,612 15.6%
EBITDA margin (%) 19.5% 20.4% 18.8%
PAT 1,244 1,457 -14.6% 932 33.6%
EPS (Rs) 9.9 11.5 -14.6% 7.4 33.6%
Lupin Ltd
Revenues 40,022 39,511 1.3% 39,756 0.7% Muted growth is due to weak US sales due to competition in its exclusive
(gGlumetza and gFortamet) and branded products.
Margin to see fall of 170bps due to weak performance in the US market
and elevated RM cost from China.
PAT to decline yoy due to overall weak performance.
EBITDA 6,243 5,496 13.6% 6,883 -9.3%
EBITDA margin (%) 15.6% 13.9% 17.3%
PAT 2,263 1,260 79.7% 2,918 -22.4%
EPS (Rs) 5.0 2.8 79.7% 6.5 -22.4%

Page | 26 | PHILLIPCAPITAL INDIA RESEARCH
Q3FY19 RESULTS PREVIEW
(Rs mn) Dec-18E Sep-18 qoq (%) Dec-17 yoy (%) Result update highlights
Sun Pharma Ltd
Revenues 74,009 69,376 6.7% 66,532 11.2% Improving US sales (after plant clearance) and domestic formulations to
support growth.
Operating margins to remain stable with improving US sales and no
remediation cost after Halol clearance.
PAT to see faster growth than operating growth.
EBITDA 16,282 15,312 6.3% 14,534 12.0%
EBITDA margin (%) 22.0% 22.1% 21.8%
PAT 10,643 9,956 6.9% 8,784 21.2%
EPS (Rs) 4.4 4.1 6.9% 3.7 21.2%
Source: Company, PhillipCapital India Research

Page | 27 | PHILLIPCAPITAL INDIA RESEARCH
Q3FY19 RESULTS PREVIEW
Specialty Chemicals
Earnings estimates
(Rs mn) Dec-18E Sep-18 qoq (%) Dec-17 yoy (%) Highlights
Aarti Industries
Revenues 12,726 13,221 -3.7% 9,801 29.8% Strong performance in specialty chemicals segment led by rising
contribution from value-added products and improved realisation in its key
products. Pharma business to continue growth momentum.
Margins to remain strong due to better product mix despite adverse
currency movement, resulting in strong growth in EBITDA.
In-line with strong sales and operating performance.
EBITDA 2,520 2,647 -4.8% 1,677 50.3%
EBITDA margin (%) 19.8% 20.0% 17.1%
PAT 1,380 1,485 -7.1% 811 70.1%
EPS (Rs) 17.0 18.3 -7.1% 10.0 70.1%
Atul
Revenues 9,716 10,074 -3.6% 8,037 20.9% Sustained performance both in life sciences and improved realisation in
agrochemical and aromatics will led to growth in sales.
Mainly strong prices in agro and aromatics will expand margin by 300bps
yoy.
Following strong growth in sales and operating performance, PAT to see
strong growth.
EBITDA 1,817 1,900 -4.4% 1,261 44.1%
EBITDA margin (%) 18.7% 18.9% 15.7%
PAT 1,162 1,190 -2.4% 671 73.2%
EPS (Rs) 39.2 40.1 -2.4% 22.6 73.2%
Camlin Life Sciences
Revenues 2,262 2,013 12.4% 2,067 9.4% We estimate strong growth in sales led by improvement in EU/US/Brazil
blend operations, stable show in performance chemicals, and incremental
sales from the China vanillin plant.
Margin to see smart recovery at 9.7%.
PAT to see profit of Rs 34mn
EBITDA 219 172 27.5% 98 123.2%
EBITDA margin (%) 9.7% 8.6% 4.8%
PAT 34 11 200.4% (51) L/P
EPS (Rs) 0.3 0.1 200.4% (0.4) L/P
SRF
Revenues 20,156 19,154 5.2% 13,971 44.3% Sales growth drivers – recovery in the fluoro-specialty business, lower
refrigerant gas business, cyclone impact in TTB business, and incremental
sales from the newly commissioned packaging film facility.
Margins to improve yoy to 18.1%.
In line with operational performance, the PAT to see 47% yoy growth.
EBITDA 3,648 3,327 9.6% 2,316 57.5%
EBITDA margin (%) 18.1% 17.4% 16.6%
PAT 1,735 1,507 15.1% 1,177 47.4%
EPS (Rs) 30.2 26.2 15.1% 20.5 47.4%
Vinati Organics
Revenues 2,630 2,528 4.0% 1,856 41.7% Robust sales growth led by the strong performance in ATBS business
despite temporary demand issue in IBB business.
Expect margins to remain strong at 37.1%.
With strong operating performance PAT will see robust growth on a low
base (supply disruption in IBB due to plant shutdown by leading
customer).
EBITDA 976 952 2.5% 498 95.8%
EBITDA margin (%) 37.1% 37.7% 26.8%
PAT 659 650 1.4% 318 107.3%
EPS (Rs) 12.8 12.6 1.4% 6.2 107.3%
Source: Company, PhillipCapital India Research

Page | 28 | PHILLIPCAPITAL INDIA RESEARCH
Q3FY19 RESULTS PREVIEW
Rating Methodology We rate stock on absolute return basis. Our target price for the stocks has an investment horizon of one year.
Rating Criteria Definition
BUY >= +15% Target price is equal to or more than 15% of current market price
NEUTRAL -15% > to < +15% Target price is less than +15% but more than -15%
SELL <= -15% Target price is less than or equal to -15%.
Disclosures and Disclaimers PhillipCapital (India) Pvt. Ltd. has three independent equity research groups: Institutional Equities, Institutional Equity Derivatives, and Private Client Group. This report has been prepared by Institutional Equities Group. The views and opinions expressed in this document may, may not match, or may be contrary at times with the views, estimates, rating, and target price of the other equity research groups of PhillipCapital (India) Pvt. Ltd.
This report is issued by PhillipCapital (India) Pvt. Ltd., which is regulated by the SEBI. PhillipCapital (India) Pvt. Ltd. is a subsidiary of Phillip (Mauritius) Pvt. Ltd. References to "PCIPL" in this report shall mean PhillipCapital (India) Pvt. Ltd unless otherwise stated. This report is prepared and distributed by PCIPL for information purposes only, and neither the information contained herein, nor any opinion expressed should be construed or deemed to be construed as solicitation or as offering advice for the purposes of the purchase or sale of any security, investment, or derivatives. The information and opinions contained in the report were considered by PCIPL to be valid when published. The report also contains information provided to PCIPL by third parties. The source of such information will usually be disclosed in the report. Whilst PCIPL has taken all reasonable steps to ensure that this information is correct, PCIPL does not offer any warranty as to the accuracy or completeness of such information. Any person placing reliance on the report to undertake trading does so entirely at his or her own risk and PCIPL does not accept any liability as a result. Securities and Derivatives markets may be subject to rapid and unexpected price movements and past performance is not necessarily an indication of future performance.
This report does not regard the specific investment objectives, financial situation, and the particular needs of any specific person who may receive this report. Investors must undertake independent analysis with their own legal, tax, and financial advisors and reach their own conclusions regarding the appropriateness of investing in any securities or investment strategies discussed or recommended in this report and should understand that statements regarding future prospects may not be realised. Under no circumstances can it be used or considered as an offer to sell or as a solicitation of any offer to buy or sell the securities mentioned within it. The information contained in the research reports may have been taken from trade and statistical services and other sources, which PCIL believe is reliable. PhillipCapital (India) Pvt. Ltd. or any of its group/associate/affiliate companies do not guarantee that such information is accurate or complete and it should not be relied upon as such. Any opinions expressed reflect judgments at this date and are subject to change without notice.
Important: These disclosures and disclaimers must be read in conjunction with the research report of which it forms part. Receipt and use of the research report is subject to all aspects of these disclosures and disclaimers. Additional information about the issuers and securities discussed in this research report is available on request.
Certifications: The research analyst(s) who prepared this research report hereby certifies that the views expressed in this research report accurately reflect the research analyst’s personal views about all of the subject issuers and/or securities, that the analyst(s) have no known conflict of interest and no part of the research analyst’s compensation was, is, or will be, directly or indirectly, related to the specific views or recommendations contained in this research report.
Additional Disclosures of Interest: Unless specifically mentioned in Point No. 9 below: 1. The Research Analyst(s), PCIL, or its associates or relatives of the Research Analyst does not have any financial interest in the company(ies) covered in
this report. 2. The Research Analyst, PCIL or its associates or relatives of the Research Analyst affiliates collectively do not hold more than 1% of the securities of the
company (ies)covered in this report as of the end of the month immediately preceding the distribution of the research report. 3. The Research Analyst, his/her associate, his/her relative, and PCIL, do not have any other material conflict of interest at the time of publication of this
research report. 4. The Research Analyst, PCIL, and its associates have not received compensation for investment banking or merchant banking or brokerage services or for
any other products or services from the company(ies) covered in this report, in the past twelve months. 5. The Research Analyst, PCIL or its associates have not managed or co-managed in the previous twelve months, a private or public offering of securities for
the company (ies) covered in this report. 6. PCIL or its associates have not received compensation or other benefits from the company(ies) covered in this report or from any third party, in
connection with the research report. 7. The Research Analyst has not served as an Officer, Director, or employee of the company (ies) covered in the Research report. 8. The Research Analyst and PCIL has not been engaged in market making activity for the company(ies) covered in the Research report. 9. Details of PCIL, Research Analyst and its associates pertaining to the companies covered in the Research report:
Sr. no. Particulars Yes/No
1 Whether compensation has been received from the company(ies) covered in the Research report in the past 12 months for investment banking transaction by PCIL
No
2 Whether Research Analyst, PCIL or its associates or relatives of the Research Analyst affiliates collectively hold more than 1% of the company(ies) covered in the Research report
No
3 Whether compensation has been received by PCIL or its associates from the company(ies) covered in the Research report No
4 PCIL or its affiliates have managed or co-managed in the previous twelve months a private or public offering of securities for the company(ies) covered in the Research report
No
5 Research Analyst, his associate, PCIL or its associates have received compensation for investment banking or merchant banking or brokerage services or for any other products or services from the company(ies) covered in the Research report, in the last twelve months
No
Independence: PhillipCapital (India) Pvt. Ltd. has not had an investment banking relationship with, and has not received any compensation for investment banking services from, the subject issuers in the past twelve (12) months, and PhillipCapital (India) Pvt. Ltd does not anticipate receiving or intend to seek compensation for investment banking services from the subject issuers in the next three (3) months. PhillipCapital (India) Pvt. Ltd is not a market maker in the

Page | 29 | PHILLIPCAPITAL INDIA RESEARCH
Q3FY19 RESULTS PREVIEW
securities mentioned in this research report, although it, or its affiliates/employees, may have positions in, purchase or sell, or be materially interested in any of the securities covered in the report.
Suitability and Risks: This research report is for informational purposes only and is not tailored to the specific investment objectives, financial situation or particular requirements of any individual recipient hereof. Certain securities may give rise to substantial risks and may not be suitable for certain investors. Each investor must make its own determination as to the appropriateness of any securities referred to in this research report based upon the legal, tax and accounting considerations applicable to such investor and its own investment objectives or strategy, its financial situation and its investing experience. The value of any security may be positively or adversely affected by changes in foreign exchange or interest rates, as well as by other financial, economic, or political factors. Past performance is not necessarily indicative of future performance or results.
Sources, Completeness and Accuracy: The material herein is based upon information obtained from sources that PCIPL and the research analyst believe to be reliable, but neither PCIPL nor the research analyst represents or guarantees that the information contained herein is accurate or complete and it should not be relied upon as such. Opinions expressed herein are current opinions as of the date appearing on this material, and are subject to change without notice. Furthermore, PCIPL is under no obligation to update or keep the information current. Without limiting any of the foregoing, in no event shall PCIL, any of its affiliates/employees or any third party involved in, or related to computing or compiling the information have any liability for any damages of any kind including but not limited to any direct or consequential loss or damage, however arising, from the use of this document.
Copyright: The copyright in this research report belongs exclusively to PCIPL. All rights are reserved. Any unauthorised use or disclosure is prohibited. No reprinting or reproduction, in whole or in part, is permitted without the PCIPL’s prior consent, except that a recipient may reprint it for internal circulation only and only if it is reprinted in its entirety.
Caution: Risk of loss in trading/investment can be substantial and even more than the amount / margin given by you. Investment in securities market are subject to market risks, you are requested to read all the related documents carefully before investing. You should carefully consider whether trading/investment is appropriate for you in light of your experience, objectives, financial resources and other relevant circumstances. PhillipCapital and any of its employees, directors, associates, group entities, or affiliates shall not be liable for losses, if any, incurred by you. You are further cautioned that trading/investments in financial markets are subject to market risks and are advised to seek independent third party trading/investment advice outside PhillipCapital/group/associates/affiliates/directors/employees before and during your trading/investment. There is no guarantee/assurance as to returns or profits or capital protection or appreciation. PhillipCapital and any of its employees, directors, associates, and/or employees, directors, associates of PhillipCapital’s group entities or affiliates is not inducing you for trading/investing in the financial market(s). Trading/Investment decision is your sole responsibility. You must also read the Risk Disclosure Document and Do’s and Don’ts before investing.
Kindly note that past performance is not necessarily a guide to future performance.
For Detailed Disclaimer: Please visit our website www.phillipcapital.in
For U.S. persons only: This research report is a product of PhillipCapital (India) Pvt Ltd., which is the employer of the research analyst(s) who has prepared the research report. The research analyst(s) preparing the research report is/are resident outside the United States (U.S.) and are not associated persons of any U.S.-regulated broker-dealer and therefore the analyst(s) is/are not subject to supervision by a U.S. broker-dealer, and is/are not required to satisfy the regulatory licensing requirements of FINRA or required to otherwise comply with U.S. rules or regulations regarding, among other things, communications with a subject company, public appearances, and trading securities held by a research analyst account.
This report is intended for distribution by PhillipCapital (India) Pvt Ltd. only to "Major Institutional Investors" as defined by Rule 15a-6(b)(4) of the U.S. Securities and Exchange Act, 1934 (the Exchange Act) and interpretations thereof by the U.S. Securities and Exchange Commission (SEC) in reliance on Rule 15a 6(a)(2). If the recipient of this report is not a Major Institutional Investor as specified above, then it should not act upon this report and return the same to the sender. Further, this report may not be copied, duplicated, and/or transmitted onward to any U.S. person, which is not a Major Institutional Investor. In reliance on the exemption from registration provided by Rule 15a-6 of the Exchange Act and interpretations thereof by the SEC in order to conduct certain
business with Major Institutional Investors, PhillipCapital (India) Pvt Ltd. has entered into an agreement with a U.S. registered broker-dealer, Decker & Co, LLC. Transactions in securities discussed in this research report should be effected through Decker & Co, LLC or another U.S. registered broker dealer.
If Distribution is to Australian Investors This report is produced by PhillipCapital (India) Pvt Ltd and is being distributed in Australia by Phillip Capital Limited (Australian Financial Services Licence No. 246827).
This report contains general securities advice and does not take into account your personal objectives, situation and needs. Please read the Disclosures and Disclaimers set out above. By receiving or reading this report, you agree to be bound by the terms and limitations set out above. Any failure to comply with
these terms and limitations may constitute a violation of law. This report has been provided to you for personal use only and shall not be reproduced, distributed or published by you in whole or in part, for any purpose. If you have received this report by mistake, please delete or destroy it, and notify the sender immediately.
PhillipCapital (India) Pvt. Ltd. Registered office: No. 1, 18th Floor, Urmi Estate, 95 Ganpatrao Kadam Marg, Lower Parel West, Mumbai 400013