institutional investment in infrastructure in emerging
TRANSCRIPT
Institutional Investment in Infrastructure in Emerging Markets
and Developing Economies
By Georg Inderst and Fiona Stewart
March 2014

© 2014 Public-Private Infrastructure Advisory Facility (PPIAF)1818 H Street, NWWashington, DC 20433www.ppiaf.orgE-mail: [email protected] The findings, interpretations, and conclusions expressed in this report are entirely those of the authors and should not be attributed in any manner to the Public-Private Infrastructure Advisory Facility (PPIAF) or to The World Bank Group, to its affiliated organizations, or to members of its Board of Executive Directors or the countries they represent.
Neither PPIAF nor The World Bank Group guarantees the accuracy of the data included in this publication or accepts responsibility for any consequence of their use. The boundaries, colors, denominations, and other information shown on any map in this report do not imply on the part of PPIAF or The World Bank Group any judgment on the legal status of any territory or the endorsement or acceptance of such boundaries. For questions about this publication or information about ordering more copies, please refer to the PPIAF website or contact PPIAF by email at the address above.
Rights and Permissions The material in this work is subject to copyright. Because PPIAF and The World Bank Group encourages dissemination of its knowledge, this work may be reproduced, in whole or in part, for noncommercial purposes, as long as full attribution to this work is given. Any queries on rights and licenses, including subsidiary rights, should be addressed to World Bank Publications, The World Bank Group, 1818 H Street, NW, Washington, DC 20433, USA; fax: 202-522-2625; e-mail: [email protected]. Cover photo: Jonathan Ernst / World BankCover design: TM Design, Inc.
i
SECTIONTITLE
TABLE OF CONTENTS
Abbreviations . . . . . . . . . . . . . . . . . . . . . . . . . . . . . . . . . . . . . . . . . . . . . . . . . . . . . . . . . . . . . . . . . . . . . . . . . . . . . . . . . . . . . . . . . . . . . . . . . . . . . . . . . . . . iii
Abstract . . . . . . . . . . . . . . . . . . . . . . . . . . . . . . . . . . . . . . . . . . . . . . . . . . . . . . . . . . . . . . . . . . . . . . . . . . . . . . . . . . . . . . . . . . . . . . . . . . . . . . . . . . . . . . . . . iv
1 . Introduction . . . . . . . . . . . . . . . . . . . . . . . . . . . . . . . . . . . . . . . . . . . . . . . . . . . . . . . . . . . . . . . . . . . . . . . . . . . . . . . . . . . . . . . . . . . . . . . . . . . . . . . . . . iv
2 . Background . . . . . . . . . . . . . . . . . . . . . . . . . . . . . . . . . . . . . . . . . . . . . . . . . . . . . . . . . . . . . . . . . . . . . . . . . . . . . . . . . . . . . . . . . . . . . . . . . . . . . . . . . . 1 2.1 Infrastructure Financing Needs in Emerging Markets and Developing Economies . . . . . . . . . . . . . . . . . . . . . . . . . . . . . . . . . . . . . . . . . . . . 1 2.2 Sources of Financing . . . . . . . . . . . . . . . . . . . . . . . . . . . . . . . . . . . . . . . . . . . . . . . . . . . . . . . . . . . . . . . . . . . . . . . . . . . . . . . . . . . . . . . . . . . . . . . . . . .4
3 . Institutional Investors and Infrastructure . . . . . . . . . . . . . . . . . . . . . . . . . . . . . . . . . . . . . . . . . . . . . . . . . . . . . . . . . . . . . . . . . . . . . . . . . . . . . . . . 6 3.1 Risks and Barriers to Institutional Investment in Infrastructure . . . . . . . . . . . . . . . . . . . . . . . . . . . . . . . . . . . . . . . . . . . . . . . . . . . . . . . . . . . . .8 3.2 Infrastructure Investment in EMDEs. . . . . . . . . . . . . . . . . . . . . . . . . . . . . . . . . . . . . . . . . . . . . . . . . . . . . . . . . . . . . . . . . . . . . . . . . . . . . . . . . . . . .9
4 . International investors . . . . . . . . . . . . . . . . . . . . . . . . . . . . . . . . . . . . . . . . . . . . . . . . . . . . . . . . . . . . . . . . . . . . . . . . . . . . . . . . . . . . . . . . . . . . . . . . . 12 4.1 Infrastructure Funds . . . . . . . . . . . . . . . . . . . . . . . . . . . . . . . . . . . . . . . . . . . . . . . . . . . . . . . . . . . . . . . . . . . . . . . . . . . . . . . . . . . . . . . . . . . . . . . . . . 13 4.2 Multilateral and National Development Banks . . . . . . . . . . . . . . . . . . . . . . . . . . . . . . . . . . . . . . . . . . . . . . . . . . . . . . . . . . . . . . . . . . . . . . . . . . . 15
5 . Domestic Investors . . . . . . . . . . . . . . . . . . . . . . . . . . . . . . . . . . . . . . . . . . . . . . . . . . . . . . . . . . . . . . . . . . . . . . . . . . . . . . . . . . . . . . . . . . . . . . . . . . . .16 5.1 Pension Funds. . . . . . . . . . . . . . . . . . . . . . . . . . . . . . . . . . . . . . . . . . . . . . . . . . . . . . . . . . . . . . . . . . . . . . . . . . . . . . . . . . . . . . . . . . . . . . . . . . . . . . . . 18 5.2 Insurance Companies . . . . . . . . . . . . . . . . . . . . . . . . . . . . . . . . . . . . . . . . . . . . . . . . . . . . . . . . . . . . . . . . . . . . . . . . . . . . . . . . . . . . . . . . . . . . . . . . .24 5.3 Sovereign Wealth Funds. . . . . . . . . . . . . . . . . . . . . . . . . . . . . . . . . . . . . . . . . . . . . . . . . . . . . . . . . . . . . . . . . . . . . . . . . . . . . . . . . . . . . . . . . . . . . . 26
6 . The Potential for Institutional Investment in EMDE Infrastructure . . . . . . . . . . . . . . . . . . . . . . . . . . . . . . . . . . . . . . . . . . . . . . . . . . . . . . . . . 30
7 . Examples of Institutional Infrastructure Investments in EMDEs . . . . . . . . . . . . . . . . . . . . . . . . . . . . . . . . . . . . . . . . . . . . . . . . . . . . . . . . . . . 33 8 . Models of Infrastructure Investing in Developing Economies . . . . . . . . . . . . . . . . . . . . . . . . . . . . . . . . . . . . . . . . . . . . . . . . . . . . . . . . . . . . . 37 8.1 Background Environment. . . . . . . . . . . . . . . . . . . . . . . . . . . . . . . . . . . . . . . . . . . . . . . . . . . . . . . . . . . . . . . . . . . . . . . . . . . . . . . . . . . . . . . . . . . . . .37 8.2 Decision Factors. . . . . . . . . . . . . . . . . . . . . . . . . . . . . . . . . . . . . . . . . . . . . . . . . . . . . . . . . . . . . . . . . . . . . . . . . . . . . . . . . . . . . . . . . . . . . . . . . . . . . 40 8.3 Leadership Models . . . . . . . . . . . . . . . . . . . . . . . . . . . . . . . . . . . . . . . . . . . . . . . . . . . . . . . . . . . . . . . . . . . . . . . . . . . . . . . . . . . . . . . . . . . . . . . . . . . 41
9 . Conclusions . . . . . . . . . . . . . . . . . . . . . . . . . . . . . . . . . . . . . . . . . . . . . . . . . . . . . . . . . . . . . . . . . . . . . . . . . . . . . . . . . . . . . . . . . . . . . . . . . . . . . . . . . 43 References . . . . . . . . . . . . . . . . . . . . . . . . . . . . . . . . . . . . . . . . . . . . . . . . . . . . . . . . . . . . . . . . . . . . . . . . . . . . . . . . . . . . . . . . . . . . . . . . . . . . . . . . . . . . . . 45
AppendicesAppendix 1: Emerging Market Infrastructure Funds . . . . . . . . . . . . . . . . . . . . . . . . . . . . . . . . . . . . . . . . . . . . . . . . . . . . . . . . . . . . . . . . . . . . . . . . . . . . . . 51Appendix 2: Pension Fund Assets . . . . . . . . . . . . . . . . . . . . . . . . . . . . . . . . . . . . . . . . . . . . . . . . . . . . . . . . . . . . . . . . . . . . . . . . . . . . . . . . . . . . . . . . . . . . . .52Appendix 3: EMDE Countries by Indicators . . . . . . . . . . . . . . . . . . . . . . . . . . . . . . . . . . . . . . . . . . . . . . . . . . . . . . . . . . . . . . . . . . . . . . . . . . . . . . . . . . . . 54Appendix 4: Examples of Institutional Investor Involvement in Emerging Market Infrastructure . . . . . . . . . . . . . . . . . . . . . . . . . . . . . . . . . . . . . 56
BoxesBox 1: Examples of “North-South” Pension Fund Investment in Infrastructure . . . . . . . . . . . . . . . . . . . . . . . . . . . . . . . . . . . . . . . . . . . . . . . . . . . . . 12Box 2: Role of MDBs in Supporting Infrastructure Investment in Developing Economies . . . . . . . . . . . . . . . . . . . . . . . . . . . . . . . . . . . . . . . . . . . . 15Box 3: Potential Investment in Long-Term and Green Investments . . . . . . . . . . . . . . . . . . . . . . . . . . . . . . . . . . . . . . . . . . . . . . . . . . . . . . . . . . . . . . . 30Box 4: How Infrastructure can be Financed Using Private-Sector Resources . . . . . . . . . . . . . . . . . . . . . . . . . . . . . . . . . . . . . . . . . . . . . . . . . . . . . . 38
FiguresFigure 1: Estimated Infrastructure Investments in Developing Countries . . . . . . . . . . . . . . . . . . . . . . . . . . . . . . . . . . . . . . . . . . . . . . . . . . . . . . . . . . .3Figure 2: Existing Infrastructure Financing in Developing Countries. . . . . . . . . . . . . . . . . . . . . . . . . . . . . . . . . . . . . . . . . . . . . . . . . . . . . . . . . . . . . . . .4Figure 3: Private-Sector Involvement in Developing Countries' Infrastructure. . . . . . . . . . . . . . . . . . . . . . . . . . . . . . . . . . . . . . . . . . . . . . . . . . . . . . .5Figure 4: Infrastructure Financing and Investment Options . . . . . . . . . . . . . . . . . . . . . . . . . . . . . . . . . . . . . . . . . . . . . . . . . . . . . . . . . . . . . . . . . . . . . . .6Figure 5: Types of Infrastructure Investment . . . . . . . . . . . . . . . . . . . . . . . . . . . . . . . . . . . . . . . . . . . . . . . . . . . . . . . . . . . . . . . . . . . . . . . . . . . . . . . . . . . .7Figure 6: Infrastructure Investor Intentions by Region . . . . . . . . . . . . . . . . . . . . . . . . . . . . . . . . . . . . . . . . . . . . . . . . . . . . . . . . . . . . . . . . . . . . . . . . . . . 14Figure 7: Pension Assets in Developing Economies . . . . . . . . . . . . . . . . . . . . . . . . . . . . . . . . . . . . . . . . . . . . . . . . . . . . . . . . . . . . . . . . . . . . . . . . . . . . . 19Figure 8: National Public Pension Funds—Assets Under Management in 2006 (as percent of GDP). . . . . . . . . . . . . . . . . . . . . . . . . . . . . . . . 20Figure 9: Total Assets of Insurance Companies . . . . . . . . . . . . . . . . . . . . . . . . . . . . . . . . . . . . . . . . . . . . . . . . . . . . . . . . . . . . . . . . . . . . . . . . . . . . . . . . .25Figure 10: Insurance Sector Penetration (percentages in 2009) . . . . . . . . . . . . . . . . . . . . . . . . . . . . . . . . . . . . . . . . . . . . . . . . . . . . . . . . . . . . . . . . . . 26
TABLE OF CONTENTS
ii TABLE OF CONTENTS
TABLE OF CONTENTS
Figure 11: SWF Assets Under Management. . . . . . . . . . . . . . . . . . . . . . . . . . . . . . . . . . . . . . . . . . . . . . . . . . . . . . . . . . . . . . . . . . . . . . . . . . . . . . . . . . . . .27Figure 12: SWF Investment in Infrastructure . . . . . . . . . . . . . . . . . . . . . . . . . . . . . . . . . . . . . . . . . . . . . . . . . . . . . . . . . . . . . . . . . . . . . . . . . . . . . . . . . . . 28Figure 13: Infrastructure Investment Approaches . . . . . . . . . . . . . . . . . . . . . . . . . . . . . . . . . . . . . . . . . . . . . . . . . . . . . . . . . . . . . . . . . . . . . . . . . . . . . . . .33Figure 14: Examples of Institutional Investor Involvement in Infrastructure Debt . . . . . . . . . . . . . . . . . . . . . . . . . . . . . . . . . . . . . . . . . . . . . . . . . . . .35Figure 15: Examples of Institutional Investor Involvement in Infrastructure Funds . . . . . . . . . . . . . . . . . . . . . . . . . . . . . . . . . . . . . . . . . . . . . . . . . . 36Figure 16: Considerations for Institutional Infrastructure Investment . . . . . . . . . . . . . . . . . . . . . . . . . . . . . . . . . . . . . . . . . . . . . . . . . . . . . . . . . . . . . .37Figure 17: Country Assessment for Institutional Infrastructure Investment . . . . . . . . . . . . . . . . . . . . . . . . . . . . . . . . . . . . . . . . . . . . . . . . . . . . . . . . 38
TablesTable 1: Infrastructure Expenditure Needs . . . . . . . . . . . . . . . . . . . . . . . . . . . . . . . . . . . . . . . . . . . . . . . . . . . . . . . . . . . . . . . . . . . . . . . . . . . . . . . . . . . . . .2Table 2: Barriers to Institutional Investors' Infrastructure Allocations . . . . . . . . . . . . . . . . . . . . . . . . . . . . . . . . . . . . . . . . . . . . . . . . . . . . . . . . . . . . . .9Table 3: Constraints to Emerging Market Infrastructure Investment . . . . . . . . . . . . . . . . . . . . . . . . . . . . . . . . . . . . . . . . . . . . . . . . . . . . . . . . . . . . . . 10Table 4: Public-Sector Financial Tools. . . . . . . . . . . . . . . . . . . . . . . . . . . . . . . . . . . . . . . . . . . . . . . . . . . . . . . . . . . . . . . . . . . . . . . . . . . . . . . . . . . . . . . . . . 11Table 5: Infrastructure Funds Targeting Emerging Markets. . . . . . . . . . . . . . . . . . . . . . . . . . . . . . . . . . . . . . . . . . . . . . . . . . . . . . . . . . . . . . . . . . . . . . . 14Table 6: Total Assets Under Management for Institutional Investors. . . . . . . . . . . . . . . . . . . . . . . . . . . . . . . . . . . . . . . . . . . . . . . . . . . . . . . . . . . . . . 16Table 7: International Exposure of BRIC Investors. . . . . . . . . . . . . . . . . . . . . . . . . . . . . . . . . . . . . . . . . . . . . . . . . . . . . . . . . . . . . . . . . . . . . . . . . . . . . . . 17Table 8: Pension Funds' Investment in Infrastructure Projects (2010) . . . . . . . . . . . . . . . . . . . . . . . . . . . . . . . . . . . . . . . . . . . . . . . . . . . . . . . . . . . . .22Table 9: Latin American Pension Funds and Infrastructure Assets . . . . . . . . . . . . . . . . . . . . . . . . . . . . . . . . . . . . . . . . . . . . . . . . . . . . . . . . . . . . . . . .23Table 10: Pension Fund Asset Allocation to Infrastructure . . . . . . . . . . . . . . . . . . . . . . . . . . . . . . . . . . . . . . . . . . . . . . . . . . . . . . . . . . . . . . . . . . . . . . . .24Table 11: SWF Asset Allocation. . . . . . . . . . . . . . . . . . . . . . . . . . . . . . . . . . . . . . . . . . . . . . . . . . . . . . . . . . . . . . . . . . . . . . . . . . . . . . . . . . . . . . . . . . . . . . . 28Table 12: 10 Largest SWFs and Main Infrastructure Project Investments (2010) . . . . . . . . . . . . . . . . . . . . . . . . . . . . . . . . . . . . . . . . . . . . . . . . . . . 29Table 13: Current and Potential Allocations of Institutional Investors to EMDE Infrastructure . . . . . . . . . . . . . . . . . . . . . . . . . . . . . . . . . . . . . . . .32Table 14: Environment for Institutional Infrastucture Investment . . . . . . . . . . . . . . . . . . . . . . . . . . . . . . . . . . . . . . . . . . . . . . . . . . . . . . . . . . . . . . . . . 40Table 15: Capital Market Development and Institutional Infrastructure Investment . . . . . . . . . . . . . . . . . . . . . . . . . . . . . . . . . . . . . . . . . . . . . . . . . 41
iii
ABBREVIATIONS
ABBREVIATIONS
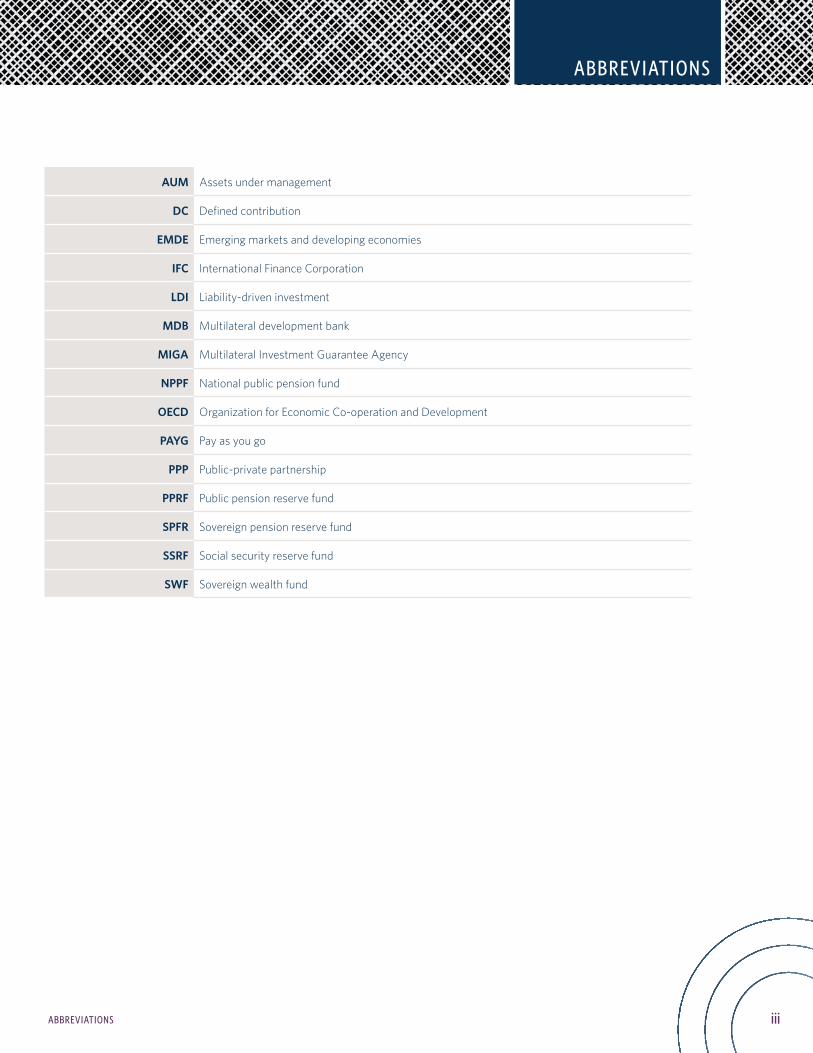
AUM Assets under management
DC Defined contribution
EMDE Emerging markets and developing economies
IFC International Finance Corporation
LDI Liability-driven investment
MDB Multilateral development bank
MIGA Multilateral Investment Guarantee Agency
NPPF National public pension fund
OECD Organization for Economic Co-operation and Development
PAYG Pay as you go
PPP Public-private partnership
PPRF Public pension reserve fund
SPFR Sovereign pension reserve fund
SSRF Social security reserve fund
SWF Sovereign wealth fund
iv
ABSTRACT & INTRODUCTION
INTRODUCTION
1
Abstract
This study discusses the role of institutional investors in financing infrastructure in emerging markets and developing economies (EMDEs). It analyzes the present level of involvement as well as the future investment potential of new financing sources such as public and private pension funds, insurance companies, and sovereign wealth funds. Current investment volumes are still low, but interesting, practical examples can be found in a range of countries and projects. International and domestic investors apply a variety of investment approaches in developing countries, using different equity, debt and fund instruments.
This overview can yield some lessons for policy makers and investors. There are (more or less) favorable pre-conditions for successful private-investor involvement, and different models work in different situations, depending on the development stage and the institutional environment. Four types of “leadership models” are therefore described for international and/or domestic investors seeking to spearhead infrastructure investment in EMDEs.
Introduction
There are huge infrastructure investment needs worldwide, but particularly so in developing countries. Given current constraints on traditional sources of public and private financing, institutional investors are increasingly being considered as sources of financing for infrastructure project development and maintenance. At the same time, investors have started to look at infrastructure as an interesting investment opportunity for their own reasons—including low interest rates in many developed economies, and the search for non-correlated assets in the wake of the global financial crisis. Furthermore, many pension funds and insurance companies are looking for longer-term assets, new sources of income, and better diversification in their asset allocations. The match is (in theory at least) a good one: Infrastructure can potentially provide a predictable (and often inflation-linked) cash flow and a low correlation to other asset classes.
However, institutional investors have their own objectives and regulations, and there are barriers on both the supply side (e.g. the lack of investable projects) and the demand side, e.g. a lack of scale and capacity. Such issues are particularly serious in developing countries.
This report provides a framework for the analysis of a wide and complex field. It also reviews the literature and data sources on the subject, explores key concepts, and adds new research and insights. Institutional investment is first placed in the context of the overall demand and supply of infrastructure finance in emerging markets. Chapter 2 provides background information on EMDE countries’ infrastructure financing needs and financing sources. Chapter 3 presents a brief review of institutional investing in infrastructure in general, followed by the barriers and risks specific to emerging markets.
This is followed by an overview of the landscape of international investors (Chapter 4), and their size and involvement in EMDE infrastructure, which is primarily indirect, via infrastructure funds rather than directly into projects. Multilateral development banks (MDBs) play a multi-faceted role in this process. Domestic investors in EMDEs are the focus of Chapter 5, which analyzes different groups of pension funds, social security reserve funds (SSRFs) and public pension reserve funds (PPRFs), insurance companies, sovereign wealth funds (SWFs) and others. There is great variation in their activities across countries, sectors and investor groups.
Chapter 6 discusses the future investment potential of institutional investors. Unsurprisingly, the information available on this topic is particularly sketchy, and any estimates are very tentative at this stage. In practice, one can find a range of different approaches to institutional investment in infrastructure. Existing examples in developing countries are found in Chapter 7, grouped by investment vehicle (equity, debt, and fund instruments).
Based on the evidence to date, it makes sense to draw some initial conclusions. The analysis leads to the discussion of “models” of institutional infrastructure investing in developing countries (Chapter 8). There are more or less favorable “pre-conditions” for institutional infrastructure investing, and there are crucial decisions for governments trying to mobilize private finance. Four different “leadership models” are presented that describe how international and/or domestic institutions can spearhead institutional infrastructure investment in EMDEs. Conclusions are summarized in Chapter 9. This field is still very much under-researched, although some work has been undertaken in recent years, especially on a regional level. This paper should lay the groundwork for the discussion of important questions, and set some milestones for further analysis.
1
BACKGROUND
BACKGROUND
2
Background
2.1 INFRASTRUCTURE FINANCING NEEDS IN EMERGING MARKETS AND DEVELOPING ECONOMIES
Infrastructure, or the lack thereof, is deeply interconnected with both economic growth and social progress. Indeed the links between infrastructure and development are well established. For example, Bhattacharya et al. (2012) state that:
• Infrastructure can drive growth through higher employment—a USD 100 million investment can generate up to 50,000 annualized direct and indirect jobs;
• Higher costs due to transport and logistics now account for a higher share of the cost of trade than policies (e.g., tariffs, duties and quotas); and
• Improved infrastructure can lead to better health outcomes—a lack of rural roads correlates with maternal mortality, and a lack of comprehensive road safety policies kills 1.2 million people and injures 50 million per year, 90 percent of them in the developing world.
It is estimated that each one percent of GDP growth requires that one percent of GDP be invested in infrastructure (telecommunications, energy, transport and water).1 A study by Calderon (2009) found that if all African countries had the same stock and quality of infrastructure as Mauritius (the region’s leader in infrastructure), their GDP could grow by an average of 2.2 percent more per year.
Weak infrastructure can slow a country’s growth and competitiveness; it can also cause loss of lives, disease, and diminish the overall quality of life. A recent study (Delmon and Delmon, 2011) on public-private partnerships (PPPs)2 argues that it “raises infrastructure services from a good investment to a moral and economic imperative.” It stands to reason that much development literature is devoted to understanding what prevents capital investments that can increase access to good-quality, affordable infrastructure.
Over the last 20 years, 3.8 percent of world GDP has been spent on (economic) infrastructure. Annual infrastructure spending has been trending down in advanced economies, from 3.6 percent of GDP in 1980 to 2.8 percent in 2008, but has been rising in emerging market economies, from 3.5 percent to 5.7 percent. The latter figure is driven by particularly high fixed-capital investment in Asia, especially China (McKinsey, 2010).
Investment needs are immense, and the scale of the challenge is biggest for developing economies. However, infrastructure investment needs are not easily quantifiable. In 2006, the Organization for Economic Co-operation and Development (OECD) estimated that global demand in five key infrastructure sectors would require USD 53 trillion worth of investment, or an annual 2.5 percent of global GDP until 2030. The inclusion of other infrastructure sectors raises the figures to more than USD 80 trillion, i.e., about USD 3 trillion per annum, or more than four percent of world GDP (OECD, 2012; McKinsey, 2013; and WEF, 2012). By including “green infrastructure needs”,” estimates rise even more, to USD 3.5 to 5 trillion per year globally (WEF 2013a).
1 Cited by Bhattacharya, A., Romania, M., Stern, N. (2012).2 PPPs are a form of project finance that involves a contract between a public-sector authority and a private party to provide a public project or service.
2
BACKGROUND
BACKGROUND
2
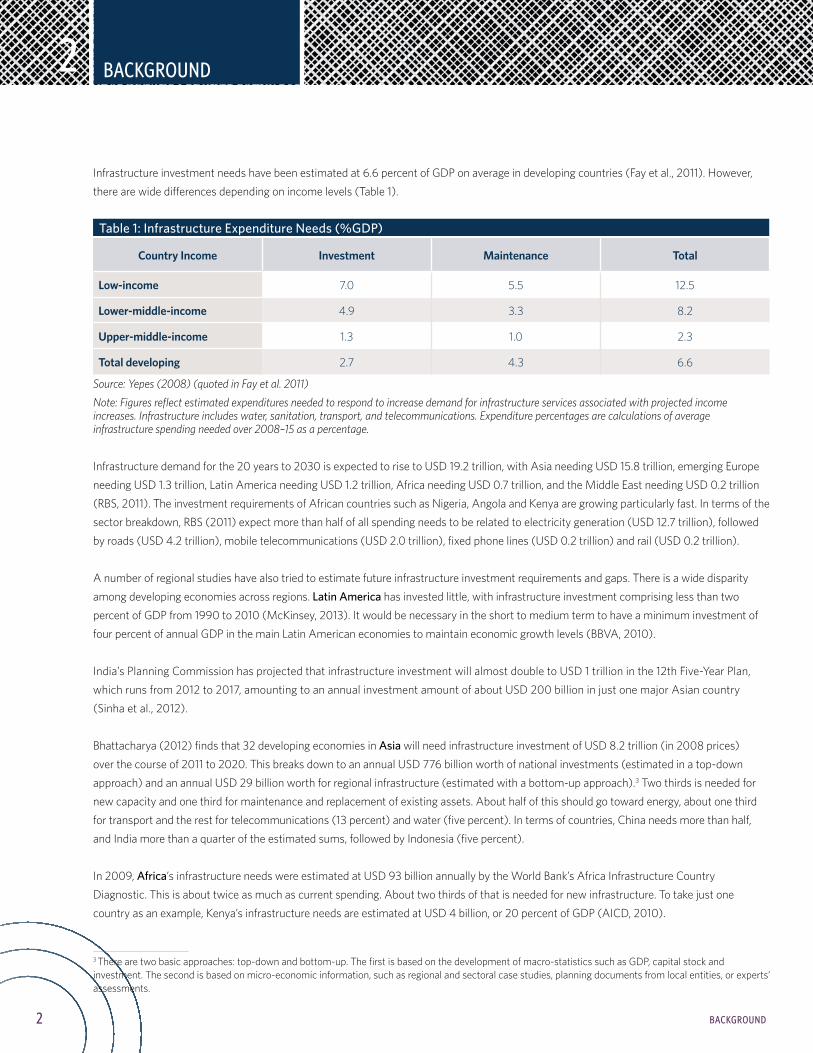
Infrastructure investment needs have been estimated at 6.6 percent of GDP on average in developing countries (Fay et al., 2011). However, there are wide differences depending on income levels (Table 1).
Table 1: Infrastructure Expenditure Needs (%GDP)
Country Income Investment Maintenance Total
Low-income 7.0 5.5 12.5
Lower-middle-income 4.9 3.3 8.2
Upper-middle-income 1.3 1.0 2.3
Total developing 2.7 4.3 6.6
Source: Yepes (2008) (quoted in Fay et al. 2011)Note: Figures reflect estimated expenditures needed to respond to increase demand for infrastructure services associated with projected income increases. Infrastructure includes water, sanitation, transport, and telecommunications. Expenditure percentages are calculations of average infrastructure spending needed over 2008–15 as a percentage.
Infrastructure demand for the 20 years to 2030 is expected to rise to USD 19.2 trillion, with Asia needing USD 15.8 trillion, emerging Europe needing USD 1.3 trillion, Latin America needing USD 1.2 trillion, Africa needing USD 0.7 trillion, and the Middle East needing USD 0.2 trillion (RBS, 2011). The investment requirements of African countries such as Nigeria, Angola and Kenya are growing particularly fast. In terms of the sector breakdown, RBS (2011) expect more than half of all spending needs to be related to electricity generation (USD 12.7 trillion), followed by roads (USD 4.2 trillion), mobile telecommunications (USD 2.0 trillion), fixed phone lines (USD 0.2 trillion) and rail (USD 0.2 trillion).
A number of regional studies have also tried to estimate future infrastructure investment requirements and gaps. There is a wide disparity among developing economies across regions. Latin America has invested little, with infrastructure investment comprising less than two percent of GDP from 1990 to 2010 (McKinsey, 2013). It would be necessary in the short to medium term to have a minimum investment of four percent of annual GDP in the main Latin American economies to maintain economic growth levels (BBVA, 2010).
India’s Planning Commission has projected that infrastructure investment will almost double to USD 1 trillion in the 12th Five-Year Plan, which runs from 2012 to 2017, amounting to an annual investment amount of about USD 200 billion in just one major Asian country (Sinha et al., 2012).
Bhattacharya (2012) finds that 32 developing economies in Asia will need infrastructure investment of USD 8.2 trillion (in 2008 prices) over the course of 2011 to 2020. This breaks down to an annual USD 776 billion worth of national investments (estimated in a top-down approach) and an annual USD 29 billion worth for regional infrastructure (estimated with a bottom-up approach).3 Two thirds is needed for new capacity and one third for maintenance and replacement of existing assets. About half of this should go toward energy, about one third for transport and the rest for telecommunications (13 percent) and water (five percent). In terms of countries, China needs more than half, and India more than a quarter of the estimated sums, followed by Indonesia (five percent).
In 2009, Africa’s infrastructure needs were estimated at USD 93 billion annually by the World Bank’s Africa Infrastructure Country Diagnostic. This is about twice as much as current spending. About two thirds of that is needed for new infrastructure. To take just one country as an example, Kenya’s infrastructure needs are estimated at USD 4 billion, or 20 percent of GDP (AICD, 2010).
3 There are two basic approaches: top-down and bottom-up. The first is based on the development of macro-statistics such as GDP, capital stock and investment. The second is based on micro-economic information, such as regional and sectoral case studies, planning documents from local entities, or experts’ assessments.
3
BACKGROUND
BACKGROUND
2
Physical shortcomings in infrastructure are evident everywhere. This paper’s focus, however, is on the financial aspect. An “infrastructure financing gap” can be defined as the difference between investment needs and resources, or the funds needed to maintain economic growth and available funds. If infrastructure investment needs are difficult to estimate, infrastructure financing gaps are even more so. It should be kept in mind that such estimates are typically “baseline figures” needed to keep pace with anticipated economic growth, rather than any “social optimum”. They are, of course, highly difficult and uncertain, and subject to qualifications and criticism (e.g., Gramlich, 1994, and Dethier and Moore, 2012).
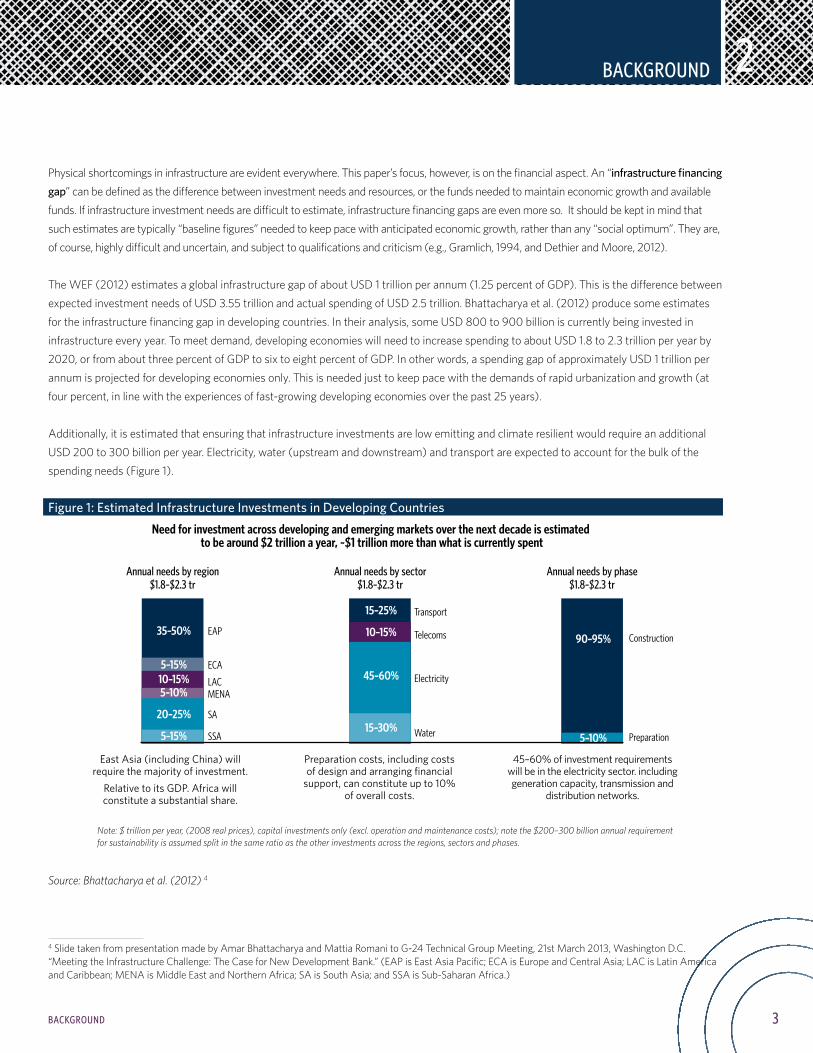
The WEF (2012) estimates a global infrastructure gap of about USD 1 trillion per annum (1.25 percent of GDP). This is the difference between expected investment needs of USD 3.55 trillion and actual spending of USD 2.5 trillion. Bhattacharya et al. (2012) produce some estimates for the infrastructure financing gap in developing countries. In their analysis, some USD 800 to 900 billion is currently being invested in infrastructure every year. To meet demand, developing economies will need to increase spending to about USD 1.8 to 2.3 trillion per year by 2020, or from about three percent of GDP to six to eight percent of GDP. In other words, a spending gap of approximately USD 1 trillion per annum is projected for developing economies only. This is needed just to keep pace with the demands of rapid urbanization and growth (at four percent, in line with the experiences of fast-growing developing economies over the past 25 years).
Additionally, it is estimated that ensuring that infrastructure investments are low emitting and climate resilient would require an additional USD 200 to 300 billion per year. Electricity, water (upstream and downstream) and transport are expected to account for the bulk of the spending needs (Figure 1).
Figure 1: Estimated Infrastructure Investments in Developing Countries
Source: Bhattacharya et al. (2012) 4
4 Slide taken from presentation made by Amar Bhattacharya and Mattia Romani to G-24 Technical Group Meeting, 21st March 2013, Washington D.C. “Meeting the Infrastructure Challenge: The Case for New Development Bank.” (EAP is East Asia Pacific; ECA is Europe and Central Asia; LAC is Latin America and Caribbean; MENA is Middle East and Northern Africa; SA is South Asia; and SSA is Sub-Saharan Africa.)
4
BACKGROUND
BACKGROUND
2
To conclude, infrastructure investment has historically been uneven across EMDE regions and countries at different development levels, with spending in East Asia well above that of other regions. Future investment requirements are generally seen to be even higher, with projections up to six to eight percent of GDP on average in EMDEs (or about USD 2 trillion per annum), i.e., exceeding both the world average of 3.5 to 4.5 percent and the current spending levels in most developing countries.
2.2. SOURCES OF FINANCING
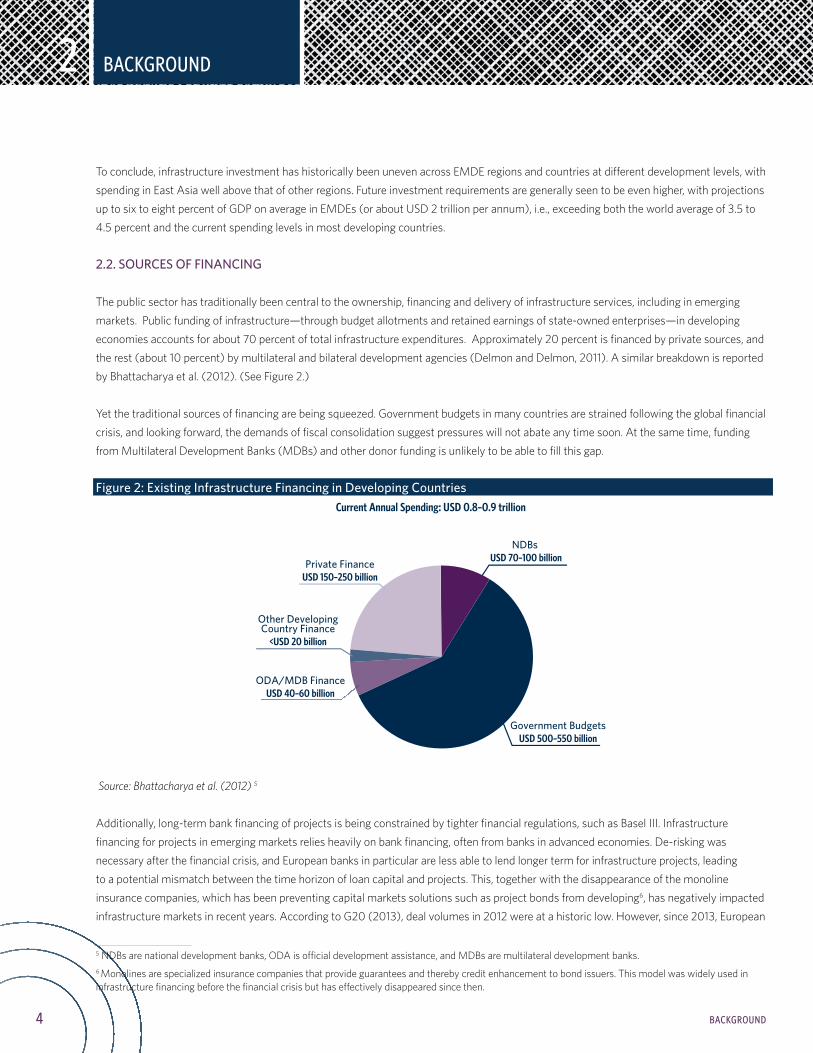
The public sector has traditionally been central to the ownership, financing and delivery of infrastructure services, including in emerging markets. Public funding of infrastructure—through budget allotments and retained earnings of state-owned enterprises—in developing economies accounts for about 70 percent of total infrastructure expenditures. Approximately 20 percent is financed by private sources, and the rest (about 10 percent) by multilateral and bilateral development agencies (Delmon and Delmon, 2011). A similar breakdown is reported by Bhattacharya et al. (2012). (See Figure 2.)
Yet the traditional sources of financing are being squeezed. Government budgets in many countries are strained following the global financial crisis, and looking forward, the demands of fiscal consolidation suggest pressures will not abate any time soon. At the same time, funding from Multilateral Development Banks (MDBs) and other donor funding is unlikely to be able to fill this gap.
Figure 2: Existing Infrastructure Financing in Developing Countries
Source: Bhattacharya et al. (2012) 5
Additionally, long-term bank financing of projects is being constrained by tighter financial regulations, such as Basel III. Infrastructure financing for projects in emerging markets relies heavily on bank financing, often from banks in advanced economies. De-risking was necessary after the financial crisis, and European banks in particular are less able to lend longer term for infrastructure projects, leading to a potential mismatch between the time horizon of loan capital and projects. This, together with the disappearance of the monoline insurance companies, which has been preventing capital markets solutions such as project bonds from developing6, has negatively impacted infrastructure markets in recent years. According to G20 (2013), deal volumes in 2012 were at a historic low. However, since 2013, European
5 NDBs are national development banks, ODA is official development assistance, and MDBs are multilateral development banks.6 Monolines are specialized insurance companies that provide guarantees and thereby credit enhancement to bond issuers. This model was widely used in infrastructure financing before the financial crisis but has effectively disappeared since then.
NDBs USD 70–100 billion
Government BudgetsUSD 500–550 billion
Private FinanceUSD 150–250 billion
Other DevelopingCountry Finance
<USD 20 billion
ODA/MDB FinanceUSD 40–60 billion
Current Annual Spending: USD 0.8–0.9 trillion
5
BACKGROUND
BACKGROUND
2
banks in particular have been more active again in the project finance arena, including starting to work with institutional investors on “originate to distribute” loan-to-bond financing deals. However these have so far been limited to developed economy projects.7
As the G20 has recognized (G20, 2013), aggregate debt flows to emerging markets and developing economies hide important information. Although highly rated emerging market borrowers were able to compensate for decreased bank lending, those without this access (including many low-income countries) faired relatively poorly.
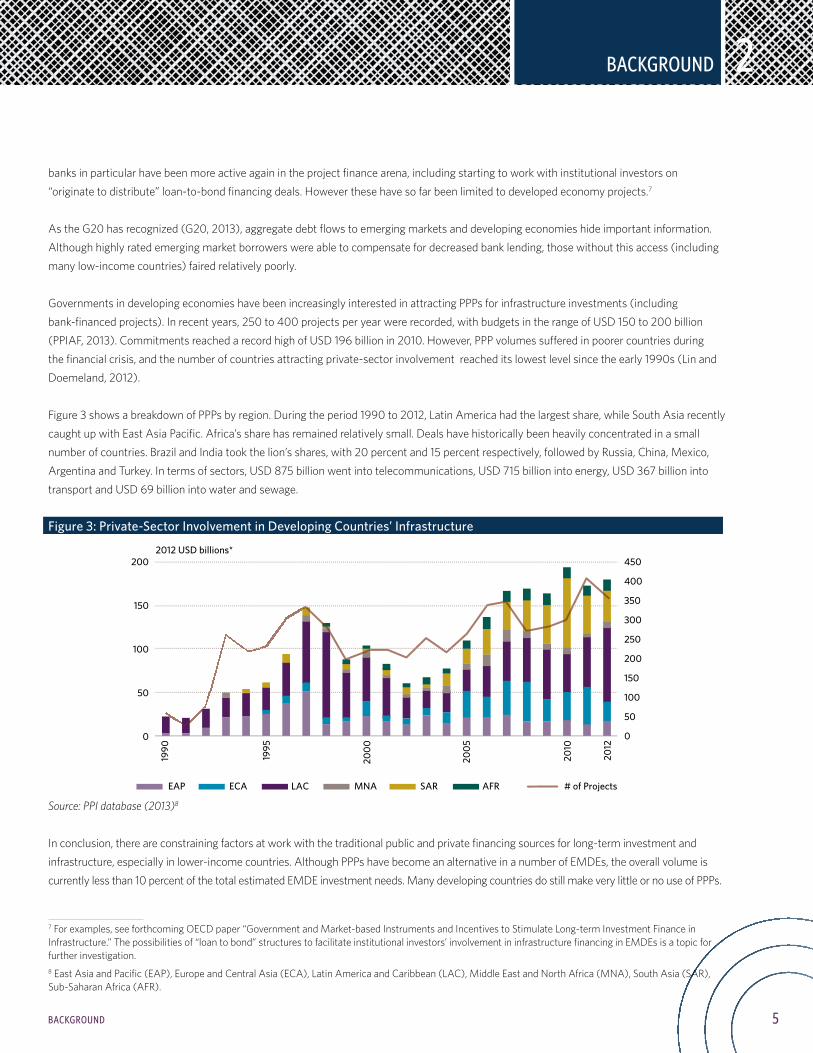
Governments in developing economies have been increasingly interested in attracting PPPs for infrastructure investments (including bank-financed projects). In recent years, 250 to 400 projects per year were recorded, with budgets in the range of USD 150 to 200 billion (PPIAF, 2013). Commitments reached a record high of USD 196 billion in 2010. However, PPP volumes suffered in poorer countries during the financial crisis, and the number of countries attracting private-sector involvement reached its lowest level since the early 1990s (Lin and Doemeland, 2012).
Figure 3 shows a breakdown of PPPs by region. During the period 1990 to 2012, Latin America had the largest share, while South Asia recently caught up with East Asia Pacific. Africa’s share has remained relatively small. Deals have historically been heavily concentrated in a small number of countries. Brazil and India took the lion’s shares, with 20 percent and 15 percent respectively, followed by Russia, China, Mexico, Argentina and Turkey. In terms of sectors, USD 875 billion went into telecommunications, USD 715 billion into energy, USD 367 billion into transport and USD 69 billion into water and sewage.
Figure 3: Private-Sector Involvement in Developing Countries’ Infrastructure
Source: PPI database (2013)8
In conclusion, there are constraining factors at work with the traditional public and private financing sources for long-term investment and infrastructure, especially in lower-income countries. Although PPPs have become an alternative in a number of EMDEs, the overall volume is currently less than 10 percent of the total estimated EMDE investment needs. Many developing countries do still make very little or no use of PPPs.
7 For examples, see forthcoming OECD paper “Government and Market-based Instruments and Incentives to Stimulate Long-term Investment Finance in Infrastructure.” The possibilities of “loan to bond” structures to facilitate institutional investors’ involvement in infrastructure financing in EMDEs is a topic for further investigation. 8 East Asia and Pacific (EAP), Europe and Central Asia (ECA), Latin America and Caribbean (LAC), Middle East and North Africa (MNA), South Asia (SAR), Sub-Saharan Africa (AFR).
Don’t need to repeat the title below, within the figure. And don’t need to repeat the source within the figure too . Also, change US$ to USD. I don’t think you need 2011 on the bottom axis. And can you use the same region abbreviations that were explained previously in a footnote? Otherwise, may need to explain the ones that are di�erent.
1990
1995
2000
2005
2010
2012
200
150
100
50
0
EAP ECA LAC MNA SAR AFR # of Projects
450
400
350
300
250
200
150
100
50
0
2012 USD billions*
6
INSTITUTIONAL INVESTORS AND INFRASTRUCTURE
INSTITUTIONAL INVESTORS AND INFRASTRUCTURE
3
Institutional Investors and Infrastructure
Policymakers have consequently been looking for potential alternative sources of financing from the private sector. Institutional investors (such as pension funds, insurance companies and sovereign wealth funds) have received increased attention. The headline figure for the assets under management (AUM) of institutional investors in OECD countries—USD 78.2 trillion in 2012 (OECD, 2013d)—has been driving attention towards this potential funding source.
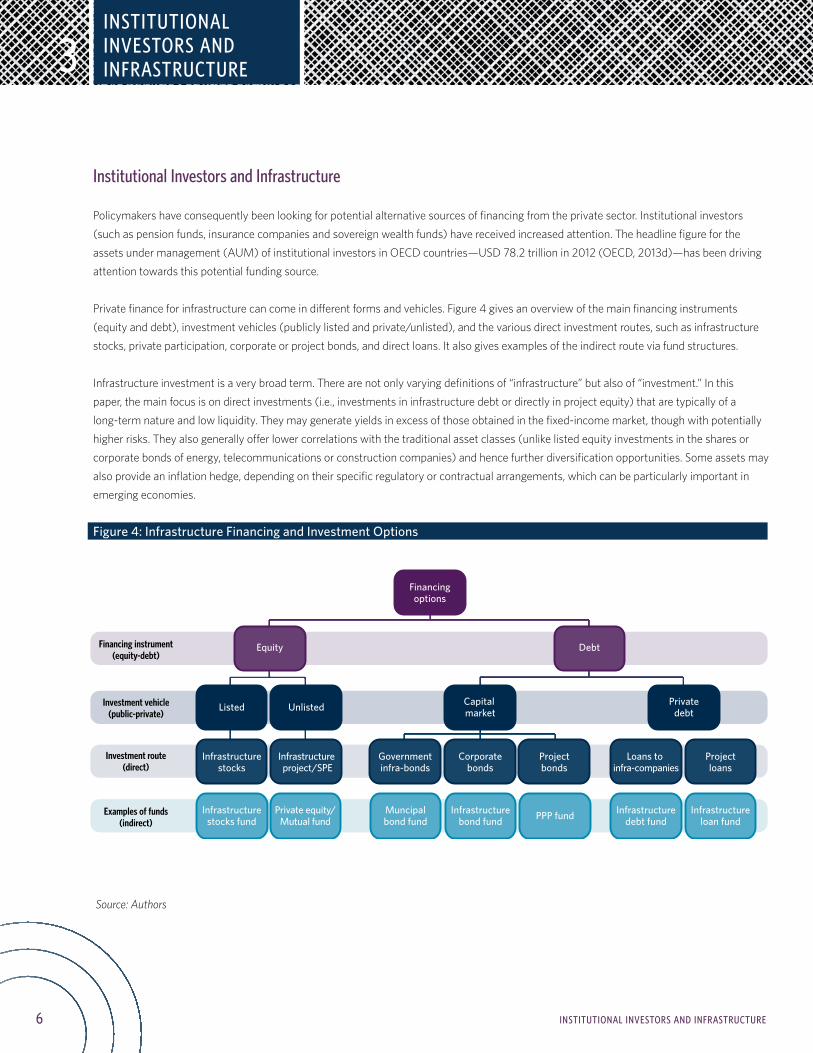
Private finance for infrastructure can come in different forms and vehicles. Figure 4 gives an overview of the main financing instruments (equity and debt), investment vehicles (publicly listed and private/unlisted), and the various direct investment routes, such as infrastructure stocks, private participation, corporate or project bonds, and direct loans. It also gives examples of the indirect route via fund structures.
Infrastructure investment is a very broad term. There are not only varying definitions of “infrastructure” but also of “investment.” In this paper, the main focus is on direct investments (i.e., investments in infrastructure debt or directly in project equity) that are typically of a long-term nature and low liquidity. They may generate yields in excess of those obtained in the fixed-income market, though with potentially higher risks. They also generally offer lower correlations with the traditional asset classes (unlike listed equity investments in the shares or corporate bonds of energy, telecommunications or construction companies) and hence further diversification opportunities. Some assets may also provide an inflation hedge, depending on their specific regulatory or contractual arrangements, which can be particularly important in emerging economies.
Figure 4: Infrastructure Financing and Investment Options
Source: Authors
Financingoptions
Debt
Capital market
Privatedebt
Corporatebonds
Governmentinfra-bonds
Projectbonds
Loans to infra-companies
Projectloans
Infrastructuredebt fund
Infrastructureloan fund
Infrastructurebond fund
Muncipalbond fund PPP fund
Equity
Listed Unlisted
Infrastructurestocks
Infrastructure project/SPE
Infrastructurestocks fund
Private equity/Mutual fund
Financing instrument(equity-debt)
Investment vehicle(public-private)
Investment route(direct)
Examples of funds(indirect)
Economic Infrastructure (e.g., transport,utilities, communication, renewable energy)
Social Infrastructure (e.g., schools, hospitals, defense buildings, prisons, stadiums)
Infrastructure Investment
Greenfield Investments• Construction• Design, build, operation risk• Typically higher risk
Brownfield Investments• Typically medium risk (e.g., operating toll road with need for significant capital investment for improvement/expantion)
Secondary Stage Investments• Post construction• Low risk, low return• Similar to long-term bond with coupon• Well-established cash flows (e.g., operating toll roads)
7
INSTITUTIONAL INVESTORS AND
INFRASTRUCTURE
INSTITUTIONAL INVESTORS AND INFRASTRUCTURE
3
The financial crisis in 2008 to 2009 intensified investors’ search for new, diversified sources of return, and led to increased allocations to “real” and “alternative” asset classes. In the current low-interest environment, many institutional investors are “starving” for yield, and are hoping to find it in lower-risk infrastructure assets (largely in advanced economies). Infrastructure assets can also assist with liability-driven investment (LDI) for pension funds and insurance companies with liabilities that are often stretching over several decades.
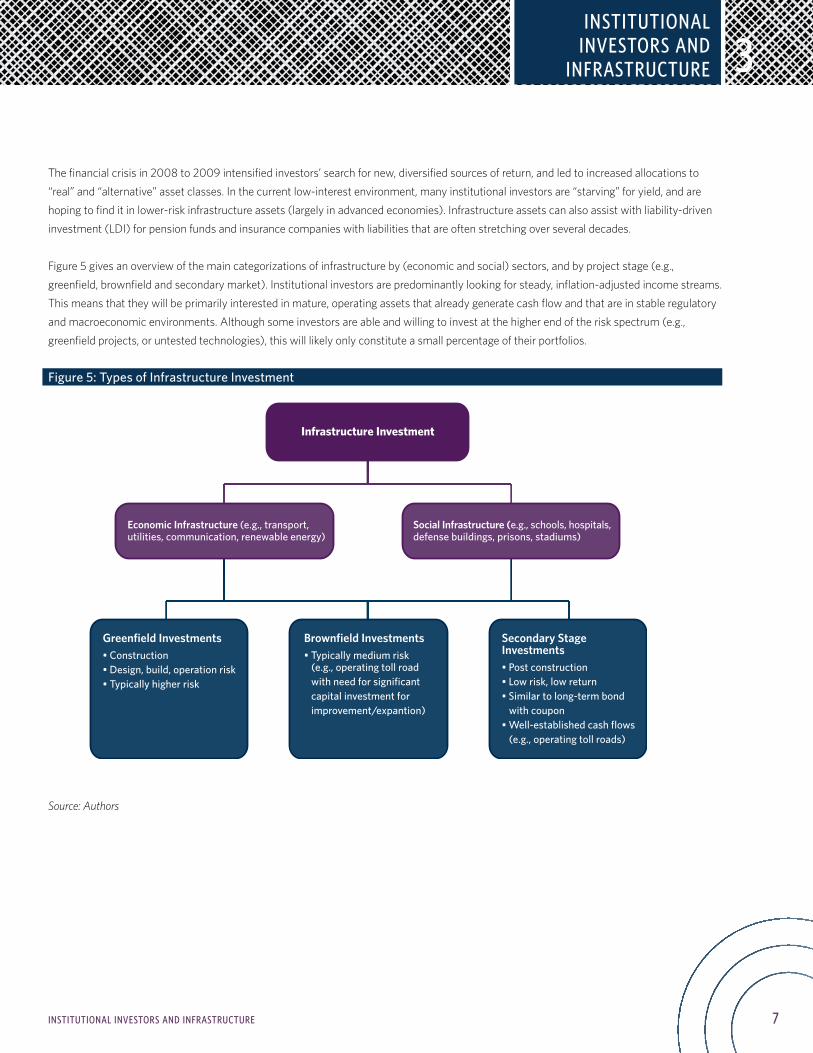
Figure 5 gives an overview of the main categorizations of infrastructure by (economic and social) sectors, and by project stage (e.g., greenfield, brownfield and secondary market). Institutional investors are predominantly looking for steady, inflation-adjusted income streams. This means that they will be primarily interested in mature, operating assets that already generate cash flow and that are in stable regulatory and macroeconomic environments. Although some investors are able and willing to invest at the higher end of the risk spectrum (e.g., greenfield projects, or untested technologies), this will likely only constitute a small percentage of their portfolios.
Figure 5: Types of Infrastructure Investment
Source: Authors
8 INSTITUTIONAL INVESTORS AND INFRASTRUCTURE
3
3.1. RISKS AND BARRIERS TO INSTITUTIONAL INVESTMENT IN INFRASTRUCTURE
From an investor perspective, infrastructure projects have their own inherent risks, including:
• Construction and development risks of (greenfield) projects;• Operational, demand and market risks (e.g., changing traffic numbers);• Financial and interest rate risks (e.g., leverage, refinancing);• Management and governance risks (e.g., corruption);• Regulatory risks (e.g., changing energy regulations); and• Political risks (e.g., changes in government or infrastructure policies).9
Previous experience of investment in projects with poor returns and little economic value serve as timely reminders.10 Most investors have very little experience in managing infrastructure assets and in managing risks that are inherent not only in infrastructure projects but also investment instruments. Infrastructure assets are very heterogeneous, which does not make the task any easier.
This makes the structuring of investment financing vehicles a key consideration. Institutional investors are only able or willing to take on certain types and amounts of risk. The key to the successful involvement of institutional investors in these projects is isolating and packing risks so that the institutions that can best take them on do so. Well-designed infrastructure instruments can help achieve this goal.11
Broader motivations for governments pursuing institutional investment in infrastructure include economic development goals and social responsibility considerations. However, it should be stressed that the primary objective of institutional investors is to pay such expenditures as pensions, annuities and insurance safely. Pension-plan trustees typically have a fiduciary duty toward their members. Investment decisions should only be made on a rigorously assessed, risk-return basis. Positive externalities, such as the development of capital markets and the economy more generally, should not drive investment decisions, and institutional investors should not be coerced into investing in infrastructure.
Different types of investors have different objectives, motivations, investment requirements and guidelines. For example, defined contribution (DC) pension funds often have easy withdrawal or switching options for members, and therefore the need to hold more liquid investments. Another factor is the liability profile: insurers need to match their liabilities while (mature) pension funds have higher shorter-term obligations and a limited ability to invest longer term. So far, only about one percent of institutional investors’ assets have been allocated to direct infrastructure investments globally (OECD, 2013a, and Inderst, 2013). Many barriers still remain (Table 2), ranging from a lack of knowledge and experience on the part of institutional investors to (the sometimes unintended consequences of) regulatory restrictions. Institutional investors are subject to more or less strict regulatory funding and solvency regimes, and accounting rules, and they may even face quantitative investment constraints in a range of countries. Such regulations are often misaligned, short-term incentives that prevent them from operating in their true long-term capacity. Investment vehicles suitably structured with the risk-return profile that institutional investors need are also in short supply.
9 See also Schwartz et al., 2014 10 Pension funds and other institutional investors suffered in some prominent examples of financial failures in advanced markets as well, frequently as a result of exaggerated demand expectations and financial leverage, e.g., Eurotunnel or the Cross City Tunnel in Sydney. 11 The designing of PPP concessions with the involvement of institutional investors in mind is also key. Though beyond the scope of this paper, this is a topic worthy of further discussion.
INSTITUTIONAL INVESTORS AND INFRASTRUCTURE
9INSTITUTIONAL INVESTORS AND INFRASTRUCTURE
3
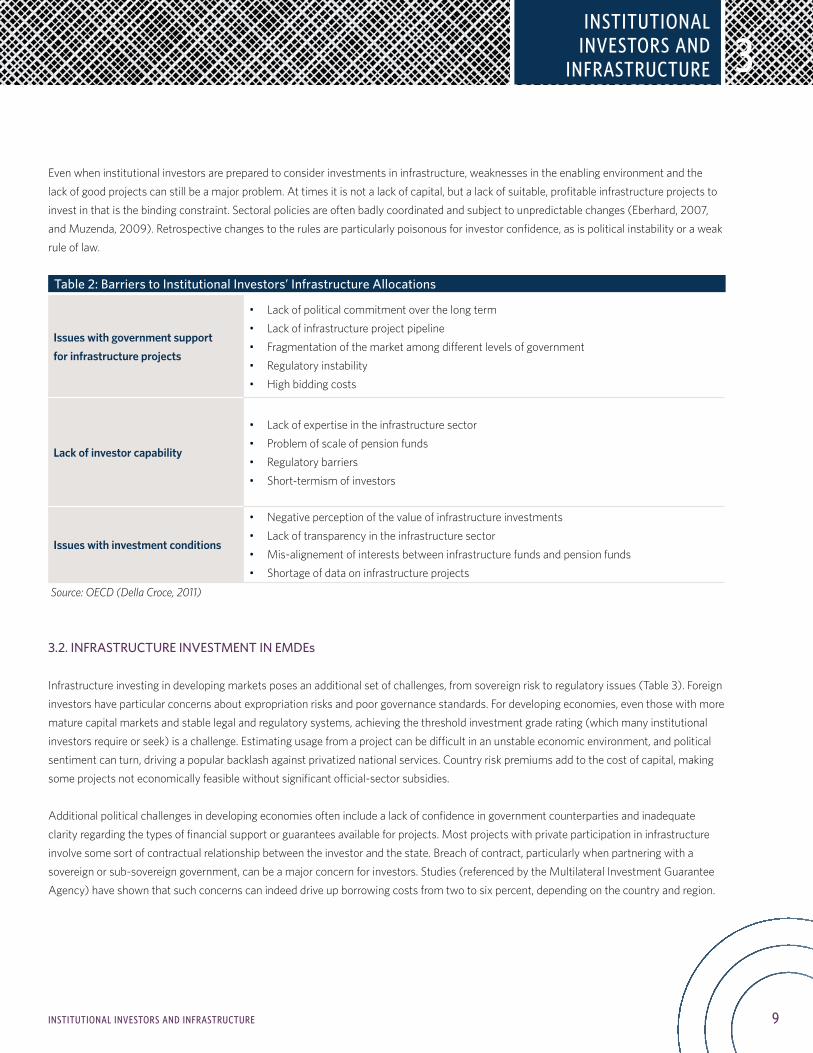
Even when institutional investors are prepared to consider investments in infrastructure, weaknesses in the enabling environment and the lack of good projects can still be a major problem. At times it is not a lack of capital, but a lack of suitable, profitable infrastructure projects to invest in that is the binding constraint. Sectoral policies are often badly coordinated and subject to unpredictable changes (Eberhard, 2007, and Muzenda, 2009). Retrospective changes to the rules are particularly poisonous for investor confidence, as is political instability or a weak rule of law.
Table 2: Barriers to Institutional Investors’ Infrastructure Allocations
Issues with government support for infrastructure projects
• Lack of political commitment over the long term• Lack of infrastructure project pipeline• Fragmentation of the market among different levels of government• Regulatory instability• High bidding costs
Lack of investor capability
• Lack of expertise in the infrastructure sector• Problem of scale of pension funds• Regulatory barriers• Short-termism of investors
Issues with investment conditions
• Negative perception of the value of infrastructure investments• Lack of transparency in the infrastructure sector• Mis-alignement of interests between infrastructure funds and pension funds• Shortage of data on infrastructure projects
Source: OECD (Della Croce, 2011)
3.2. INFRASTRUCTURE INVESTMENT IN EMDEs
Infrastructure investing in developing markets poses an additional set of challenges, from sovereign risk to regulatory issues (Table 3). Foreign investors have particular concerns about expropriation risks and poor governance standards. For developing economies, even those with more mature capital markets and stable legal and regulatory systems, achieving the threshold investment grade rating (which many institutional investors require or seek) is a challenge. Estimating usage from a project can be difficult in an unstable economic environment, and political sentiment can turn, driving a popular backlash against privatized national services. Country risk premiums add to the cost of capital, making some projects not economically feasible without significant official-sector subsidies.
Additional political challenges in developing economies often include a lack of confidence in government counterparties and inadequate clarity regarding the types of financial support or guarantees available for projects. Most projects with private participation in infrastructure involve some sort of contractual relationship between the investor and the state. Breach of contract, particularly when partnering with a sovereign or sub-sovereign government, can be a major concern for investors. Studies (referenced by the Multilateral Investment Guarantee Agency) have shown that such concerns can indeed drive up borrowing costs from two to six percent, depending on the country and region.
INSTITUTIONAL INVESTORS AND
INFRASTRUCTURE
10 INSTITUTIONAL INVESTORS AND INFRASTRUCTURE
3
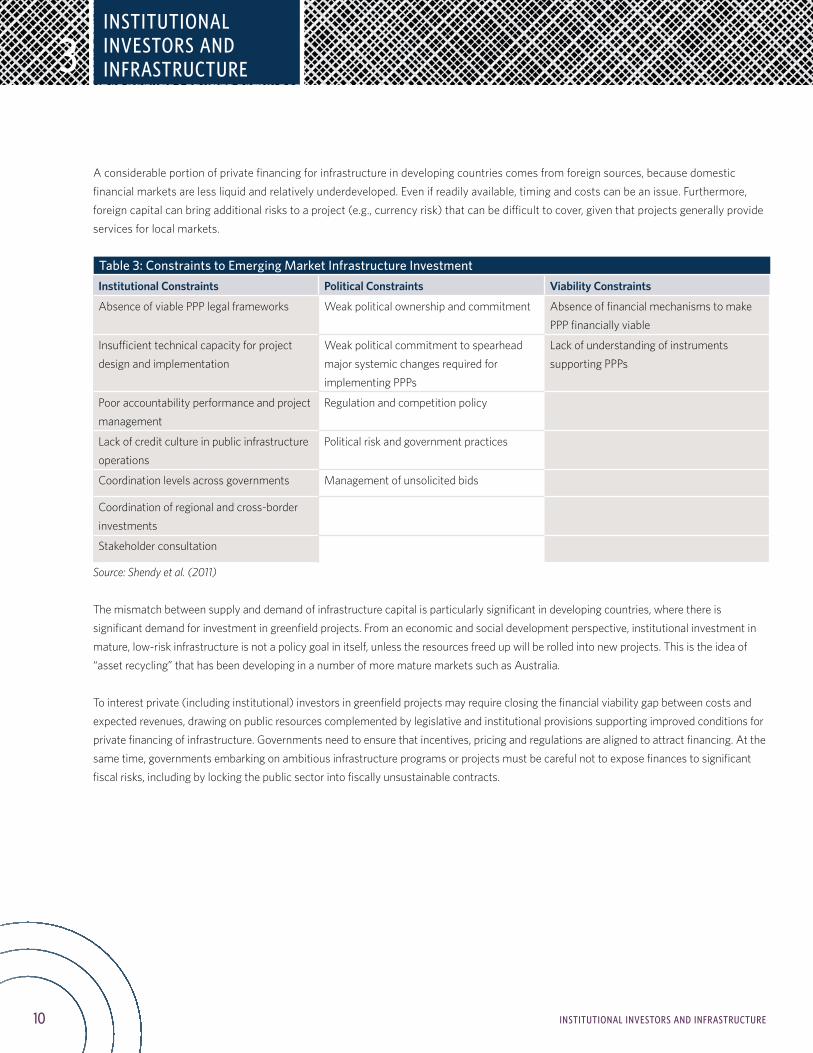
A considerable portion of private financing for infrastructure in developing countries comes from foreign sources, because domestic financial markets are less liquid and relatively underdeveloped. Even if readily available, timing and costs can be an issue. Furthermore, foreign capital can bring additional risks to a project (e.g., currency risk) that can be difficult to cover, given that projects generally provide services for local markets.
Table 3: Constraints to Emerging Market Infrastructure InvestmentInstitutional Constraints Political Constraints Viability Constraints
Absence of viable PPP legal frameworks Weak political ownership and commitment Absence of financial mechanisms to make PPP financially viable
Insufficient technical capacity for project design and implementation
Weak political commitment to spearhead major systemic changes required for implementing PPPs
Lack of understanding of instruments supporting PPPs
Poor accountability performance and project management
Regulation and competition policy
Lack of credit culture in public infrastructure operations
Political risk and government practices
Coordination levels across governments Management of unsolicited bids
Coordination of regional and cross-border investments
Stakeholder consultation
Source: Shendy et al. (2011)
The mismatch between supply and demand of infrastructure capital is particularly significant in developing countries, where there is significant demand for investment in greenfield projects. From an economic and social development perspective, institutional investment in mature, low-risk infrastructure is not a policy goal in itself, unless the resources freed up will be rolled into new projects. This is the idea of “asset recycling” that has been developing in a number of more mature markets such as Australia.
To interest private (including institutional) investors in greenfield projects may require closing the financial viability gap between costs and expected revenues, drawing on public resources complemented by legislative and institutional provisions supporting improved conditions for private financing of infrastructure. Governments need to ensure that incentives, pricing and regulations are aligned to attract financing. At the same time, governments embarking on ambitious infrastructure programs or projects must be careful not to expose finances to significant fiscal risks, including by locking the public sector into fiscally unsustainable contracts.
INSTITUTIONAL INVESTORS AND INFRASTRUCTURE
11INSTITUTIONAL INVESTORS AND INFRASTRUCTURE
3
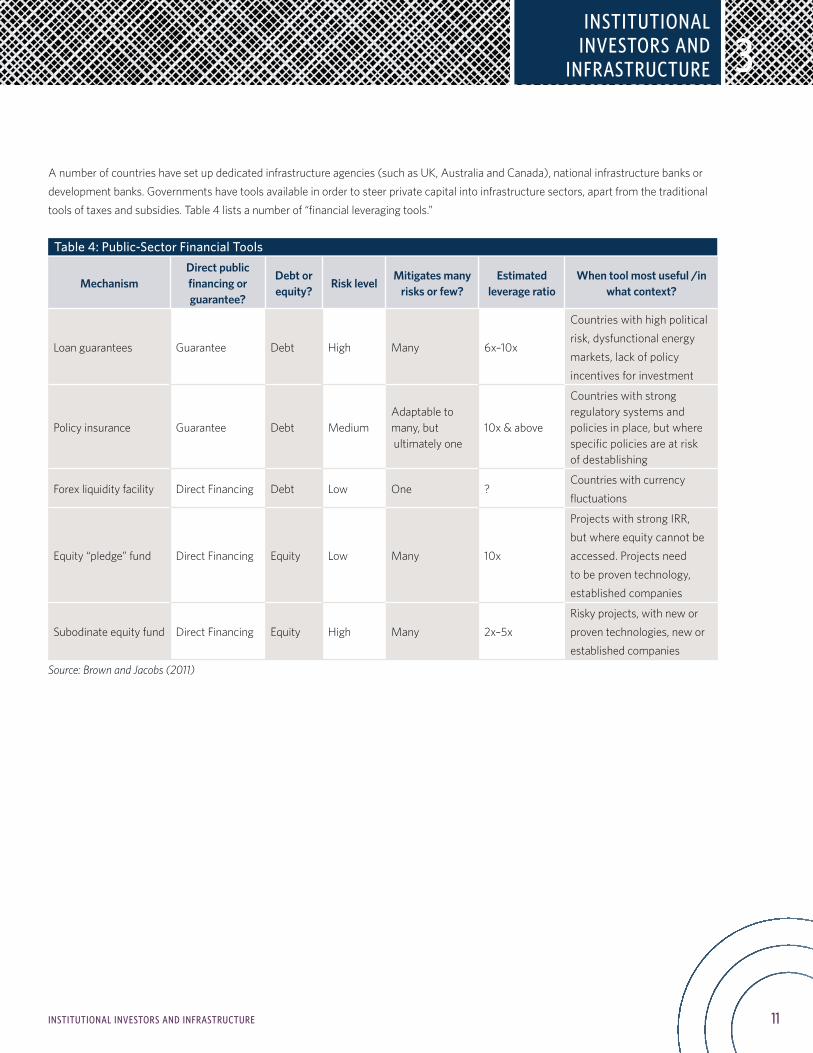
A number of countries have set up dedicated infrastructure agencies (such as UK, Australia and Canada), national infrastructure banks or development banks. Governments have tools available in order to steer private capital into infrastructure sectors, apart from the traditional tools of taxes and subsidies. Table 4 lists a number of “financial leveraging tools.”
Table 4: Public-Sector Financial Tools
MechanismDirect public financing or guarantee?
Debt or equity?
Risk levelMitigates many
risks or few?Estimated
leverage ratioWhen tool most useful /in
what context?
Loan guarantees Guarantee Debt High Many 6x–10x
Countries with high political risk, dysfunctional energy markets, lack of policy incentives for investment
Policy insurance Guarantee Debt MediumAdaptable to many, but ultimately one
10x & above
Countries with strong regulatory systems and policies in place, but where specific policies are at risk of destablishing
Forex liquidity facility Direct Financing Debt Low One ?Countries with currency fluctuations
Equity “pledge” fund Direct Financing Equity Low Many 10x
Projects with strong IRR, but where equity cannot be accessed. Projects need to be proven technology, established companies
Subodinate equity fund Direct Financing Equity High Many 2x–5xRisky projects, with new or proven technologies, new or established companies
Source: Brown and Jacobs (2011)
INSTITUTIONAL INVESTORS AND
INFRASTRUCTURE
12
INTERNATIONAL INVESTORS
INTERNATIONAL INVESTORS
4
International Investors
Even though some institutional investors are gradually increasing their exposure to infrastructure and other real assets, the vast majority of their investments are still concentrated in their home markets, i.e., in OECD economies. That said, some of the leading international institutional investors have started to seek out opportunities in developing economies (Box 1).
Australia: Australian superannuation funds invest in infrastructure primarily via infrastructure funds. As an example, IFM is a specialist investment management company wholly owned by the superannuation funds. IFM was established in 1995 and manages infrastructure assets with a total value of more than AUD 13 billion (as of June 2013). A small part of its portfolio is invested in emerging markets. For instance, IFM is the single owner of Pacific Hydro, a renewable energy (hydro and wind) operator in Australia, Brazil and Chile that was delisted from the Australian stock exchange in 2005. Pacific Holdings’ first investment in Chile dates from 2004, and its first investment in Brazil dates from 2007. It pioneered the wind energy market in Brazil through the construction of two of the country’s first wind farms, Millenium and Vale dos Ventos, on the northeast coast. Pacific Holdings accounts for about 11 percent of the infrastructure portfolio of AustralianSuper, one of the country’s larger industry superannuation funds.
Canada: The largest Canadian pension funds remain primarily focused on deals originating in North America and Western Europe, but they look at other regions on an opportunistic basis if they offer stable regulatory, economic and political environments. Some prominent deals have been made by Canadian pension funds such as OTTP, OMERS, CPPIB and AIMCo. OTTP was one of the first OECD pension funds to invest in Latin American unlisted infrastructure when it bought two Chilean water companies in 2007. OTTP also owns 50 percent of Grupo Saese, a Chilean electricity transmission and distribution company. The other half was bought by AIMCo, which manages Alberta’s public-sector pension funds. AIMCo also bought half of Autopista Central, a Chilean toll road, in 2010. In 2012, the Canadian Pension Plan Investment Board invested more than CAD 1.1 billion in five major Chilean toll roads. In 2014, CPP acquired a 10-percent stake in Peru’s largest natural gas pipeline operator. Canadian pension funds have also been courted for investment in Indian infrastructure projects. The Union Road Transport and Highways Minister invited Canadian pension funds (such as Ontario Teachers) and financial institutions to participate in the National Highway Development Project (NHDP) in 2010.
Netherlands: One of the major Dutch pension funds, PFZW (the pension fund of the healthcare sector), invests in infrastructure via the PPGM Infrastructure Fund, which was established in January 2010. The fund invests in unlisted infrastructure equity. PPGM, the asset manager wholly owned by PFZW, acts as the fund’s General Partner and PFZW and other Dutch pension funds are the Limited Partners. The PGGM Infrastructure fund has more than EUR 1.25 billion in assets under management, of which about five percent is in emerging markets infrastructure funds managed by third parties (e.g., an India-specific infrastructure fund). The fund has a target for emerging markets infrastructure exposure of 25 percent by 2015. Among the new destinations for its investments, it is monitoring opportunities in China (via infrastructure funds launched by managers such as Macquarie). APG, the largest Dutch pension fund, opened an office in Hong Kong in 2007 in order to expand its infrastructure and real-estate portfolios. (continued on page 13)
Box 1: Examples of “North-South” Pension Fund Investment in Infrastructure
13
INTERNATIONAL INVESTORS
INTERNATIONAL INVESTORS
4
4.1. INFRASTRUCTURE FUNDS
Infrastructure funds have existed for a long time in the form of equity-sector funds or specialist private-equity funds (e.g., in energy). Dedicated infrastructure funds became popular starting in the 1990s in Australia (often as listed funds) and in the 2000s in Europe and North America (mostly private closed-end funds). A large number of private infrastructure funds were launched before the financial crisis, driven by robust capital market activity, low interest rates, and the need to spend on infrastructure to sustain growth, which led to heavy competition for assets and rising prices (and lowering returns). After a temporary slowdown in launches, “boom times” appear to have come back with many “new entrants” in this field from all regions, including developers and other corporates, or family offices and private wealth managers.
Many infrastructure funds and fund managers are involved in EMDEs. It is important to distinguish between funds that invest in emerging markets’ infrastructure (but are often based in OECD countries) and investment managers that are based in EMDEs (but do not necessarily invest all their money there).
Today, there are many funds of different kinds that invest in EMDE infrastructure. Infrastructure funds have different and often broad-ranging investor bases. Hildyard (2012) produced a comprehensive list of infrastructure funds and their involvement in developing countries. They are often also backed by Development Finance Institutions and Multinational Development Banks.12 Appendix 1 contains a list (produced by Preqin) of the largest funds that are currently raising capital in different regions.
How many infrastructure funds are active in emerging markets? Between 2004 and 2013, 123 funds were closed, with a volume of USD 41 billion (Table 5). Preqin counted 60 fund managers that were seeking to raise USD 27 billion worth of capital for EMDE infrastructure. Almost
12 Examples of investors from mature markets given by Hildyard (2010) include the French CDC in the SAIF fund, various Canadian pension plans in Chilean funds, and the Dutch APG pension plan in the Philippine PINA fund. In addition, there are mentions of SWF involvement from Singapore, China and the Middle East. Finally, local pension and social security funds are already invested in infrastructure funds in places like China, Brazil, Chile, Mexico, South Africa and the Philippines.
Box 1: Examples of “North-South” Pension Fund Investment in Infrastructure (continued from page 12)
Denmark: PensionDanmark, PKA and other Danish pension funds have committed launch capital to a new Danish Climate Investment Fund. It is designed to invest in projects that directly or indirectly contribute to reducing greenhouse gas emissions, and in all the so-called DAC countries (i.e. OECD Development Assistance Committee’s member states). The Fund is a new type of public/private partnership in which state funds and private-pension investments work together with a fund manager, IFU. The invested capital of DKK 1.2 billion consists of development funds (DKK 275 million), IFU’s funds (DKK 250 million) and funds from the institutional investors (DKK 675 million thus far). The annual return is expected to be a competitive 12 per cent of the invested capital. Furthermore, PKA committed to emerging markets private equity funds such as Actis, which also invests in social and economic infrastructure in Latin America, Africa and Asia, including healthcare in India.
United Kingdom: The largest U.K. pension fund, USS, is expanding and diversifying its indirect and direct infrastructure holdings. It is investing (alongside PGGM and Canadian OPTrust) EUR 150 million in infrastructure debt in the form of a convertible loan to Globalvia Inversiones, with a portfolio of 20 core infrastructure companies in seven countries. It includes toll roads and airports in Mexico, Chile and Costa Rica.
Source: Stewart and Yermo (2012), Authors
14 INTERNATIONAL INVESTORS
4
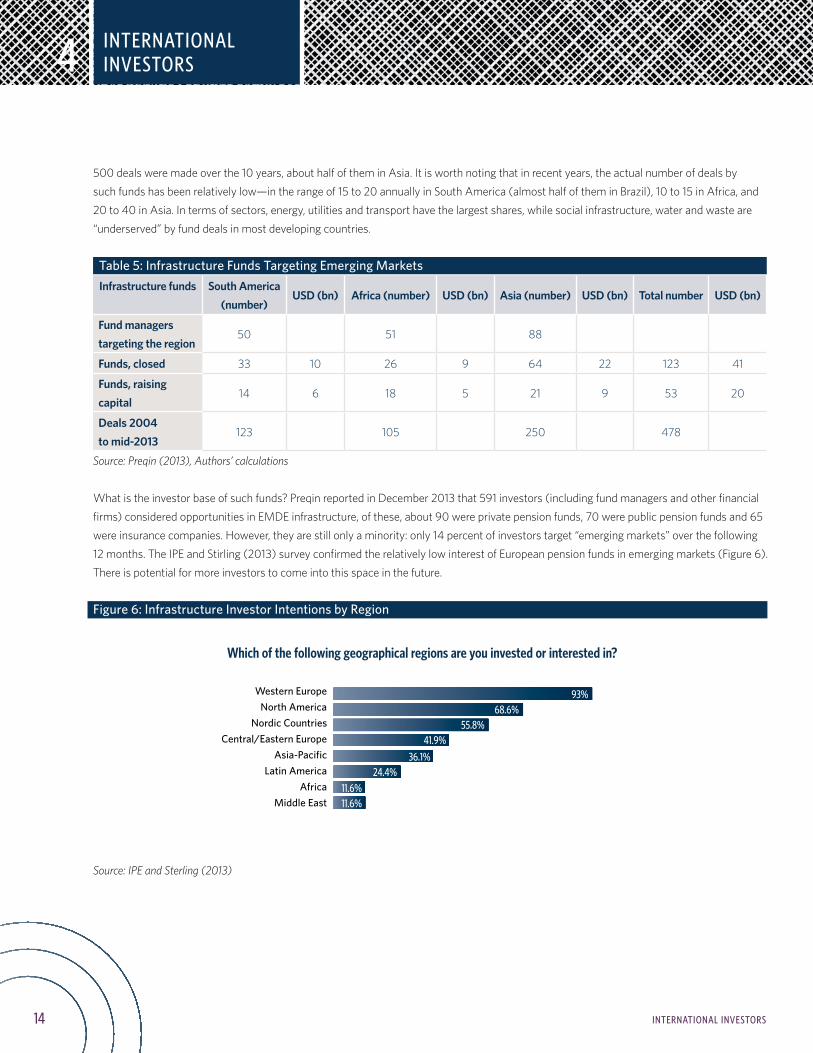
500 deals were made over the 10 years, about half of them in Asia. It is worth noting that in recent years, the actual number of deals by such funds has been relatively low—in the range of 15 to 20 annually in South America (almost half of them in Brazil), 10 to 15 in Africa, and 20 to 40 in Asia. In terms of sectors, energy, utilities and transport have the largest shares, while social infrastructure, water and waste are “underserved” by fund deals in most developing countries.
Table 5: Infrastructure Funds Targeting Emerging MarketsInfrastructure funds
South America
(number)USD (bn) Africa (number) USD (bn) Asia (number) USD (bn) Total number USD (bn)
Fund managers targeting the region
50 51 88
Funds, closed 33 10 26 9 64 22 123 41
Funds, raising capital
14 6 18 5 21 9 53 20
Deals 2004 to mid-2013
123 105 250 478
Source: Preqin (2013), Authors’ calculations
What is the investor base of such funds? Preqin reported in December 2013 that 591 investors (including fund managers and other financial firms) considered opportunities in EMDE infrastructure, of these, about 90 were private pension funds, 70 were public pension funds and 65 were insurance companies. However, they are still only a minority: only 14 percent of investors target “emerging markets” over the following 12 months. The IPE and Stirling (2013) survey confirmed the relatively low interest of European pension funds in emerging markets (Figure 6). There is potential for more investors to come into this space in the future.
Figure 6: Infrastructure Investor Intentions by Region
Source: IPE and Sterling (2013)
Which of the following geographical regions are you invested or interested in?
Western EuropeNorth America
Nordic CountriesCentral/Eastern Europe
Asia-PacificLatin America
AfricaMiddle East
93%68.6%
55.8%41.9%
36.1%24.4%
11.6%11.6%
Which of the following geographical regions are you invested in or interested in?
INTERNATIONAL INVESTORS
15INTERNATIONAL INVESTORS
4
The number of infrastructure funds and fund managers based in EMDEs has also grown. In 2012, Preqin counted 42 infrastructure fund managers based in emerging markets that manage 62 infrastructure vehicles with an aggregate volume of USD 37 billion. There were 23 more unlisted infrastructure funds currently “on the road” by such managers, seeking a further USD 19 billion worth of capital. The most represented countries in terms of assets are India, Brazil and Singapore.
An estimated USD 50 billion worth of capital has been channelled through unlisted infrastructure funds in emerging markets. The impact is difficult to measure. Two points need to be taken into account: First, some of this capital is committed but not yet invested, and second, most of these funds provide equity to finance much larger projects. For example, with a leverage ratio of four or five, a USD 100 million fund can support a deal volume up to USD 1 billion. There are a number of questions—that are beyond the scope of this paper—that deserve further investigation, such as where exactly these funds are investing, in what kind of infrastructure projects, how they perform, and to what extent institutional investors are involved.
4.2. MULTILATERAL AND NATIONAL DEVELOPMENT BANKS
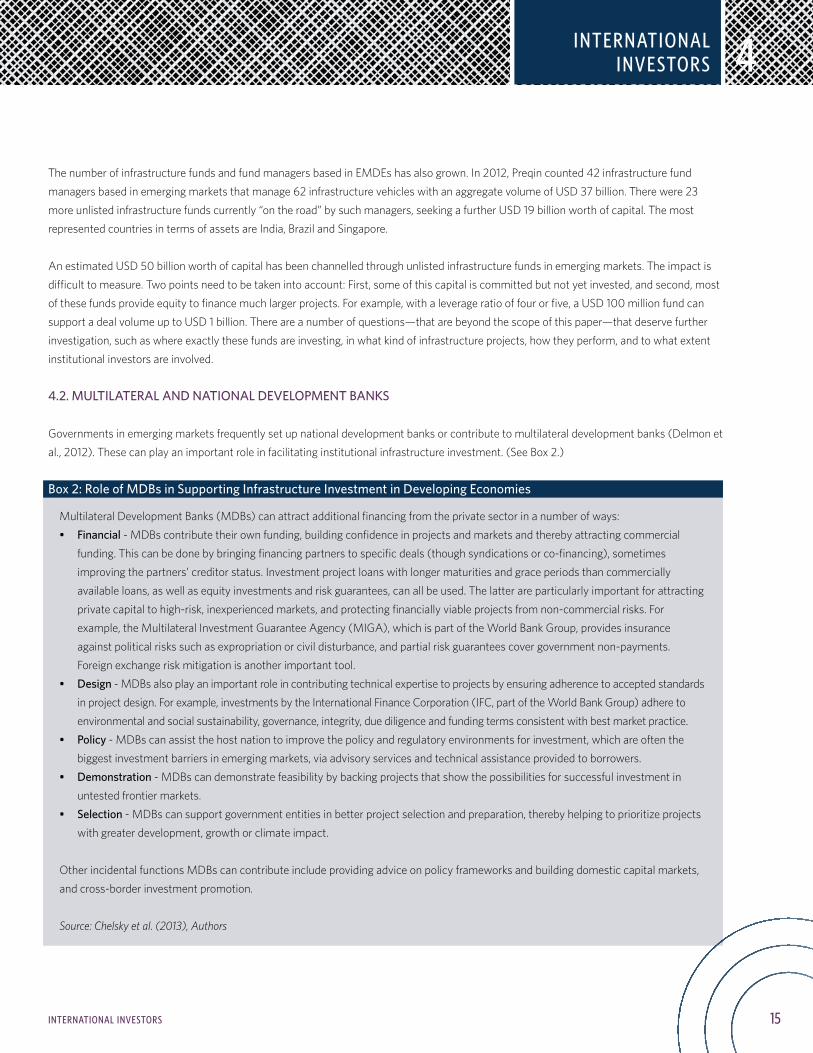
Governments in emerging markets frequently set up national development banks or contribute to multilateral development banks (Delmon et al., 2012). These can play an important role in facilitating institutional infrastructure investment. (See Box 2.)
Box 2: Role of MDBs in Supporting Infrastructure Investment in Developing Economies
Multilateral Development Banks (MDBs) can attract additional financing from the private sector in a number of ways:• Financial - MDBs contribute their own funding, building confidence in projects and markets and thereby attracting commercial
funding. This can be done by bringing financing partners to specific deals (though syndications or co-financing), sometimes improving the partners’ creditor status. Investment project loans with longer maturities and grace periods than commercially available loans, as well as equity investments and risk guarantees, can all be used. The latter are particularly important for attracting private capital to high-risk, inexperienced markets, and protecting financially viable projects from non-commercial risks. For example, the Multilateral Investment Guarantee Agency (MIGA), which is part of the World Bank Group, provides insurance against political risks such as expropriation or civil disturbance, and partial risk guarantees cover government non-payments. Foreign exchange risk mitigation is another important tool.
• Design - MDBs also play an important role in contributing technical expertise to projects by ensuring adherence to accepted standards in project design. For example, investments by the International Finance Corporation (IFC, part of the World Bank Group) adhere to environmental and social sustainability, governance, integrity, due diligence and funding terms consistent with best market practice.
• Policy - MDBs can assist the host nation to improve the policy and regulatory environments for investment, which are often the biggest investment barriers in emerging markets, via advisory services and technical assistance provided to borrowers.
• Demonstration - MDBs can demonstrate feasibility by backing projects that show the possibilities for successful investment in untested frontier markets.
• Selection - MDBs can support government entities in better project selection and preparation, thereby helping to prioritize projects with greater development, growth or climate impact.
Other incidental functions MDBs can contribute include providing advice on policy frameworks and building domestic capital markets, and cross-border investment promotion.
Source: Chelsky et al. (2013), Authors
INTERNATIONAL INVESTORS
16 DOMESTIC INVESTORS
5
Domestic Investors
Domestic institutional investors are another potentially important and growing source of capital in emerging economies. Investing domestically can have several advantages: It avoids foreign exchange exposure and risks, and it can contribute to economic growth and development, not only via infrastructure improvements, but also by helping to develop the local financial sector and capital markets.
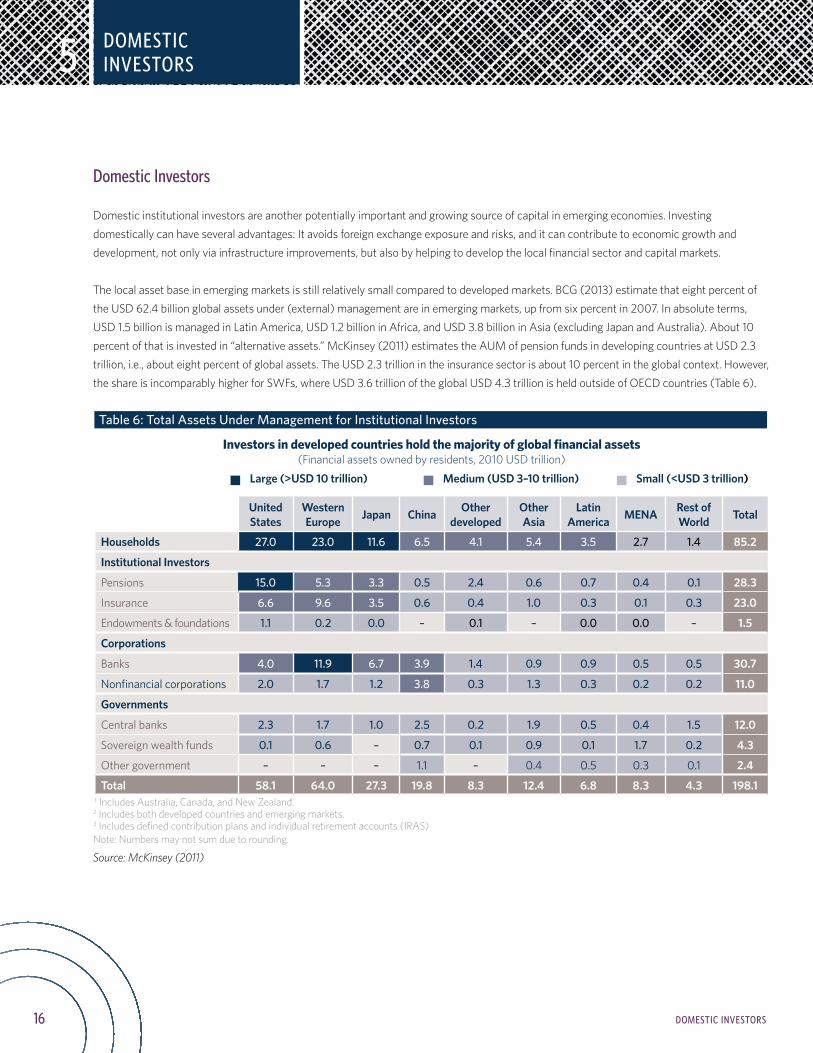
The local asset base in emerging markets is still relatively small compared to developed markets. BCG (2013) estimate that eight percent of the USD 62.4 billion global assets under (external) management are in emerging markets, up from six percent in 2007. In absolute terms, USD 1.5 billion is managed in Latin America, USD 1.2 billion in Africa, and USD 3.8 billion in Asia (excluding Japan and Australia). About 10 percent of that is invested in “alternative assets.” McKinsey (2011) estimates the AUM of pension funds in developing countries at USD 2.3 trillion, i.e., about eight percent of global assets. The USD 2.3 trillion in the insurance sector is about 10 percent in the global context. However, the share is incomparably higher for SWFs, where USD 3.6 trillion of the global USD 4.3 trillion is held outside of OECD countries (Table 6).
Table 6: Total Assets Under Management for Institutional Investors
Investors in developed countries hold the majority of global financial assets (Financial assets owned by residents, 2010 USD trillion)
Large (>USD 10 trillion) Medium (USD 3–10 trillion) Small (<USD 3 trillion)
United States
WesternEurope Japan China Other
developedOther Asia
Latin America MENA Rest of
World Total
Households 27.0 23.0 11.6 6.5 4.1 5.4 3.5 2.7 1.4 85 .2
Institutional Investors
Pensions 15.0 5.3 3.3 0.5 2.4 0.6 0.7 0.4 0.1 28 .3
Insurance 6.6 9.6 3.5 0.6 0.4 1.0 0.3 0.1 0.3 23 .0
Endowments & foundations 1.1 0.2 0.0 – 0.1 – 0.0 0.0 – 1 .5
Corporations
Banks 4.0 11.9 6.7 3.9 1.4 0.9 0.9 0.5 0.5 30 .7
Nonfinancial corporations 2.0 1.7 1.2 3.8 0.3 1.3 0.3 0.2 0.2 11 .0
Governments
Central banks 2.3 1.7 1.0 2.5 0.2 1.9 0.5 0.4 1.5 12 .0
Sovereign wealth funds 0.1 0.6 – 0.7 0.1 0.9 0.1 1.7 0.2 4 .3
Other government – – – 1.1 – 0.4 0.5 0.3 0.1 2 .4
Total 58 .1 64 .0 27 .3 19 .8 8 .3 12 .4 6 .8 8 .3 4 .3 198 .1 1 Includes Australia, Canada, and New Zealand.2 Includes both developed countries and emerging markets.3 Includes defined contribution plans and individual retirement accounts (IRAS)Note: Numbers may not sum due to rounding.
Source: McKinsey (2011)
DOMESTIC INVESTORS
17
5
DOMESTIC INVESTORS
It is worth noting that, in addition to institutional capital, there is also substantial wealth owned privately in EMDE countries. BCG (2013b) reports USD 3.9 trillion of private financial wealth in Latin America, USD 4.8 trillion in the Middle East and Africa, and USD 28 billion in Asia (excluding Japan) in 2012. The global figure is USD 135 billion. Furthermore, the importance of emerging countries is expected to rise rapidly. The 2012 increase of USD 4.5 trillion in the “new world” was almost as high as in the “old world.”13
In the 1990s, there was a “first wave” of institutional investor involvement in emerging markets infrastructure (Ferreira and Khatami, 1996). Countries such as Korea, Malaysia, Thailand, Chile and Argentina were pivotal in leading these new investments with infrastructure bonds, corporate bonds and listed equities (Kumar et al., 1997, and Blommestein, 1997). The discussion also started in the African context (Kerf and Smith, 1996). However, the Asian and Russian crisis, the bursting of the tech bubble, and domestic problems led to a temporary setback. In the 2000s, infrastructure investing by pension funds and insurance companies became an increasingly important theme in advanced markets, especially in Europe and the United States, following the early experiences in Australia and Canada (Inderst, 2009). Such activity increased also in the developing world (see e.g., BBVA (2010, 2011), Mbeng Mezui (2012, 2013), World Bank (2012b)).
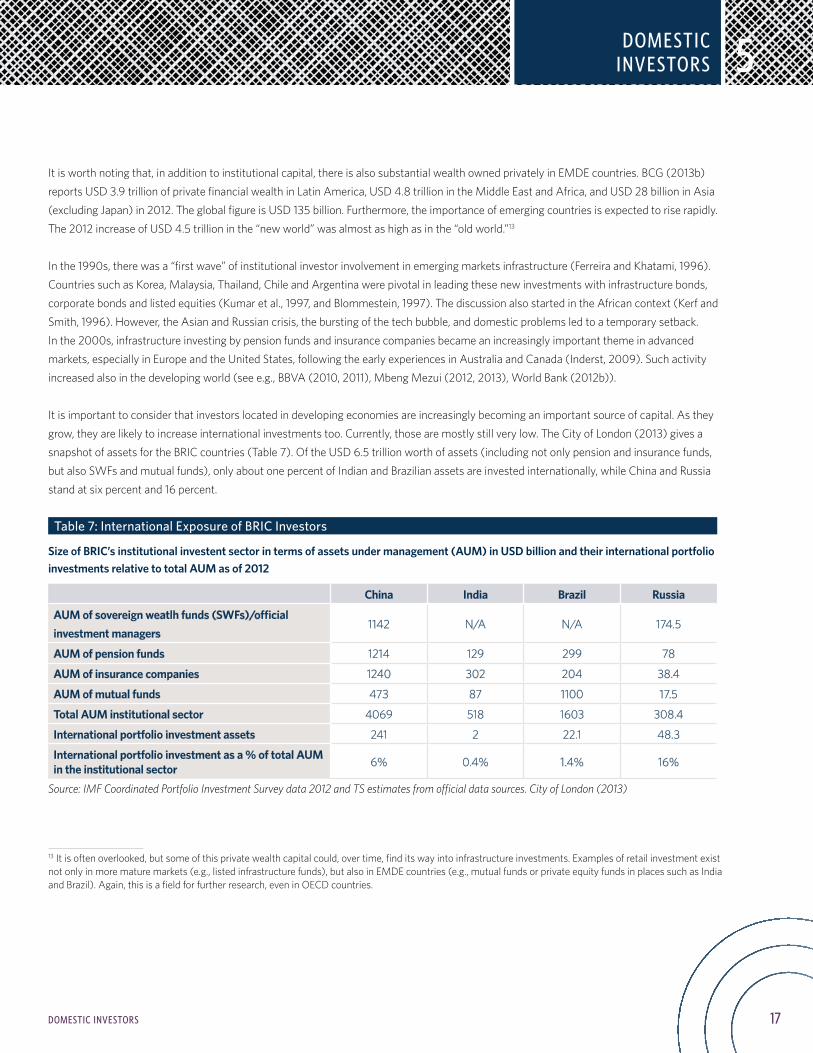
It is important to consider that investors located in developing economies are increasingly becoming an important source of capital. As they grow, they are likely to increase international investments too. Currently, those are mostly still very low. The City of London (2013) gives a snapshot of assets for the BRIC countries (Table 7). Of the USD 6.5 trillion worth of assets (including not only pension and insurance funds, but also SWFs and mutual funds), only about one percent of Indian and Brazilian assets are invested internationally, while China and Russia stand at six percent and 16 percent.
Table 7: International Exposure of BRIC Investors
Size of BRIC’s institutional investent sector in terms of assets under management (AUM) in USD billion and their international portfolio investments relative to total AUM as of 2012
China India Brazil Russia
AUM of sovereign weatlh funds (SWFs)/official investment managers
1142 N/A N/A 174.5
AUM of pension funds 1214 129 299 78
AUM of insurance companies 1240 302 204 38.4
AUM of mutual funds 473 87 1100 17.5
Total AUM institutional sector 4069 518 1603 308.4
International portfolio investment assets 241 2 22.1 48.3
International portfolio investment as a % of total AUM in the institutional sector 6% 0.4% 1.4% 16%
Source: IMF Coordinated Portfolio Investment Survey data 2012 and TS estimates from official data sources. City of London (2013)
13 It is often overlooked, but some of this private wealth capital could, over time, find its way into infrastructure investments. Examples of retail investment exist not only in more mature markets (e.g., listed infrastructure funds), but also in EMDE countries (e.g., mutual funds or private equity funds in places such as India and Brazil). Again, this is a field for further research, even in OECD countries.
DOMESTIC INVESTORS

18 DOMESTIC INVESTORS
5
5.1. PENSION FUNDS
Pension assets in developing countries are currently about USD 2.5 trillion, with the potential to reach USD 17 to 25 trillion by 2050 (World Bank estimates based on OECD data). Many developing countries are currently reforming and developing their pension systems to introduce funded pillars. If mandatory funded pension systems are established, assets under management can grow rapidly and become a large percentage of GDP. Given the underdeveloped state of the capital markets in many countries, these growing assets will be seeking suitable investments, potentially including infrastructure.
This can be advantageous, as opposed to leaving investors no option but to invest in government bonds, which offer limited returns to fund members and may serve as a cheap source of debt for governments. However, investment must be based on robust risk-return analysis, and good governance is key. Support for funded pension systems can also strengthen if individuals feel that their savings are being productively invested in the economy, and not mismanaged, captured and directed to uneconomic projects. The latter causes a lack of trust in these systems, which is so vital when dealing with long-term contracts and savings.
Pension systems in emerging markets are generally smaller than those in developed countries, not only in absolute terms, but also in relation to the size of the economy. Pension assets in OECD countries are 78 percent of GDP on a weighted average (see Figure 18 in Appendix 2). Among other countries, only South Africa, Namibia and Chile have a pension assets per GDP figure above or near that level. About a dozen developing countries—primarily in Latin America—figures between 10 percent and 30 percent, whereas pension assets are still very small relative to GDP in all other developing countries, if not nil (see Figure 19 in Appendix 2).
In absolute terms, the biggest pension assets are in China (USD 1,214 billion), Brazil (USD 308 billion), Mexico (USD 148 billion), Chile (USD 145 billion), Malaysia (USD 106 billion), India (USD 129 billion), South Africa (USD 84 billion), Egypt (USD 54 billion) and Russia (USD 78 billion) (OECD, 2013b, and Wright et al., 2011). On the other hand, new pension systems can take a long time to build substantial assets, as is the case in Eastern Europe and Central Asia, and even this requires favorable political conditions. Public Pension Reserve FundsPension assets in developing countries are often concentrated in one or more large public pension reserve funds (PPRFs) or a social security reserve fund (SSRF). WEF (2013b) gives some examples for Africa. In Uganda, the NSSF accounts for 95 percent of pensions assets; Namibia’s GIPF has 82 percent; and Zambia’s NAPSA and AfLife have about 80 percent. Similar dominant funds are also found in Botswana and Ghana. In Kenya and South Africa, their share is in the region of 30 to 40 percent. Both countries also have a number of corporate pension plans (Stewart and Yermo, 2009).
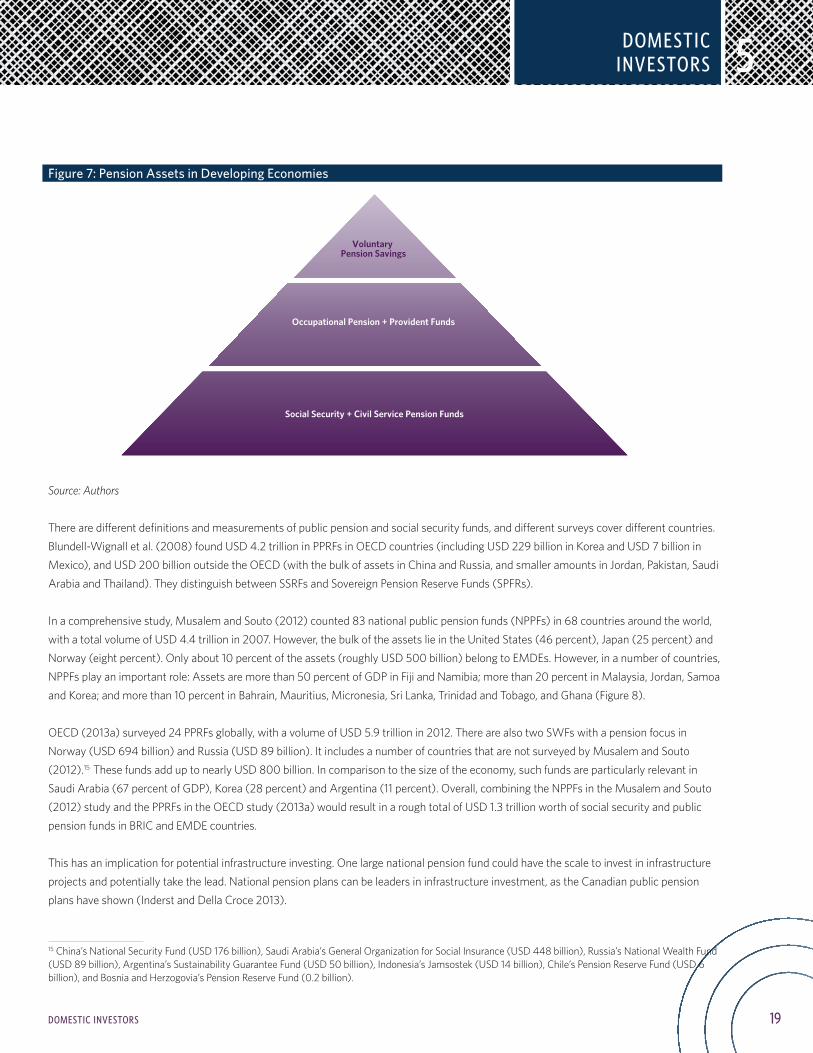
PPRFs are an important category of pension funds in developing countries. Private and voluntary pension savings often form only a tiny tip of the market. In some countries, there may also be a legacy of occupational pension or provident funds. The bulk of most pension systems in developing economies consist of PAYG (pay as you go) social security systems (Figure 7).14 Where social security assets exist at all (due to young populations, meaning that more money is being collected than being paid out), these are usually managed by central, government-controlled (or at best “arms length”), national social security agencies. Similar funds often exist to cover the pensions of civil servants or other public workers.
14 For a discussion of social security and public pension reserve funds, see e.g., Iglesias and Palacios (2000), Palacios (2002), Hess and Impavido (2004), and Musalem and Souto (2012).
DOMESTIC INVESTORS
19DOMESTIC INVESTORS
5
Figure 7: Pension Assets in Developing Economies
Source: Authors
There are different definitions and measurements of public pension and social security funds, and different surveys cover different countries. Blundell-Wignall et al. (2008) found USD 4.2 trillion in PPRFs in OECD countries (including USD 229 billion in Korea and USD 7 billion in Mexico), and USD 200 billion outside the OECD (with the bulk of assets in China and Russia, and smaller amounts in Jordan, Pakistan, Saudi Arabia and Thailand). They distinguish between SSRFs and Sovereign Pension Reserve Funds (SPFRs).
In a comprehensive study, Musalem and Souto (2012) counted 83 national public pension funds (NPPFs) in 68 countries around the world, with a total volume of USD 4.4 trillion in 2007. However, the bulk of the assets lie in the United States (46 percent), Japan (25 percent) and Norway (eight percent). Only about 10 percent of the assets (roughly USD 500 billion) belong to EMDEs. However, in a number of countries, NPPFs play an important role: Assets are more than 50 percent of GDP in Fiji and Namibia; more than 20 percent in Malaysia, Jordan, Samoa and Korea; and more than 10 percent in Bahrain, Mauritius, Micronesia, Sri Lanka, Trinidad and Tobago, and Ghana (Figure 8).
OECD (2013a) surveyed 24 PPRFs globally, with a volume of USD 5.9 trillion in 2012. There are also two SWFs with a pension focus in Norway (USD 694 billion) and Russia (USD 89 billion). It includes a number of countries that are not surveyed by Musalem and Souto (2012).15 These funds add up to nearly USD 800 billion. In comparison to the size of the economy, such funds are particularly relevant in Saudi Arabia (67 percent of GDP), Korea (28 percent) and Argentina (11 percent). Overall, combining the NPPFs in the Musalem and Souto (2012) study and the PPRFs in the OECD study (2013a) would result in a rough total of USD 1.3 trillion worth of social security and public pension funds in BRIC and EMDE countries.
This has an implication for potential infrastructure investing. One large national pension fund could have the scale to invest in infrastructure projects and potentially take the lead. National pension plans can be leaders in infrastructure investment, as the Canadian public pension plans have shown (Inderst and Della Croce 2013).
15 China’s National Security Fund (USD 176 billion), Saudi Arabia’s General Organization for Social Insurance (USD 448 billion), Russia’s National Wealth Fund (USD 89 billion), Argentina’s Sustainability Guarantee Fund (USD 50 billion), Indonesia’s Jamsostek (USD 14 billion), Chile’s Pension Reserve Fund (USD 6 billion), and Bosnia and Herzogovia’s Pension Reserve Fund (0.2 billion).
DOMESTIC INVESTORS
Voluntary Pension Savings
Occupational Pension + Provident Funds
Social Security + Civil Service Pension Funds
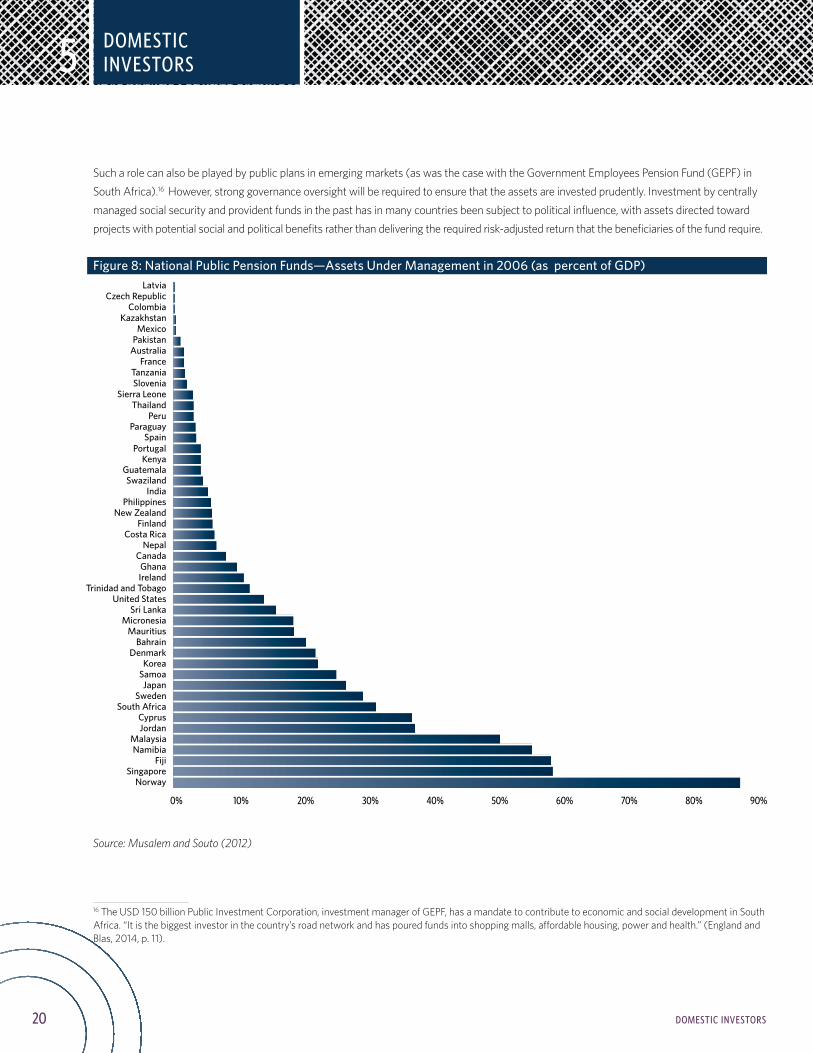
20 DOMESTIC INVESTORS
5
Such a role can also be played by public plans in emerging markets (as was the case with the Government Employees Pension Fund (GEPF) in South Africa).16 However, strong governance oversight will be required to ensure that the assets are invested prudently. Investment by centrally managed social security and provident funds in the past has in many countries been subject to political influence, with assets directed toward projects with potential social and political benefits rather than delivering the required risk-adjusted return that the beneficiaries of the fund require.
Figure 8: National Public Pension Funds—Assets Under Management in 2006 (as percent of GDP)
Source: Musalem and Souto (2012)
16 The USD 150 billion Public Investment Corporation, investment manager of GEPF, has a mandate to contribute to economic and social development in South Africa. “It is the biggest investor in the country’s road network and has poured funds into shopping malls, affordable housing, power and health.” (England and Blas, 2014, p. 11).
DOMESTIC INVESTORS
0% 10% 20% 30% 40% 50% 60% 70% 80% 90%
LatviaCzech Republic
ColombiaKazakhstan
MexicoPakistan
AustraliaFrance
TanzaniaSlovenia
Sierra LeoneThailand
PeruParaguay
SpainPortugal
KenyaGuatemalaSwaziland
IndiaPhilippines
New ZealandFinland
Costa RicaNepal
CanadaGhanaIreland
Trinidad and TobagoUnited States
Sri LankaMicronesia
MauritiusBahrain
DenmarkKorea
SamoaJapan
SwedenSouth Africa
CyprusJordan
MalaysiaNamibia
FijiSingapore
Norway
21DOMESTIC INVESTORS
5
Constraints on Infrastructure InvestmentsWhere private pension funds do exist in emerging markets, the investment restrictions they have to abide by are often still fairly strict, which may hamper infrastructure investment. Such constraints have been widely analyzed for Latin America (Vives, 1999, and Hanson, 2008). Irving and Manroth (2009) note that pension fund regulation in Africa often places too much emphasis on stability and uniform portfolio performance, without regard for return. Overly restrictive (and sometimes overlapping and contradictory) pension fund regulatory regimes are hindering pension funds from investing in infrastructure assets. A taste of the complexity of investment regulations for infrastructure in countries such as India and China is given by the City of London (2011).
IOPS (2011) surveyed 32 developed and developing countries and lists numerous examples of regulatory restrictions on alternative investments that affect both direct and indirect infrastructure investments. About half of the jurisdictions have qualitative restrictions on unlisted (e.g., South Africa) or non-transparent investments (e.g., Swaziland), whereas some countries require special approval by a supervisory authority. Examples of quantitative limits include:
• Restrictions on alternative investments (Pakistan and Ukraine);• Direct investments in projects (Chile, Colombia and Thailand);• Investment in infrastructure funds (Nigeria [OECD (2013c)]);• Quantitative limits on infrastructure products (Mexico and Costa Rica);• Limits on borrowers/corporations developing infrastructure;• Constraints on leverage and the use of derivatives; and• Limits on foreign exposures, etc.
Such legal constraints on infrastructure and other investments may often have good justifications, such as the lack of transparency, the containment of excessive risks, liquidity requirements, etc. However, regulators should review investment regulations in light of their effect on investment in infrastructure and other productive sectors of the economy, and the potential lack of diversification on the part of investors.17 A number of countries have introduced special “positive” rules and exemptions for infrastructure investments, e.g. India and Kenya for specific infrastructure bonds. Again, such exemptions need to be carefully considered, as there is the risk of “mislabelling” or mis-allocation of resources.
Infrastructure Investments by EMDE Pension FundsPension fund experience with domestic infrastructure investing is most widespread in Latin America, but there are also some early examples in Asia and Africa (Table 8). Governments across most developing countries have expressed an interest in developing infrastructure investments for local institutional investors as their assets under management grow. Infrastructure investments by EMDE investors do not necessarily remain in the country or region. In fact, many investors participate in the race for infrastructure assets in developed countries. In recent years, there have been increasing reports of activity and interest, especially by Asian and Middle Eastern SWFs or PPRFs, in European real estate, utilities (e.g., Thames Water), airports (e.g., Heathrow Airport) and transport infrastructure, electricity or gas distribution networks (e.g., Open Grid Europe). As assets grow, an expansion of “East-West” or “South-North” investing is likely, not least for diversification purposes.
17 Mutero (2010) discusses issues and limitations of the pension systems in Kenya, Tanzania, Uganda and Rwanda in regard to real estate investment, especially housing for the poor, as pension funds prefer commercial property. Illiquidity, missing instruments (e.g., REITs), investment regulation and poor governance are mentioned among the problems.
DOMESTIC INVESTORS
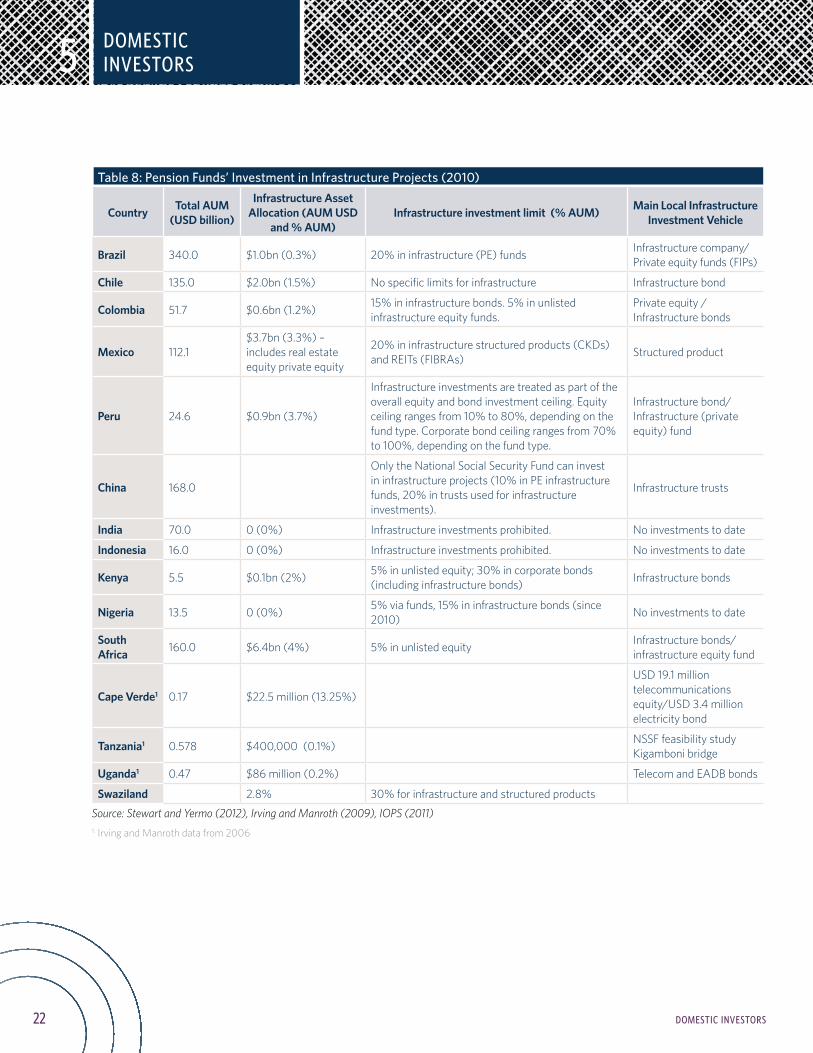
22 DOMESTIC INVESTORS
5
Table 8: Pension Funds’ Investment in Infrastructure Projects (2010)
Country Total AUM (USD billion)
Infrastructure Asset Allocation (AUM USD
and % AUM)Infrastructure investment limit (% AUM) Main Local Infrastructure
Investment Vehicle
Brazil 340.0 $1.0bn (0.3%) 20% in infrastructure (PE) funds Infrastructure company/ Private equity funds (FIPs)
Chile 135.0 $2.0bn (1.5%) No specific limits for infrastructure Infrastructure bond
Colombia 51.7 $0.6bn (1.2%) 15% in infrastructure bonds. 5% in unlisted infrastructure equity funds.
Private equity / Infrastructure bonds
Mexico 112.1$3.7bn (3.3%) –includes real estate equity private equity
20% in infrastructure structured products (CKDs) and REITs (FIBRAs) Structured product
Peru 24.6 $0.9bn (3.7%)
Infrastructure investments are treated as part of the overall equity and bond investment ceiling. Equity ceiling ranges from 10% to 80%, depending on the fund type. Corporate bond ceiling ranges from 70% to 100%, depending on the fund type.
Infrastructure bond/ Infrastructure (private equity) fund
China 168.0
Only the National Social Security Fund can invest in infrastructure projects (10% in PE infrastructure funds, 20% in trusts used for infrastructure investments).
Infrastructure trusts
India 70.0 0 (0%) Infrastructure investments prohibited. No investments to date
Indonesia 16.0 0 (0%) Infrastructure investments prohibited. No investments to date
Kenya 5.5 $0.1bn (2%) 5% in unlisted equity; 30% in corporate bonds (including infrastructure bonds) Infrastructure bonds
Nigeria 13.5 0 (0%) 5% via funds, 15% in infrastructure bonds (since 2010) No investments to date
South Africa 160.0 $6.4bn (4%) 5% in unlisted equity Infrastructure bonds/
infrastructure equity fund
Cape Verde1 0.17 $22.5 million (13.25%)
USD 19.1 million telecommunications equity/USD 3.4 million electricity bond
Tanzania1 0.578 $400,000 (0.1%) NSSF feasibility study Kigamboni bridge
Uganda1 0.47 $86 million (0.2%) Telecom and EADB bonds
Swaziland 2.8% 30% for infrastructure and structured products
Source: Stewart and Yermo (2012), Irving and Manroth (2009), IOPS (2011)1: Irving and Manroth data from 2006
DOMESTIC INVESTORS
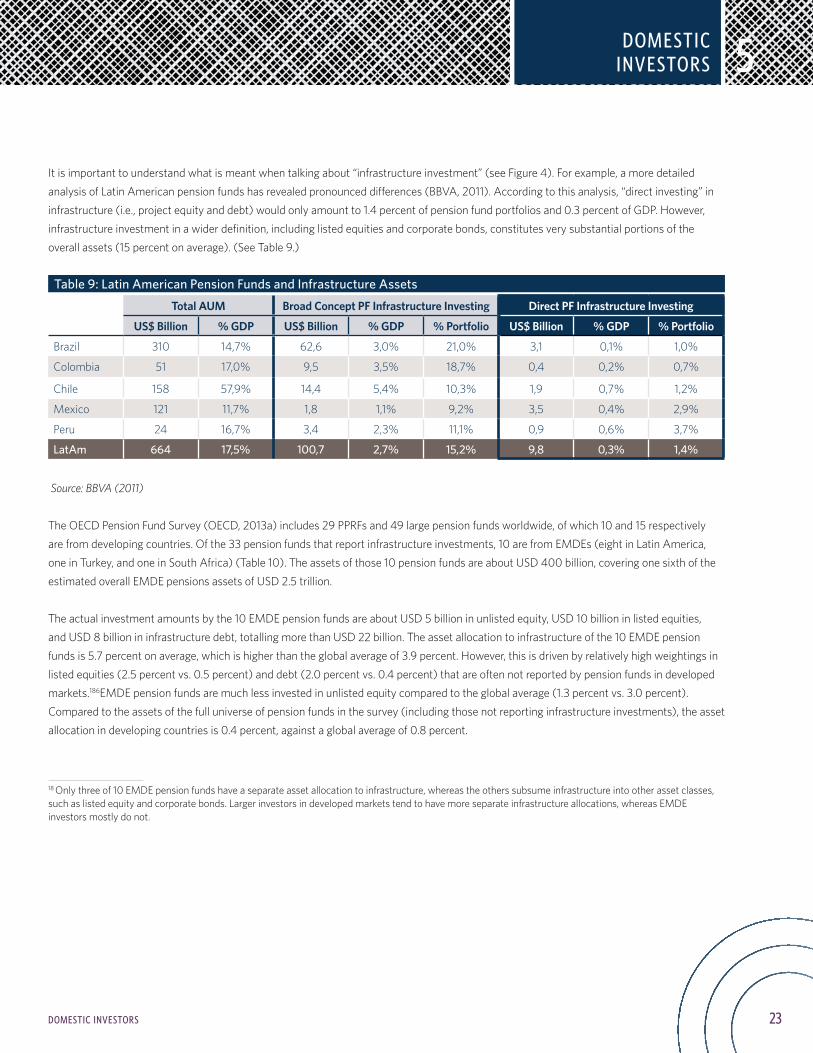
23DOMESTIC INVESTORS
5
It is important to understand what is meant when talking about “infrastructure investment” (see Figure 4). For example, a more detailed analysis of Latin American pension funds has revealed pronounced differences (BBVA, 2011). According to this analysis, “direct investing” in infrastructure (i.e., project equity and debt) would only amount to 1.4 percent of pension fund portfolios and 0.3 percent of GDP. However, infrastructure investment in a wider definition, including listed equities and corporate bonds, constitutes very substantial portions of the overall assets (15 percent on average). (See Table 9.)
Table 9: Latin American Pension Funds and Infrastructure Assets
Total AUM Broad Concept PF Infrastructure Investing Direct PF Infrastructure Investing
US$ Billion % GDP US$ Billion % GDP % Portfolio US$ Billion % GDP % Portfolio
Brazil 310 14,7% 62,6 3,0% 21,0% 3,1 0,1% 1,0%
Colombia 51 17,0% 9,5 3,5% 18,7% 0,4 0,2% 0,7%
Chile 158 57,9% 14,4 5,4% 10,3% 1,9 0,7% 1,2%
Mexico 121 11,7% 1,8 1,1% 9,2% 3,5 0,4% 2,9%
Peru 24 16,7% 3,4 2,3% 11,1% 0,9 0,6% 3,7%
LatAm 664 17,5% 100,7 2,7% 15,2% 9,8 0,3% 1,4%
w Source: BBVA (2011)
The OECD Pension Fund Survey (OECD, 2013a) includes 29 PPRFs and 49 large pension funds worldwide, of which 10 and 15 respectively are from developing countries. Of the 33 pension funds that report infrastructure investments, 10 are from EMDEs (eight in Latin America, one in Turkey, and one in South Africa) (Table 10). The assets of those 10 pension funds are about USD 400 billion, covering one sixth of the estimated overall EMDE pensions assets of USD 2.5 trillion.
The actual investment amounts by the 10 EMDE pension funds are about USD 5 billion in unlisted equity, USD 10 billion in listed equities, and USD 8 billion in infrastructure debt, totalling more than USD 22 billion. The asset allocation to infrastructure of the 10 EMDE pension funds is 5.7 percent on average, which is higher than the global average of 3.9 percent. However, this is driven by relatively high weightings in listed equities (2.5 percent vs. 0.5 percent) and debt (2.0 percent vs. 0.4 percent) that are often not reported by pension funds in developed markets.186EMDE pension funds are much less invested in unlisted equity compared to the global average (1.3 percent vs. 3.0 percent). Compared to the assets of the full universe of pension funds in the survey (including those not reporting infrastructure investments), the asset allocation in developing countries is 0.4 percent, against a global average of 0.8 percent.
18 Only three of 10 EMDE pension funds have a separate asset allocation to infrastructure, whereas the others subsume infrastructure into other asset classes, such as listed equity and corporate bonds. Larger investors in developed markets tend to have more separate infrastructure allocations, whereas EMDE investors mostly do not.
DOMESTIC INVESTORS
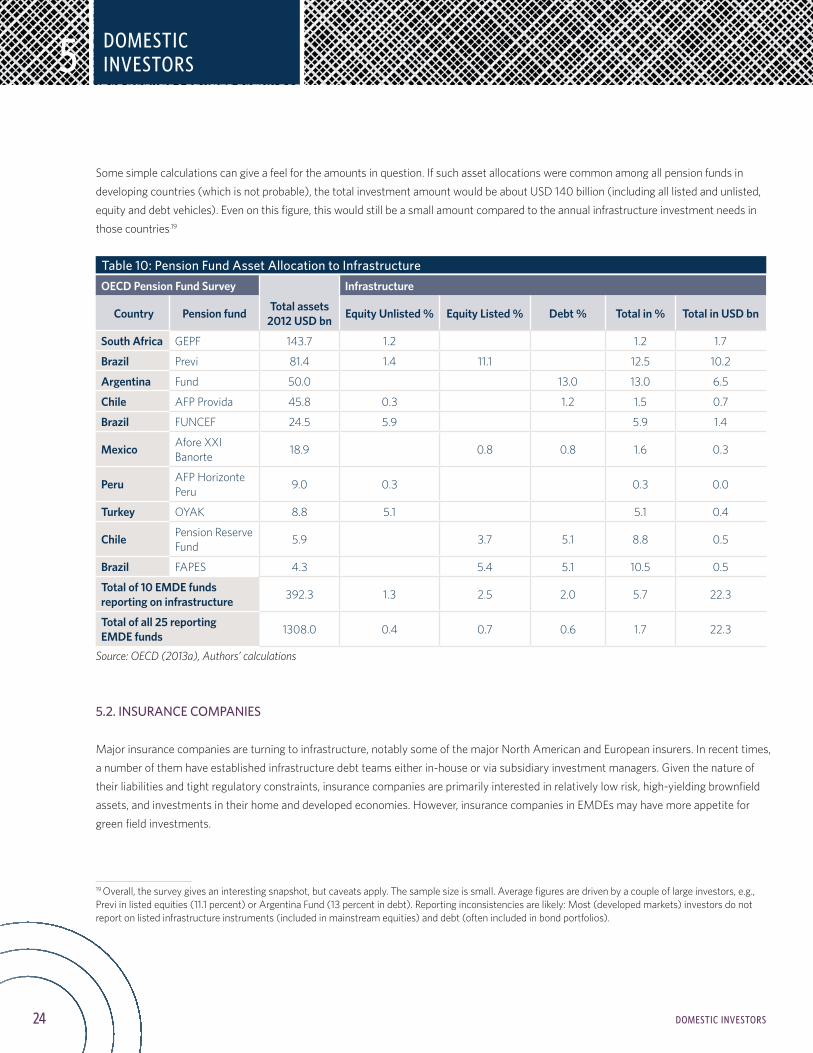
24 DOMESTIC INVESTORS
5
Some simple calculations can give a feel for the amounts in question. If such asset allocations were common among all pension funds in developing countries (which is not probable), the total investment amount would be about USD 140 billion (including all listed and unlisted, equity and debt vehicles). Even on this figure, this would still be a small amount compared to the annual infrastructure investment needs in those countries.19
Table 10: Pension Fund Asset Allocation to InfrastructureOECD Pension Fund Survey Infrastructure
Country Pension fund Total assets2012 USD bn Equity Unlisted % Equity Listed % Debt % Total in % Total in USD bn
South Africa GEPF 143.7 1.2 1.2 1.7
Brazil Previ 81.4 1.4 11.1 12.5 10.2
Argentina Fund 50.0 13.0 13.0 6.5
Chile AFP Provida 45.8 0.3 1.2 1.5 0.7
Brazil FUNCEF 24.5 5.9 5.9 1.4
Mexico Afore XXI Banorte 18.9 0.8 0.8 1.6 0.3
Peru AFP Horizonte Peru 9.0 0.3 0.3 0.0
Turkey OYAK 8.8 5.1 5.1 0.4
Chile Pension Reserve Fund 5.9 3.7 5.1 8.8 0.5
Brazil FAPES 4.3 5.4 5.1 10.5 0.5
Total of 10 EMDE funds reporting on infrastructure 392.3 1.3 2.5 2.0 5.7 22.3
Total of all 25 reporting EMDE funds 1308.0 0.4 0.7 0.6 1.7 22.3
Source: OECD (2013a), Authors’ calculations
5.2. INSURANCE COMPANIES
Major insurance companies are turning to infrastructure, notably some of the major North American and European insurers. In recent times, a number of them have established infrastructure debt teams either in-house or via subsidiary investment managers. Given the nature of their liabilities and tight regulatory constraints, insurance companies are primarily interested in relatively low risk, high-yielding brownfield assets, and investments in their home and developed economies. However, insurance companies in EMDEs may have more appetite for green field investments.
19 Overall, the survey gives an interesting snapshot, but caveats apply. The sample size is small. Average figures are driven by a couple of large investors, e.g., Previ in listed equities (11.1 percent) or Argentina Fund (13 percent in debt). Reporting inconsistencies are likely: Most (developed markets) investors do not report on listed infrastructure instruments (included in mainstream equities) and debt (often included in bond portfolios).
DOMESTIC INVESTORS
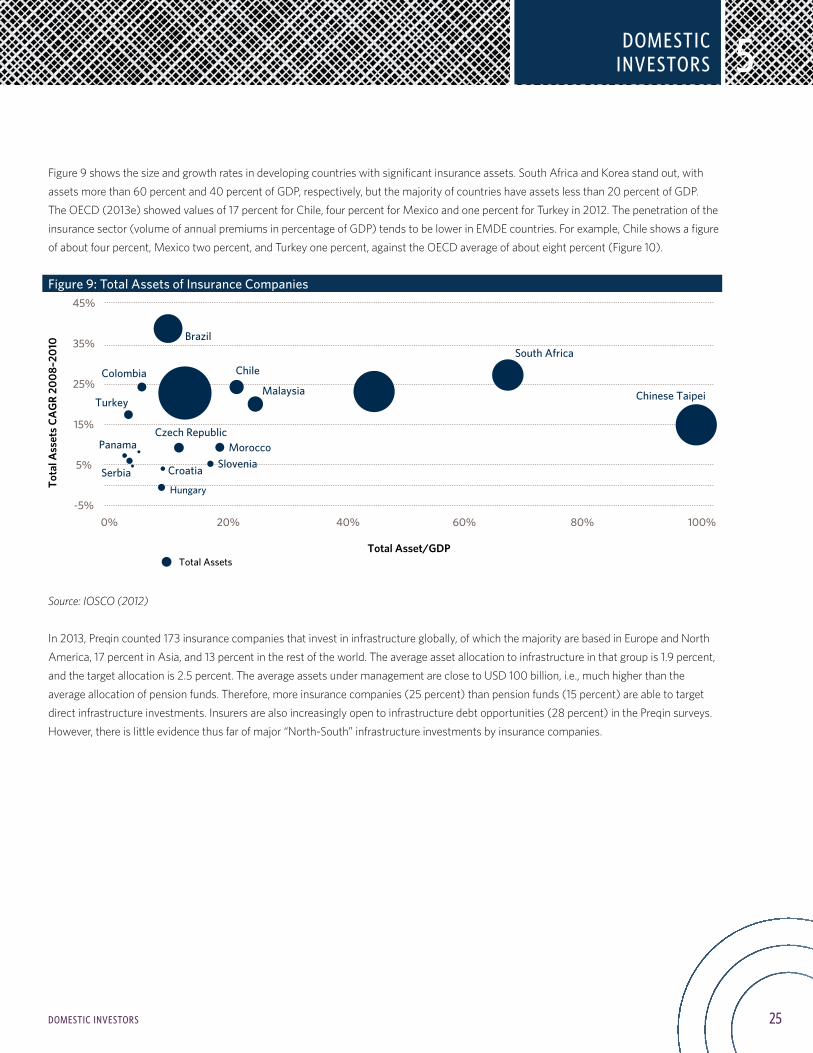
25DOMESTIC INVESTORS
5
Figure 9 shows the size and growth rates in developing countries with significant insurance assets. South Africa and Korea stand out, with assets more than 60 percent and 40 percent of GDP, respectively, but the majority of countries have assets less than 20 percent of GDP. The OECD (2013e) showed values of 17 percent for Chile, four percent for Mexico and one percent for Turkey in 2012. The penetration of the insurance sector (volume of annual premiums in percentage of GDP) tends to be lower in EMDE countries. For example, Chile shows a figure of about four percent, Mexico two percent, and Turkey one percent, against the OECD average of about eight percent (Figure 10).
Figure 9: Total Assets of Insurance Companies
Source: IOSCO (2012)
In 2013, Preqin counted 173 insurance companies that invest in infrastructure globally, of which the majority are based in Europe and North America, 17 percent in Asia, and 13 percent in the rest of the world. The average asset allocation to infrastructure in that group is 1.9 percent, and the target allocation is 2.5 percent. The average assets under management are close to USD 100 billion, i.e., much higher than the average allocation of pension funds. Therefore, more insurance companies (25 percent) than pension funds (15 percent) are able to target direct infrastructure investments. Insurers are also increasingly open to infrastructure debt opportunities (28 percent) in the Preqin surveys. However, there is little evidence thus far of major “North-South” infrastructure investments by insurance companies.
DOMESTIC INVESTORS
Total AssetsTotal Asset/GDP
Tota
l Ass
ets
CAG
R 20
08–2
010
0% 20% 40% 60% 80% 100%
45%
35%
25%
15%
5%
-5%Hungary
Croatia SloveniaMorocco
Czech Republic
South Africa
Chinese Taipei
Brazil
Chile
MalaysiaColombia
Turkey
Panama
Serbia
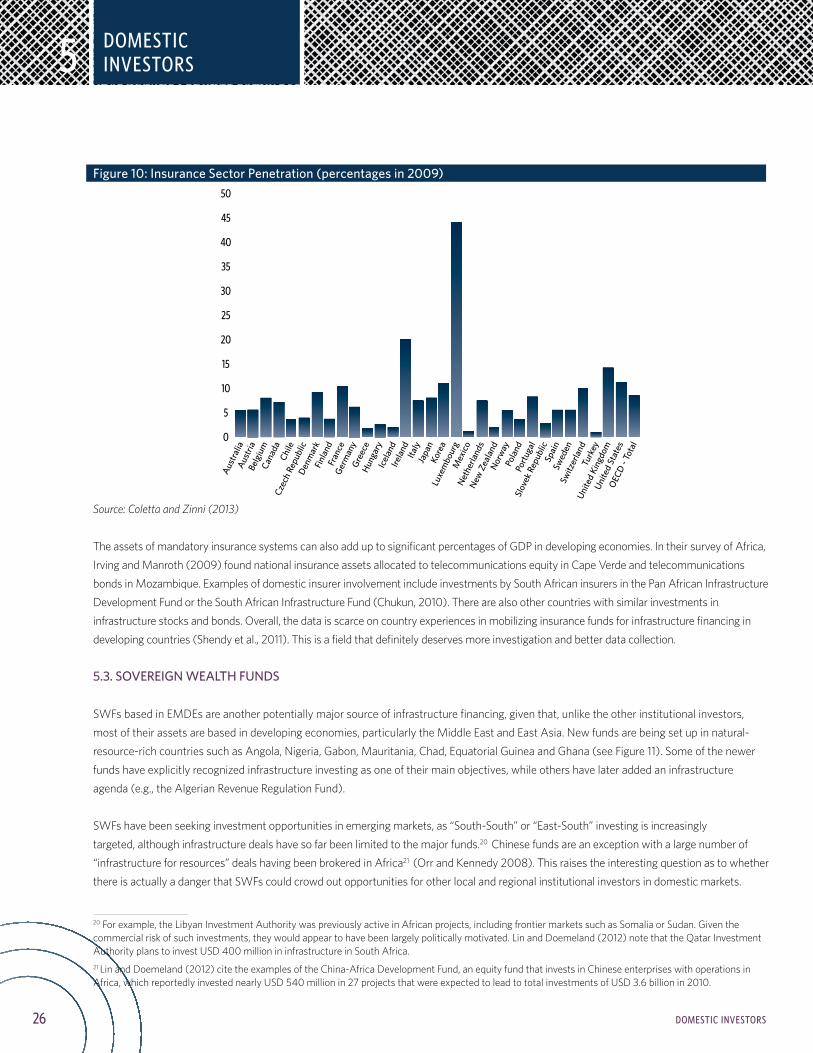
26 DOMESTIC INVESTORS
5
Figure 10: Insurance Sector Penetration (percentages in 2009)
Source: Coletta and Zinni (2013)
The assets of mandatory insurance systems can also add up to significant percentages of GDP in developing economies. In their survey of Africa, Irving and Manroth (2009) found national insurance assets allocated to telecommunications equity in Cape Verde and telecommunications bonds in Mozambique. Examples of domestic insurer involvement include investments by South African insurers in the Pan African Infrastructure Development Fund or the South African Infrastructure Fund (Chukun, 2010). There are also other countries with similar investments in infrastructure stocks and bonds. Overall, the data is scarce on country experiences in mobilizing insurance funds for infrastructure financing in developing countries (Shendy et al., 2011). This is a field that definitely deserves more investigation and better data collection.
5.3. SOVEREIGN WEALTH FUNDS SWFs based in EMDEs are another potentially major source of infrastructure financing, given that, unlike the other institutional investors, most of their assets are based in developing economies, particularly the Middle East and East Asia. New funds are being set up in natural-resource-rich countries such as Angola, Nigeria, Gabon, Mauritania, Chad, Equatorial Guinea and Ghana (see Figure 11). Some of the newer funds have explicitly recognized infrastructure investing as one of their main objectives, while others have later added an infrastructure agenda (e.g., the Algerian Revenue Regulation Fund).
SWFs have been seeking investment opportunities in emerging markets, as “South-South” or “East-South” investing is increasingly targeted, although infrastructure deals have so far been limited to the major funds.20 Chinese funds are an exception with a large number of “infrastructure for resources” deals having been brokered in Africa21 (Orr and Kennedy 2008). This raises the interesting question as to whether there is actually a danger that SWFs could crowd out opportunities for other local and regional institutional investors in domestic markets.
20 For example, the Libyan Investment Authority was previously active in African projects, including frontier markets such as Somalia or Sudan. Given the commercial risk of such investments, they would appear to have been largely politically motivated. Lin and Doemeland (2012) note that the Qatar Investment Authority plans to invest USD 400 million in infrastructure in South Africa. 21 Lin and Doemeland (2012) cite the examples of the China-Africa Development Fund, an equity fund that invests in Chinese enterprises with operations in Africa, which reportedly invested nearly USD 540 million in 27 projects that were expected to lead to total investments of USD 3.6 billion in 2010.
DOMESTIC INVESTORS
50
45
40
35
30
25
20
15
10
5
0
OEC
D - T
otal
Unite
d St
ates
Unite
d Ki
ngdo
m
Turk
ey
Switz
erla
nd
Swed
en
Spai
n
Slov
ek R
epub
lic
Portu
gal
Pola
nd
Norw
ay
New
Zea
land
Neth
erla
nds
Mex
ico
Luxe
mbo
urg
Kore
a
Japa
n
Italy
Irela
nd
Icel
and
Gree
ce
Germ
any
Fran
ce
Finla
nd
Denm
ark
Czec
h Re
publ
ic
Chile
Cana
da
Belg
ium
Aust
ria
Aust
ralia
Hung
ary
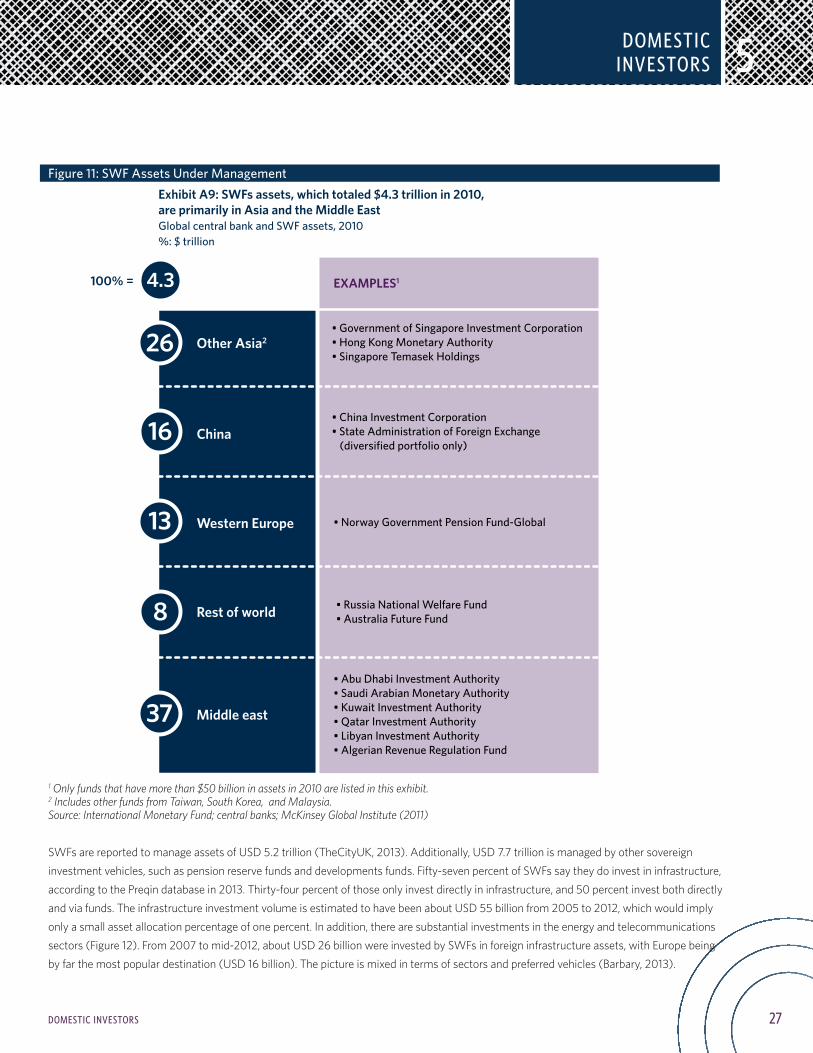
27DOMESTIC INVESTORS
5
Figure 11: SWF Assets Under Management
1 Only funds that have more than $50 billion in assets in 2010 are listed in this exhibit.2 Includes other funds from Taiwan, South Korea, and Malaysia.Source: International Monetary Fund; central banks; McKinsey Global Institute (2011)
SWFs are reported to manage assets of USD 5.2 trillion (TheCityUK, 2013). Additionally, USD 7.7 trillion is managed by other sovereign investment vehicles, such as pension reserve funds and developments funds. Fifty-seven percent of SWFs say they do invest in infrastructure, according to the Preqin database in 2013. Thirty-four percent of those only invest directly in infrastructure, and 50 percent invest both directly and via funds. The infrastructure investment volume is estimated to have been about USD 55 billion from 2005 to 2012, which would imply only a small asset allocation percentage of one percent. In addition, there are substantial investments in the energy and telecommunications sectors (Figure 12). From 2007 to mid-2012, about USD 26 billion were invested by SWFs in foreign infrastructure assets, with Europe being by far the most popular destination (USD 16 billion). The picture is mixed in terms of sectors and preferred vehicles (Barbary, 2013).
DOMESTIC INVESTORS
Tender
• Russia National Welfare Fund• Australia Future Fund
• Abu Dhabi Investment Authority• Saudi Arabian Monetary Authority• Kuwait Investment Authority• Qatar Investment Authority• Libyan Investment Authority• Algerian Revenue Regulation Fund
26
4.3
16
13
37
8
• Government of Singapore Investment Corporation• Hong Kong Monetary Authority• Singapore Temasek Holdings
• China Investment Corporation• State Administration of Foreign Exchange (diversified portfolio only)
• Norway Government Pension Fund-Global
Other Asia2
China
Western Europe
Rest of world
Middle east
EXAMPLES1
Exhibit A9: SWFs assets, which totaled $4.3 trillion in 2010, are primarily in Asia and the Middle EastGlobal central bank and SWF assets, 2010%: $ trillion
100% =
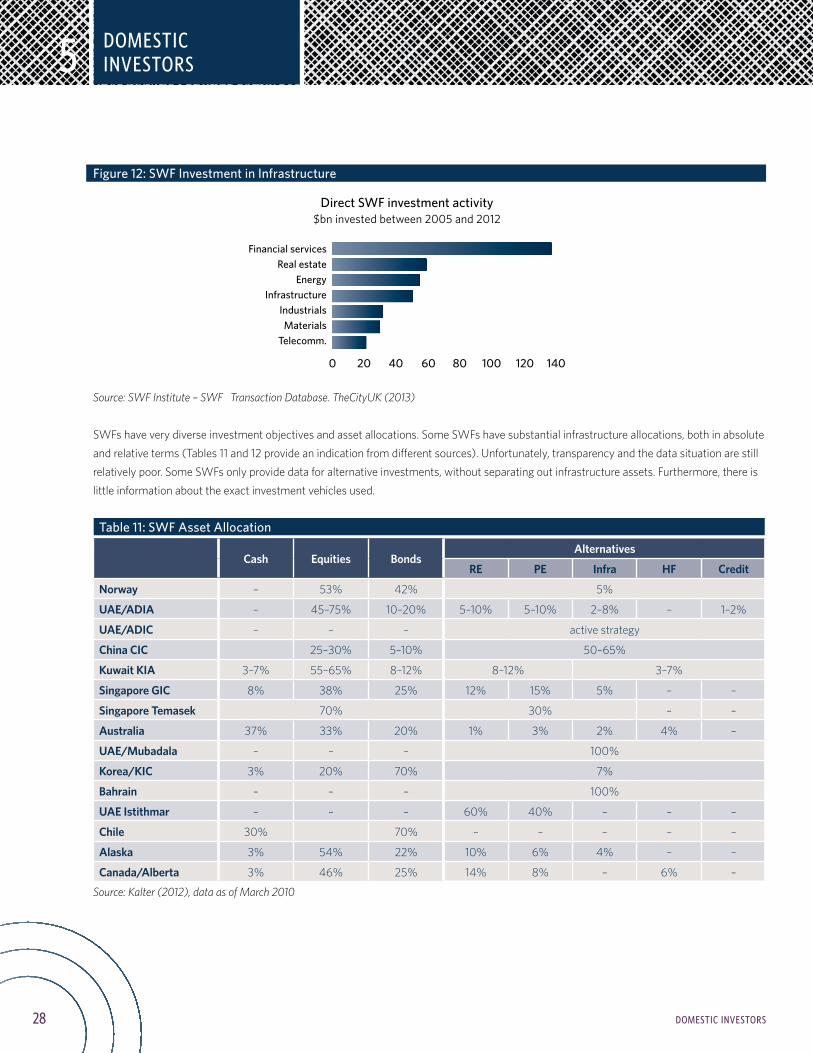
28 DOMESTIC INVESTORS
5
Figure 12: SWF Investment in Infrastructure
Source: SWF Institute – SWF Transaction Database. TheCityUK (2013)
SWFs have very diverse investment objectives and asset allocations. Some SWFs have substantial infrastructure allocations, both in absolute and relative terms (Tables 11 and 12 provide an indication from different sources). Unfortunately, transparency and the data situation are still relatively poor. Some SWFs only provide data for alternative investments, without separating out infrastructure assets. Furthermore, there is little information about the exact investment vehicles used.
Table 11: SWF Asset Allocation
Cash Equities BondsAlternatives
RE PE Infra HF Credit
Norway – 53% 42% 5%
UAE/ADIA – 45–75% 10–20% 5–10% 5–10% 2–8% – 1–2%
UAE/ADIC – – – active strategy
China CIC 25–30% 5–10% 50–65%
Kuwait KIA 3–7% 55–65% 8–12% 8–12% 3–7%
Singapore GIC 8% 38% 25% 12% 15% 5% – –
Singapore Temasek 70% 30% – –
Australia 37% 33% 20% 1% 3% 2% 4% –
UAE/Mubadala – – – 100%
Korea/KIC 3% 20% 70% 7%
Bahrain – – – 100%
UAE Istithmar – – – 60% 40% – – –
Chile 30% 70% – – – – –
Alaska 3% 54% 22% 10% 6% 4% – –
Canada/Alberta 3% 46% 25% 14% 8% – 6% –
Source: Kalter (2012), data as of March 2010
DOMESTIC INVESTORS
0 20 40 60 80 100 120 140
Financial servicesReal estate
EnergyInfrastructure
IndustrialsMaterials
Telecomm.
$bn invested between 2005 and 2012Direct SWF investment activity
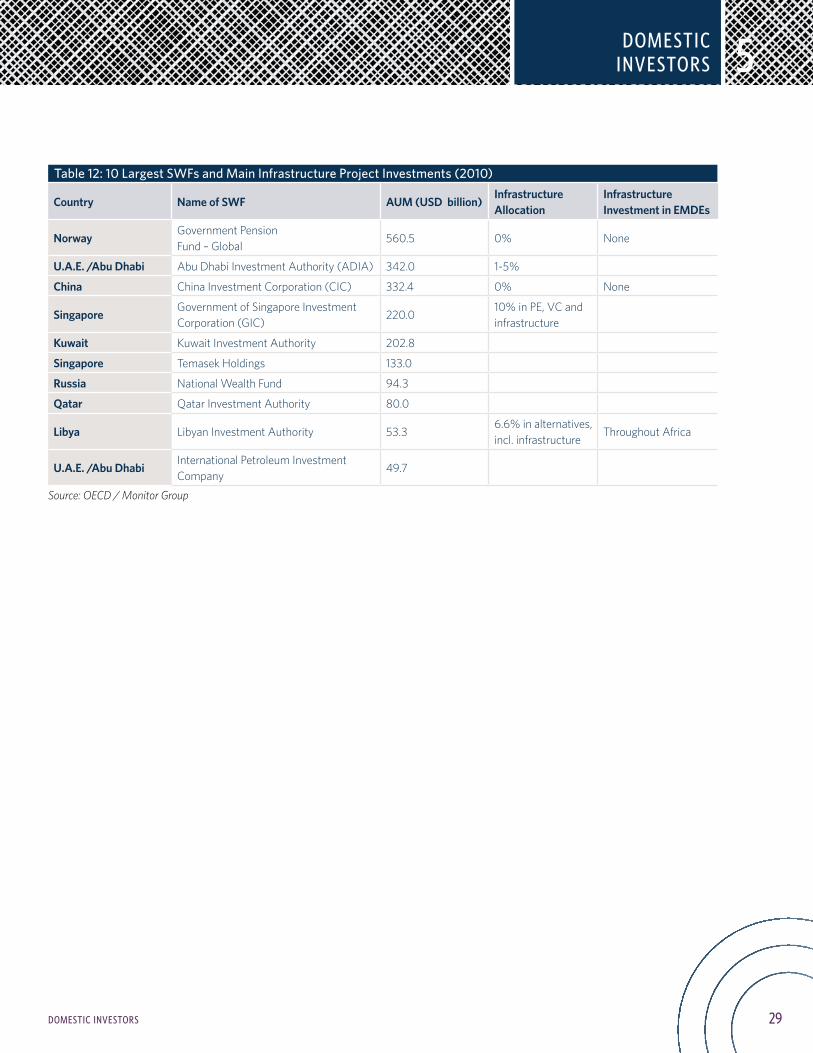
29DOMESTIC INVESTORS
5
Table 12: 10 Largest SWFs and Main Infrastructure Project Investments (2010)
Country Name of SWF AUM (USD billion)Infrastructure Allocation
Infrastructure Investment in EMDEs
NorwayGovernment Pension Fund – Global
560.5 0% None
U .A .E . /Abu Dhabi Abu Dhabi Investment Authority (ADIA) 342.0 1-5%
China China Investment Corporation (CIC) 332.4 0% None
SingaporeGovernment of Singapore Investment Corporation (GIC)
220.010% in PE, VC and infrastructure
Kuwait Kuwait Investment Authority 202.8
Singapore Temasek Holdings 133.0
Russia National Wealth Fund 94.3
Qatar Qatar Investment Authority 80.0
Libya Libyan Investment Authority 53.36.6% in alternatives, incl. infrastructure
Throughout Africa
U .A .E . /Abu DhabiInternational Petroleum Investment Company
49.7
Source: OECD / Monitor Group
DOMESTIC INVESTORS
30 THE POTENTIAL FOR INSTITUTIONAL INVESTMENT IN EMDE INFRASTRUCTURE
6THE POTENTIAL FOR INSTITUTIONAL INVESTMENT
The Potential for Institutional Investment in EMDE Infrastructure
How much of the EMDE infrastructure finance could institutional investors be expected to provide? Given poor data, estimates of the institutional investor potential in EMDEs are particularly speculative. Important factors are the potential asset allocation shifts by investors toward infrastructure, the allocation to EMDEs in general, and to EMDE infrastructure in particular.
Behavior is likely to be different across different categories of investors and regions. Infrastructure assets are typically of low liquidity, whereas investors have varying degrees of liquidity requirements, and different regulations to follow, as discussed earlier. It is clear that not all institutional capital would potentially be available for infrastructure for a number of reasons (see Box 3):
• Prudential investment;• Liquidity;• Diversification;• Liability profile;• Benefit system;• Law and regulation;• Investor scale and capacity; and• Other factors.
Box 3: Potential Investment in Long-Term and Green Investments
A number of studies have undertaken estimates of the investment potential of institutional investors in the areas of long-term investment, green investments or infrastructure investments.
WEF (2011) estimates that life insurers invest only four percent of assets in illiquid investments, defined benefit pension funds nine percent, SWFs 10 percent, and endowments and foundations 20 percent. They further find that only about USD 6.5 trillion out of USD 27 trillion (i.e., about a quarter of institutional assets) are available for longer-term investing, due to the discussed structural factors and governance/capacity issues with investors.
CPI (2013) calculates that just more than one percent of USD 85 trillion institutional assets are available for investment in renewable energy, of which about USD 700 billion would be in the form of corporate investment vehicles and USD 250 billion would be directly in projects. The main limiting factors are double counting of assets (e.g., investing via fund managers), diversification and liquidity needs, investor scale, and other issues with individual defined contribution accounts.
TUAC (2012) undertakes an interesting exercise in estimating the potential flows from institutional investors to finance climate-change-related investments; the method could also be applied to emerging market infrastructure. The AUM of large OECD DB pension funds and pension reserve funds is estimated at USD 15 trillion. Total portfolio growth is estimated at 2.5 percent year nominal from 2013 to 2050. A portfolio re-allocation to infrastructure funds is assumed at 0.2 percent per year from 2013 to 2025 and at 0.1 percent
(continued on page 31)
31THE POTENTIAL FOR INSTITUTIONAL INVESTMENT IN EMDE INFRASTRUCTURE
6THE POTENTIAL
FOR INSTITUTIONAL INVESTMENT
Table 13 provides an overview of the current institutional investor assets AUM in EMDEs, as well as very rough estimates of their potential size. Clearly, this can only give an idea of the order of magnitudes in question. There are a number of explicit and implicit assumptions in such an exercise.22 For example, current infrastructure investment by institutional investors is assumed to be about one percent on average (OECD, 2013a, and Inderst, 2013). For simplicity, a flat 10 percent of institutional assets are estimated to be in emerging markets. EMDE institutional investors are expected to diversify more globally over time.
These projections result in a rough estimate of the “potential” of USD 350 to 700 billion in the medium term. Assuming such changes occur over a period of 10 years, the annual flows into infrastructure could be USD 30 to 60 billion. The figure of USD 1 trillion over a prolonged period would not look unreasonable, when projecting substantial growth of institutional assets, especially in emerging markets. Though not sufficient to solve the problem alone, this could certainly prove an important source of new capital to help fill the EMDE infrastructure financing gap, with a contribution of up to 10 percent of investment needs.
22 For simplicity, there is no real growth assumption for assets built in here, although longer term that would also be an important factor, especially in emerging markets. Such analyses are typically on a “constant price” basis, reflecting today’s levels of asset prices.
from 2025 to 2050, resulting in a total exposure of 4.3 percent by 2050. Re-allocation to infrastructure bonds is estimated at 0.75 percent initially, falling gradually to 0.1 percent per year, to give a total exposure of 11 percent. This gives flows on the order of USD 150 billion, tapering off in subsequent years. Total flows amount to about USD 2 trillion by 2030 and USD 3.5 trillion by 2050.
Inderst (2013) undertakes a simple calculation for global infrastructure. With institutional assets of USD 70 trillion, currently about 1 percent of the portfolio allocation, or USD 700 billion, is estimated to be in infrastructure investments. An increase to three percent (or five percent) would imply an allocation of about USD 2.1 trillion (or 3.5 trillion). Spread out over 10 years, this could generate additional infrastructure investments of USD 140 billion (or 280 billion) annually on a global scale. Such overall asset allocation shifts would be quite considerable in the “alternative asset” space. However, these flows could still add “only” 0.2 to 0.4 percent of GDP per annum, and up to 10 percent of the projected infrastructure investment requirements.
Box 3: Potential Investment in Long-Term and Green Investments (continued from page 30)
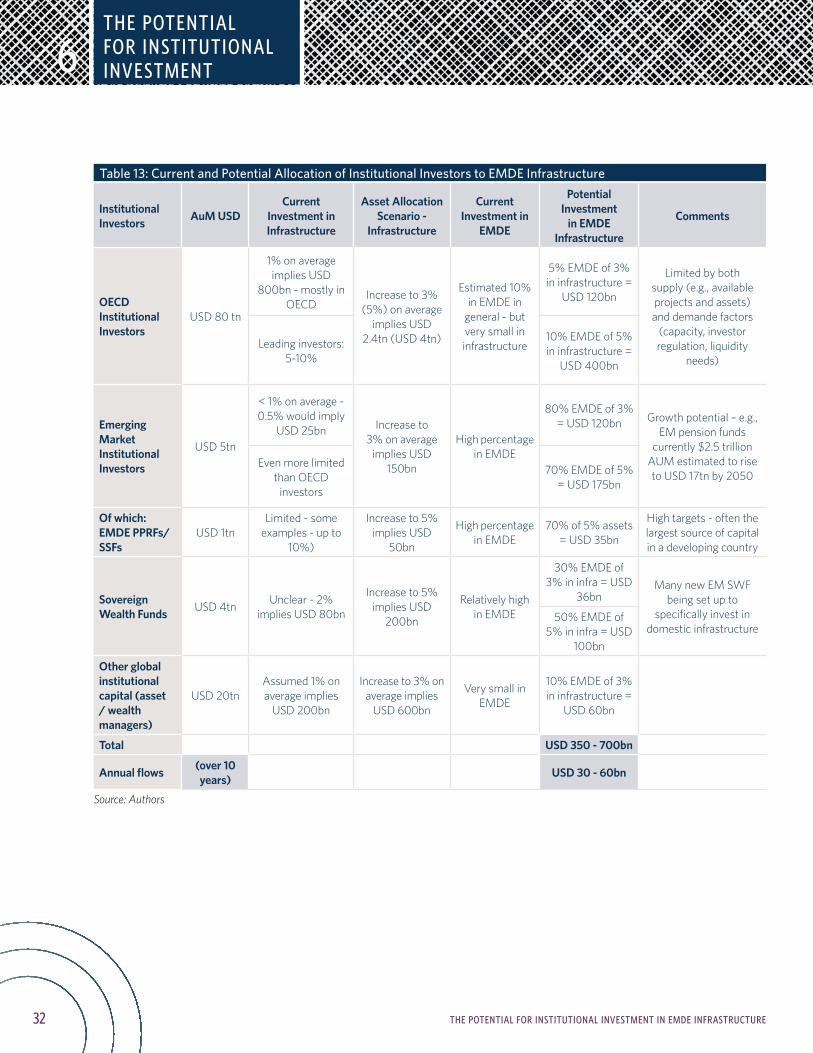
32 THE POTENTIAL FOR INSTITUTIONAL INVESTMENT IN EMDE INFRASTRUCTURE
6THE POTENTIAL FOR INSTITUTIONAL INVESTMENT
Table 13: Current and Potential Allocation of Institutional Investors to EMDE Infrastructure
Institutional Investors AuM USD
Current Investment in Infrastructure
Asset Allocation Scenario -
Infrastructure
Current Investment in
EMDE
Potential Investment
in EMDE Infrastructure
Comments
OECD Institutional Investors
USD 80 tn
1% on average implies USD
800bn - mostly in OECD
Increase to 3% (5%) on average
implies USD 2.4tn (USD 4tn)
Estimated 10% in EMDE in
general - but very small in infrastructure
5% EMDE of 3% in infrastructure =
USD 120bn
Limited by both supply (e.g., available projects and assets) and demande factors
(capacity, investor regulation, liquidity
needs)Leading investors:
5-10%
10% EMDE of 5% in infrastructure =
USD 400bn
Emerging Market Institutional Investors
USD 5tn
< 1% on average - 0.5% would imply
USD 25bn Increase to 3% on average
implies USD 150bn
High percentage in EMDE
80% EMDE of 3% = USD 120bn Growth potential – e.g.,
EM pension funds currently $2.5 trillion
AUM estimated to rise to USD 17tn by 2050
Even more limited than OECD
investors
70% EMDE of 5% = USD 175bn
Of which: EMDE PPRFs/SSFs
USD 1tnLimited - some
examples - up to 10%)
Increase to 5% implies USD
50bn
High percentage in EMDE
70% of 5% assets = USD 35bn
High targets - often the largest source of capital in a developing country
Sovereign Wealth Funds USD 4tn Unclear - 2%
implies USD 80bn
Increase to 5% implies USD
200bn
Relatively high in EMDE
30% EMDE of 3% in infra = USD
36bnMany new EM SWF
being set up to specifically invest in
domestic infrastructure50% EMDE of
5% in infra = USD 100bn
Other global institutional capital (asset / wealth managers)
USD 20tnAssumed 1% on average implies
USD 200bn
Increase to 3% on average implies
USD 600bn
Very small in EMDE
10% EMDE of 3% in infrastructure =
USD 60bn
Total USD 350 - 700bn
Annual flows (over 10 years) USD 30 - 60bn
Source: Authors

33EXAMPLES OF INSTITUTIONAL INFRASTRUCTURE INVESTMENTS IN EMDEs
7EXAMPLES OF
INST. INFRASTRUCTURE INVESTMENTS
Examples of Institutional Infrastructure Investments in EMDEs
Infrastructure investments exist in various forms (e.g., equity or debt) and different investment vehicles (e.g., publicly listed and private/unlisted). Infrastructure investment instruments can be packaged in different ways in order to facilitate institutional investors’ involvement. In practice, institutional investors can approach the infrastructure investment universe in two main forms: directly or indirectly. It is useful to structure the main investment routes available (Figure 13).
Figure 13: Infrastructure Investment Approaches
Source: Authors
In terms of direct approaches, institutional investors can act as single investors, (e.g., by a private holding of an infrastructure company), or combine efforts with other institutional investors (to achieve larger scale, for example) or invest alongside professional firms or commercial banks (for reasons that may include the opportunity to use their expertise). On the fixed income side, instruments (e.g., project bonds through private placement) can be issued by a consortium running the project, or an institution can make a direct loan to an infrastructure project.
In terms of the indirect route, there are a range of different institutional arrangements, e.g., a commercial fund or a fund provided by government institutions. They may form a trust type structure with their counterparties, or they could jointly set up an infrastructure fund through which they collectively gain exposure to several projects, thereby diversifying their risk. Likewise, a government or development bank may be a lead investor, working in partnership with other institutions, or setting up a fund that they run for the institutional investors to invest in.
Investorapproches
Indirect investment
Jointly owned fund
Truststructure
Government sponsored fund
Developmentinstitutionsponsored
Commercialfunds
Investmenttrusts
PPP funds Regional Private equityfunds
Multilateral Mutual funds
Direct investment
Single investor Co-investment
Equitystake
Otherinstitutional
investors
Debtholding
Commercial firms
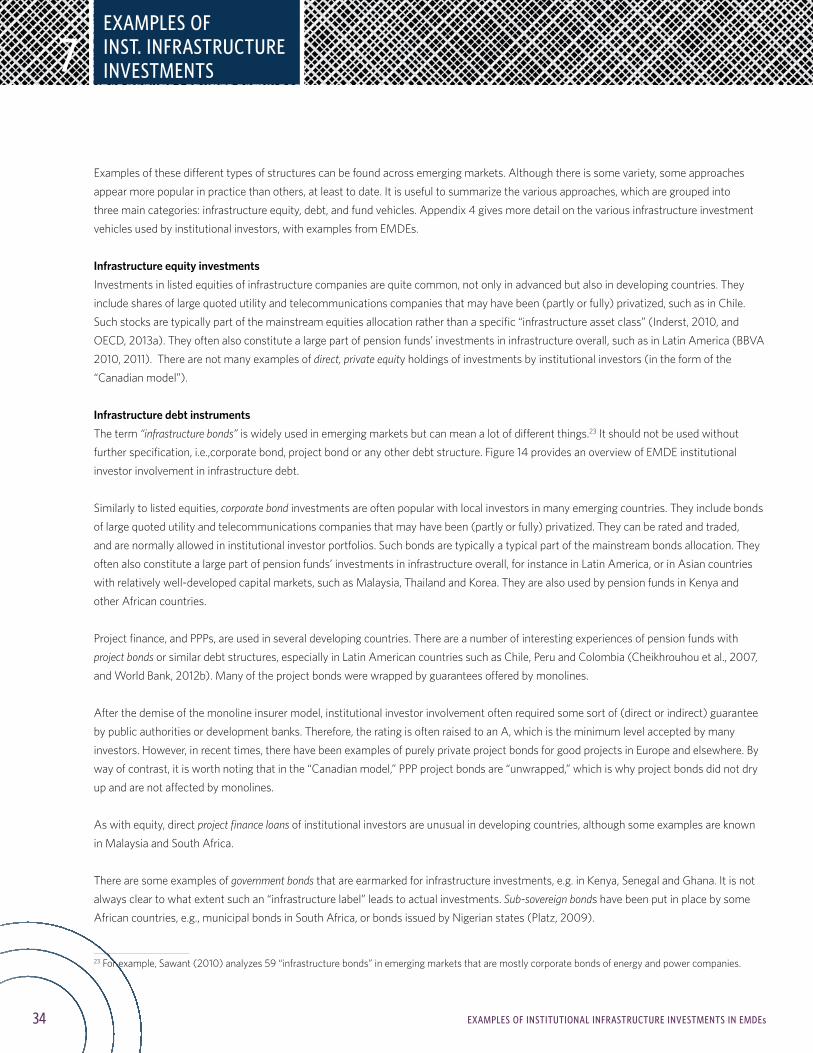
34 EXAMPLES OF INSTITUTIONAL INFRASTRUCTURE INVESTMENTS IN EMDEs
7EXAMPLES OF INST. INFRASTRUCTURE INVESTMENTS
Examples of these different types of structures can be found across emerging markets. Although there is some variety, some approaches appear more popular in practice than others, at least to date. It is useful to summarize the various approaches, which are grouped into three main categories: infrastructure equity, debt, and fund vehicles. Appendix 4 gives more detail on the various infrastructure investment vehicles used by institutional investors, with examples from EMDEs.
Infrastructure equity investmentsInvestments in listed equities of infrastructure companies are quite common, not only in advanced but also in developing countries. They include shares of large quoted utility and telecommunications companies that may have been (partly or fully) privatized, such as in Chile. Such stocks are typically part of the mainstream equities allocation rather than a specific “infrastructure asset class” (Inderst, 2010, and OECD, 2013a). They often also constitute a large part of pension funds’ investments in infrastructure overall, such as in Latin America (BBVA 2010, 2011). There are not many examples of direct, private equity holdings of investments by institutional investors (in the form of the “Canadian model”).
Infrastructure debt instrumentsThe term “infrastructure bonds” is widely used in emerging markets but can mean a lot of different things.23 It should not be used without further specification, i.e.,corporate bond, project bond or any other debt structure. Figure 14 provides an overview of EMDE institutional investor involvement in infrastructure debt.
Similarly to listed equities, corporate bond investments are often popular with local investors in many emerging countries. They include bonds of large quoted utility and telecommunications companies that may have been (partly or fully) privatized. They can be rated and traded, and are normally allowed in institutional investor portfolios. Such bonds are typically a typical part of the mainstream bonds allocation. They often also constitute a large part of pension funds’ investments in infrastructure overall, for instance in Latin America, or in Asian countries with relatively well-developed capital markets, such as Malaysia, Thailand and Korea. They are also used by pension funds in Kenya and other African countries.
Project finance, and PPPs, are used in several developing countries. There are a number of interesting experiences of pension funds with project bonds or similar debt structures, especially in Latin American countries such as Chile, Peru and Colombia (Cheikhrouhou et al., 2007, and World Bank, 2012b). Many of the project bonds were wrapped by guarantees offered by monolines. After the demise of the monoline insurer model, institutional investor involvement often required some sort of (direct or indirect) guarantee by public authorities or development banks. Therefore, the rating is often raised to an A, which is the minimum level accepted by many investors. However, in recent times, there have been examples of purely private project bonds for good projects in Europe and elsewhere. By way of contrast, it is worth noting that in the “Canadian model,” PPP project bonds are “unwrapped,” which is why project bonds did not dry up and are not affected by monolines.
As with equity, direct project finance loans of institutional investors are unusual in developing countries, although some examples are known in Malaysia and South Africa.
There are some examples of government bonds that are earmarked for infrastructure investments, e.g. in Kenya, Senegal and Ghana. It is not always clear to what extent such an “infrastructure label” leads to actual investments. Sub-sovereign bonds have been put in place by some African countries, e.g., municipal bonds in South Africa, or bonds issued by Nigerian states (Platz, 2009).
23 For example, Sawant (2010) analyzes 59 “infrastructure bonds” in emerging markets that are mostly corporate bonds of energy and power companies.
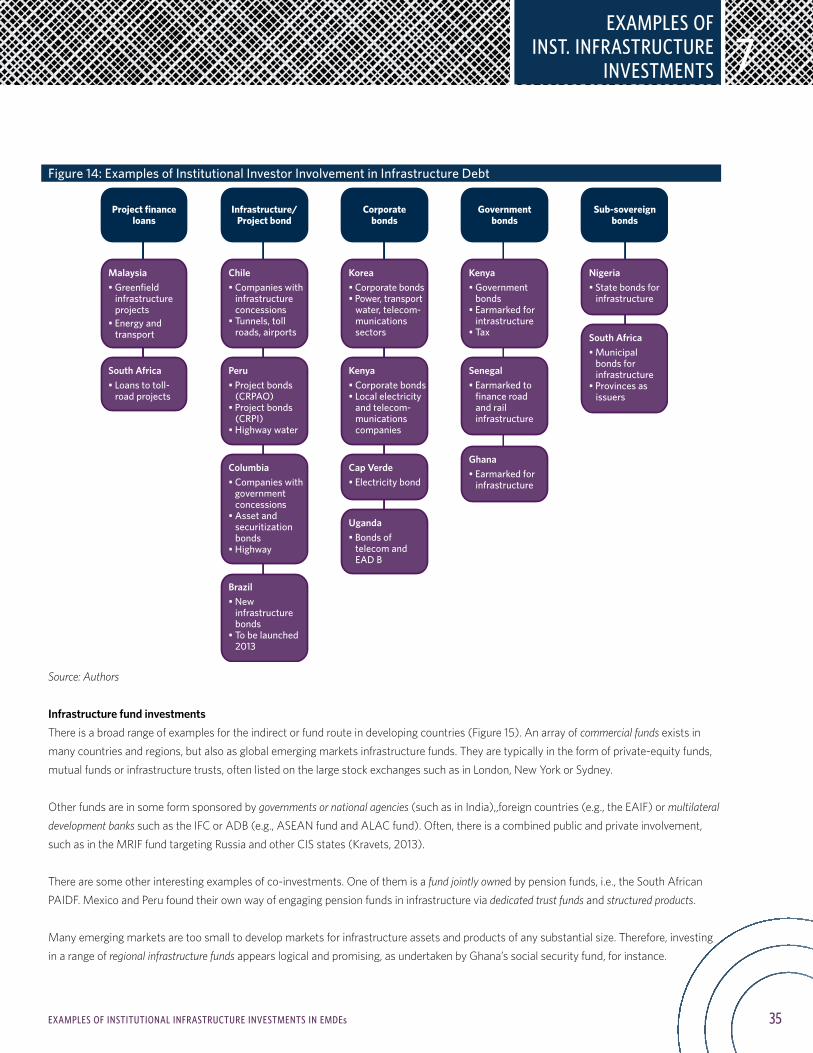
35EXAMPLES OF INSTITUTIONAL INFRASTRUCTURE INVESTMENTS IN EMDEs
7EXAMPLES OF
INST. INFRASTRUCTURE INVESTMENTS
Project financeloans
Infrastructure/Project bond
Corporatebonds
Governmentbonds
Sub-sovereignbonds
Malaysia
• Greenfield infrastructure projects• Energy and transport
Chile
• Companies with infrastructure concessions• Tunnels, toll roads, airports
Korea
• Corporate bonds• Power, transport water, telecom- munications sectors
Kenya
• Government bonds• Earmarked for intrastructure• Tax
Nigeria
• State bonds for infrastructure
South Africa
• Loans to toll- road projects
Peru
• Project bonds (CRPAO)• Project bonds (CRPI)• Highway water
Kenya
• Corporate bonds• Local electricity and telecom- munications companies
Senegal
• Earmarked to finance road and rail infrastructure
Columbia
• Companies with government concessions• Asset and securitization bonds• Highway
Cap Verde
• Electricity bond
Brazil
• New infrastructure bonds• To be launched 2013
Uganda
• Bonds of telecom and EAD B
Ghana
• Earmarked for infrastructure
South Africa
• Municipal bonds for infrastructure• Provinces as issuers
Figure 14: Examples of Institutional Investor Involvement in Infrastructure Debt
Source: Authors
Infrastructure fund investmentsThere is a broad range of examples for the indirect or fund route in developing countries (Figure 15). An array of commercial funds exists in many countries and regions, but also as global emerging markets infrastructure funds. They are typically in the form of private-equity funds, mutual funds or infrastructure trusts, often listed on the large stock exchanges such as in London, New York or Sydney.
Other funds are in some form sponsored by governments or national agencies (such as in India),,foreign countries (e.g., the EAIF) or multilateral development banks such as the IFC or ADB (e.g., ASEAN fund and ALAC fund). Often, there is a combined public and private involvement, such as in the MRIF fund targeting Russia and other CIS states (Kravets, 2013).
There are some other interesting examples of co-investments. One of them is a fund jointly owned by pension funds, i.e., the South African PAIDF. Mexico and Peru found their own way of engaging pension funds in infrastructure via dedicated trust funds and structured products.
Many emerging markets are too small to develop markets for infrastructure assets and products of any substantial size. Therefore, investing in a range of regional infrastructure funds appears logical and promising, as undertaken by Ghana’s social security fund, for instance.
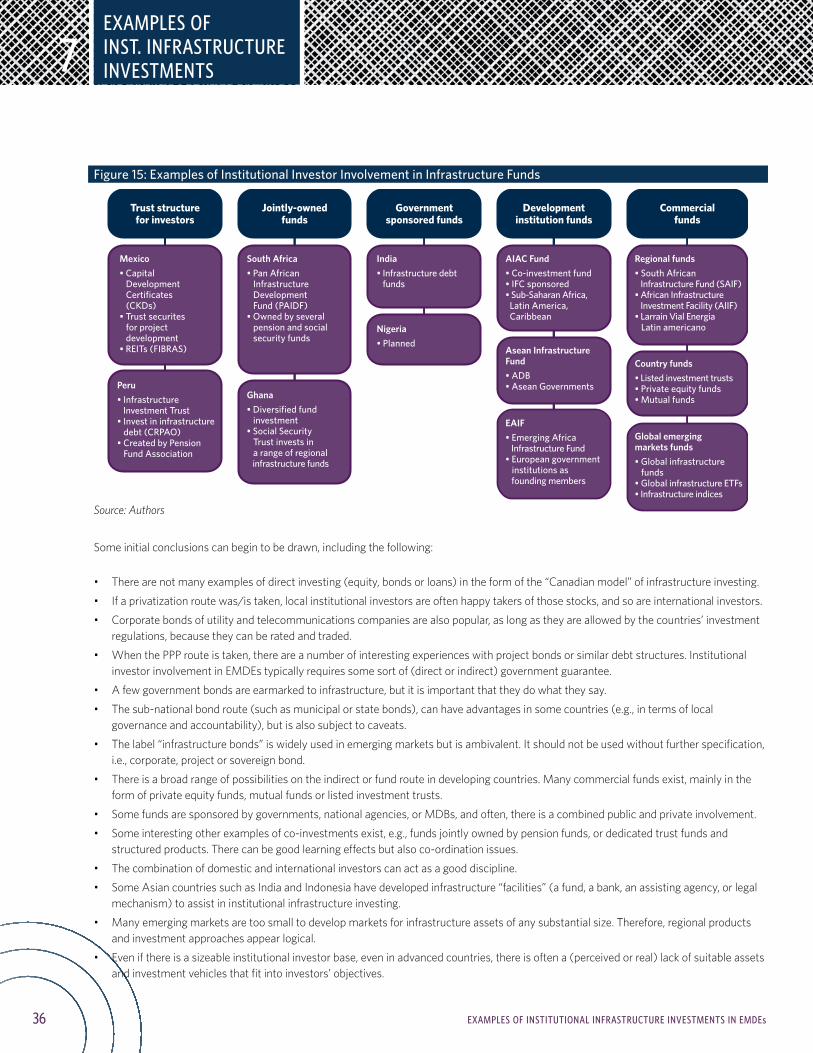
Trust structurefor investors
Mexico
• Capital Development Certificates (CKDs)• Trust securites for project development • REITs (FIBRAS)
Peru
• Infrastructure Investment Trust• Invest in infrastructure debt (CRPAO)• Created by Pension Fund Association
Jointly-ownedfunds
South Africa
• Pan African Infrastructure Development Fund (PAIDF)• Owned by several pension and social security funds
Ghana
• Diversified fund investment• Social Security Trust invests in a range of regional infrastructure funds
Governmentsponsored funds
India
• Infrastructure debt funds
Nigeria
• Planned
Developmentinstitution funds
AIAC Fund
• Co-investment fund• IFC sponsored• Sub-Saharan Africa, Latin America, Caribbean
Asean Infrastructure Fund
• ADB• Asean Governments
EAIF
• Emerging Africa Infrastructure Fund• European government institutions as founding members
Commercialfunds
Regional funds
• South African Infrastructure Fund (SAIF)• African Infrastructure Investment Facility (AIIF)• Larrain Vial Energia Latin americano
Country funds
• Listed investment trusts• Private equity funds• Mutual funds
Global emerging markets funds
• Global infrastructure funds• Global infrastructure ETFs• Infrastructure indices
36 EXAMPLES OF INSTITUTIONAL INFRASTRUCTURE INVESTMENTS IN EMDEs
7EXAMPLES OF INST. INFRASTRUCTURE INVESTMENTS
Figure 15: Examples of Institutional Investor Involvement in Infrastructure Funds
Source: Authors
Some initial conclusions can begin to be drawn, including the following:
• There are not many examples of direct investing (equity, bonds or loans) in the form of the “Canadian model” of infrastructure investing.
• If a privatization route was/is taken, local institutional investors are often happy takers of those stocks, and so are international investors.
• Corporate bonds of utility and telecommunications companies are also popular, as long as they are allowed by the countries’ investment regulations, because they can be rated and traded.
• When the PPP route is taken, there are a number of interesting experiences with project bonds or similar debt structures. Institutional investor involvement in EMDEs typically requires some sort of (direct or indirect) government guarantee.
• A few government bonds are earmarked to infrastructure, but it is important that they do what they say.
• The sub-national bond route (such as municipal or state bonds), can have advantages in some countries (e.g., in terms of local governance and accountability), but is also subject to caveats.
• The label “infrastructure bonds” is widely used in emerging markets but is ambivalent. It should not be used without further specification, i.e., corporate, project or sovereign bond.
• There is a broad range of possibilities on the indirect or fund route in developing countries. Many commercial funds exist, mainly in the form of private equity funds, mutual funds or listed investment trusts.
• Some funds are sponsored by governments, national agencies, or MDBs, and often, there is a combined public and private involvement.
• Some interesting other examples of co-investments exist, e.g., funds jointly owned by pension funds, or dedicated trust funds and structured products. There can be good learning effects but also co-ordination issues.
• The combination of domestic and international investors can act as a good discipline.
• Some Asian countries such as India and Indonesia have developed infrastructure “facilities” (a fund, a bank, an assisting agency, or legal mechanism) to assist in institutional infrastructure investing.
• Many emerging markets are too small to develop markets for infrastructure assets of any substantial size. Therefore, regional products and investment approaches appear logical.
• Even if there is a sizeable institutional investor base, even in advanced countries, there is often a (perceived or real) lack of suitable assets and investment vehicles that fit into investors’ objectives.

37MODELS OF INFRASTRUCTURE INVESTING IN DEVELOPING ECONOMIES
8MODELS OF
INFRASTRUCTURE INVESTING
Models of Infrastructure Investing in Developing Economies
8.1. BACKGROUND ENVIRONMENT The environment for institutional infrastructure investment is rarely perfect, even in advanced countries. Therefore, reform measures are advisable to facilitate an increased involvement of domestic and international pension funds and insurance companies. There are a number of attributes of the background environment that need to be assessed and addressed before institutional investors will move into infrastructure projects. They include:
• Nature and size of the institutional investor base, and its regulation;• State of the financial system, bank intermediation and capital markets;• Infrastructure policies, taxation and regulation;• Enabling environment for private-sector investment in infrastructure; and• Economic and political macro-environment.
Figure 16 gives a stylized decision tree that may help in necessary reforms and policy improvements.
Figure 16: Considerations for Institutional Infrastructure Investment
Source: Authors
Are there institutional investors with investment funds? (Pension/social security funds, insurers, SWFs) • Yes (type, size)• No: Create or reform funded pension /social security system
Are there substantial investment limits/ constraints?• No• Yes: Review: • Quantitative limits – asset classes/ investment vehicles – liquidity• Investor regulation • funding & solvency• Foreign investments
Are there infrastructure assets to invest in?• Yes: private / privatized• Yes: public-private / PPP• No: Develop / review infrastructure policy
Are there working capital markets? (equities/ bonds/derivatives)• Yes• No: Develop/reform capital markets
Is the bank intermediation working?• Yes• No: reform banks• No: development banks• No: multilateral development agencies
Is there a favorable macro-environment (political, law, institutions)• Yes• No: reform/improve: – political stability – rule of law – regulatory certainty – institutions

38 MODELS OF INFRASTRUCTURE INVESTING IN DEVELOPING ECONOMIES
8MODELS OF INFRASTRUCTURE INVESTING
Likewise analysts could assess a country based on such preconditions to ascertain how well established these conditions are, and establish a specific country profile (Figure 17).
Figure 17: Country Assessment for Institutional Infrastructure Investment
Source: Authors
Some important questions arise. For example, do these factors go hand in hand? And what is the causality between different factors? Countries with higher income levels typically show higher competitiveness and better infrastructure. Furthermore, they tend to have more developed capital markets and financial industry, although not necessarily to the same degree. This would favor the existence of sizeable institutional assets, or a good quality pension system. However, there are also other important factors at work, such as the legal, corporate and social systems, as well as cultural factors. Some early analysis of these questions is available, but the answers are not clear-cut (Box 4).
Box 4: How Infrastructure can be Financed Using Private-Sector Resources
Macro-environment
Institutional Investors
Investment constraints
Infrastructure assetsInfrastructure policy
Capital markets
Bank intermediation
4
12
3
54
Assessment (1 – 5, 1 = best)
Country 1
Country 2
Mbeng Mezui (2013) looked at international experiences of how to successfully mobilize domestic markets to finance infrastructure projects. He distinguishes between three main models. In the “market-based model,” bond market financing (e.g., project, corporate, municipal and other bonds) is dominant, as in the United States and Canada. In the “development financial institutions model,” infrastructure finance rotates around development banks, as traditionally happens in Western Europe and Japan. In this taxonomy, Korea, Malaysia, Chile and Brazil fall into the first category, whereas China and India fall into the second. Mexico and Peru follow a “hybrid mode,” as does Australia. Questions can, of course, be raised around such categorizations.
Walsh et al. (2011) also analyzed the infrastructure financing options available to emerging countries such as India that are planning to substantially increase infrastructure investment. They look at Brazil, Chile, China and Korea as case studies from a macro-economic and macro-financial perspective, such as economic growth, savings, public finances, financial deepening, capital markets, open markets, etc. (continued on page 39)
39MODELS OF INFRASTRUCTURE INVESTING IN DEVELOPING ECONOMIES
8MODELS OF
INFRASTRUCTURE INVESTING
A preliminary analysis of EMDE countries can be undertaken for a set of quantitative and qualitative indicators, including:
• National income level and business conditions;• Infrastructure quality and investment conditions;• Pension assets and quality; and• Insurance company assets and SWF assets. Appendix 3 shows classifications of a subset of EMDE countries and some selected “environment indicators.” Not surprisingly, it reveals a high degree of correlation between these factors, but there are some interesting regional patterns and important outliers. Latin America, for example, has comparatively high private pension and insurance assets. Chile’s private pension assets are particularly high, and its pensions system is rated well in international comparisons. Asia looks comparatively poor in terms of private pension assets and quality. The main focus there is on PPRFs and SWFs.24 Furthermore, national development banks play a key role in national infrastructure development. Some countries such as Indonesia have a ways to catch up. The picture is very mixed in Africa. South Africa’s pension assets are particularly high. Some other counties also have sizeable private pension funds or a large PPRF; other countries are way behind. SWFs are only now starting to play a role, with a number of new establishments.
In summary, it is clear that private finance of infrastructure is not only and exclusively about the economic development stage of a country, the openness of the economy, or the shape of the financial markets and industry. Other “structures” are also important, such as the state rule and governance (e.g., national development banks vs. markets); the legal and regulatory culture; the tax systems; the corporate system and traditions (e.g., energy monopolies vs. competition); the guarantee mechanisms (public, private, or MDBs); the social security model (family, state, insurance companies or pension funds); the education system; and other cultural factors.
24 There is little reference to institutional investors in the discussion of financing options for Asian infrastructure, e.g., in Bhattacharyay (2012): “The investor base remained small, with institutional investors largely missing.” (p. 354). The reference to pension funds is primarily in the context of pension-based SWFs, i.e., SWFs from funds raised from pension or social security contributions.
The conclusion is, first, that “country experiences in general are quite heterogeneous, but some themes apply across the countries in this sample.” Securing sufficient long-term financing for infrastructure investments is of paramount importance in all four countries. Second, credit enhancement is used widely to attract private investors. Third, foreign investors may play a more or less important role.
For example, the Asian countries have been relatively successful at developing local bond and credit markets. In Chile, pension funds have been crucial, whereas in China and Brazil, it has been public banks or a development bank (BNDES). In Chile, guarantees came from monoline insurers, whereas other countries worked with public guarantees of some form. In China, infrastructure finance is a domestic affair, whereas Chile, Korea and Brazil attracted substantial foreign investors, either by placing bonds, equity ownership (Chile), funds (Korea), or PPPs (Brazil). In India, institutional investor regulations stand in the way of their involvement in infrastructure development. Foreign investors would also require other institutional improvements.
Box 4: How Infrastructure can be Financed Using Private-Sector Resources (continued from page 38)
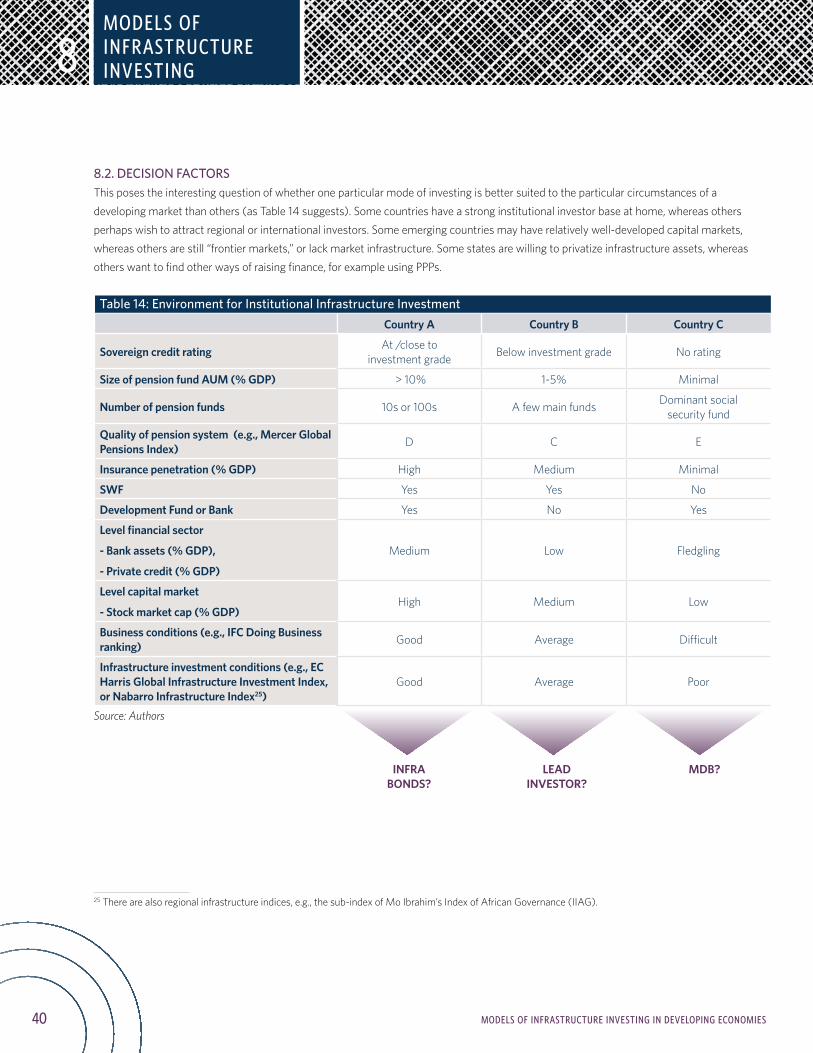
40 MODELS OF INFRASTRUCTURE INVESTING IN DEVELOPING ECONOMIES
8
8.2. DECISION FACTORSThis poses the interesting question of whether one particular mode of investing is better suited to the particular circumstances of a developing market than others (as Table 14 suggests). Some countries have a strong institutional investor base at home, whereas others perhaps wish to attract regional or international investors. Some emerging countries may have relatively well-developed capital markets, whereas others are still “frontier markets,” or lack market infrastructure. Some states are willing to privatize infrastructure assets, whereas others want to find other ways of raising finance, for example using PPPs.
Table 14: Environment for Institutional Infrastructure InvestmentCountry A Country B Country C
Sovereign credit rating At /close to investment grade Below investment grade No rating
Size of pension fund AUM (% GDP) > 10% 1-5% Minimal
Number of pension funds 10s or 100s A few main funds Dominant social security fund
Quality of pension system (e .g ., Mercer Global Pensions Index) D C E
Insurance penetration (% GDP) High Medium Minimal
SWF Yes Yes No
Development Fund or Bank Yes No Yes
Level financial sector
- Bank assets (% GDP),
- Private credit (% GDP)
Medium Low Fledgling
Level capital market
- Stock market cap (% GDP)High Medium Low
Business conditions (e .g ., IFC Doing Business ranking) Good Average Difficult
Infrastructure investment conditions (e .g ., EC Harris Global Infrastructure Investment Index, or Nabarro Infrastructure Index25)
Good Average Poor
Source: Authors
25 There are also regional infrastructure indices, e.g., the sub-index of Mo Ibrahim’s Index of African Governance (IIAG).
MODELS OF INFRASTRUCTURE INVESTING
INFRA BONDS?
LEAD INVESTOR?
MDB?
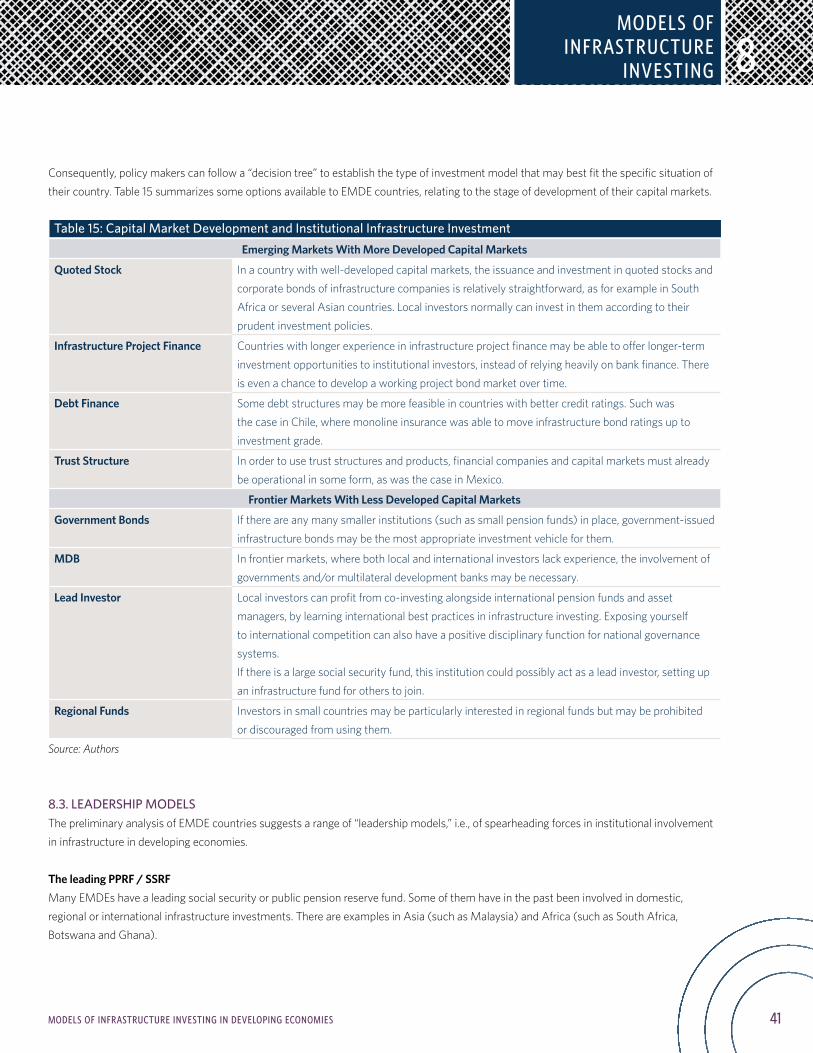
41MODELS OF INFRASTRUCTURE INVESTING IN DEVELOPING ECONOMIES
8
Consequently, policy makers can follow a “decision tree” to establish the type of investment model that may best fit the specific situation of their country. Table 15 summarizes some options available to EMDE countries, relating to the stage of development of their capital markets.
Table 15: Capital Market Development and Institutional Infrastructure Investment
Emerging Markets With More Developed Capital Markets
Quoted Stock In a country with well-developed capital markets, the issuance and investment in quoted stocks and corporate bonds of infrastructure companies is relatively straightforward, as for example in South Africa or several Asian countries. Local investors normally can invest in them according to their prudent investment policies.
Infrastructure Project Finance Countries with longer experience in infrastructure project finance may be able to offer longer-term investment opportunities to institutional investors, instead of relying heavily on bank finance. There is even a chance to develop a working project bond market over time.
Debt Finance Some debt structures may be more feasible in countries with better credit ratings. Such was the case in Chile, where monoline insurance was able to move infrastructure bond ratings up to investment grade.
Trust Structure In order to use trust structures and products, financial companies and capital markets must already be operational in some form, as was the case in Mexico.
Frontier Markets With Less Developed Capital Markets
Government Bonds If there are any many smaller institutions (such as small pension funds) in place, government-issued infrastructure bonds may be the most appropriate investment vehicle for them.
MDB In frontier markets, where both local and international investors lack experience, the involvement of governments and/or multilateral development banks may be necessary.
Lead Investor Local investors can profit from co-investing alongside international pension funds and asset managers, by learning international best practices in infrastructure investing. Exposing yourself to international competition can also have a positive disciplinary function for national governance systems.If there is a large social security fund, this institution could possibly act as a lead investor, setting up an infrastructure fund for others to join.
Regional Funds Investors in small countries may be particularly interested in regional funds but may be prohibited or discouraged from using them.
Source: Authors
8.3. LEADERSHIP MODELSThe preliminary analysis of EMDE countries suggests a range of “leadership models,” i.e., of spearheading forces in institutional involvement in infrastructure in developing economies.
The leading PPRF / SSRFMany EMDEs have a leading social security or public pension reserve fund. Some of them have in the past been involved in domestic, regional or international infrastructure investments. There are examples in Asia (such as Malaysia) and Africa (such as South Africa, Botswana and Ghana).
MODELS OF INFRASTRUCTURE
INVESTING
42 MODELS OF INFRASTRUCTURE INVESTING IN DEVELOPING ECONOMIES
8MODELS OF INFRASTRUCTURE INVESTING
The primary objective of such funds is typically the provision of pensions and social security for their members. However, given their size and importance, they sometimes also have additional (implicit or explicit) objectives, such as the contribution to economic or capital market development. There is often political pressure on the board and managers of such funds.
The innovative private-sector investorLeadership can also be provided by a private-sector institutional investor, e.g., a progressive corporate pension plan or a private wealth fund. Managers within such organizations may look at examples in other countries and find new investment routes for their own funds. Examples can be found, such as in a number of Latin American countries.
Frequent problems in this respect are investment constraints and other prohibitive regulations that hinder (smaller) private-sector funds from progressing with innovative investment ideas. Many pension funds are simply too small to be able to dedicate significant resources to private or alternative investments.
The new capital market instrumentIn some countries, the introduction of a new financial instrument enabled institutional investors to invest in infrastructure projects directly or indirectly, or facilitate an allocation of such investments. This is often led by the financial industry, but requires close co-operation with the governments. Examples include trust structures in Mexico and Peru, and infrastructure bonds in Kenya.
The introduction of new capital market instruments can be slow and insufficient. The pension and insurance regulators need to keep pace with such developments too. There are also educational issues with more complex structures.
The regional fund modelThe establishment of a regional infrastructure fund can be of great help to investors, especially in smaller countries. It enables them to participate alongside other (often more experienced) investors. It can also be an effective tool for the international diversification of assets. Regional or international development institutions often initiate such funds, co-invest, and/or provide expertise and capital. However, there are also pure commercial funds at work in single countries or regions.
Such fund solutions require a high degree of communication and trust between participants and across borders. Again, regulation and politics may stand in the way of investment.
In summary, these four leadership models cover a broad range of experiences in EMDE countries up to now. These stylized models are not necessarily exhaustive and exclusive. Some of them may be at work simultaneously with different degrees of relevance across countries.
43CONCLUSIONS
9CONCLUSIONS
Conclusions
The issue of how to encourage further private-sector investment in infrastructure is currently at the top of many policy-makers’ agendas. Given the constraints on traditional sources of public and private (banks) finance for long-term infrastructure, the potential to tap institutional investors has been widely discussed in recent times. However, the debate has so far focused mainly on developing countries, both in terms of potential investments and investors.
This paper moves this discussion into the arena of developing economies, which have the greatest infrastructure and development needs. Infrastructure investment has historically been uneven across EMDE regions and countries at different development levels, with spending in East Asia well above other regions. Future investment requirements are projected to be six to eight percent of GDP on average in EMDEs, exceeding both the world average (3.5 to 4.5 percent) and the current spending levels (estimated at USD 800 to 900 billion per annum) in most developing countries.
However, there are barriers and risks to infrastructure investing, and even more so in EMDEs. Nonetheless, some USD 50 billion of capital has been channelled to emerging markets to date, primarily via infrastructure funds. There are also some early examples of direct investments by international investors, such as large pension funds and SWFs.
Domestic institutional investors are another potentially important source of capital in emerging economies. The local asset base, estimated at roughly USD 2.5 billion for both the pensions and insurance sectors, is still relatively small, but expected to grow substantially. However, there have already been some allocations to infrastructure in some Latin American countries, as well as in South Africa and other places.
In Asia and Africa, retirement assets are often concentrated in large social security and PPRFs. Given their size, they can be of strategic importance, but also come with concerns about good governance and investment practices. SWFs are different, not only in that the majority of assets are controlled outside OECD countries, but also in that they often have specific infrastructure-related objectives, with an even bigger political component.
If the information about the current investment activity in EMDE infrastructure is sketchy, projections about the future potential allocation of institutional investors are even more speculative. Some simple calculations produce a rough estimate of USD 350 to 700 billion, or USD 30 to 60 billion per annum, if institutional investors (both international and domestic) undertake significant asset allocation shifts over the next 10 years. This could cover up to 10 percent of infrastructure investment needs, and it could be more if conditions were right and institutional assets grew strongly.
The theoretical asset potential is one thing, but the “how” and “where” of investing in practice is another thing. This study explains different investment approaches and lists examples of equity, debt and fund instruments used by institutional investors in developing countries, and sums them up in some “stylized facts.”

44 CONCLUSIONS
9 CONCLUSIONS
The institutional, economic and capital market environments for infrastructure investment are very diverse across countries, and they are rarely perfect, even in advanced countries. There are a number of key pre-conditions for institutional infrastructure involvement in EMDEs that need to be met or addressed with appropriate reform policies.
The interesting question of the “models” of institutional infrastructure investing in EMDEs arises. Governments have used four different ways of mobilizing private finance in the past. Different models work in different places, depending on the development stage and the institutional environment of a country/region. In this paper, four “leadership models” are presented of how international and/or domestic institutions can spearhead infrastructure investment in EMDEs.
This field is still very much under-researched, although some work has been undertaken in recent years, especially on a regional level. Data is still scarce and transparency is low. There are important points that will need to be investigated in more detail. This paper should provide a framework for the discussion of important questions, and set some milestones for further analysis, opening up some important questions for both investors and governments.
45REFERENCES
REFERENCES
AICD (2010), “Kenya’s Infrastructure: A Continental Perspective,” Africa Infrastructure Country Diagnostic.
Barbary, V. (2013), “Sovereign Fund Investment in Infrastructure,” Investments & Wealth Monitor, January/February 2013, pp. 32-40.
BBVA, (2010), “A Balance and Projections of the Experience in Infrastructure Funds of Pension Funds in Latin America,” BBVA Research.
BBVA (2011), “A Review of Recent Infrastructure in Latin America and the Role of Private Pension Funds,” Working Papers No. 11/37, BBVA Research.
BCG (2013a), “Capitalizing on the Recover. Global Asset Management 2013,” Boston Consulting Group.
BCG (2013b), “Maintaining Momentum in a Complex World. Global Wealth 2013,” Boston Consulting Group.
Bhattacharya, A., Romania, M., and Stern, N., (2012), “Infrastructure for development: Meeting the challenge,” CCCEP, LSE, G24.
Bhattacharyay, B. N. (2012), “Estimating demand for infrastructure 2010-2010,” In: Bhattacharyay, B. N., Kawai, M., and Nag, R., Infrastructure for Asian Connectivity, ADBI and ADB, Edward Elgar, pp. 19-79.
Blommestein, H. (1997), “Institutional Investors, Pension Reform and Emerging Securities Markets,” Inter-American Development Bank, Working Paper 359.
Blundel-Wignall, A., Hu, Y., and Yermo, J. (2008), “Sovereign Wealth and Pension Fund Issues,” OECDWorking Papers on Insurance and Private Pensions, No. 14.
Brown, J. and Jacobs, M. (2011), “Leveraging private investment: the role of public sector climate finance,” Overseas Development Institute, April 2011.
Calderon, C., (2009), “Infrastructure and Growth in Africa,” World Bank Policy Research Working Paper 4914.
Cheikhrouhou, H., Gwinner, W., Pollner, J., Salinas, E., Sirtaine, S., and Vittas, D.(2007), “Structured Finance in Latin America : Channeling Pension Funds to Housing, Infrastructure, and Small Businesses,” World Bank.
Chelsky, J., Morel, C., and Kabir, M., (2013), “Investment Financing in the Wake of the Crisis:The Role of Multilateral Development Banks,” World Bank Economic Premise No. 121.
Chuckun, V.S., (2010), “Using Pension Funds for Infrastructure Finance in Africa: The Case of NEPADProejcts,” University of Stellenbosch.
City of London (2011), “Insurance companies and pension funds as institutional investors: global investment patterns,” Trusted Sources, November 2011.
46 REFERENCES
City of London (2013), “Institutional Investment in the UK from Emerging Markets.”
Climate Policy Initiative (2013), “The Challenge of Institutional Investment in Renewable Energy,” CPI Report, March 2013.
Coletta, M. and Zinni, B. (2013), “Insurance corporations and pension funds in OECD countries,” Banca d’Italia, Questioni di Economia e Finanza, Occasional Papers, Nr. 165, June 2013.
Della Croce, R. (2011), “Pension Funds Investment in Infrastructure: Policy Actions,” OECD Working Papers on Finance, Insurance and Private Pensions, No. 13, OECD Publishing.
Delmon, J. and Delmon, V. (2011), “International Project Finance and PPPs: A Legal Guide to Key Growth Markets,”.Wolters Kluwer International.
Delmon, J., Jett, A., Wolf, G., and Kacaniku, T. (2012), “Infrastructure Finance Intermediary Survey,” World Bank.
Dethier, J. and Moore, A. (2012), “Infrastructure in developing countries: an overview of some economic issues,” ZEF-Discussion Papers on Development Policy, No. 165, April 2012.
Eberhard, A. (2007), “Infrastructure Regulation in Developing Countries,” PPIAF Working Paper, No. 4.
England, A. and Blas, J. (2014), “South Africa rising,” Financial Times, 12 February 2014.
Fay, M. and Yepes, T. (2003), “Investing in Infrastructure. What is needed from 2000 to 2010?” World Bank Policy Research Working Paper 3102, July 2003.
Fay, M., Toman, M., Benitez, D., and Csordas, S. (2011), “Infrastructure and Sustainable Development,”In: Fardoust, S., Yongbeom, K., and Sepúlveda, C. (Ed.), “Post-Crisis Growth and Development,” World Bank.
Ferreira, D. and Khatami, K. (1996), “Financing Private Infrastructure in Developing Countries,” World Bank Discussion Paper, No. 343.
G20 (2013), “Long-term Investment Financing for Growth and Development,” Umbrella Paper prepared by World Bank.
Gramlich, E. (1994), “Infrastructure Investment; A Review Essay,” Journal of Economic Literature, Vol. XXXII, September 1994, pp. 1176-1196.
Hall, D., (2009), “Infrastructure, the Crisis and Pension Funds,” PSIRU, December 2009.
Hanson, T., (2008), “Financing Transportation Infrastructure Investment in Colombia with Pension Savings.”
Hess, D. and Impavido, G. (2004), “Governance of Public Pension Funds: Lessons from Corporate Governance and International Evidence.”
Hinojosa, S. A. (2011), “Enhancing Public Private Partnerships through Guarantees: Selected Latin American Cases and Conceptual Issues,”
REFERENCES
47REFERENCES
presentation made at PPIAF/ World Bank conference on Financing Public-Private Partnerships in Latin America, Washington D.C., May 2011.
Iglesias, A. and Palacios, R. (2000), “Managing Public Pension Reserves Part I: Evidence from International Experience.”
Inderst, G. (2009), “Pension Fund Investment in Infrastructure,” OECD Working Paper on Insurance and Private Pensions No. 32.
Inderst, G. (2010), “Infrastructure as an asset class,” EIB Papers, Vol. 15, No. 1.
Inderst (2013), “Private Infrastructure Finance and Investment in Europe,” EIB Working Papers 2013/02.
Inderst G. and Della Croce, R. (2013), “Pension Fund Investment in Infrastructure: A Comparison between Australia and Canada,” OECD Working Papers on Finance, Insurance and Private Pensions, No. 32, OECD Publishing.
IOPS (2011), “Pension Fund Use of Alternative Investments and Derivatives: Regulation, Industry Practice and Implementation Issues,” IOPS Working Papers on Effective Pension Supervision No. 13.
IOSCO (2012), “Development and Regulation of Institutional Investors in Emerging Markets.” IPE and Sterling (2013), Institutional Infrastructure Survey, IPE and Stirling Capital Partners.
Irving, J. and Manroth, A. (2009), “Local Sources of Financing for Infrastructure in Africa,” World Bank. Kalter, E. (2012), SWF Asset Allocation after the Financial Crisis, Presentation, March 2012.
Kalter, E. (2010), “Sovereign Wealth Funds. Public Policy and Asset Allocation After the Financial Crisis,” The Fletcher School, Tufts University, Presentation October 2010.
Kerf, M. and Smith, W. (1996), “Privatizing Africa’s Infrastructure,” World Bank Technical Paper No. 337.
Kravets, O. (2013), “Infrastructure Investments in Eastern Neighbours and Central Asia (ENCA),” EIB Working Papers 2013/01.
Kumar, A., Gray, D., Hoskote, M., Klaudy, S., and Ruster, J. (1997), “Mobilizing Domestic Capital Markets for Infrastructure Financing,” World Bank Discussion Paper, No. 377.
Lin, J. and Doemeland, D. (2012), “Beyond Keynesianism: Global Infrastructure Investment in Times of Crisis,” World Bank Policy Research Working Paper 5940.
Mbeng Mezui, C. A. (2012), “Accessing Local Markets for Infrastructure: Lessons for Africa,” African Development Bank Working Paper Series No. 153.
Mbeng Mezui, C.A. and Hundal, B. (2013), “Structured Finance: Conditions for Infrastructure Bonds in African Markets,” African
REFERENCES
48 REFERENCES
Development Bank, NEPAD.
McKinsey (2010), “Farewell to cheap capital? The implications of long-term shifts in global investment and saving,” McKinsey Global Institute, December 2010.
McKinsey (2011), “The emerging equity gap: Growth and stability in the new investor landscape.”
McKinsey (2013), “Infrastructure productivity: How to save $1 trillion a year,” McKinsey Global Institute, January 2013.
Musalem, A.,R. and Souto, P. (2012), “Assessing the Governance and Transparency of National Public Pension Funds,” Review of European Studies, Vol. 4, No. 2, June 2012.
Mutero, J. (2010), “Mobilising pension assets for housing finance needs in Africa – Experiences and prospects in East Africa,” Centre for Affordable Housing Finance in Africa.
Muzenda, D. (2009), “Increasing Private Investment in African Energy Infrastructure,” Background Paper, NEPAD-OECD Expert Africa Investment Initiative.
OECD, (2006), “Infrastructure to 2030: Telecom, Land Transport, Water and Electricity.”
OECD (2012), “Strategic Transport Infrastructure Needs to 2030.”
OECD (2013a), “Annual Survey of Large Pension Funds and Public Reserve Pension Funds.”
OECD (2013b), “Pension at a Glance 2013: OECD and G20 Indicators.”
OECD (2013c), “Annual Survey of Investment Regulation of Pension Funds.”
OECD (2013d), “Pension Markets in Focus.”
OECD (2013e), “Institutional Investor Statistics 2005-2012,” OECD Publishing.
OECD (2014 – forthcoming), “Government and Market-based Instruments and Incentives to Stimulate Long-term Investment Finance in Infrastructure.”
Orr., R.,J. and Kennedy, J., R. (2008), “Highlights of Recent Trends in Global Infrastructure: New Players and Revised Game Rule.”
Palacios, R. (2002), “Managing Public Pension Reserves Part II: Lessons from Five Recent OECD Initiatives,” World Bank Social Protection Discussion Paper Series 33407.
Platz, D. (2009), “Infrastructure Financing in Developing Economies: The Potential of Sub-Sovereign Bonds.”
REFERENCES
49REFERENCES
Preqin (2013), “Global Alternatives Report.”
Preqin (various dates, from 2012 to 2014), “Infrastructure Spotlight.”
RBS (2011), “The Roots of Growth. Projecting EM infrastructure demand to 2030,” Emerging Markets Strategy, Royal Bank of Scotland.
Sawant (2010), “Infrastructure Investing: Managing the Risks and Rewards for Pensions, Insurance Companies and Endowments,” Wiley & Sons, New York, NY, United States.
Sinha, P., Arya, D., and Singh, S., “Evolution of Financing Needs in India Infrastructure,” MPRA, 13 April 2012.
Shendy, R., Kaplan, Z., and Mousley, P. (2011), “Towards Better Infrastructure,” World Bank Study 63433.
Schwartz, J., Ruiz-Nunez, F., and Chelsky, J. (2014), “Closing the Infrastructure Finance Gap: Addressing Risk,” http://www.rba.gov.au/publications/confs/2014/pdf/schwartz-ruiz-nunez-chelsky.pdf.Stewart, F. and J. Yermo (2009), “Pensions in Africa,” OECD Working Papers on Insurance and Private Pensions, No. 30, OECD Publishing.
Stewart, F. and J. Yermo (2012), “Infrastructure Investment in New Markets: Challenges and Opportunities for Pension Funds,” OECD Working Papers on Finance, Insurance and Private Pensions, No. 26, OECD Publishing. TheCityUK (2013), “Sovereign Wealth Funds,” Financial Markets Series, March 2013.
TUAC (2012), “What role for pension funds in financing climate change policies?” The Trade Union Advisory Committee (TUAC) to the OECD, 23 May 2012.
Vives, A. (1999). “Pension Funds in Infrastructure Project Finance: Regulations and Instrument Design,” The Journal of Structured Finance, (5:2), pp. 37-52.
Walsh, J., Park and Ch., Yu, J. (2011), “Financing Infrastructure in India: Macroeconomic Lessons and Emerging Market,” Case Studies. IMF Working Paper WP/11/181.
WEF (2011), “The Future of Long-term Investing,” World Economic Forum.
WEF (2012), “Strategic Infrastructure,” World Economic Forum.
WEF (2013a), “The Green Investment Report,” World Economic Forum.
WEF (2013b), “Strategic Infrastructure in Africa. A business approach to project acceleration,” May 2013.
World Bank (2012a), “Patterns of International Pension Provision.”
REFERENCES

50 REFERENCES
World Bank (2012b), “Best Practices in Public-Private Partnerships in Latin America: the role of innovative approaches,” Washington, DC.
Wright, G., Stevens, D., and de Ferranti, D. (2011), “Tapping into $1.1 trillion of Domestic Development Aid Funding,” Results for Development.
Yepes, T., (2008), “Investment Needs for Infrastructure in Developing Countries 2008–15”, World Bank, Washington DC
REFERENCES
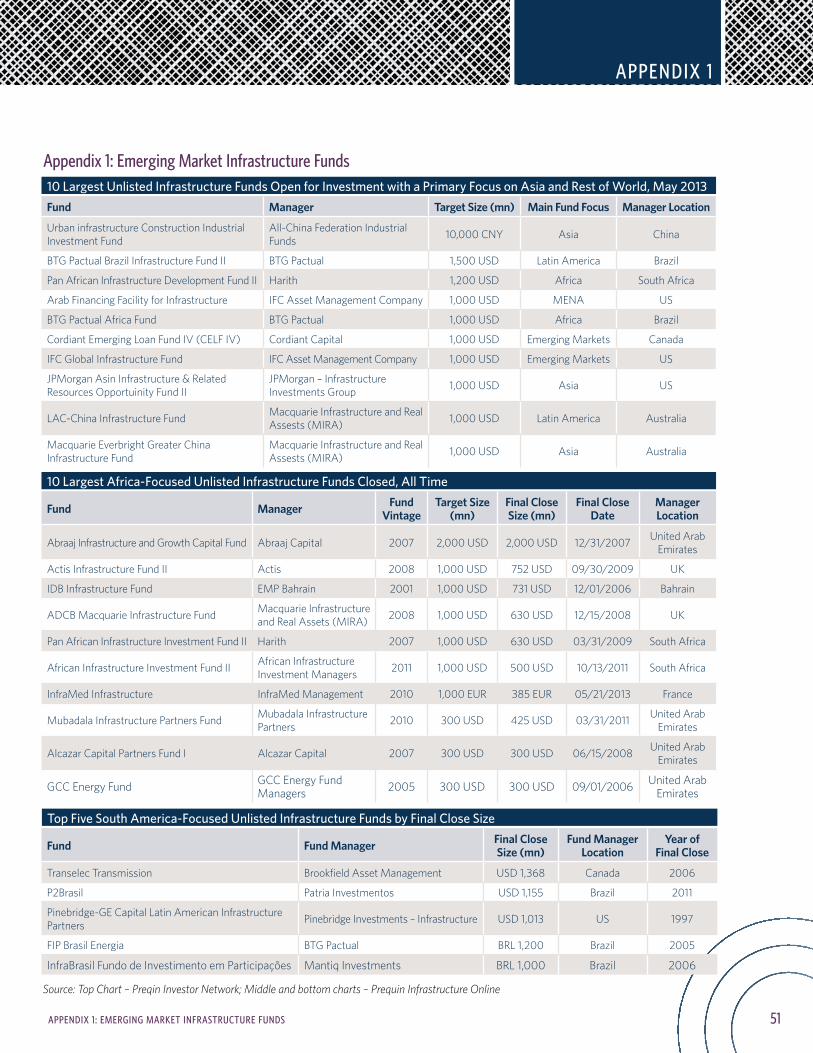
51APPENDIX 1: EMERGING MARKET INFRASTRUCTURE FUNDS
APPENDIX 1
Appendix 1: Emerging Market Infrastructure Funds 10 Largest Unlisted Infrastructure Funds Open for Investment with a Primary Focus on Asia and Rest of World, May 2013
Fund Manager Target Size (mn) Main Fund Focus Manager Location
Urban infrastructure Construction Industrial Investment Fund
All-China Federation Industrial Funds 10,000 CNY Asia China
BTG Pactual Brazil Infrastructure Fund II BTG Pactual 1,500 USD Latin America Brazil
Pan African Infrastructure Development Fund II Harith 1,200 USD Africa South Africa
Arab Financing Facility for Infrastructure IFC Asset Management Company 1,000 USD MENA US
BTG Pactual Africa Fund BTG Pactual 1,000 USD Africa Brazil
Cordiant Emerging Loan Fund IV (CELF IV) Cordiant Capital 1,000 USD Emerging Markets Canada
IFC Global Infrastructure Fund IFC Asset Management Company 1,000 USD Emerging Markets US
JPMorgan Asin Infrastructure & Related Resources Opportuinity Fund II
JPMorgan – Infrastructure Investments Group 1,000 USD Asia US
LAC-China Infrastructure Fund Macquarie Infrastructure and Real Assests (MIRA) 1,000 USD Latin America Australia
Macquarie Everbright Greater China Infrastructure Fund
Macquarie Infrastructure and Real Assests (MIRA) 1,000 USD Asia Australia
10 Largest Africa-Focused Unlisted Infrastructure Funds Closed, All Time
Fund Manager Fund Vintage
Target Size (mn)
Final Close Size (mn)
Final Close Date
Manager Location
Abraaj Infrastructure and Growth Capital Fund Abraaj Capital 2007 2,000 USD 2,000 USD 12/31/2007 United Arab Emirates
Actis Infrastructure Fund II Actis 2008 1,000 USD 752 USD 09/30/2009 UK
IDB Infrastructure Fund EMP Bahrain 2001 1,000 USD 731 USD 12/01/2006 Bahrain
ADCB Macquarie Infrastructure Fund Macquarie Infrastructure and Real Assets (MIRA) 2008 1,000 USD 630 USD 12/15/2008 UK
Pan African Infrastructure Investment Fund II Harith 2007 1,000 USD 630 USD 03/31/2009 South Africa
African Infrastructure Investment Fund II African Infrastructure Investment Managers 2011 1,000 USD 500 USD 10/13/2011 South Africa
InfraMed Infrastructure InfraMed Management 2010 1,000 EUR 385 EUR 05/21/2013 France
Mubadala Infrastructure Partners Fund Mubadala Infrastructure Partners 2010 300 USD 425 USD 03/31/2011 United Arab
Emirates
Alcazar Capital Partners Fund I Alcazar Capital 2007 300 USD 300 USD 06/15/2008 United Arab Emirates
GCC Energy Fund GCC Energy Fund Managers 2005 300 USD 300 USD 09/01/2006 United Arab
Emirates Top Five South America-Focused Unlisted Infrastructure Funds by Final Close Size
Fund Fund Manager Final Close Size (mn)
Fund Manager Location
Year of Final Close
Transelec Transmission Brookfield Asset Management USD 1,368 Canada 2006
P2Brasil Patria Investmentos USD 1,155 Brazil 2011
Pinebridge-GE Capital Latin American Infrastructure Partners Pinebridge Investments – Infrastructure USD 1,013 US 1997
FIP Brasil Energia BTG Pactual BRL 1,200 Brazil 2005
InfraBrasil Fundo de Investimento em Participações Mantiq Investments BRL 1,000 Brazil 2006
Source: Top Chart – Preqin Investor Network; Middle and bottom charts – Prequin Infrastructure Online
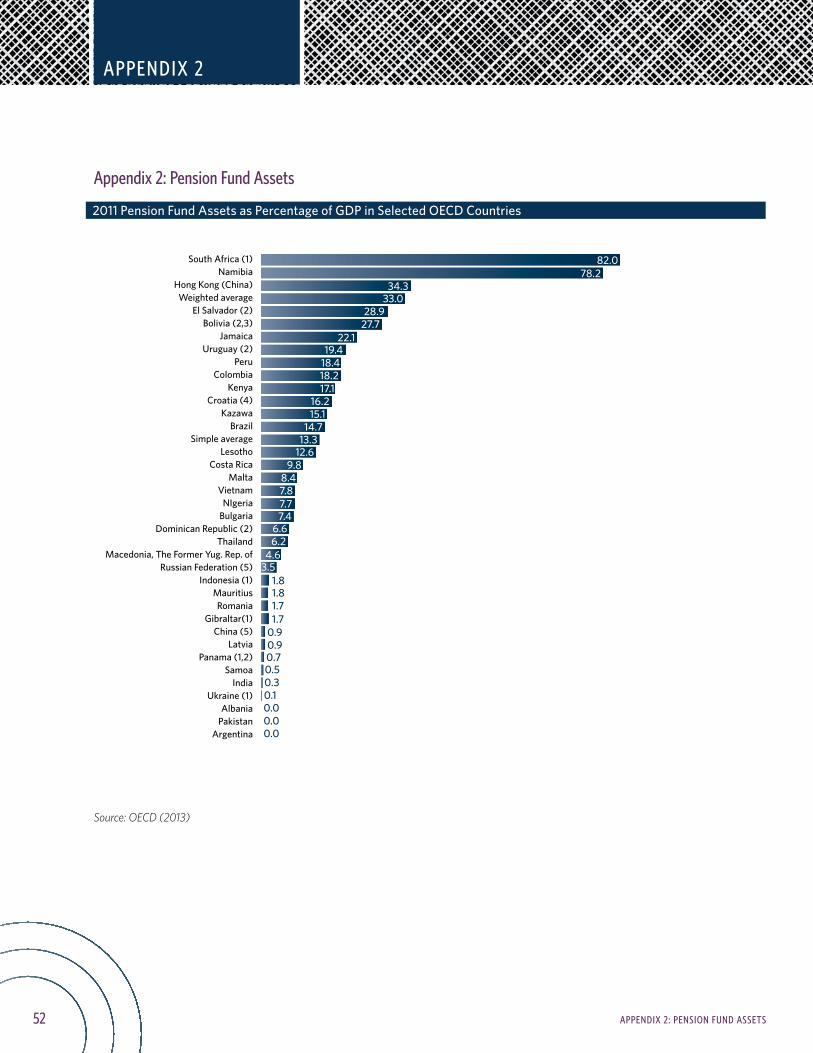
52 APPENDIX 2: PENSION FUND ASSETS
APPENDIX 2
2011 Pension Fund Assets as Percentage of GDP in Selected OECD Countries
South Africa (1)Namibia
Hong Kong (China)Weighted average
El Salvador (2)Bolivia (2,3)
JamaicaUruguay (2)
PeruColombia
KenyaCroatia (4)
KazawaBrazil
Simple averageLesotho
Costa RicaMalta
VietnamNIgeria
BulgariaDominican Republic (2)
ThailandMacedonia, The Former Yug. Rep. of
Russian Federation (5)Indonesia (1)
MauritiusRomania
Gibraltar(1)China (5)
LatviaPanama (1,2)
SamoaIndia
Ukraine (1)Albania
PakistanArgentina
82.078.234.333.028.927.722.119.418.418.217.116.215.114.713.312.69.88.47.87.77.46.66.24.63.51.81.81.71.70.90.90.70.50.30.10.00.00.0
NetherlandsIceland
Switzerland (1)United Kingdom (2)
Australia (3)Finland
Weighted averageUnited States
CanadaChileIsrael
DenmarkIreland (4)
Simple averageJapan (5)
PolandNew Zealand (3)
MexicoSlovak Republic
SwedenPortugalEstonia
SpainNorway
Czech RepublicGermany
ItalyKorea
AustriaBelgium
TurkeySlovenia
Hungary (6)Luxembourg
France (7)Greece
Source: OECD (2013)
Appendix 2: Pension Fund Assets
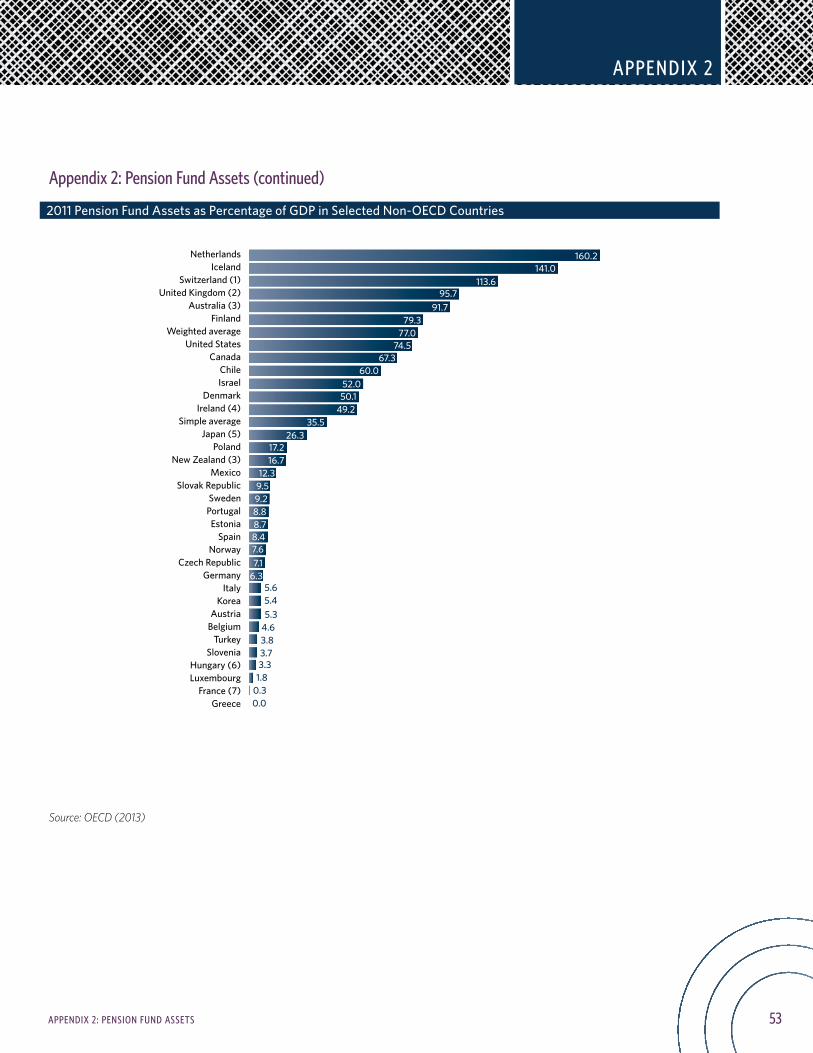
53APPENDIX 2: PENSION FUND ASSETS
APPENDIX 2
2011 Pension Fund Assets as Percentage of GDP in Selected Non-OECD Countries
South Africa (1)Namibia
Hong Kong (China)Weighted average
El Salvador (2)Bolivia (2,3)
JamaicaUruguay (2)
PeruColombia
KenyaCroatia (4)
KazawaBrazil
Simple averageLesotho
Costa RicaMalta
VietnamNIgeria
BulgariaDominican Republic (2)
ThailandMacedonia, The Former Yug. Rep. of
Russian Federation (5)Indonesia (1)
MauritiusRomania
Gibraltar(1)China (5)
LatviaPanama (1,2)
SamoaIndia
Ukraine (1)Albania
PakistanArgentina
82.078.234.333.028.927.722.119.418.418.217.116.215.114.713.312.69.88.47.87.77.46.66.24.63.51.81.81.71.70.90.90.70.50.30.10.00.00.0
NetherlandsIceland
Switzerland (1)United Kingdom (2)
Australia (3)Finland
Weighted averageUnited States
CanadaChileIsrael
DenmarkIreland (4)
Simple averageJapan (5)
PolandNew Zealand (3)
MexicoSlovak Republic
SwedenPortugalEstonia
SpainNorway
Czech RepublicGermany
ItalyKorea
AustriaBelgium
TurkeySlovenia
Hungary (6)Luxembourg
France (7)Greece
Source: OECD (2013)
Appendix 2: Pension Fund Assets (continued)
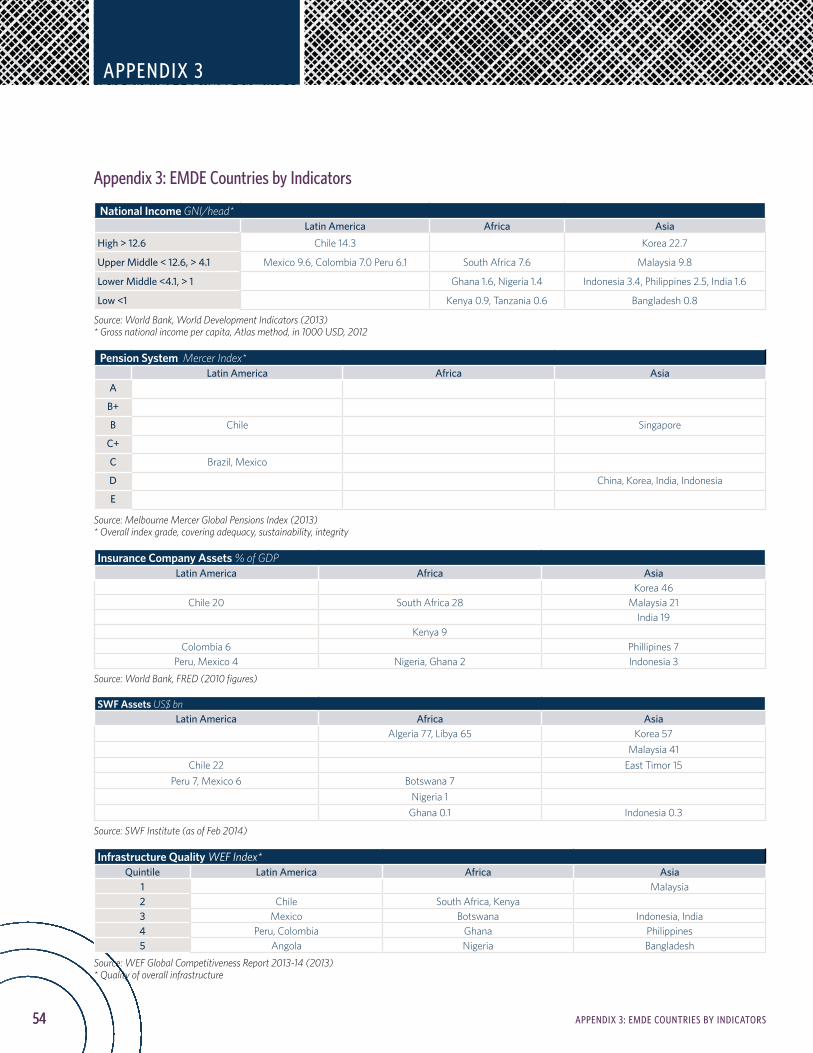
54
LARGERSECTION TITLE1
54 APPENDIX 3: EMDE COUNTRIES BY INDICATORS
APPENDIX 3
Appendix 3: EMDE Countries by Indicators
National Income GNI/head*Latin America Africa Asia
High > 12.6 Chile 14.3 Korea 22.7
Upper Middle < 12.6, > 4.1 Mexico 9.6, Colombia 7.0 Peru 6.1 South Africa 7.6 Malaysia 9.8
Lower Middle <4.1, > 1 Ghana 1.6, Nigeria 1.4 Indonesia 3.4, Philippines 2.5, India 1.6
Low <1 Kenya 0.9, Tanzania 0.6 Bangladesh 0.8
Source: World Bank, World Development Indicators (2013) * Gross national income per capita, Atlas method, in 1000 USD, 2012
Pension System Mercer Index*Latin America Africa Asia
A
B+
B Chile Singapore
C+
C Brazil, Mexico
D China, Korea, India, Indonesia
E
Source: Melbourne Mercer Global Pensions Index (2013) * Overall index grade, covering adequacy, sustainability, integrity
Insurance Company Assets % of GDPLatin America Africa Asia
Korea 46Chile 20 South Africa 28 Malaysia 21
India 19Kenya 9
Colombia 6 Phillipines 7Peru, Mexico 4 Nigeria, Ghana 2 Indonesia 3
Source: World Bank, FRED (2010 figures)
SWF Assets US$ bnLatin America Africa Asia
Algeria 77, Libya 65 Korea 57Malaysia 41
Chile 22 East Timor 15Peru 7, Mexico 6 Botswana 7
Nigeria 1Ghana 0.1 Indonesia 0.3
Source: SWF Institute (as of Feb 2014)
Infrastructure Quality WEF Index*Quintile Latin America Africa Asia
1 Malaysia2 Chile South Africa, Kenya3 Mexico Botswana Indonesia, India4 Peru, Colombia Ghana Philippines5 Angola Nigeria Bangladesh
Source: WEF Global Competitiveness Report 2013-14 (2013) * Quality of overall infrastructure
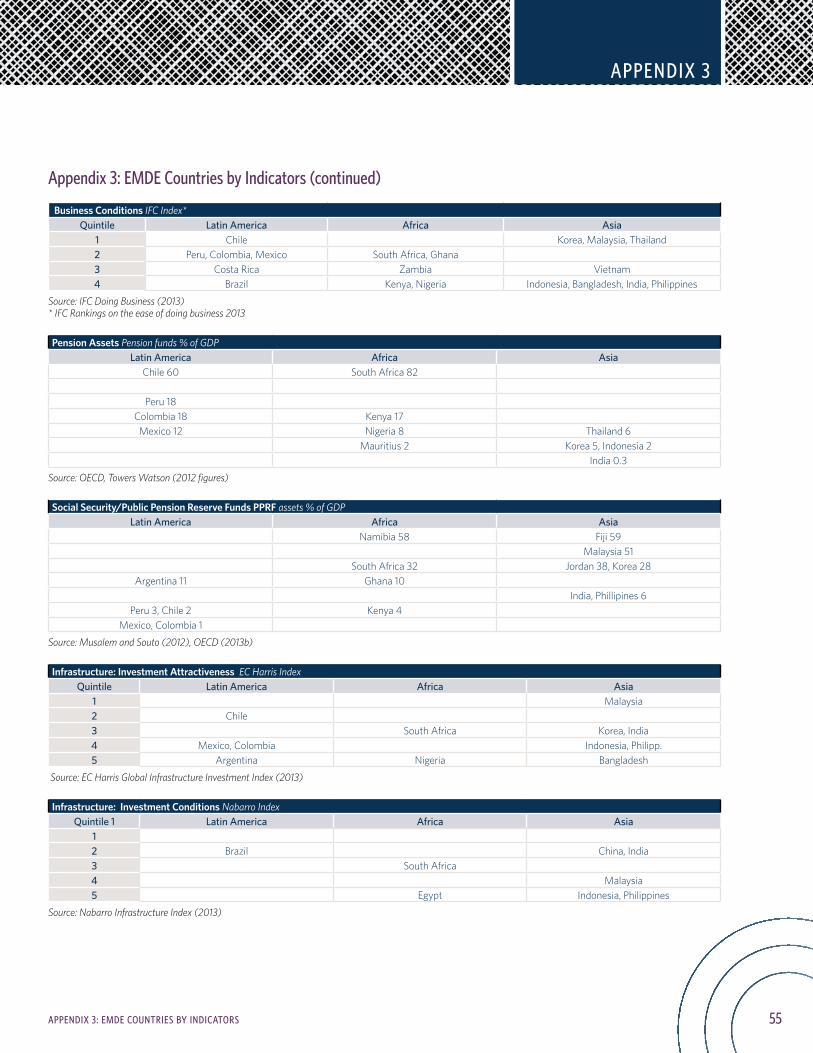
55
APPENDIX 3
APPENDIX 3: EMDE COUNTRIES BY INDICATORS
Appendix 3: EMDE Countries by Indicators (continued)
Business Conditions IFC Index*Quintile Latin America Africa Asia
1 Chile Korea, Malaysia, Thailand2 Peru, Colombia, Mexico South Africa, Ghana3 Costa Rica Zambia Vietnam4 Brazil Kenya, Nigeria Indonesia, Bangladesh, India, Philippines
Source: IFC Doing Business (2013) * IFC Rankings on the ease of doing business 2013
Pension Assets Pension funds % of GDPLatin America Africa Asia
Chile 60 South Africa 82
Peru 18Colombia 18 Kenya 17Mexico 12 Nigeria 8 Thailand 6
Mauritius 2 Korea 5, Indonesia 2India 0.3
Source: OECD, Towers Watson (2012 figures)
Social Security/Public Pension Reserve Funds PPRF assets % of GDPLatin America Africa Asia
Namibia 58 Fiji 59Malaysia 51
South Africa 32 Jordan 38, Korea 28Argentina 11 Ghana 10
India, Phillipines 6Peru 3, Chile 2 Kenya 4
Mexico, Colombia 1
Source: Musalem and Souto (2012), OECD (2013b)
Infrastructure: Investment Attractiveness EC Harris IndexQuintile Latin America Africa Asia
1 Malaysia2 Chile3 South Africa Korea, India4 Mexico, Colombia Indonesia, Philipp.5 Argentina Nigeria Bangladesh
Source: EC Harris Global Infrastructure Investment Index (2013)
Infrastructure: Investment Conditions Nabarro IndexQuintile 1 Latin America Africa Asia
12 Brazil China, India3 South Africa4 Malaysia5 Egypt Indonesia, Philippines
Source: Nabarro Infrastructure Index (2013)
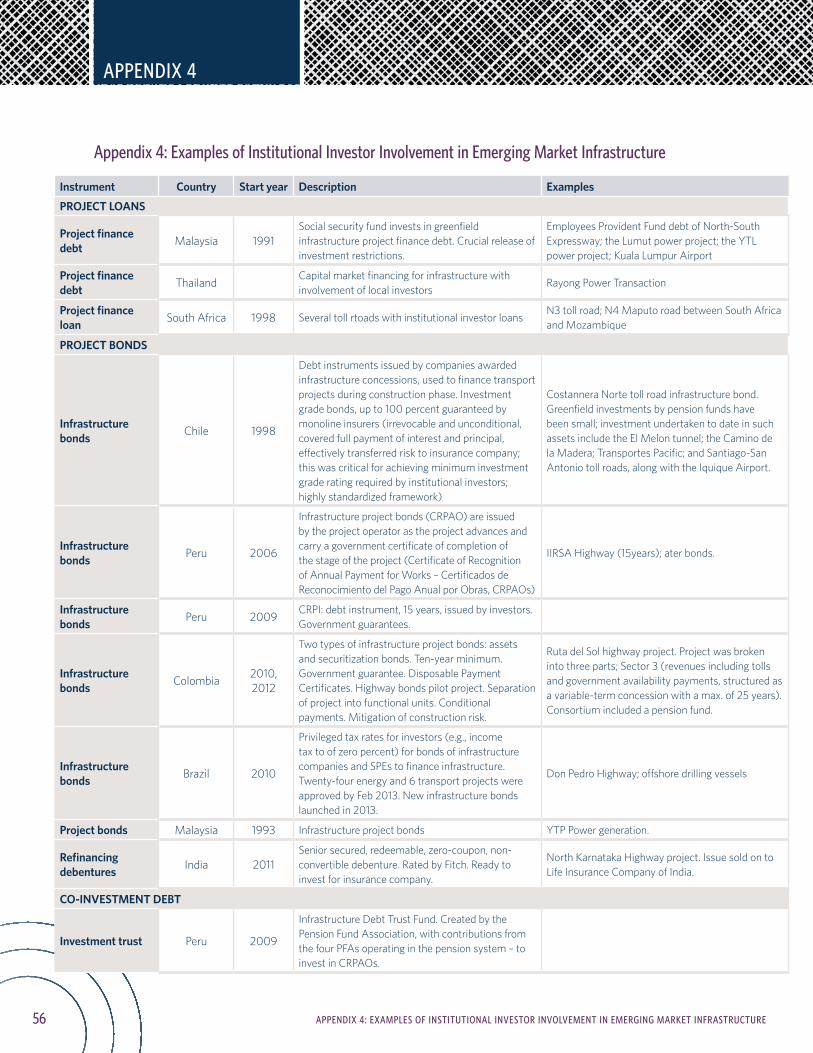
56
APPENDIX 4
APPENDIX 4: EXAMPLES OF INSTITUTIONAL INVESTOR INVOLVEMENT IN EMERGING MARKET INFRASTRUCTURE
Instrument Country Start year Description Examples
PROJECT LOANS
Project finance debt Malaysia 1991
Social security fund invests in greenfield infrastructure project finance debt. Crucial release of investment restrictions.
Employees Provident Fund debt of North-South Expressway; the Lumut power project; the YTL power project; Kuala Lumpur Airport
Project finance debt Thailand Capital market financing for infrastructure with
involvement of local investorsRayong Power Transaction
Project finance loan South Africa 1998 Several toll rtoads with institutional investor loans
N3 toll road; N4 Maputo road between South Africa and Mozambique
PROJECT BONDS
Infrastructure bonds Chile 1998
Debt instruments issued by companies awarded infrastructure concessions, used to finance transport projects during construction phase. Investment grade bonds, up to 100 percent guaranteed by monoline insurers (irrevocable and unconditional, covered full payment of interest and principal, effectively transferred risk to insurance company; this was critical for achieving minimum investment grade rating required by institutional investors; highly standardized framework)
Costannera Norte toll road infrastructure bond. Greenfield investments by pension funds have been small; investment undertaken to date in such assets include the El Melon tunnel; the Camino de la Madera; Transportes Pacific; and Santiago-San Antonio toll roads, along with the Iquique Airport.
Infrastructure bonds Peru 2006
Infrastructure project bonds (CRPAO) are issued by the project operator as the project advances and carry a government certificate of completion of the stage of the project (Certificate of Recognition of Annual Payment for Works – Certificados de Reconocimiento del Pago Anual por Obras, CRPAOs)
IIRSA Highway (15years); ater bonds.
Infrastructure bonds Peru 2009 CRPI: debt instrument, 15 years, issued by investors.
Government guarantees.
Infrastructure bonds Colombia 2010,
2012
Two types of infrastructure project bonds: assets and securitization bonds. Ten-year minimum. Government guarantee. Disposable Payment Certificates. Highway bonds pilot project. Separation of project into functional units. Conditional payments. Mitigation of construction risk.
Ruta del Sol highway project. Project was broken into three parts; Sector 3 (revenues including tolls and government availability payments, structured as a variable-term concession with a max. of 25 years). Consortium included a pension fund.
Infrastructure bonds Brazil 2010
Privileged tax rates for investors (e.g., income tax to of zero percent) for bonds of infrastructure companies and SPEs to finance infrastructure. Twenty-four energy and 6 transport projects were approved by Feb 2013. New infrastructure bonds launched in 2013.
Don Pedro Highway; offshore drilling vessels
Project bonds Malaysia 1993 Infrastructure project bonds YTP Power generation.
Refinancing debentures India 2011
Senior secured, redeemable, zero-coupon, non-convertible debenture. Rated by Fitch. Ready to invest for insurance company.
North Karnataka Highway project. Issue sold on to Life Insurance Company of India.
CO-INVESTMENT DEBT
Investment trust Peru 2009
Infrastructure Debt Trust Fund. Created by the Pension Fund Association, with contributions from the four PFAs operating in the pension system – to invest in CRPAOs.
Appendix 4: Examples of Institutional Investor Involvement in Emerging Market Infrastructure
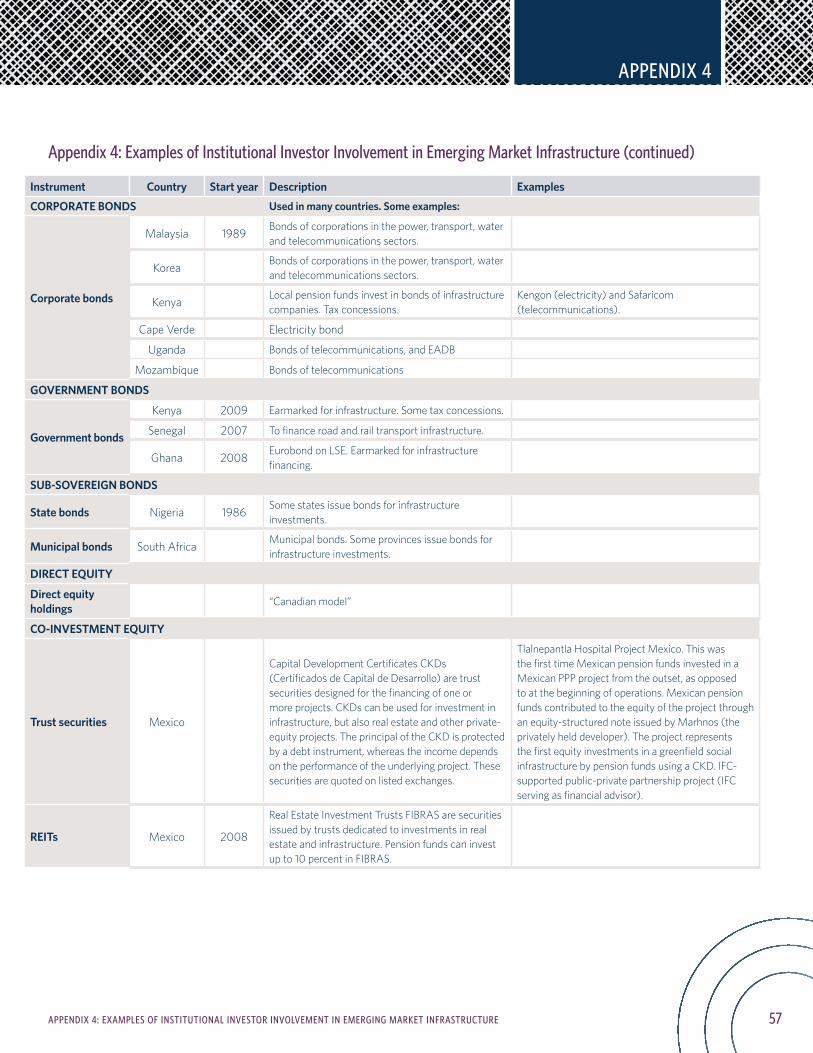
57
APPENDIX 4
APPENDIX 4: EXAMPLES OF INSTITUTIONAL INVESTOR INVOLVEMENT IN EMERGING MARKET INFRASTRUCTURE
Instrument Country Start year Description Examples
CORPORATE BONDS Used in many countries . Some examples:
Corporate bonds
Malaysia 1989 Bonds of corporations in the power, transport, water and telecommunications sectors.
Korea Bonds of corporations in the power, transport, water and telecommunications sectors.
Kenya Local pension funds invest in bonds of infrastructure companies. Tax concessions.
Kengon (electricity) and Safaricom (telecommunications).
Cape Verde Electricity bond
Uganda Bonds of telecommunications, and EADB
Mozambique Bonds of telecommunications
GOVERNMENT BONDS
Government bonds
Kenya 2009 Earmarked for infrastructure. Some tax concessions.
Senegal 2007 To finance road and rail transport infrastructure.
Ghana 2008 Eurobond on LSE. Earmarked for infrastructure financing.
SUB-SOVEREIGN BONDS
State bonds Nigeria 1986 Some states issue bonds for infrastructure investments.
Municipal bonds South Africa Municipal bonds. Some provinces issue bonds for infrastructure investments.
DIRECT EQUITY
Direct equity holdings “Canadian model”
CO-INVESTMENT EQUITY
Trust securities Mexico
Capital Development Certificates CKDs (Certificados de Capital de Desarrollo) are trust securities designed for the financing of one or more projects. CKDs can be used for investment in infrastructure, but also real estate and other private-equity projects. The principal of the CKD is protected by a debt instrument, whereas the income depends on the performance of the underlying project. These securities are quoted on listed exchanges.
Tlalnepantla Hospital Project Mexico. This was the first time Mexican pension funds invested in a Mexican PPP project from the outset, as opposed to at the beginning of operations. Mexican pension funds contributed to the equity of the project through an equity-structured note issued by Marhnos (the privately held developer). The project represents the first equity investments in a greenfield social infrastructure by pension funds using a CKD. IFC-supported public-private partnership project (IFC serving as financial advisor).
REITs Mexico 2008
Real Estate Investment Trusts FIBRAS are securities issued by trusts dedicated to investments in real estate and infrastructure. Pension funds can invest up to 10 percent in FIBRAS.
Appendix 4: Examples of Institutional Investor Involvement in Emerging Market Infrastructure (continued)
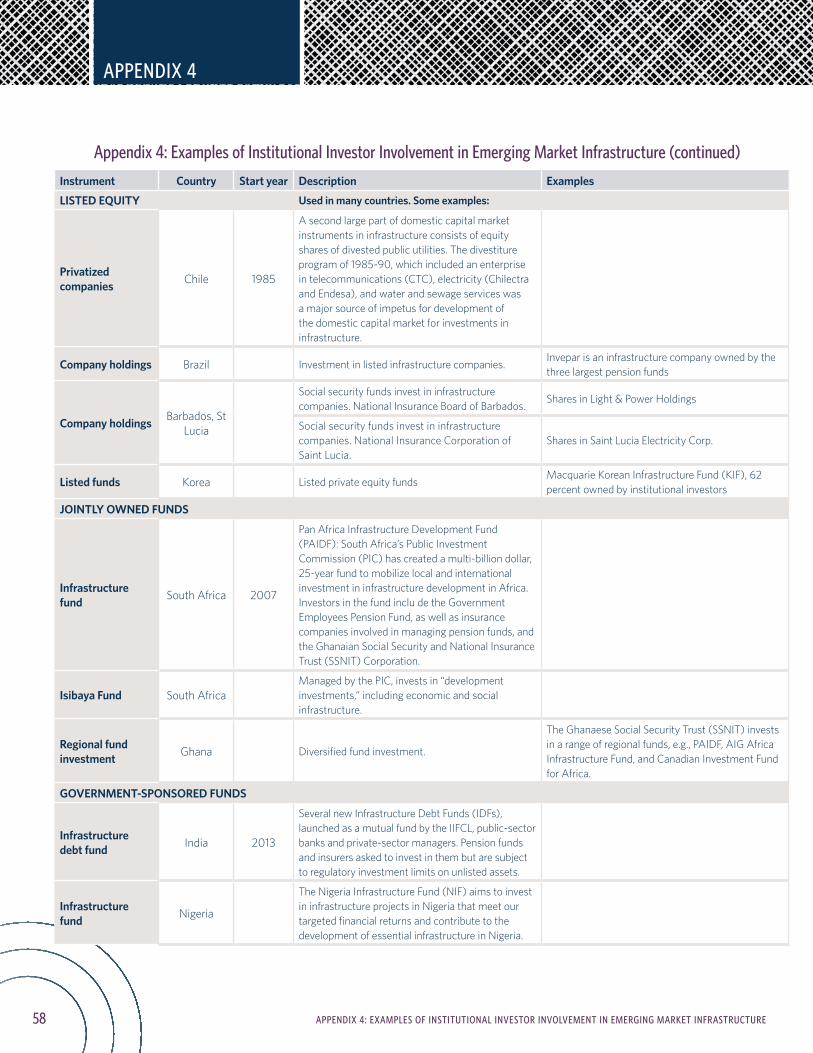
58 APPENDIX 4: EXAMPLES OF INSTITUTIONAL INVESTOR INVOLVEMENT IN EMERGING MARKET INFRASTRUCTURE
Instrument Country Start year Description Examples
LISTED EQUITY Used in many countries . Some examples:
Privatized companies Chile 1985
A second large part of domestic capital market instruments in infrastructure consists of equity shares of divested public utilities. The divestiture program of 1985-90, which included an enterprise in telecommunications (CTC), electricity (Chilectra and Endesa), and water and sewage services was a major source of impetus for development of the domestic capital market for investments in infrastructure.
Company holdings Brazil Investment in listed infrastructure companies.Invepar is an infrastructure company owned by the three largest pension funds
Company holdings Barbados, St Lucia
Social security funds invest in infrastructure companies. National Insurance Board of Barbados.
Shares in Light & Power Holdings
Social security funds invest in infrastructure companies. National Insurance Corporation of Saint Lucia.
Shares in Saint Lucia Electricity Corp.
Listed funds Korea Listed private equity fundsMacquarie Korean Infrastructure Fund (KIF), 62 percent owned by institutional investors
JOINTLY OWNED FUNDS
Infrastructure fund South Africa 2007
Pan Africa Infrastructure Development Fund (PAIDF): South Africa’s Public Investment Commission (PIC) has created a multi-billion dollar, 25-year fund to mobilize local and international investment in infrastructure development in Africa. Investors in the fund inclu de the Government Employees Pension Fund, as well as insurance companies involved in managing pension funds, and the Ghanaian Social Security and National Insurance Trust (SSNIT) Corporation.
Isibaya Fund South AfricaManaged by the PIC, invests in “development investments,” including economic and social infrastructure.
Regional fund investment Ghana Diversified fund investment.
The Ghanaese Social Security Trust (SSNIT) invests in a range of regional funds, e.g., PAIDF, AIG Africa Infrastructure Fund, and Canadian Investment Fund for Africa.
GOVERNMENT-SPONSORED FUNDS
Infrastructure debt fund India 2013
Several new Infrastructure Debt Funds (IDFs), launched as a mutual fund by the IIFCL, public-sector banks and private-sector managers. Pension funds and insurers asked to invest in them but are subject to regulatory investment limits on unlisted assets.
Infrastructure fund Nigeria
The Nigeria Infrastructure Fund (NIF) aims to invest in infrastructure projects in Nigeria that meet our targeted financial returns and contribute to the development of essential infrastructure in Nigeria.
APPENDIX 4
Appendix 4: Examples of Institutional Investor Involvement in Emerging Market Infrastructure (continued)
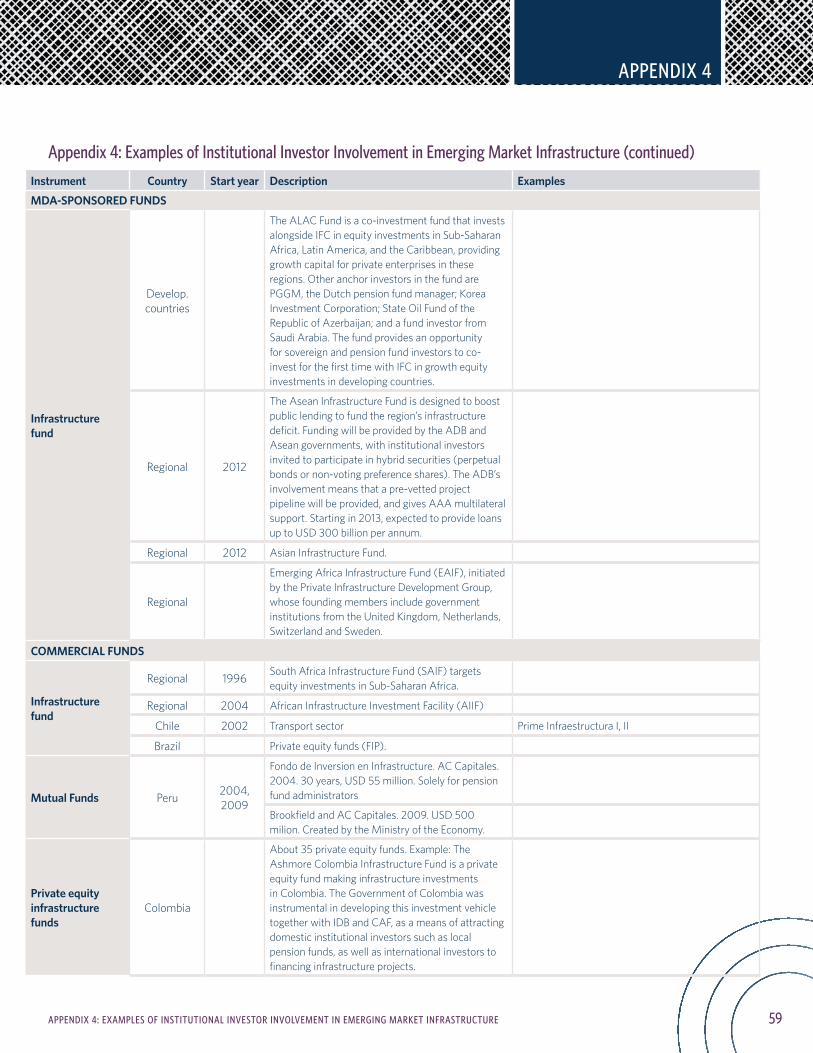
59APPENDIX 4: EXAMPLES OF INSTITUTIONAL INVESTOR INVOLVEMENT IN EMERGING MARKET INFRASTRUCTURE
Instrument Country Start year Description Examples
MDA-SPONSORED FUNDS
Infrastructure fund
Develop. countries
The ALAC Fund is a co-investment fund that invests alongside IFC in equity investments in Sub-Saharan Africa, Latin America, and the Caribbean, providing growth capital for private enterprises in these regions. Other anchor investors in the fund are PGGM, the Dutch pension fund manager; Korea Investment Corporation; State Oil Fund of the Republic of Azerbaijan; and a fund investor from Saudi Arabia. The fund provides an opportunity for sovereign and pension fund investors to co-invest for the first time with IFC in growth equity investments in developing countries.
Regional 2012
The Asean Infrastructure Fund is designed to boost public lending to fund the region’s infrastructure deficit. Funding will be provided by the ADB and Asean governments, with institutional investors invited to participate in hybrid securities (perpetual bonds or non-voting preference shares). The ADB’s involvement means that a pre-vetted project pipeline will be provided, and gives AAA multilateral support. Starting in 2013, expected to provide loans up to USD 300 billion per annum.
Regional 2012 Asian Infrastructure Fund.
Regional
Emerging Africa Infrastructure Fund (EAIF), initiated by the Private Infrastructure Development Group, whose founding members include government institutions from the United Kingdom, Netherlands, Switzerland and Sweden.
COMMERCIAL FUNDS
Infrastructure fund
Regional 1996 South Africa Infrastructure Fund (SAIF) targets equity investments in Sub-Saharan Africa.
Regional 2004 African Infrastructure Investment Facility (AIIF)
Chile 2002 Transport sector Prime Infraestructura I, II
Brazil Private equity funds (FIP).
Mutual Funds Peru 2004, 2009
Fondo de Inversion en Infrastructure. AC Capitales. 2004. 30 years, USD 55 million. Solely for pension fund administrators
Brookfield and AC Capitales. 2009. USD 500 milion. Created by the Ministry of the Economy.
Private equity infrastructure funds
Colombia
About 35 private equity funds. Example: The Ashmore Colombia Infrastructure Fund is a private equity fund making infrastructure investments in Colombia. The Government of Colombia was instrumental in developing this investment vehicle together with IDB and CAF, as a means of attracting domestic institutional investors such as local pension funds, as well as international investors to financing infrastructure projects.
APPENDIX 4
Appendix 4: Examples of Institutional Investor Involvement in Emerging Market Infrastructure (continued)
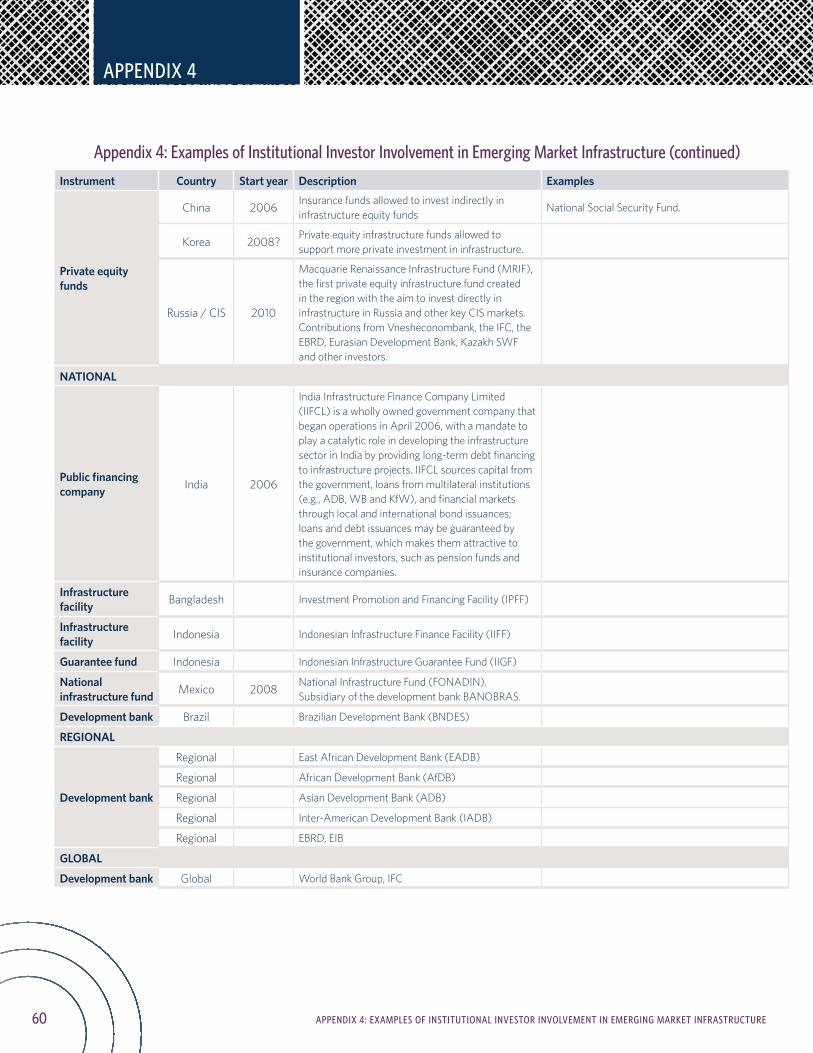
60 APPENDIX 4: EXAMPLES OF INSTITUTIONAL INVESTOR INVOLVEMENT IN EMERGING MARKET INFRASTRUCTURE
Instrument Country Start year Description Examples
Private equity funds
China 2006 Insurance funds allowed to invest indirectly in infrastructure equity funds
National Social Security Fund.
Korea 2008? Private equity infrastructure funds allowed to support more private investment in infrastructure.
Russia / CIS 2010
Macquarie Renaissance Infrastructure Fund (MRIF), the first private equity infrastructure fund created in the region with the aim to invest directly in infrastructure in Russia and other key CIS markets. Contributions from Vnesheconombank, the IFC, the EBRD, Eurasian Development Bank, Kazakh SWF and other investors.
NATIONAL
Public financing company India 2006
India Infrastructure Finance Company Limited (IIFCL) is a wholly owned government company that began operations in April 2006, with a mandate to play a catalytic role in developing the infrastructure sector in India by providing long-term debt financing to infrastructure projects. IIFCL sources capital from the government, loans from multilateral institutions (e.g., ADB, WB and KfW), and financial markets through local and international bond issuances; loans and debt issuances may be guaranteed by the government, which makes them attractive to institutional investors, such as pension funds and insurance companies.
Infrastructure facility Bangladesh Investment Promotion and Financing Facility (IPFF)
Infrastructure facility Indonesia Indonesian Infrastructure Finance Facility (IIFF)
Guarantee fund Indonesia Indonesian Infrastructure Guarantee Fund (IIGF)
National infrastructure fund Mexico 2008 National Infrastructure Fund (FONADIN).
Subsidiary of the development bank BANOBRAS.
Development bank Brazil Brazilian Development Bank (BNDES)
REGIONAL
Development bank
Regional East African Development Bank (EADB)
Regional African Development Bank (AfDB)
Regional Asian Development Bank (ADB)
Regional Inter-American Development Bank (IADB)
Regional EBRD, EIB
GLOBAL
Development bank Global World Bank Group, IFC
APPENDIX 4
Appendix 4: Examples of Institutional Investor Involvement in Emerging Market Infrastructure (continued)


ENABLING INFRASTRUCTURE INVESTMENT
PPIAF is a multi-donor trust fund that provides technical assistance to governments in developing countries to develop enabling environments and to facilitate private investment in infrastructure. Our aim is to build transformational partnerships to enable us to create a greater impact in achieving our goal.