institutional perspectives of land reclamation operations...
TRANSCRIPT
Working Paper& 28
- INSTITUTIONAL PERSPECTIVES OF
LAND RECLAMATION OPERATIONS IN P
A Case Study of the Lower Chenab Canal (East) Circle Area
-
D. J. Bandaragoda and
Saeed ur Rehman
INTERNATIONAL IRRIGATION MANAGEMENT INSTITUTE
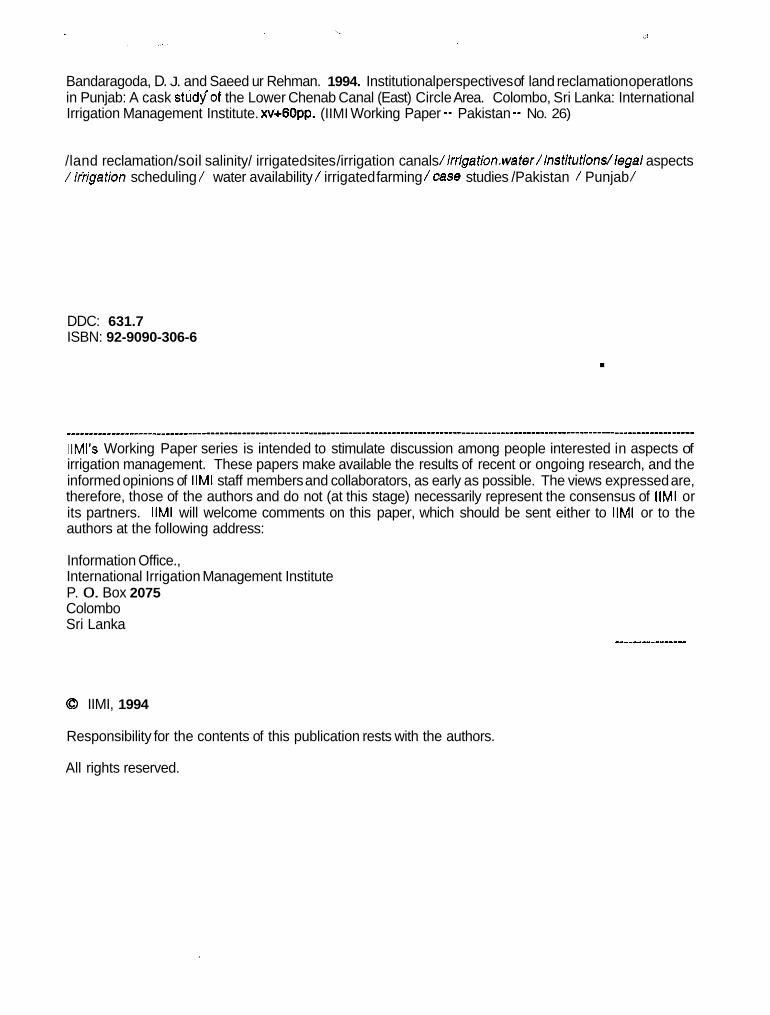
Bandaragoda, D. J. and Saeed ur Rehman. 1994. Institutional perspectives of land reclamation operatlons in Punjab: A cask studjof the Lower Chenab Canal (East) Circle Area. Colombo, Sri Lanka: International Irrigation Management Institute. xv&Opp. (IIMI Working Paper -- Pakistan -- No. 26)
/land reclamation /soil salinity/ irrigated sites /irrigation canals /irrigation.water/institutions/legal aspects / ifrigation scheduling / water availability / irrigated farming /case studies /Pakistan / Punjab /
DDC: 631.7 ISBN: 92-9090-306-6
.
IIMl’s Working Paper series is intended to stimulate discussion among people interested in aspects of irrigation management. These papers make available the results of recent or ongoing research, and the informed opinions of llMi staff members and collaborators, as early as possible. The views expressed are, therefore, those of the authors and do not (at this stage) necessarily represent the consensus of IlMl or its partners. IlMl will welcome comments on this paper, which should be sent either to IlMl or to the authors at the following address:
Information Office., International Irrigation Management Institute P. 0. Box 2075 Colombo Sri Lanka
0 IIMI, 1994
Responsibility for the contents of this publication rests with the authors.
All rights reserved.
Contents
Tables . . . . . . . . . . . . . . . . . . . . . . . . . . . . . . . . . . . . . . . . . . . . . . . . . . . . . . . . . . . . . v
Figures . . . . . . . . . . . . . . . . . . . . . . . . . . . . . . . . . . . . . . . . . . . . . . . . . . . . . . . . . . . . . vii
Acronyms . . . . . . . . . . . . . . . . . . . . . . . . . . . . . . . . . . . . . . . . . . . . . . . . . . . . . . . . . . . . . ix
Glossary . . . . . . . . . . . . . . . . . . . . . . . . . . . . . . . . . . . . . . . . . . . . . . . . . . . . . . . . . . . . . xi
Acknowledgements . . . . . . . . . . . . . . . . . . . . . . . . . . . . . . . . . . . . . . . . . . . . . . . . . . . . . . . . . xiii
Abstract . . . . . . . . . . . . . . . . . . . . . . . . . . . . . . . . . . . . . . . . . . . . . . . . . . . . . . . . . . . xv
1. INTRODUCTION . . . . . . . . . . . . . . . . . . . . . . . . . . . . . . . . . . . . . . . . . . . . . . . . . . . . . . . . . . 1
II. THESTUDY . . . . . . . . . . . . . . . . . . . . . . . . . . . . . . . . . . . . . . . . . . . . . . . . . . . . . . . . . . . . . 3 Rationale . . . . . . . . . . . . . . . . . . . . . . . . . . . . . . . . . . . . . . . . . . . . . . . . . . . . . . . . . . . . . 3 Objectives . . . . . . . . . . . . . . . . . . . . . . . . . . . . . . . . . . . . . . . . . . . . . . . . . . . . . . . . . . . . . 3 Methodology . . . . . . . . . . . . . . . . . . . . . . . . . . . . . . . . . . . . . . . . . . . . . . . . . . . . . . . . . . . . . 4
111. RESULTS AND DISCUSSION . . . . . . . . . . . . . . . . . . . . . . . . . . . . . . . . . . . . . . . . . . . . . . . . 9 Institutional Framework for Reclamation Operations . . . . . . . . . . . . . . . . . . . . . . . . . . . . . . . . . 9 Planning and Implementing Reclamation Schemes . . . . . . . . . . . . . . . . . . . . . . . . . . . . . . . . 13 Water Availability for Reclamation Supplies . . . . . . . . . . . . . . . . . . . . . . . . . . . . . . . . . . . . . . 23 Effects of Reclamation Supplies on Farming Practices . . . . . . . . . . . . . . . . . . . . . . . . . . . . . . 32
IV. CONCLUSIONS . . . . . . . . . . . . . . . . . . . . . . . . . . . . . . . . . . . . . . . . . . . . . . . . . . . . . . . . . 37
V. RECOMMENDATIONS . . . . . . . . . . . . . . . . . . . . . . . . . . . . . . . . . . . . . . . . . . . . . . . . . . . . 39
Bibliography . . . . . . . . . . . . . . . . . . . . . . . . . . . . . . . . . . . . . . . . . . . . . . . . . . . . . . . . . . . . 41
Appendix Irrigated Agriculture and Salinity in Punjab . . . . . . . . . . . . . . . . . . . . . . . . . . . . . . . . 43
Annex A : Location map of Lower Chenab Canal . . . . . . . . . . . . . . . . . . . . . . . . . . . . . . . . . . . 47 Annex 81: Statement of Land Reclamation Operations, Lower Chenab Canal
East Faisalabad for Kharif 1992 . . . . . . . . . . . . . . . . . . . . . . . . . . . . . . . . . . . . . . . 48 Annex 82: Statement of Land Reclamation Operations, Lower Chenab Canal
East Faisalabad for Kharif 1992 . . . . . . . . . . . . . . . . . . . . . . . . . . . . . . . . . . . . . . . 50 Annex 83: Statement of Land Reclamation Operations, Lower Chenab Canal
East Faisalabad for Kharif 1992 . . . . . . . . . . . . . . . . . . . . . . . . . . . . . . . . . . . . . . . 52 Annex C1: Organizational Chart of Directorate of Land Reclamation . . . . . . . . . . . . . . . . . . . . . . 53 Annex C2: Organizational Chart of LCC East Field Reclamation Division . . . . . . . . . . . . . . . . . . . 54 Annex D: Experimental Research Stations . . . . . . . . . . . . . . . . . . . . . . . . . . . . . . . . . . . . . . . 55 Annex E: Statement Showing Variation in Salinity
during the Yearsfrom 1944-45 to 1991-92 . . . . . . . . . . . . . . . . . . . . . . . . . . . . . . . 56 Annex F1: Classified Thur Statistics of Punjab (1982-92) . . . . . . . . . . . . . . . . . . . . . . . . . . . . . 57
iii
, ! I I I - i... :. ......... ~

Annex F2: Thur Statistics of LCC East Reclamation Division, Faisalabad . . . . . . . . . . . . . . . . . . 58 Annex G: A Typical "Tentative" Reclamation Program . . . . . . . . . . . . . . . . . . . . . . . . . . . . . . . . 59, Annex H: Reclamation Operations and Area Reclaimed in Punjab . . . . . . . . . . . . . . . . . . . . . . 60 " K
iv
Tables
Table 1 .
Table 2 .
Table 3 .
Table 4 .
Table 5A .
Table 58 .
Table 6 .
Table 7 .
Table 8 .
Table 9 .
Table 10 .
Table 11 .
Table 12 .
Salient Statistics of the LCC East Circle . . . . . . . . . . . . . . . . . . . . . . . . . . . . . . . . . 5
Reclamation supply. selected saline areas and rice areas during kharif 1992 . . . . . . . . . . . . . . . . . . 5
Information on sample watercourse commands and and reclamation shoots . . . . . . . . . . . . . . . . . . . . . . . . . . . . . . . . . . . . . . . . . . . . 7
Staffing positions in the DLR. LCC East Circle . . . . . . . . . . . . . . . . . . . . . . . . . . . . 11
Results of soil sample analysis for 1992 . . . . . . . . . . . . . . . . . . . . . . . . . . . . . . . . 14
Visual salinity according to the Survey of theDLRfor1992 . . . . . . . . . . . . . . . . . . . . . . . . . . . . . . . . . . . . . . . . . . . . . . . 15
Activities involved in the preparation of a Reclamation Scheme . . . . . . . . . . . . . . . . . . . . . . . . 20
Reclamation activities in LCC East Circle (1985-86 to 1991-92) . . . . . . . . . . . . . . . . . . . . . . . . . . . . . . . . . . . . . . . . . . . . 21
Operational details of the Reclamation Program of LCC East Circle-kharif 1992 . . . . . . . . . . . . . . . . . . . . . . . . . . . . . . . . . . . . . 22
Design head gauge versus observed head gauge of sample channels . . . . . . . . . . . . . . . . . . . . . . . . . . . . . . . . . . . . . . . . . . . . . 26
Details of reclamation shoots under observation . . . . . . . . . . . . . . . . . . . . . . . . . . 32
Cropping patterns observed in the study area . . . . . . . . . . . . . . . . . . . . . . . . . . . . 34
Farmers’ perception of groundwater quality in reclamation command areas during kharif 1992 . . . . . . . . . . . . . . . . . . . . . . . 36
Figures
Figure 1.
Figure 2.
Figure 3.
Figure 4.
Figure 5.
Figure 6A.
Figure 6B
Figure 7.
Figure 8.
Figure 9.
Figure 10.
Figure 11.
Figure 12.
Figure 13.
Irrigated area of Punjab suweyed for Salinity by Canal Patwaris . . : . . . , . . . . . . . . . . . , . . , . , , . . . . . ,
Salinity in irrigated areas of Punjab from 1968 to 1992 . . . . . . . . . . . . . . . , . ,
. 16
. . . . . . _ . . . 17
Affected area as percent of area surveyed from 1968 to 1992 (DLR data) . . . . . . . . . . . . . . . . . . . . . . . . . . . . . . . . . . . . , . . . . 17
Distribution of classified Thur in Punjab (1982-92) . . . . . . . . . . . . , . . . . . . . . . . . , 18
Area treated and reclaimed, from 1968 to 1991 in Punjab . . . . . . . . . . . . . . . . . . . . . . . . . . . . . . . . . . . . . . . . . _ 24
Canal Supply Allocated for reclamation from 1968 to 1991 in Punjab . . . . . . . . . . . . . . . . . . . . . . . . , . . . . . . . . . . . . . . . . . 25
Irrigation Water for reclamation in terms of RWS in Punjab (1968 to 1991) . . . . . . . . . . . . . . . . . . . _ . . . _ 26
Monthly average readings of gauge at head and tail, . . Lagar Distributary . . . . . . . . . . . . . . . . . . . . . . . . . . . . . . . . . . . . . . . , . . . . . . . 27
Monthly average readings of gauge at head and tail, Mananwala Distributary. . . . . . . . . . . . . . . . . . . . . . . . . . . . . . . . . . . . . . . . . . . 28
Monthly average readings of gauge at head and tail, Karkan Minor . . . . . . . . . . . . . . . . . . . . . . . . . . . . . . . . . . . . . . . . . . . . . . . . . . 28
Monthly average readings of gauge at head and tail, Yakkar Distributary . . . . . . . . . . . . . . . . . . . . . . . . . _ . . 29
Monthly average readings of gauge at head and tail, Bhun Distributary . . . . . . . . . . . . . . . . . . . . . . . . . . . . . . . . . . . . . . . . . . . . . . . 29
Monthly average readings of gauge at head and tail, Rajana Distributary . . . . . . . . . . . . . . . . . . . . . . . . . . . . . . . . . . . . . . . . . . . . . . 30
Monthly average flows at head and tail, Kot Pathana Minor . . . . . . . . . . . . . . . . . . . . . . . . . . . . . . . . . , . . . . , . . . . . . . 30
vii
Acronyms
ALRO
AVC
CCA
DLR
HVC
ID
LCC
LRO
PID
RWS
SCARP I1
SDC
SDO
SE
vc
WAPDA
XEN
Assistant Land Reclamation Officer
Assistant Vernacular Clerk
Culturable command area
Directorate of Land Reclamation; also Director of Land Reclamation
Head Vernacular Clerk
Irrigation Department
Lower Chenab Canal
Land Reclamation Officer
Punjab Irrigation and Power Department (World Bank uses this term to mean Provincial Irrigation Department)
Relative Water Supply
Salinity Control and Reclamation Project II
Sub-Divisional Clerk
Sub-Divisional Officer
Superintending Engineer
Vernacular Clerk
Water and Power Development Authority
Executive Engineer
ix
Chowkidar
Kacha
Khasra Sadmazada
Munshi
Pacca
Partals
Patwari
Sem
Twan
Thur
Thur Nau
Thur Kohna
Thur Punjsala
Thur Girdawari
Thur Juzvi
Thur Tirk
Tirk
Zilladar
Glossary
Literally a watchman, a very versatile village official with multifarious functions - in charge of security, reporter of births and deaths, escort to visiting government or other functionaries, town crier, irrigation schedule keeper, helper in revenue collection.
Provisional
Proforma for recording details on salt-affected land
Clerk
Permanent
Scrutiny of record, or field investigation
Revenue official at the field level, keeper of revenue record, surveyor of crops, crop damages, salinity-affected land, etc.
Waterlogged soil condition
Fine
Salinity
",
Recent salinity
Old salinity
Saline patch/parcel known to be such for the past five years or so
Visual salinity survey
Partial salinity
Sodic saline land showing cracks
Incomplete opening of cotton bolls. When used in connection with salinity, it refers to such saline/sodic land where cotton bolls do not open normally or open prematurely or incompletely.
Junior member of Supervisoly staff of revenue establishment of Irrigation Department, supervising a number of Patwar circles.
xi
Acknowledgements
THE AUTHORS WOULD like to gratefully acknowledge the cooperation and support of the Punjab Irrigation Department, particularly the assistance given by the Director of Land Reclamation, Ch. Karamat Ali, and his staff. The authors specially thank the Land Reclamation Officer, LCC East Circle, Mr. Muhammad Saleem. and his office and field staff for the assistance provided in the field work. The authors gratefully acknowledge the valuable advice and support given by Professor Gaylord V. Skogerboe, Director, IIMI- Pakistan, and Dr. Jacob W. Kijne, Director for Research, IIMI. The authors are indebted to them for the valuable time they spent in reviewing this paper.
Dr. M. Akhtar Bhatti, former Principal irrigation Engineer of IIMI-Pakistan. was a co-author of an earlier draft of this paper. He participated in this study during its initial stages and in the preliminary analysis of data for the first draft. This study would not have been possible without the untiring support and contributions made by IIMI-Pakistan field staff of Farooqabad, Mananwala and Kamalia. Mr. Samee Ullah and Mr. Muhammad Riaz-ud-Din (Computer Data Entry Specialists) and Mr. Muhammad Akram Khan (Secretaty/Administrative Assistant) of IIMI-Pakistan provided valuable support services. The authors thank them all. The authors are also grateful to Mr. Nimal A. Fernando for his valuable editorial comments.
D.J. Bandaragoda Saeed ur Aehman IlMl Lahore, Pakistan
xiii
Abstract
THE DIRECTORATE OF Land Reclamation (DLR), which was set up in 1945, is a special unit of Punjab's Irrigation and Power Department for undertaking research and field operations to combat the problem of salinity. Approaching the end of five decades of existence, the Directorate is yet to demonstrate its effectiveness in its assigned task; its inability to fully cope with the conditions of a fast changing irrigation environment makes this rather an illusive goal.
In the selection of lands for reclamation, the Directorate is heavily dependent on the visual salinity survey (Thur Girdawarr) carried out every year by the Irrigation Department's field staff. This visual survey appears to be a quick and cost-effective method of assessing surface salinity, but its exclusive use as the criterion for selection of affected land is a questionable approach. According to original departmental procedure, reclamation activities were confined to only two of the five classes of soil identified by the visual salinity survey, but the current practice of including all the types of salt-affected soils in reclamation operations has made the selection process more subjective. Surprisingly, the DLR is not using its existing laboratory facilities optimally to better identify the salt-affected lands. Soil testing in visually identified lands could also help define the reclamation operations more scientifically in addition to improving the selection methods being used.
While formal procedure requires the Directorate to communicate to farmers the details of planned reclamation schemes, farmer awareness of the reclamation program seems to be poor and only a few farmers in the study area readily acknowledge agency assistance in obtaining relevant information. In practice, the proposals for reclamation schemes are often initiated by some influential farmers.
It is a requirement that the amount of water made available for reclamation be over and above the design supply of a given distributary, and special reclamation outlets can be given from a distributary only on the basis that its tail will not suffer. However, the study shows no evidence to show that extra water was made available during the operation of reclamation outlets; further. tail-end shortages were observed in all the distributaries under the study.
In a context where the tendency is to give scant consideration to irrigation rules and procedures, it is unlikely that the Directorate of Land Reclamation in its present form and status will succeed in implementing an extensive program of reclamation operations. For the Directorakto be effective in its legitimate functions and to make it an operationally viable and socially acceptable organizational unit, adequate policy and institutional support seem to be necessary.
xv
1. Introduction
THE PAPER PRESENTS the results of an institutional study by the International Irrigation Management Institute (IIMI) that focused on land reclamation operations conducted by the Directorate of Land Reclamation (DLR) of Punjabs Irrigation and Power Department. The study was carried out in collaboration with the Directorate, .to evaluate the on-going reclamation procedures, processes, practices and their impact in reclaiming saline lands. Most of the of study field work was conducted during the 1992 kharifseason, but the review of literature and interviews with agency personnel continued until June 1993. The study was limited to selected areas in the Lower Chenab Canal (LCC) East Circle in Punjab.
The DLR's reclamation techniques for saline areas include the process of providing additional canal supplies for leaching by installing extra pipe outlets, and some prescribed farming practices. These supplies are additional in the sense that they are over and above the normal supplies committed for irrigation. Such supplies for reclamation could only be made available during summer when the required water is available in the rivers. According to the DLR practices, the extra water supplies are provided at the rate of one cusec (28.32 I/s) for 45 acres (18.2 ha) in perennial canal commands if the water table is below 10 feet depth, and at half this rate if the water table is from 5 to 10 feet (1.5-3.0 m) in depth. For non-perennial canal commands, the normal rate is one cusec (28.32 I/s) for 60 acres (24.3 ha). A reclamation scheme may contain a "compact block" owned by one farmer, or "scattered plots" sewed by a common watercourse. The reclamation supply, which is made available during the kharif season by installing extra pipe outlets and which is continued for a period of three years, is popularly referred to as "reclamation shoots."
This work by the DLR involves complex social issues in the selection of salinity-affected land, in deciding the quantum of additional water supplies, in the modification of existing water distribution schedules, and in monitoring the application of additional supplies. Given the complexity of the work and the high degree of cooperation needed between water users and agency staff, IIMl's study focused on the institutional dimension of reclamation operations.
The main findings of the study indicate that the Directorate, which was originally started with a clear mandate and with great expectations, has declined in status and objective-orientation. The reasons for this decline are attributable to several institutional factors, foremost among which is its inability to deal with growing indiscipline in the irrigation environment. Another major factor is the DLR's isolation from other related research and extension activities in the irrigated agriculture sector, and even from the main stream of activities within its own parent organization, the Punjab Irrigation and Power Department.
The background to the problem of salinity in Punjab and to the institutional arrangements made to cope with this problem is given in an appendix to this paper. In Section II, is a description of the study including study objectives and the methodology employed. The results of the study and a discussion thereon are presented in Section 111, and the conclusions and recommendations are in Sections IV and V, respectively.
1
II. The Study
RATIONALE
IN 1989, THE International Irrigation Management Institute (IIMI) initiated a,fiie-year research project in Pakistan, "Managing Irrigation Systems to Mitigate Waterlogging and Salinity Problems." In the first phase of this research project, a diagnosis of the problem was carried out to study its scope and main features. IIMl's studies confirmed the existence of a disturbing pattern of increased salinity-related problems in Punjab's irrigated agriculture as location varies within both distributary canal and watercourse commands. The source of salt that accumulates in the crop root zone was found to be the poor quality tubewell water used in increasing quantities by fanners for irrigation. In the first phase of this on-going research activity, Vander Velde and Kijne (1992:17) found:
Serious and persistent inequity in the distribution of high quality canal water within distributarycommands, often mirrored at the watercourse level, has meant that farmers in middle- and tail-reach locations increasingly depend on pumped groundwater to meet the bulk of their crop water requirements. For reasons that are not yet well understood, the quality of groundwater pumped by tubewells generally decreases between head and tail within distributary canal commands. Thus, farmers in tail-end locations face a double handicap: they receive much less than their fair share of canal water compared to farmers upstream, and the groundwater supply they therefore must fall back upon is of poorer quality than elsewhere.
This research effort is expected to feed into a series of management interventions. Several such management interventions that would address the water and salt balance issues and seek to improve irrigation performance in general were considered at a retreat seminar held by IlMl in October 1991 (Kijne and Levine 1991). At this seminar, a number of senior officials of the Punjab Irrigation Department (PID) and the Water and Power Development Authority (WAPDA) participated. One of the proposed management interventions was the promotion of salinity mitigation through leaching, which was designed to improve farmer understanding of leaching for salinity control, and to introduce a more systematic approach for redirection of water at the farm level. Since part of the activities of the Directorate of Land Reclamation (DLR) would have direct links with this management intervention, IlMl launched an institutional study of the reclamation activities carried out by the DLR, as part of IIMl's larger program of work.
OBJECTIVES
The overall objective of the study was to understand and document the organizational and operational issues and constraints related to reclamation activities conducted by the Directorate of Land Reclamation
3
(DLR), and to identify the poiential for realizing the fullest benefits from the additional irrigation supplies sanctioned for the reclamation of saline soils in irrigated areas of the Punjab. The study was also expected to help define management interventions which could be undertaken to address the problems of emerging secondary soil salinization. The specific objectives of the study were:
To review the organizational arrangements in the DLR and the legal and procedural support to its operations.
To understand how the "reclamation shoots" (reclamation water supplies) are sanctioned, installed and operated, and to document these processes.
To examine the relationship between reclamation shoots and the availability of irrigation water supplies in the system.
To study the effect of additional water supplies for reclamation on farmers' irrigation and farming practices, including the existing cropping patterns and warabandi (fixed turns).
METHODOLOGY
The methodology employed in this study was to observe and monitor, in the field, the prevailing actual processes and practices of land reclamation, in addition to the collection of theoretical and performance- related information from a review of various reports and research papers. Primary data collection methods also included interviews of beneficiaries and agency personnel.
The land reclamation program is administered on the basis of Canal Irrigation Circles. For monitoring activities of this study, the Lower Chenab Canal (LCC) East Circle was selected, considering its importance in terms of the DLR's normal reclamation operations. Recognizing that the LCC is one of the largest and most complex of the 43 major canal irrigation systems in Pakistan's lndus Basin, the sites of IIMl's other studies have also been located in this canal command. It was therefore possible to make primary data collection more efficient by drawing from IIMl's own field teams located in the area. The selection of this area for the present study will also enable possible integration of its results into IIMl's overall research program in the Punjab. The LCC System is offlaking from the Khanki headworks on the Chenab River. The location map of the LCC system is shown in Annex A.
Additional water supplies through reclamation shoots were provided to 55 distributary canals within the Land Reclamation Division, LCC East Circle, for kharif 1992. The reclamation supplies were sanctioned for 163 outlet commands, but the pipe outlets were not fixed on 6 watercourses because farmers refused to avail themselves of this facility, and the reclamation operations were carried out oniy within 157 watercourse commands. The details are in the Statements of Land Reclamation Operations prepared by the DLR (Annexes B1 to B3).
Study sites were selected from a multi-stage sample, with the main canal system as the primary, distributaries as the secondaty, and the list of operational or recently terminated reclamation shoots as the final sampling frame, In the upper and lower reaches of the Gugera System, altogether 10 distributary commands (18 percent of the total number in the LCC East Circle) were selected from the area falling within the official jurisdiction of the Land Reclamation Officer (LRO), LCC East Circle.
For the monitoring of the DLR's reclamation activities, distributaly commands were selected from the head, middle and tail reaches of the LCC system. They were located within three divisions in the Upper
4
Gugera, Lower Gugera and Burala Branch Canal systems of the LCC East Circle (at RD 282, the Upper Gugera Branch bifurcates into the Burala and the Lower Gugera Branches). Basic data for these three divisions are summarized in Tables 1 and 2.
Table 1. Salient statistics of the LCC East Circle
Name of division
Upper Gugera
Lower Gugera
Burala
Total
Length of Discharge No. of channel/ of channel outlets
canal (cusecs) (miles)
435 1,653 1,050
429 1,834 989
408 1,542 947
1,271 1 4,029 1 3,006
Gross Cultivable Annual command command irrigated
area area area (acres) (acres) (acres)
701,133 576,233 763,612
621,524 521,064 696,677
588,220 510,638 704,723
1,910,877 1,607,935 2,165,012
Note: Source: Bandaragoda and Firdousi 1992:73.
1 acre = 0.4047 hectare; 1 mile = 1.61 km; 1 cusec = 28.32 I/s.
Table 2. Reclamation supply, selected saline areas and rice areas during kharif 1992.
Irrigation division Reclamation supply Selected saline area Area under rice (cusecs) (acres) (acres)
Upper Gugera 48.86 2824 1944
Lower Gugera 75.96 3447 1469
Burala 38.40 2049 1048
4461- ~ - 1 - __ Total 163.22 7780
Note: Source: LRO Oflice, LCC East Circle, Faisalabad.
1 acre = 0.4047 hectare: 1 cusec = 28.32 Ils.
5
The Farooqabad Subqvision of the Upper Gugera Division comprises the service area of seven distributaries in the head reach of Upper Gugera Branch; of these, the Mananwala and Lagar distributaries, and the Karkan Minor were the focus of detailed monitoring and assessment during kharif 1992. Observations of reclamation activities were carried out in 3 of the 6 distributaries in the Bhagat Subdivision of the Lower Gugera Division, and observations were also conducted in 4 distribuataries of the Kanyan and Sultan Pur Subdivisions of the Burala Branch. The finally selected sample comprised 20 watercourses (13 percent of the total number of outlets identified for reclamation operations by the DLR in the LCC East Circle). The sample covered head, middle and tail reaches of each selected distributary. Details of the sample of watercourse commands are listed in Table 3.
The reclamation activities in the sample area were monitored from July to October 1992 through field observations, water measurements and farmer interviews. Planned study work could not be fully undertaken in the Burala Division. Of the 4 distributary commands in the Burala Division, discharge measurements were undertaken only on the Kot Pathana Minor whereas data were collected on the remaining sample sites to understand the approval process toward securing sanctioned reclamation shoots. Farmers in the two distributaries -- Kamalia and Waghi of the Burala Branch --were not willing to proceed with reclamation shoots as the procedural delays in the sanctioning process during the previous year had significantly delayed the intended rice cultivation. For them, the prospects of a repetition of the unwanted delays was too discomforting. At the Kanyan Distributary of the Burala Branch, the issue of reclamation shoots was still more contentious as the tail enders, already suffering due to scarcity of water, had since last year obtained stay orders from the court against the granting of reclamation shoots upstream.
6
EU-KA 7289-L
EU-WA 5940-R
BU-WA 5950-L
EU-KM 8218-L
EU-KP 8920-L
BU =Eurala UG = Upper Gugera LG = Lower Gugera KA =Kanyan LA = Lagar YA = Yakkar
MA = Mananwala EH = Ehun WA =Waghi KN = Karkan RA = Rajana KM =Kamalia KP = Kot Pamana CCA=Culturabie command area in acres GCA = Gross command area in acres
Head 438 371 0.99 1.01 48.14 1991-93
105 539 2.00 1.66 14.77 1991 -93 Head
461 350 1.33 1.43 64.31 1991-93 Head
Head 569 427 1.53 2.00 90.00 1991-93
490 366 1.39 2.00 90.00 1991-93 Middle
CANALWISE DlSTRlBUTil
I Upper Gugera Lower Gugera
Lagar Distributary 1052-R 17541-R 16330-L 24200-R 26475-L
Eurala
Mananwaia Distributary 49985-R 82600-R
Karkan Minor 27062-L 31605-L 34875-L
3cre = 0.41347 h ectare.
Yakkar Distributary 10229-R
Ehun Distributary 5150-L 10164-L
Rajana Distributary 11 900-L 13753-L
Kanyan Distributary 7289-L
Waghi Distributary 594043 5950-L
Kamalia Distributary 8218-L
Kot Palhana Minor 8920-L
7
111. Results and Discussion
RESULTS OF THE literature review, the interviews with agency personnel and farmers, and the field observations are presented in this section of the paper. The results and the discussions thereon are arranged in terms of specific study objectives mentioned in Section I I above, and are presented under four headings:
* * * *
Institutional Framework for Reclamation Operations Planning and Implementing Reclamation Schemes Water Availability for Reclamation Supplies Effect of Reclamation Supplies on Farming Practices
INSTITUTIONAL FRAMEWORK FOR RECLAMATION OPERATIONS
A review of various documents on the subject indicated that, historically, institutional development associated with reclamation of salinity affected lands in the Punjab had run parallel to a growing awareness of irrigation-related environmental problems. As far back as 1927, the Punjab authorities came to learn of the problem of soil salinity in upper regions of the Rechna Doab where the water table was very high, almost at the surface in some places. To assess the extent of land affected, the Waterlogging Enquiry Committee started a salinity survey (Thur Girdawar!) in the area. Initially, the survey was confined to areas with the water table within five feet (1.52 m) from the surface, but by 1937, as further investigations were carried out, salinity was found to be present even in areas where the water table was deeper. With this realization, in 1943, the salinity survey was extended to cover the entire irrigated area in Punjab, and the work was entrusted to the Irrigation Department. As the concern became greater, in 1945, the Directorate of Land Reclamation (DLR) was formed as a separate unit within the Irrigation Department to exclusively undertake salinity surveys and related research work and remedial measures.
Legal Base for the DLR's Work
Study investigations based on official documents and staff interviews did not reach any clear position regarding an exclusive legal framework which is operative for the DLR's current work. In the absence of a separate law for the creation or the functioning of the DLR, it was generally acknowledged that the main source of authority for the DLR's work emanated from the Canal and Drainage Act of 1873, a law which had been operative from the inception of institutionalized irrigation in the Punjab. Authority for most of the water-related interventions for the DLR's reclamation operations derives from Section 68 of the 1873 Act.
9
Nasir (1981:131) reckons Section 68 as the most important part of the Act as it deals with the authority of the Canal Officers over water distribution problems. Provisions of this section of the Act can therefore be exercised by the Assistant Land Reclamation Officers of the DLR within their respective areas of jurisdiction, but in respect of additional reclamation supplies only.
Rules for the remodelling of channels and outlets required for the distribution of reclamation supplies, the methods of distribution of reclamation supplies and selection of salinity-affected areas of outlets, the instructions on the survey of salinity-affected areas and waterlogged areas, and the process of reclamation of salinity-affected lands are specifically provided as subsidiary laws (Nasir, 1981: Annexures 111, V and VII).
Aiming at the speedy reclamation and improvement of the areas affected by waterlogging and salinity, the Punjab Soil Reclamation Act was passed in 1952. Under this Act, a Soil Reclamation Board was constituted with the Chief Engineer, Irrigation of the Province as its Chairman: the Director, Land Reclamation as a member and Technical Advisor; and Superintending Engineer, Drainage, as a member. The Board was charged with the responsibility for the planning and implementing of reclamation projects by providing adequate additional water supplies through tubewells and canals in the province. This was later renamed the Punjab Land and Water Development Board, which was, in turn, dissolved with effect from 31 January 1973; its functions were merged with the Irrigation and Power Department and the Secretary, Irrigation and Power Department was appointed the Administrator under Section 79 of the Act of 1952. However, since both the Acts are operative now, Nasir (1981: 151) suggests that for speedy action, Section 17 of the Punjab Soil Reclamation Act of 1952 should be preferable to Sections 20 and 68 of the Canal and Drainage Act of 1873.
Structure of the DLR
Administratively, as a part of the Irrigation Research Zone of the Punjab's Irrigation and Power Department, the DLR is headed by a Director, having the status of a Superintending Engineer, who functions under the overall guidance of the Chief Engineer (Research) and the Secretary of the Irrigation and Power Department. The DLR consists of a research laboratory at Lahore, nine experimental research stations located in different parts of the province to monitor different soil and climatic conditions, and seven field Land Reclamation Divisions covering almost all of the canal command areas of the Punjab. The organizational structure of the DLR is given in Annex C1. The organizational structure of the LCC East Circle Field Reclamation Division is given in Annex C2 and its staffing positions are detailed in Table 4. These reflect the scope of the DLR's reclamation activities in a field unit, which forms the focus of this study.
Embodied in the PIDs static organizational structure, the DLR finds itself isolated from other agencies and institutes working in irrigated agriculture. lntelviews with the DLR staff and the PID field staff showed that the DLR's interactions are limited to the PID, and to the process of obtaining extra canal supplies. There was no evidence that the DLR was consulting any agency or groups of personnel involved in agricultural extension or adaptive research in the field. Similarly, there was no indication that the DLR was seeking to approach farmers in established groups, or farmer organizations, or that it was collaborating with any other agency for this purpose.
10
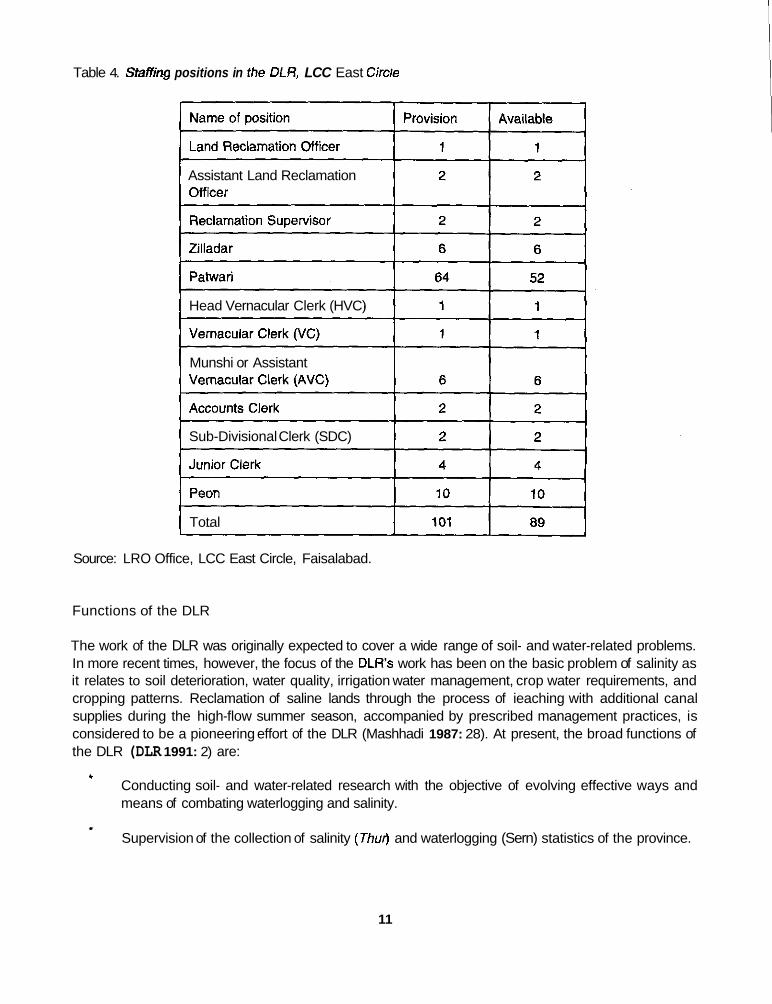
Table 4. Sfaffing positions in the DLR, LCC East Circle
Assistant Land Reclamation
Head Vernacular Clerk (HVC)
Munshi or Assistant
Sub-Divisional Clerk (SDC)
Total
Source: LRO Office, LCC East Circle, Faisalabad.
Functions of the DLR
The work of the DLR was originally expected to cover a wide range of soil- and water-related problems. In more recent times, however, the focus of the DLR’s work has been on the basic problem of salinity as it relates to soil deterioration, water quality, irrigation water management, crop water requirements, and cropping patterns. Reclamation of saline lands through the process of ieaching with additional canal supplies during the high-flow summer season, accompanied by prescribed management practices, is considered to be a pioneering effort of the DLR (Mashhadi 1987: 28). At present, the broad functions of the DLR (DLR 1991: 2) are:
* Conducting soil- and water-related research with the objective of evolving effective ways and means of combating waterlogging and salinity.
Supervision of the collection of salinity (Thur) and waterlogging (Sern) statistics of the province. *
11
* Planning, organizing and exercising technical control of reclamation operations on farmer's fields in coordination with local Canal Circles.
Research connected with saline and waterlogged soils is carried out at the research laboratory located in Lahore and at field experimental stations. The laboratory facility in Lahore, for which a two-acre block of land is available adjacent to the office building, has two segments -- Soil Section and Chemical Section -- to analyze soil and water samples for conducting small-scale experimental studies. Larger-scale studies are undertaken in the nine field experimental stations located in different areas representing the major agro- climatic zones of the province. Some details of these experimental stations are given in Annex D.
The Soil Section, headed by a research officer and with a number of research assistants, is assigned the following work:
*
*
*
The Chemical Section, operated by the Physical Chemist and his research staff, works on basic
Applied research on soil and water in the laboratory as well as on experimental fields.
Analytical work on soil and water samples.
Soil survey and land classification.
Monitoring studies of Salinity Control and Reclamation Project I I (SCARP 11).
problems relating to soil, water and plant relationships, and is assigned the following work
*
*
Reclamation of saline, saline sodic, and sodic soils by chemical and biological methods.
Assessment of the effects of toxic elements on crops and soils.
The DLR is expected to play a supervisoly role in conducting salinity surveys. This responsibility apart, it is in the DLR's own interest to have reliable salinity data as the reclamation operations are normally based on these salinity appraisals for which the DLR depends on the Irrigation Department field staff. The process of conducting a salinity suwey is described below.
For the reclamation of partially affected lands, and those which have gone out of cultivation recently, a reclamation program is drawn up by the land reclamation staff functioning under the administrative control of Superintending Engineers of Irrigation Canal Circles. Technical guidance is provided by the DLR. The land reclamation staff assigned for this purpose include Land Reclamation Officers, Assistant Land Reclamation Officers, Reclamation Supervisors, Reclamation Zilladars and Reclamation Patwaris, who are jointly responsible for preparing reclamation schemes and arranging for the distribution of the water supply among the cultivators. The physical work involved in the leaching of land is carried out by the respective cultivators of the affected lands. I
I
~ I- ---
12
PLANNING AND IMPLEMENTING RECLAMATION SCHEMES
Salinity Survey - The Basis for Reclamation Schemes
In visual salinity sulveys (Thur Girdawari), the Canal Patwaris in the Irrigation Department make visual appraisals of soil szlinity in the canal command areas. Since salinity (Thur) is generally visible during winter months, Thur Girdawari is carried out during the months of December, January and February. Canal Patwaris are required t:, survey the entire area within the canal irrigation boundary, and make entries in the Khasra Sadmazada (proforma for salt-affected lands) before the end of February. During the month of March, Patwaris have to prepare abstracts of Thur areas by class, by outlet,' by village and by distributary. The Divisional Office records this information in "Thur Abstract Registers," and the information is sent to the DLR office to maintain up-to-date information regarding areas affected by Thur and Sem (waterlogging).
Thur is classified into three main types by the DLR (Consolidated Instructions for Recording of Thur and Sem Girdawari, Ref. No. 134-140/16W, dated 19.11.60, issued by Land Reclamation Officer -- Thur and Sem Statistics):
1. Uncultivated Thur (Thur KohnaJ is Thur never broken, meaning a saline area which has never Seen cultivated since the advent of canal irrigation according to recorded evidence,
Formerly Cultivated Thur comprises all areas which have been under cultivation since the advent of canal irrigation but has gone out of cultivation later on account of Thur. It is divided into two subclasses Thur Punjsala and Thur Nau.
Thur Punjsah is land which has been under the plough but has become uncuitivable, owing to the effect of Thur, more than 5 years before the Thur Girdawari.
Thur Nau is land which has been under the plough but has become uncultivable owing to the effect of Thur, within the 5 years before the Thur Girdawari.
Cultivated Thur comprises land which is under cultivation but affected with salts. It is divided into two subclasses, Thur Juzvi and Thur Tirk.
Thur Juzvi is a visually Thur-affected area in which Thur exists in 20 percent or more of the area, but it is still under cultivation. The area recorded under any other kind of Thurwill be excluded for determining the 20 percent limit.
Thur Tirk is land in which Thur is not visible but cotton is affected by Tirk (incomplete opening of bolls); it is recorded if the water rate and land revenue have been remitted for this reason.
Thur Girdawari, the visual soil salinity survey conducted annually by the Canal Patwaris, appears to be a quick and cost-effective method for a preliminary inventory of salt-affected lands. However, to rely on its use as the only criterion in selecting lands for reclamation operations is questionable. For instance, when IlMl carried out a soil sampling exercise in the upper and lower reaches of the Gugera Irrigation System, the results showed that more accurate information on soil salinity would tend to counter the validity of the DLR's existing land selection procedure. For the IlMl study, the Mananwala Distributary at the head and Junejwaia Minor of Pirmahal Distributary at the tail of the system were selected. The selection of sites in
2.
3.
13
I I
Degree of salinizalion
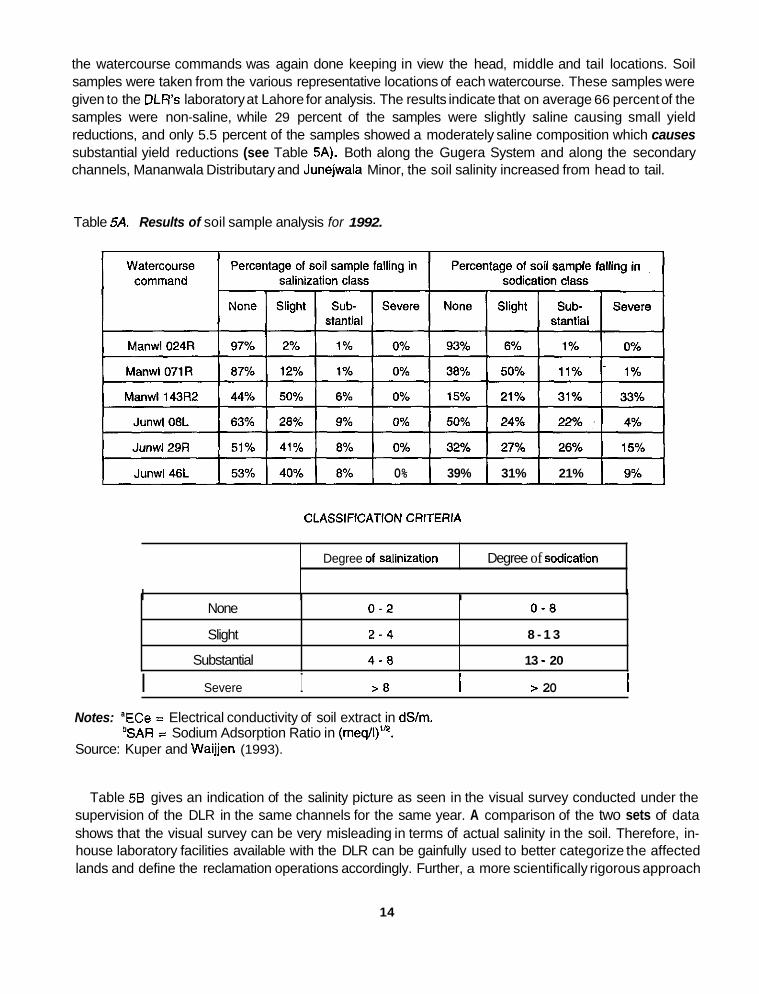
the watercourse commands was again done keeping in view the head, middle and tail locations. Soil samples were taken from the various representative locations of each watercourse. These samples were given to the DLR's laboratory at Lahore for analysis. The results indicate that on average 66 percent of the samples were non-saline, while 29 percent of the samples were slightly saline causing small yield reductions, and only 5.5 percent of the samples showed a moderately saline composition which causes substantial yield reductions (see Table 5A). Both along the Gugera System and along the secondary channels, Mananwala Distributary and Junejwala Minor, the soil salinity increased from head to tail.
Degree of sodicalion
Table 5A. Results of soil sample analysis for 1992.
None
Slight
Substantial
Junwl46L 0% 1 39% I 31% 1 21% I
0 - 2 0 - 8
2 - 4 8 - 1 3
4 - 8 13 - 20
CLASSlFiCATlON CRiTERlA
I
I I I I
I Severe I > 8 I > 20 I Notes: 'ECe = Electrical conductivity of soil extract in dSlm.
bSAR = Sodium Adsorption Ratio in (meqll)". Source: Kuper and Waijjen (1993).
Table 58 gives an indication of the salinity picture as seen in the visual survey conducted under the supervision of the DLR in the same channels for the same year. A comparison of the two sets of data shows that the visual survey can be very misleading in terms of actual salinity in the soil. Therefore, in- house laboratory facilities available with the DLR can be gainfully used to better categorize the affected lands and define the reclamation operations accordingly. Further, a more scientifically rigorous approach
14
1'

in selecting blocks of land for additional supplies can improve the quality of the decision making on reclamation activities, and avoid the subjective selection procedure which is so vulnerable to pressure from informal sources.
The continued practice of relying solely on the salinity surveys conducted by Canal Patwaris through visual observation tends to reduce the credibility of the program. The presence of salinity-affected areas in most of the watercourse commands provides an easy justification for this practice, but that itself plaaes the whole procedure of selection entirely under the direction of the agency staff. This laxity provides for influential, resourceful and clever farmers to have a greater chance of being successful in getting their lands selected for reclamation.
Table 58. Visual salinity according to the survey of the DLR for 1992
Watercourse Saline command
Manawl 024R 2.5%
Manawl 071 R
Manawl 143R2
Junwi 08L 37.2%
Junwl 29R
Junwl 46L 48.5%
Time Series Data
Yearly data obtained through Thur Girdawariprovide a time series record for establishing how the salinity situation has changed with time. In general, these statistics represent the trend in soil salinity as can be seen in Annex E and Figures 1 to 3 derived from consolidated data kept by the DLR (DLR 1992; Appendix 1). The data in Annex E show the position every year, starting from 1944-45, for a period of more than 45 years. While the surveyed area covering the irrigated land has steadily increased over time, reaching the limits of the total culturable command area, the relative proportion of the Thur-affected area increased gradually from 17.1 percent in 1944-45 to reach 21.7 percent in 1954-55, but it then declined to 15.0 percent in 1964-65, to 13.2 percent in 1974-75 and to 11.1 in 1984-85. However, since 1985-88, the percentage of affected area has again taken an upward trend to reach 12.8 percent in 1989-90. However, for the year 1991-92, the DLR's report (1992 ) shows that the salt-affected area has again declined to 12.4 percent of the total area surveyed.
Figures 1 and 2 show closer pictures of the time series data of the area surveyed for soil salinity and the saline area detected, respectively, for the period 1968 to 1992. Figure 3 shows, for the same period, the pattern of the saline area as a percentage of the area surveyed. According to these statistics, the surveyed area has reached a maximum possible by 1983 and remained at that level for a decade. Assuming that the total irrigated area was surveyed by the Canal Patwaris during this period, what is
15

discernible from Figures 2 and 3 is that the area affected by salinity started to steadily increase from 1985, although there is a slow downward movement since 1990.
Annual statements prepared by the Land Reclamation Officer (LRO), Thur and Sem Division, Lahore, present time series data for the last ten years classified into Jhurcategories. These statements also carry the totals of area surveyed and the Thur-affected area for each year. The data in Annex Fi and Figure 4 show that 65 percent of the saline area is Thur Juzvi and is cultivated, while the remaining 35 percent is uncultivated. The uncultivated saline area consists of Jhur Kohna (19%), Thur Punjsala (lo%), and Jhur
A close scrutiny of the two sets of time series data referred to above, Annex E, and Annex F1, read with Annex F2, indicates that their accuracy is suspect. First, the consolidated figures for the last few years in Appendix 1 of the DLR's report of 1992, which is reproduced in Annex E of this paper, do not tally with the total figures in the annual statements prepared by the LRO (Thur and Sem Division). A more disturbing
Nau (6%).
Figure 1. lrrigated area of Punjab surveyed for salinity by Canal Patwaris.
AREA IN MILLION HECTARES
9.5
8 " " ' " " " ' " ' " ' ' " ' 1970 1975 1980 1985 1990
YEARS
16
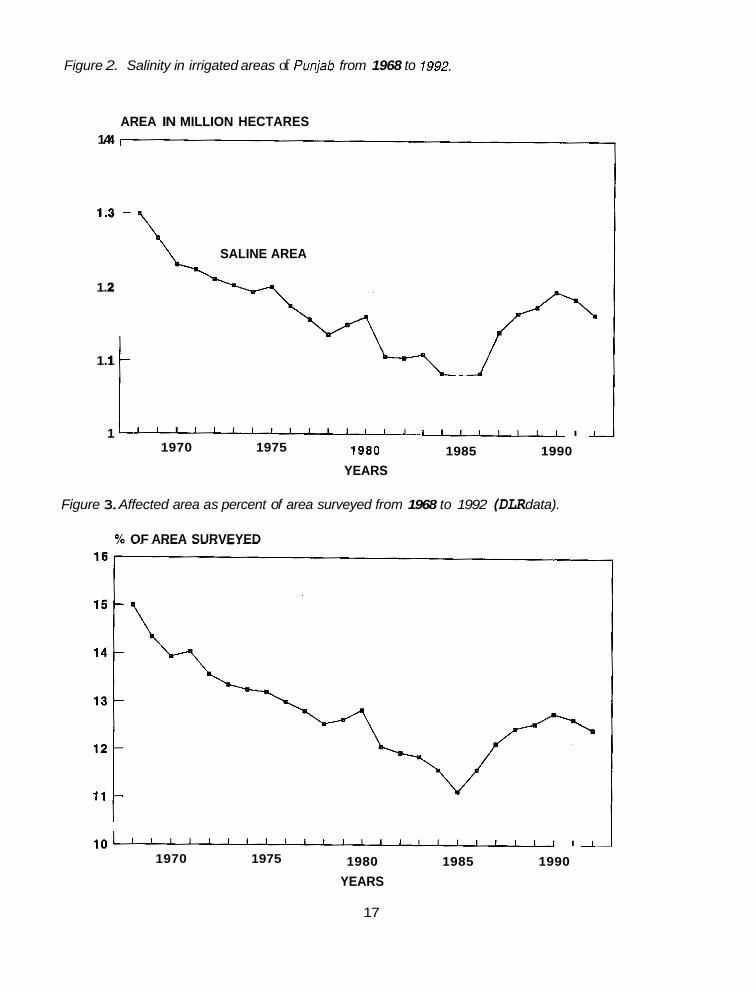
Figure 2. Salinity in irrigated areas of Punjab from 1968 to 1992.
AREA IN MILLION HECTARES 1.4
1.5
1.2
1.1
1
- \ SALINE AREA
1 1 , 1 , , , , 1 , , , I I , , , , I , , , ,
1980 1985 1990 1970 1975
YEARS
Figure 3. Affected area as percent of area surveyed from 1968 to 1992 (DLR data).
% OF AREA SURVEYED
l o ~ ~ ” ~ ’ ~ ~ ~ ~ ~ ~ l l l , , , , ~ , , I , , ,
1980 1985 1990 1970 1975
YEARS
17
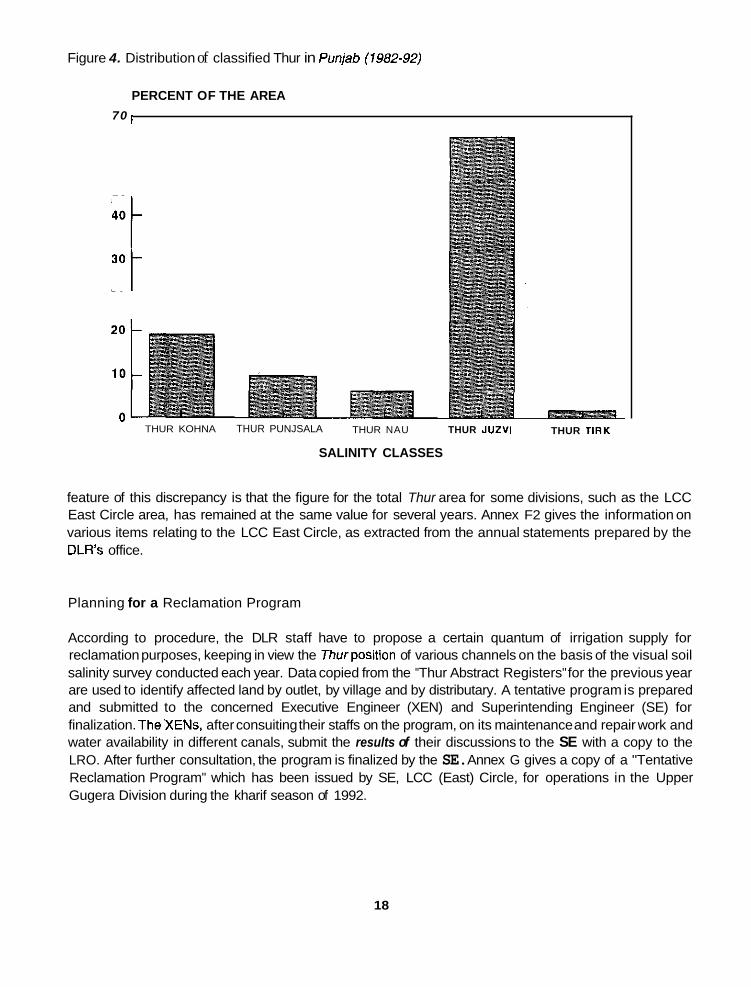
Figure 4. Distribution of classified Thur in Punjab (1982-92)
PERCENT OF THE AREA 70 1
50
30 401 "
THUR KOHNA THUR PUNJSALA THUR NAU THUR JUZVI
SALINITY CLASSES
THUR TlRK
feature of this discrepancy is that the figure for the total Thur area for some divisions, such as the LCC East Circle area, has remained at the same value for several years. Annex F2 gives the information on various items relating to the LCC East Circle, as extracted from the annual statements prepared by the DLR's office.
Planning for a Reclamation Program
According to procedure, the DLR staff have to propose a certain quantum of irrigation supply for reclamation purposes, keeping in view the Thurposition of various channels on the basis of the visual soil salinity survey conducted each year. Data copied from the "Thur Abstract Registers" for the previous year are used to identify affected land by outlet, by village and by distributary. A tentative program is prepared and submitted to the concerned Executive Engineer (XEN) and Superintending Engineer (SE) for finalization. TheXENs, after consuiting their staffs on the program, on its maintenance and repair work and water availability in different canals, submit the results of their discussions to the SE with a copy to the LRO. After further consultation, the program is finalized by the SE. Annex G gives a copy of a "Tentative Reclamation Program" which has been issued by SE, LCC (East) Circle, for operations in the Upper Gugera Division during the kharif season of 1992.
18
Preparation of a Reclamation Scheme
Afler obtaining approval from the concerned SE for the tentative reclamation program, the DLR staff start their field work. They are expected to conduct another Jhur Girdawari (resurvey to check the salinity) in the reach of the channel where the reclamation supply have been agreed upon. According to original departmental procedure, reclamation activities were confined to only Thur Juzvi (cultivated Thuo and Thur Nau (uncultivated Thud categories. Later in 1970, Jhur Kohna and Thur Punjsah were also declared eligible to get reclamation supplies (Lahore Irrigation Chief Engineer's Letter No. 1647/W-ll/7023768- 72/680/56, dated 24/11/70 addressed to SEs and the DLR). At present, all types of salt-affected soils are included in reclamation operations. While visiting the field for the checking of Canal Patwaris' work of Thur Girdawari, the Land Reclamation staff are also expected to explain to the farmers the conditions under which reclamation supplies are provided. Wide publicity is to be given in the villages through public address systems, Chowkidars or other personal contacts. At the same time, the cultivators are asked to apply for additional water supplies for reclamation purposes on prescribed forms.
Later, the Reclamation Zilladar, with the help of his staff, prepares "selection cases," for which selection of fields is done on-site and an agreement is made with the shareholders of the targeted outlets. These cases are submitted to the Sub-Divisional Office. The Assistant Land Reclamation Officer (ALRO) is expected to recheck about 20 percent of the selected area on each outlet. Then, the Zilladar prepares the Reclamation Scheme and submits it to the ALRO, and he, in turn, to the LRO. The LRO, after scrutiny, sends the scheme to the concerned XENs, SE, and Director Land Reclamation with copies to the concerned ALROs. The XENs prepare a "Shoot Statement,'' which is submitted to the SE for approval. Afler approval, orders for the fixation of the reclamation shoots are given in writing as well as on wire through a signaler. In the meantime, the Reclamation Patwari and Zilladar proceed to frame amended warabandi case5 and submit them to the ALRO, who sanctions reclamation warabandis before the release of the reclamation supply to ensure its proper utilization. In due course, the Reclamation Patwari goes to the shareholders of the outlets and arranges to prepare their lands which were selected for the purpose. On receipt of installation orders by the SE on a wire message through a signaler or through letter, the concerned Sub-Divisional Officer (SDO) of the Punjab Irrigation Department gives instructions to his Sub- Engineer (Overseer) for the fixation of pipes. Table 6 gives the activities involved in a reclamation scheme, including identification, approval and implementation.
Land Reclamation Operations in LCC (East) Circle
The Land Reclamation Officer (LRO), Lower Chenab Canal East Circle, has responsibility for reclamation activities in three branches: the Upper Gugera, Lower Gugera and Burala. The level of reclamation operations undertaken during kharif 1992 in the three branches is given in Table 2. A comparison of the saline area selected for reclamation activities with the irrigated area reveals that the extent of land reclamation is very meager. The saline area selected for reclamation supplies was only about 0.5 percent of the total culturable command area (CCA). Out of a total of 7,780 acres (3,149 ha) of selected saline area, only 57 percent was under rice which is one of the recommended reclamation crops for this season. This low percentage of area under rice confirms the farmers' comments during field interviews that the
19
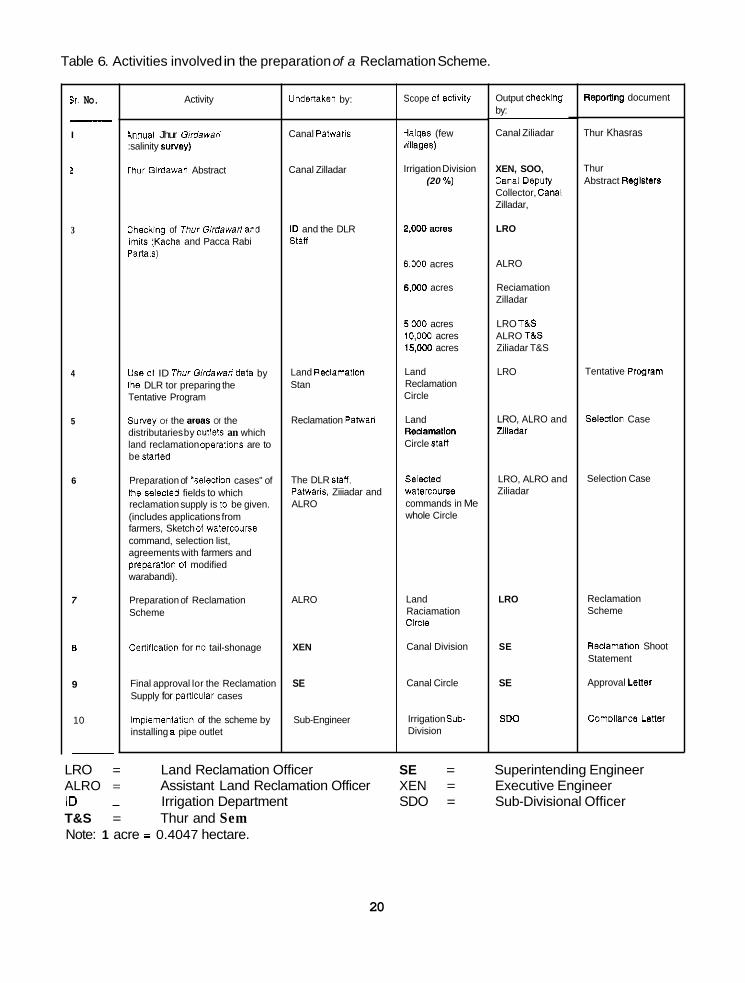
Table 6. Activities involved in the preparation of a Reclamation Scheme.
9r. No. - I
?
3
4
5
6
7
8
9
10
-
Activity
4nnual Jhur Girdawali :salinity survey)
rhur Gidawari Abstract
3hecking of JhUr Girdawaliand imils (Kacha and Pacca Rabi PaMis)
Use 01 ID Jhur Glrdawari Uata by ihe DLR tor preparing the Tentative Program
survey Of the areas Of the distributaries by OUtiRlS an which land reclamation opemtions are to be slaned
Preparation of *selection cases" of lhe SeIeCted fields to which reclamation supply is to be given. (includes applications from farmers, Sketch of WaterCOUrSe command, selection list, agreements with farmers and preparation of modified warabandi).
Preparation of Reclamation Scheme
Cenification for no tail-shonage
Final approval lor the Reclamation Supply for panlcular cases
lmplementation of the scheme by installing a pipe outlet
Undenaken by:
Canal Patwaris
Canal Zilladar
ID and the DLR Stan
Land Redamation Stan
Reclamation Patwari
The DLR stan, Pawaris. Ziiiadar and ALRO
ALRO
XEN
SE
Sub-Engineer
Scope 01 advity
Halqas (few villages)
Irrigation Division (20 %)
2,ow acres
6.WO acres
6,WO acres
5,wo acres 10,OW acres 15,ow acres
Land Reclamation Circle
Land
Circle Stan ReclamallOn
Selectsd watercourss commands in Me whole Circle
Land Raciamation Circle
Canal Division
Canal Circle
Irrigation Sub- Division
Output checklng by:
Canal Ziliadar
XEN, SOO, Canal Depuly Collector, Canal Zilladar,
LRO
ALRO
Reciamation Zilladar
LRO T&S ALRO TLLS Ziliadar T&S
LRO
LRO, ALRO and Zlladar
LRO, ALRO and Ziliadar
LRO
SE
SE
S W
RepoltlnQ document
Thur Khasras
Thur Abstract RBgIstera
Tentative Program
Selectlon Case
Selection Case
Reclamation Scheme
RedamatLon Shoot Statement
Approval Lener
ComDllance Letter
LRO = Land Reclamation Officer SE = Superintending Engineer ALRO = Assistant Land Reclamation Officer XEN = Executive Engineer ID - - Irrigation Department SDO = Sub-Divisional Officer T&S = Thur and Sem Note: 1 acre = 0.4047 hectare.
20
DLR's reclamation operations are not planned and initiated on time for them to start rice cultivation at the. proper time in the kharif season.
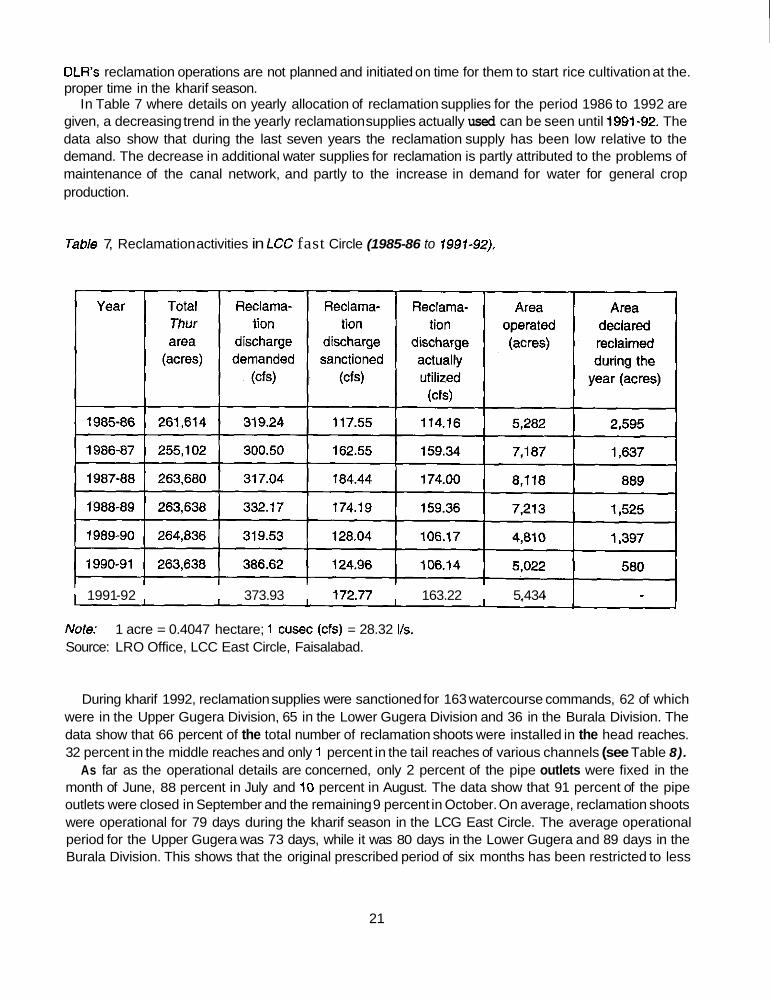
In Table 7 where details on yearly allocation of reclamation supplies for the period 1986 to 1992 are given, a decreasing trend in the yearly reclamation supplies actually used can be seen until 1991-92. The data also show that during the last seven years the reclamation supply has been low relative to the demand. The decrease in additional water supplies for reclamation is partly attributed to the problems of maintenance of the canal network, and partly to the increase in demand for water for general crop production.
Table 7, Reclamation activities in LCC fast Circle (1985-86 to 1991-92).
1991 -92 373.93 172.77 163.22 5,434
Note: Source: LRO Office, LCC East Circle, Faisalabad.
1 acre = 0.4047 hectare; 1 cusec (cfs) = 28.32 Vs.
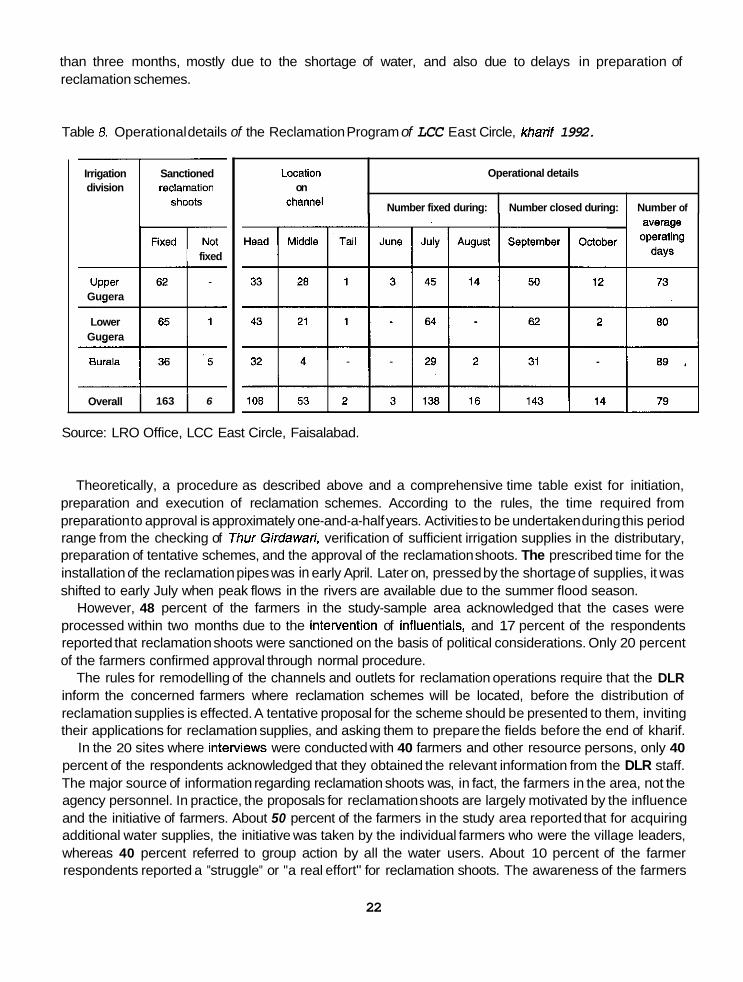
During kharif 1992, reclamation supplies were sanctioned for 163 watercourse commands, 62 of which were in the Upper Gugera Division, 65 in the Lower Gugera Division and 36 in the Burala Division. The data show that 66 percent of the total number of reclamation shoots were installed in the head reaches. 32 percent in the middle reaches and only 1 percent in the tail reaches of various channels (see Table 8).
As far as the operational details are concerned, only 2 percent of the pipe outlets were fixed in the month of June, 88 percent in July and 10 percent in August. The data show that 91 percent of the pipe outlets were closed in September and the remaining 9 percent in October. On average, reclamation shoots were operational for 79 days during the kharif season in the LCG East Circle. The average operational period for the Upper Gugera was 73 days, while it was 80 days in the Lower Gugera and 89 days in the Burala Division. This shows that the original prescribed period of six months has been restricted to less
21
than three months, mostly due to the shortage of water, and also due to delays in preparation of reclamation schemes.
Location on
channel
Table 8. Operational details of the Reclamation Program of LCC East Circle, kharlf 1992.
~~~~~
Operational details
Number fixed during: Number closed during: Number of
Irrigation Sanctioned division reclamation
shoots
fixed
Gugera
Lower
Overall
Gugera
Burala
163 6
Source: LRO Office, LCC East Circle, Faisalabad.
Theoretically, a procedure as described above and a comprehensive time table exist for initiation, preparation and execution of reclamation schemes. According to the rules, the time required from preparation to approval is approximately one-and-a-half years. Activities to be undertaken during this period range from the checking of Thur Girdawari, verification of sufficient irrigation supplies in the distributary, preparation of tentative schemes, and the approval of the reclamation shoots. The prescribed time for the installation of the reclamation pipes was in early April. Later on, pressed by the shortage of supplies, it was shifted to early July when peak flows in the rivers are available due to the summer flood season.
However, 48 percent of the farmers in the study-sample area acknowledged that the cases were processed within two months due to the interdention of influentials, and 17 percent of the respondents reported that reclamation shoots were sanctioned on the basis of political considerations. Only 20 percent of the farmers confirmed approval through normal procedure.
The rules for remodelling of the channels and outlets for reclamation operations require that the DLR inform the concerned farmers where reclamation schemes will be located, before the distribution of reclamation supplies is effected. A tentative proposal for the scheme should be presented to them, inviting their applications for reclamation supplies, and asking them to prepare the fields before the end of kharif.
In the 20 sites where intewiews were conducted with 40 farmers and other resource persons, only 40 percent of the respondents acknowledged that they obtained the relevant information from the DLR staff. The major source of information regarding reclamation shoots was, in fact, the farmers in the area, not the agency personnel. In practice, the proposals for reclamation shoots are largely motivated by the influence and the initiative of farmers. About 50 percent of the farmers in the study area reported that for acquiring additional water supplies, the initiative was taken by the individual farmers who were the village leaders, whereas 40 percent referred to group action by all the water users. About 10 percent of the farmer respondents reported a "struggle" or "a real effort" for reclamation shoots. The awareness of the farmers
22

about the final approving authority was checked through interviews; 60 percent identified the SE as the real authority, 35 percent the XEN, and 5 percent the LRO. Although this lack of awareness is typical of many state intervention programs in the rural areas, the quality of reclamation operations can be greatly improved with increased awareness among the water users.
The documentation prepared by the DLR staff for the selection of a watercourse command to be included under a reclamation scheme appears to be quite comprehensive, at least in volume, particularly in cases where the reclamation supply is given to scattered plots. In the study sample, 14 (70%) of the reclamation schemes were represented by the scattered plots, while 6 (30%) of them fell under the category of Compact Block. All Compact Block cases were found in the Upper Gugera Division.
WATER AVAILABILITY FOR RECLAMATION SUPPLIES
The details of reclamation supplies utilized during the period from 1948-49 to 1990-91 are shown in Annex H and a graphic presentation of the same data for the period from 1968 to 1992 is shown in Figure 5. Since its establishment in 1945, the DLR claims that it has reclaimed about 0.5 million hectares of the irrigated area of the Punjab (Annex H). However, the data also shows that since around 1979, there has been a steady decrease in additional water supplies available each year for reclamation, resulting in a corresponding decrease in area operated or treated, and reclaimed.
Additional Water Supplies for Reclamation
Figure 6A, which is derived from the DLR's data in Annex H, gives the average reclamation supply actually utilized during recent years, in liters per second per hectare. The wide fluctuations in the per-hectare use of water for this purpose reflect the variability in the supply, or a lack of adherence to the prescribed criteria for operating reclamation shoots.
Using this data, an attempt was made to roughly identify the scope of these reclamation supplies for leaching~ purposes. Since rice is the most water-consuming crop among the crops recommended during reclamation, the maximum amount of water that rice would require indicates the level of crop water requirement during these operations. Following the observations by Murray-Rust and Vander Velde (1992), it was assumed that the rice crop was normally given sufficient water, about 10 mm/day, to avoid stress, and accordingly the equivalent of this was marked in Figure 6A at the level of 1.15 liters per second per hectare. It is clear from Figure 6A that a macro-level analysis of the DLR's data given in Annex H points to the use of a substantial amount of water for leaching purposes during this period. Figure 68 shows the same effect when data is converted into Relative Water Supply (RWS) terms.
Additional canal water is to be provided during the summer season through special outlets according to provisions under the "rules for the remodelling of channels and outlets required for the distribution of reclamation supplies." According to these rules, the distribution of reclamation supplies must be based on the distributary as a unit. For any distributary on which reclamation is to be taken up, a hydraulic survey of the channel and its minors is required. However, no such activity was observed during the study in any of the selected distributaries.
23
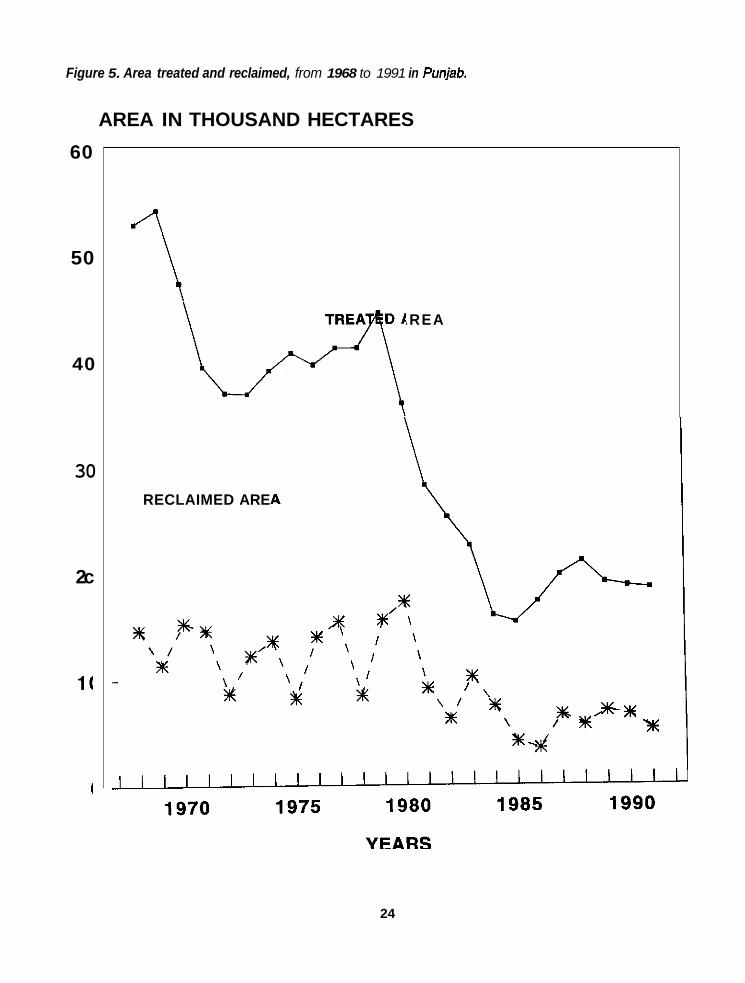
Figure 5. Area treated and reclaimed, from 1968 to 1991 in Punjab.
AREA IN THOUSAND HECTARES
60
50
40
30
2c
I (
(
1 \
TREA DAREA w RECLAIMED ARE
24
I -_i
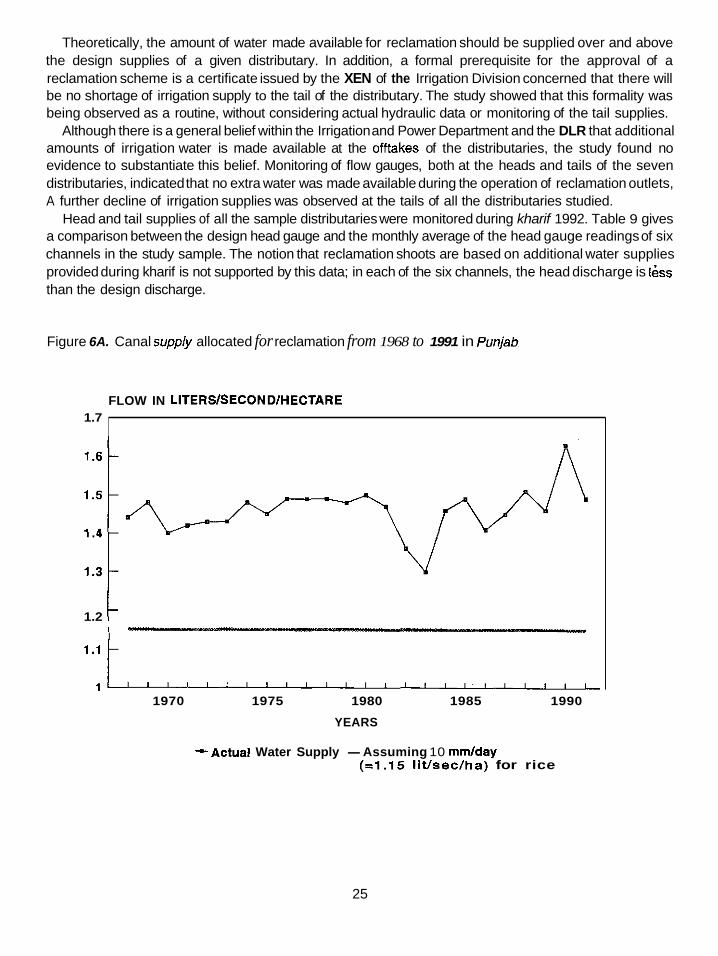
Theoretically, the amount of water made available for reclamation should be supplied over and above the design supplies of a given distributary. In addition, a formal prerequisite for the approval of a reclamation scheme is a certificate issued by the XEN of the Irrigation Division concerned that there will be no shortage of irrigation supply to the tail of the distributary. The study showed that this formality was being observed as a routine, without considering actual hydraulic data or monitoring of the tail supplies.
Although there is a general belief within the Irrigation and Power Department and the DLR that additional amounts of irrigation water is made available at the offtakes of the distributaries, the study found no evidence to substantiate this belief. Monitoring of flow gauges, both at the heads and tails of the seven distributaries, indicated that no extra water was made available during the operation of reclamation outlets, A further decline of irrigation supplies was observed at the tails of all the distributaries studied.
Head and tail supplies of all the sample distributaries were monitored during kharif 1992. Table 9 gives a comparison between the design head gauge and the monthly average of the head gauge readings of six channels in the study sample. The notion that reclamation shoots are based on additional water supplies provided during kharif is not supported by this data; in each of the six channels, the head discharge is l iss than the design discharge.
Figure 6A. Canal supp/y allocated for reclamation from 1968 to 1991 in Punjab.
FLOW IN LITERSISECONDIHECTARE 1.7
1.2 c I
___
1970 1975 1980 1985 1990
YEARS
+Actual Water Supply -Assuming 10 mm/day (=1.15 litlseclha) for rice
25
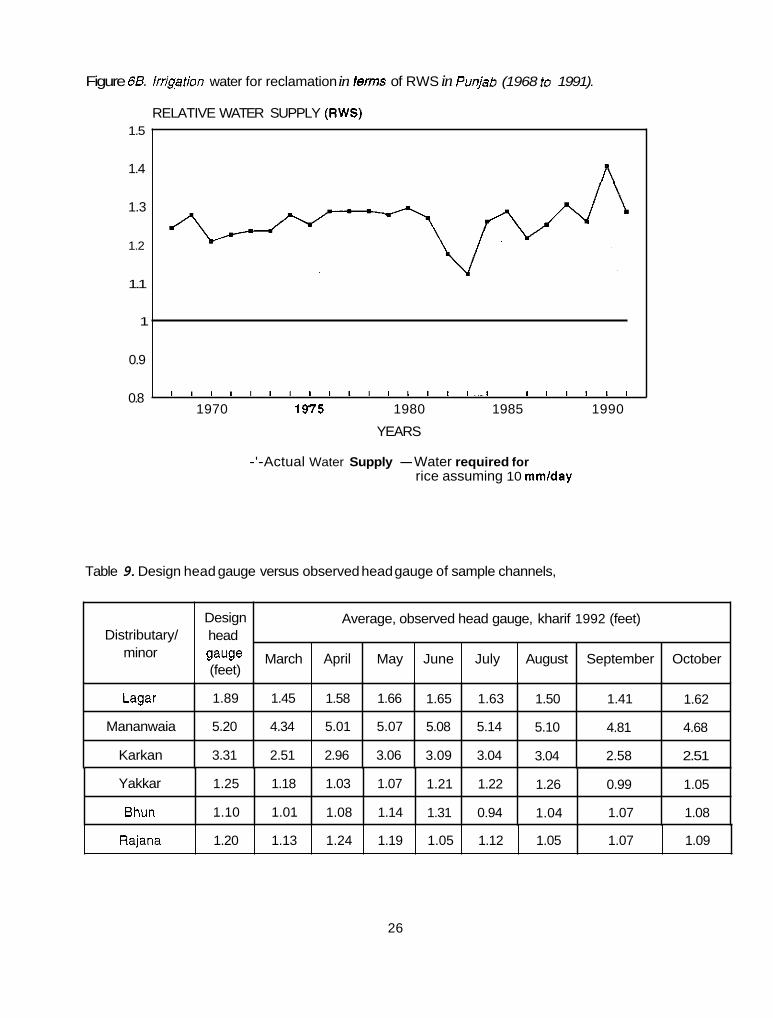
Figure 66. Irrigation water for reclamation in terns of RWS in Punjab (1968 to 1991).
RELATIVE WATER SUPPLY (RWS)
Distributary/ minor
1.5
1.4
1.3
1.2
1.1
1
0.9
0.8
Design head
gauge March April May June July August September October (feet)
Average, observed head gauge, kharif 1992 (feet)
I I I I I I I I J I I I I I I I I I I I I I I I
1970 1975 1980 1985 1990
YEARS
-'-Actual Water Supply -Water required for rice assuming 10 mmlday
Lagar
Mananwaia
Karkan
Table 9. Design head gauge versus observed head gauge of sample channels,
1.89 1.45 1.58 1.66 1.65 1.63 1.50 1.41 1.62
5.20 4.34 5.01 5.07 5.08 5.14 5.10 4.81 4.68
3.31 2.51 2.96 3.06 3.09 3.04 3.04 2.58 2.51
Yakkar
Bhun
1.25 1.18 1.03 1.07 1.21 1.22 1.26 0.99 1.05
1.10 1.01 1.08 1.14 1.31 0.94 1.04 1.07 1.08
Rajana 1.20 1.13 1.24 1.19 1.05 1.12 1.05 1.07 1.09
26

In the case of the Kot Pathana Minor, four discharge measurements were taken during the months of September and October. The average, measured head discharge for Kot Pathana was 9.36 cusecs (265.1 IVs), compared to the design discharge of 13 cusecs (368.2 i/s).
Figures 7 to 13 are derived from this information, and selected tail gauge readings and measurements. These figures present a comparison of actual and design supplies both for the heads and tails of the sample channels. Figures 7 to 13 show that the irrigation supplies to the watercourses at the tail of the distributaries were considerably reduced when reclamation shoots were installed during July to August.
The reclamation shoots installed under these conditions cause a further reduction of canal water supplies at the tails, which are already short of supply, and this leads to increased salinity in the tail-commanded areas Contraty to the purpose of reclamation operations.
In the Kot Pathana Minor, it was observed that even when water did not reach the tail, a reclamation shoot was still operating in the middle reach of the minor. During the whole study period, water never reached the tail area in the minor, even though the Executive Engineer had issued the formally required certificate that the tail will not suffer.
Figure 7. Monthly average readings of gauge at head and tail, Lagar Distributary.
GAUGE IN FEET
DESIGN FOR HEAD 2 t 1 . 5 1 . . . . . .
1 c
OBSERVED HEAD GAUGE m OBSERVED TAIL GAUGE
27
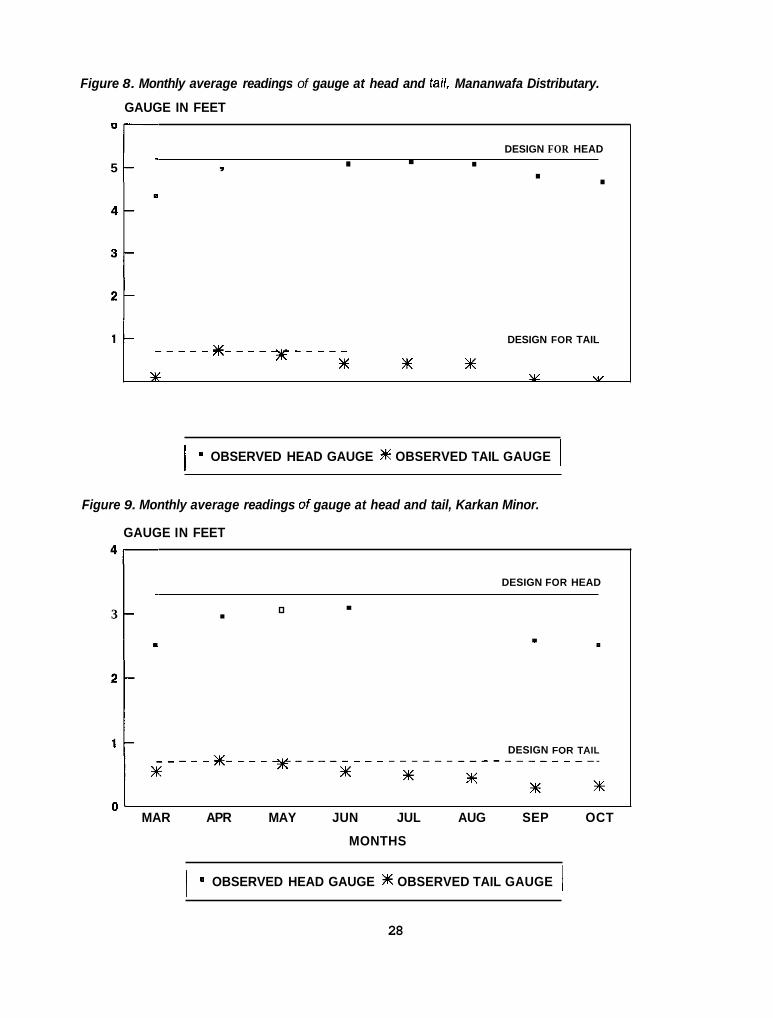
Figure 8. Monthly average readings of gauge at head and taif, Mananwafa Distributary.
GAUGE IN FEET
1 -
DESIGN FOR HEAD
5 . . . , . .
DESIGN FOR TAIL
*----, m m _ _ _ _ - m - - - -
x Y w
I OBSERVED HEAD GAUGE m OBSERVED TAIL GAUGE I Figure 9. Monthly average readings of gauge at head and tail, Karkan Minor.
GAUGE IN FEET
DESIGN FOR HEAD . 3 .
't DESIGN FOR TAIL
0 ' MAR APR MAY JUN JUL AUG SEP OCT
MONTHS
I OBSERVED HEAD GAUGE m OBSERVED TAIL GAUGE I 28
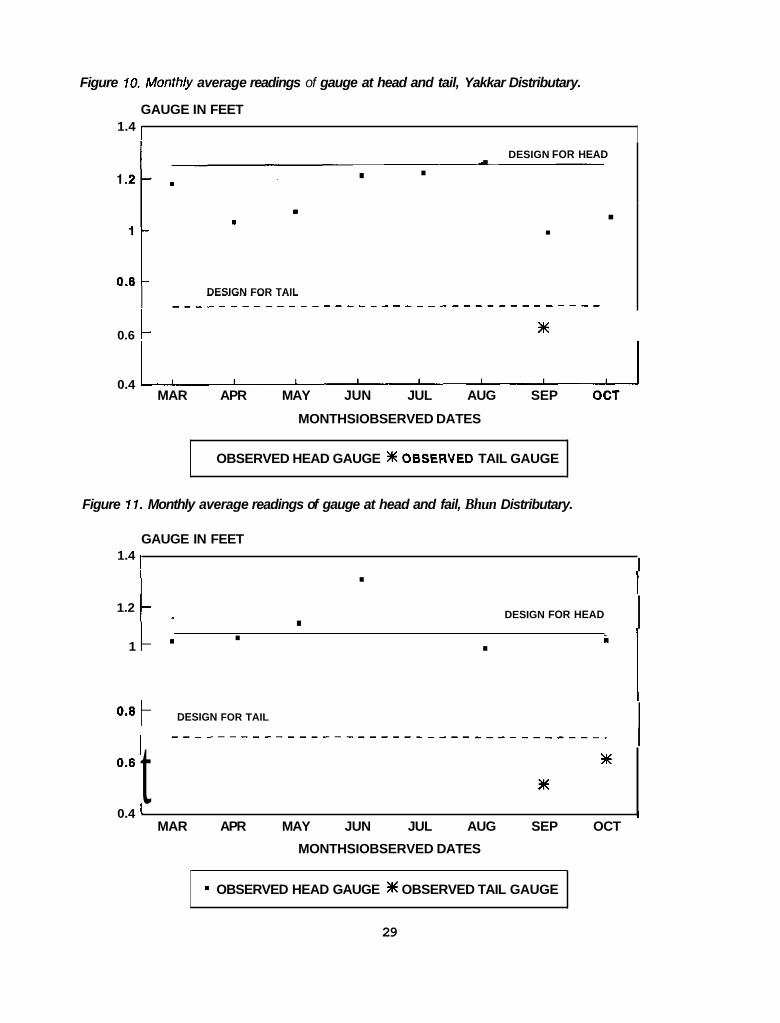
Figure 10, Month/y average readings of gauge at head and tail, Yakkar Distributary.
GAUGE IN FEET 1.4 1
DESIGN FOR HEAD . . . . .
0.8 DESIGN FOR TAIL
0.6 c m
0.4 MAR APR MAY JUN JUL AUG SEP OCT
MONTHSIOBSERVED DATES
OBSERVED HEAD GAUGE ?%OBSERVED TAIL GAUGE
Figure 11. Monthly average readings of gauge at head and fail, Bhun Distributary.
GAUGE IN FEET 1.4 I I
1.2 1 . .
I DESIGN FOR HEAD . 1 L l .
"* 1 DESIGN FOR TAIL I I I
o.6 t m x
0.4 I MAR APR MAY JUN JUL AUG SEP OCT
MONTHSIOBSERVED DATES
OBSERVED HEAD GAUGE x OBSERVED TAIL GAUGE
29
Figure 12. Monthly average readings of gauge at head and tad, Rajana Distributary.
GAUGE IN FEET 1.4
1.2
1
0.8
0.6
0.4
DESIQN FOR HEAD . . . . . . I
DESIGN FOR TAIL
I MAR APR MAY JUN JUL AUG SEP OCT
MONTHSIOBSERVED DATES
I OBSERVED HEAD % OBSERVED TAIL GAUGE I Figure 13. Monthly average flows at head and tail. Kot Pathana Minor.
DISCHARGE IN CFS 14 I
I
10 l2 1 . a t . 6 c 2 DE*O* toil ,111
0 W W W W W W UI W m m m m m m I,,
MAR APR MAY JUN JUL AUG SEP OCT
MONTHSIOBSERVED DATES
OBSERVED HEAD %OBSERVED TAIL DISCHARGE DISCHARGE
30
Location of Reclamation Outlets
Table 3, given in Section 111, shows that of the 20 reclamation shoots monitored in the study sample, 12 were in the head reaches of the distributaries, while 8 were located in the middle reaches and none at all in the tail reaches. Since this appeared to be almost like part of an officially accepted phenomenon , the observation was checked with the DCR staff. The reason given was that irrigation supplies at the tails were always considerably less than their due share, and it was not possible to convey additional supplies for a reclamation shoot in the tail area unless substantially increased supplies were delivered to the distributary. However, during the study, an interesting exception to this general pattern was observed, which might even provide an exemplary solution to the problem. The tail outlet No. 65,000 TL of the Jurian Distributary in the Upper Gugera Division was provided with an additional supply for reclamation from the main canal itself, at RD 30 (L) in the head reach of the Mian Ali Branch.
The conspicuous absence of reclamation outlets in the tail portions of the distributaries draws attention to two interrelated system management issues. One is that the tail command areas are inherently short of water relative to their authorized share, and the other is that as a consequence, reclamation facilities cannot be provided to the tail reaches, which in fact are observed to be the areas most affected by salinity. This is further compounded by the fact that reclamation outlets given a much higher duty of water than the normal outlets become instrumental in further depriving the tail areas of their due share of water (as will be shown below, no regulatory adjustments are made for making extra water available at the offtakes of these distributaries).
Discharge of Reclamation Outlets
While the sanctioned discharge for each watercourse is assumed to comply with the design duty determined by the irrigable extent of land, in practice, gross deviations can be observed. Special reclamation shoots are not exceptions to this behavior. Table 10 shows the deviations observed in 14 sample outlets. They not only vary substantially, the average actual discharges ranging from 64 percent to 400 percent of the sanctioned or the design discharges for the respective "shoots," but also, in many instances, they draw more than the regular outlets (when compared with data in Table 3). The resultant inequity extends itself to downstream water users who stand to lose even on their regular irrigation supplies. The degree of variability within watercourses can be seen in the measure of the coefficient of variation given in Table 10.
Lagar Distributary
The Lagar is one of the seven distributaries in Farooqabad Sub-Division, Upper Gugera Division, of the Lower Chenab Canal system. It offtakes from the right bank of Upper Gugera Branch Canal at RD 108000, Lagar has a total length of 62,218 feet (18,950 meters) and a design discharge of 38 cusecs (1.076.2 I/s) to supply 29 outlets (6 of which are directly supplied from Jhinda Minor). These outlets serve a cuiturable commanded area (CCA) of 16,356 acres (6,619 hectares) from an average authorized gross command area of 18,408 acres (7,450 hectares). The average authorized outlet discharge is 1.13 cusecs (32 I/s) serving a CCA of 585 acres (229 hectares). Discharge into the Lagar Distributary is not regulated by a gated structure; rather stop logs (karries) are used to control the flow into the head of the channel.
31
Table 10. Details of reclamation shoots under observation
8920-L 1 90.00 I 2.00 I 1.73 I 10 107 I 47
Note: 1 acre = 0.4047 hectare; 1 cusec (cfs) = 28.32 I/?.).
Five reclamation outlets with a total ganctioned discharge of 3 cusecs (85 Ws) were approved and operated in kharif 1992, despite the fact that the distributary itself never received its sanctioned discharge. Another reclamation outlet has been sanctioned from the Lagar Distributary to a command area outside that of Lagar. in the Main Upper Gugera Canal command. Figure 7 presents a comparison of the design head gauge and tail gauge readings with the obselved or measured head gauge and tail gauge values. It can be seen that the tail supplies were minimum during the period of reclamation operations. Thus, the reclamation operations were carried out in the head and middle reaches of the Largar Distributary at the expense of its tail command areas.
32
EFFECTS OF RECLAMATION SUPPLIES ON FARMING PRACTICES
The farmer's decisions on cropping and irrigation management are based on his own priorities, knowledge, experience and resource availability, but they are conditioned to a large degree by the availability of irrigation water. His compliance with advice and recommendations from government agencies primarily depends on how such instructions are useful'to him in maximizing his farm income.
Prescribed cultural and management practices are an essential accompaniment to the reclamation operations employed by the DLR. In itself, the technique of leaching of salts with additional water supplies is a universally accepted practice, but the accompanying recommended farming practices are restricted by various contextual conditions such as existing cropping patterns and farmer preferences. In this instance, the recommendations include the cultivation of certain specific crops and the way water is to be applied to the field.
Field Preparation
The DLR staff specify certain field preparations for reclamation purposes. The cultivator is required to level the fields, construct levees for holding water in the plots and apply water every seven days to start downward movement of salts, thereby lowering their surface concentration.
Each farmer whose area has been selected for reclamation is required to lay Thur-affected fields roughly in qua~er-acre plots with a watercourse in the middle. However, no such practice was seen in the study area. Farmers could not specify anything different than what they would routinely do for normal irrigation and crop production.
Reclamation Crops
The cropping rotation during reclamation includes the growing of rice in the summer followed by berseem fodder or gram during the winter. Berseem is grown using the normal water supply as the additional water supply is cut off during the winter. In non-perennial areas, gram is cultivated on residual moisture (wadh wartar) of the preceding rice crop. Provision of crop cover during the winter is very essential to control the upward movement of salts. Green manuring with Jantar (Sesbania Aculeata) preceded by the growing of rice is considered a very desirable practice to add organic matter and to improve the fertility of the soil,
The majority of soils having soluble salts is expected to be easily leached within a cycle of operations for three years. However, if a field still shows patchiness and the farmer needs the additional supplies for a longer period, he can apply to the DLR for an extension of operations. In response to an application for extension of the period of reclamation operations, soil samples are supposed to be collected and analyzed by the DLR staff. In the light of the results, reclamation operations may be carried out beyond the three- year period.
Selected crops are those which can withstand the increased quantity of water applied during leaching operations. To ensure proper leaching, the cultivation of any crop other than those recommended as reclamation crops is prohibited. Violation of this requirement is liable to be dealt with tawan (fine), but the enforcement of this restriction seems to be difficult. During kharif 1992, in 14 sample watercourses, about 36 percent of the area selected for reclamation did.not use the water for recommended reclamation crops (see Table 11). In the whole study area, no instance was reported where tawan was levied on defaulters.
33
I , 1 - ---- I
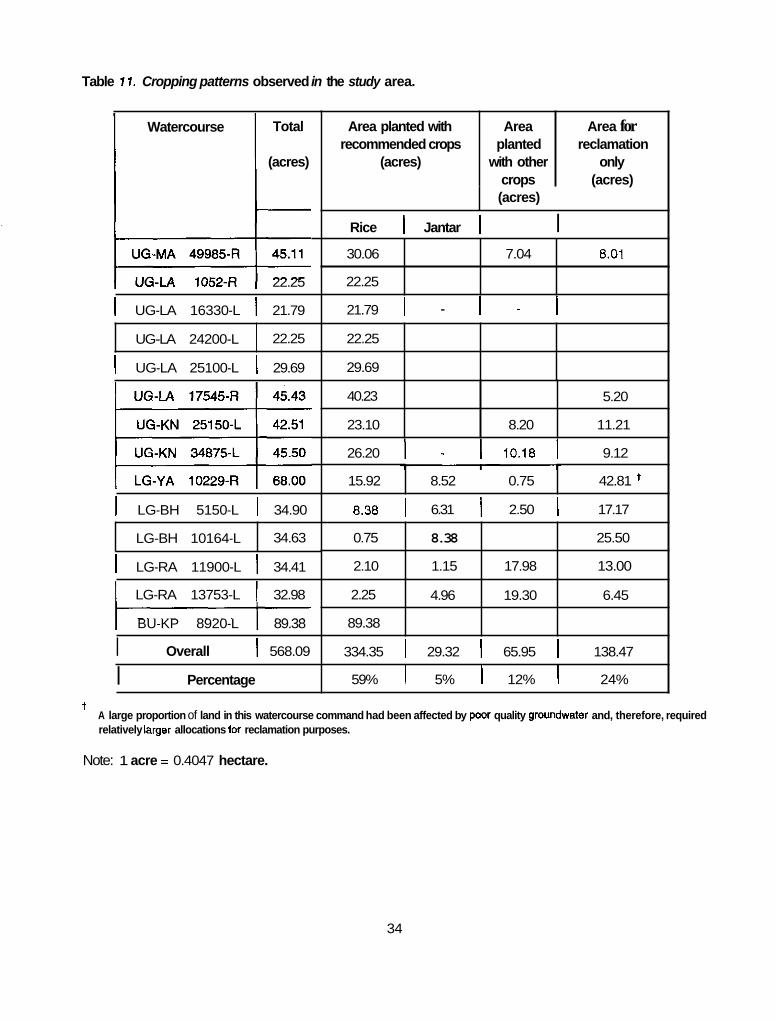
Table 11. Cropping patterns observed in the study area.
Area planted with recommended crops
(acres)
Total
(acres)
Watercourse Area Area for planted reclamation
crops (acres) with other only
22.25
30.06
22.25
I UG-LA 16330-L I 21.79
7.04 8.01
UG-LA 24200-L
1 UG-LA 25100-L I 29.69
22.25
I LG-BH 5150-L I 34.90
40.23
23.10
5.20
8.20 11.21
I LG-RA 11900-L I 34.41
15.92
LG-RA 13753-L 32.98
BU-KP 8920-L 89.38
8.52 0.75 42.81 '
I Overall 1 568.09
LG-BH 10164-L
I Percentage
34.63 0.75
2.10
(acres)
8.38 25.50
1.15 17.98 13.00
Rice I Jantar 1 I
2.25
89.38
4.96 19.30 6.45
21.79 1 - I - I 22.25
29.69
26.20 1 - I 10.18 I 9.12
8.38 I 6.31 1 2.50 I 17.17
334.35 I 29.32 1 65.95 I 138.47
59% I 5% 1 12% 1 24%
+ A large proportion of land in this watercourse command had been affected by pwr quality grwndwater and, therefore, required relatively larger allocations for reclamation purposes.
Note: 1 acre = 0.4047 hectare.
34
I
1
,
No significant difference was observed between the cropping patterns of areas under the reclamation schemes and patterns of other areas. The Upper Gugera Division comes under the rice-wheat zone while the Lower Gugera Division and Burala Division fall under the mixed cropping zone. The cropping pattern in case of reclamation shoots follows almost the same degree of difference.
Of the interviewed farmers, 20 percent supported the general observation that additional water supplies were in fact being used for ordinary crop production rather than for reclamation purposes. These farmers acknowledged that the reclamation shoots were installed to get the additional supplies of good quality water for general crop production rather than for the reclamation of soil. Of the sample, 38 percent of the farmers acknowledged that reclamation supplies were being used to increase the extent under rice. One farmerwho succeeded in obtaining a reclamation shoot for a block on account of his "informal pressure" was even found selling extra water to other farmers in the area. In fact, farmers have started to call these additional supplies as "grow-more-rice shoots."
Revision of Warabandis
Rules specify that when the reclamation program has been approved by the competent authority, the Land Reclamation Officer will have to prepare modified warabandis taking into account the additional water allocations. In cases where reclamation supplies have been sanctioned for Compact Blocks, to an individual farmer or to a few farmers, this was not required. The study found that the DLR staff did prepare revised warabandis where they were required, but farmers never adopted them. No effective modified warabandi was found in the study area, and it was observed that the farmers whose lands had not been identified for reclamation were also sharing reclamation supplies. This practice further confirmed the absence of a modified warabandi schedule.
Use of Groundwater
Usually farmers have to meet the water requirelrients of their crops with supplemental irrigation through groundwater development. The increased availability of irrigation water from private tubewells has helped farmers to sustain already high cropping intensities in the study area. During the study period, a survey was conducted with private tubewell users in 14 sample outlet commands where reclamation shoots were operational (Table 12). According to user perceptions, the proportion of tubewells with good quality water is 39 percent in the Upper Gugera Division as compared to 65 percent in the Lower Gugera Division. The average quality of water in the former case was 61 percent as against only 8 percent in the latter. The poor quality of tubewell water was reported only in the Lower Gugera area which was in 27 percent of its total number of tubewells. The greater use of poor quality water in the Lower Gugera is due to reduced supply of canal water for irrigation purposes. Wherever good quality groundwater is available in the sweet water zone, it Fan also be used for reclamation purposes. Some consideration should be given to this aspect.
35
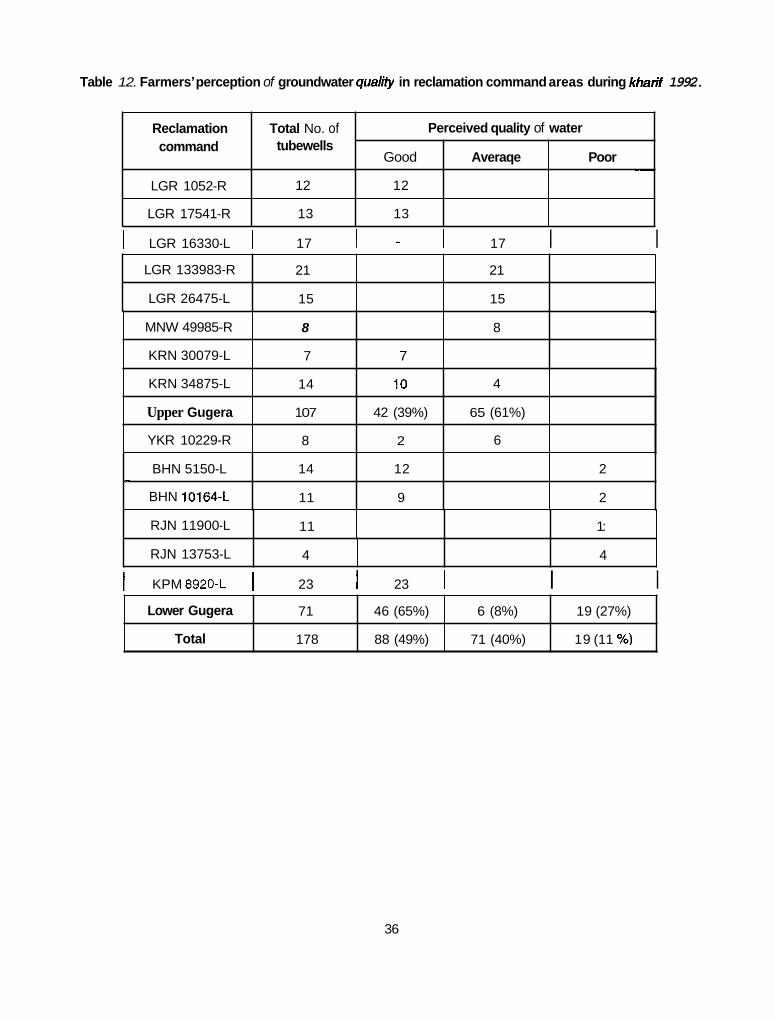
Table 12. Farmers’ perception of groundwater quaCfy in reclamation command areas during kharif 1992.
Reclamation command
~
Total No. of tubewells
Perceived quality of water
Good Averaqe Poor
LGR 1052-R
LGR 17541-R
I LGR 16330-L I 17 1 - 1 17 I I
~ ~
12 12
13 13
LGR 133983-R
LGR 26475-L
21 21
15 15
MNW 49985-R
KRN 30079-L
~
8 8
7 7
KRN 34875-L
Upper Gugera
YKR 10229-R
I KPM 8920-L I 23 I 23 I I I
14 10 4
1 07 42 (39%) 65 (61%)
8 2 6
BHN 5150-L
BHN 10164-L -
36
14 12 2
11 9 2
RJN 11900-L
RJN 13753-L
11 1:
4 4
Lower Gugera
Total
____
71 46 (65%) 6 (8%) 19 (27%)
178 88 (49%) 71 (40%) 19 (11 %)
IV. Conclusions
DESPITE THE FACT that the results reported and discussed in this paper relate only to a small percentage of the overall number of reclamation schemes in the Punjab, they represent the field situation, in general, and provide adequate support for a number of important conclusions.
The DLR's time series data on the extent of salinity show very little variation over the years. The practice of collecting salinity data through annual visual surveys conducted by field staff appears to have become a mere routine and to have deteriorated in accuracy.
The present method of selecting saline-affected lands for reclamation operations is highly vulnerable to undue influences. In the absence of a well-supervised and technically supported selection process, the field staff of the agencies are easy targets of these influences. The reclamation operations were originally intended for lands with salinity classed as ThurJuzvi(land salt-affected to the extent of 20%) and ThurNau (land deprived of cultivation during the preceding five years), both based on annually conducted visual surveys. However, the operations can now be sanctioned for any class of saline-affected land as visually assessed. This liberalization has increased the subjectivity in the selection process.
Primarily, the sanctioned reclamation shoot has virtually become an unfair means of obtaining extra canal irrigation supplies for agricultural production, particularly for rice cultivation during kharif; its use as an additional supply for the leaching of salts has become a secondary concern.
A major reason for the misuse of these extra supplies is the poor level of information related to reclamation programs reaching the farmers as a common group. The initiative for establishing reclamation shoots seems to be mostly from individual farmers, after which the prescribed procedure usually follows as a routine. For the approval of a reclamation scheme, a great deal of follow-up at each stage is required, from the Reclamation Patwari who does the initial assessment, to the Superintending Engineer who has the final authority. The original officially prescribed period of six months from 16 April to 15 October for reclamation schemes has now been reduced to a period of only three to three-and-a-half months from 1 July to 15 October. Within this restriction, there are many variations in their actual periods of operation. As the time becomes limited, even where farmers are generally informed of approved reclamation programs, they face many difficulties in having reclamation outlets installed in time; those who have prior knowledge and means to get things done have a greater chance of benefitting from the system.
No additional water is being made available to compensate for reclamation supplies. Since reclamation shoots are generally given in the head and middle reaches of a distributary, the water-short tail reaches tend to suffer more. This means that, in general, the additional supplies for reclamation purposes can contribute to increased inequity in water distribution. Further, this has an effect of exacerbating the salinity problem in the command areas located at the tail of the distributaries.
There is little evidence of any significant improvement having been made on the standard rules established half a century ago. The procedure adopted at present does not include any monitoring activity to find out whether the reclamation of a block of affected land has been successful, or whether the effort can produce long-term effects. If increased water supplies are to be maintained for a period longer than the stipulated three years, or if the water allowance has to be increased substantially, then the method is
37

nonviable under the prevailing conditions of irrigation water scarcity which, in fact, has resulted in a reduction of the reclamation supplies by more than 50 percent during the last 45 years. Additionally, the lack of follow-up by the DLR to advise cultivators on improved cultural practices, coupled with the lack of concern and awareness among the cultivators, creates such an environment that the fundamental objective of improving and sustaining yields is rarely realized.
Finally, the status of the Directorate of Land Reclamation within the family of agencies in the sector does not seem to be adequate for it to be able to play an effective role vis-a-vis the other agencies, as well as the farmers.
38
V. Recommendations
1. THE PRESENT METHOD of visual appraisal of saline areas should be improved by supplementing it with more scientific soil testing methods. Greater supervision is needed to improve the quality of this appraisal and the related data collection. The selection of blocks of land for reclamation should be systematized to make the selection process more objective.
Information on planned reclamation programs should be made freely available to all the farmers in the affected area, and their participation be obtained in the decision-making process.
Planning for reclamation should be undertaken on a system-wide basis so that the availability of additional water could be assessed and taken into account in deciding reclamation operations in areas where they are mostly needed.
Suitable tubewell water should also be considered in the assessment of overall water availability for reclamation shoots.
In a more scientific and comprehensive planning process for reclamation operations, consideration should be given to the location of reclamation shoots in tail areas of canal commands.
The DLR should be given the necessary resources to monitor and evaluate its reclamation operations both during and after their implementation. Several federal and provincial institutes and organizations with a mandate for salinity research are operating in the Punjab. Some of them even have facilities for their field operations. There should be s0m.e mechanism for linking the DLR with these institutes and organizations formally or informally to integrate their activities. For the program to be effective, the DLR should be given due legal and social recognition to provide it with the necessary authority for independent action.
2.
3.
4.
5.
6.
39
Bibliography
i
i
Ahmad, C. N.; and C. A. Rahim. 1990. Brackish water use for fieid crop production. Proceedings of Irrigation System Management Research Symposium, Islamabad.
Asgh-ar A. G., Abdul Rehman Khan and H. S. Zaidi. 1962. Studies in lysimeters, Part IV, Crop Planning for Salinity Control, Research Publication, Vol. II No. 7, DLR. Lahore.
Asghar, A. G.; and M. Ata ur Rehman. 1955. Water allowance for reclamation in high watertable areas. Proceedings of Punjab Engineering, Lahore (Pakistan). Paper No. 313 Vol. XXXIX.
Asghar, C. M.; M. A. Bhatti; and J. W. Kijne. 1992. Management of salt affected lands for crop production in Punjab of Pakistan. International symposium on strategies for utilizing salt affected lands. Bangkok, Thailand, Feb 17-25, 1992.
Asghar, M. 1988. Activities, functions, salient achievements of Directorate of Land Reclamation. Punjab, Lahore.
Bandaragoda, D. J.; and G. R. Firdousi. 1992. Institutional factors affecting irrigation performance in Pakistan: Research and policy priorities. Colombo, Sri Lanka: International Irrigation Management Institute. IlMl Country Paper -- Pakistan No. 4.
Chaudhry, M. R.; and C. B. Ahmad. 1990. Brackish water effects on soil salinity/sodicity and yield of wheat and sorghum. Proceedings of Irrigation System Management Research Symposium, Islamabad.
DLR (Directorate of Land Reclamation). 1990. Salinity classification and Thur Girdawari statistics in Pakistan. Research Publication Vol II No. 24, DLR, Lahore.
.-- _ _ _ _ _ _ _ _ _ _ _ . 1991. Activities, Functions, Set up, Salient Achievements of Directorate of Land Reclamation, Punjab, Lahore.
_ _ _ ...____ _ _ _ _ . 1992. Land reclamation strategy of Irrigation and Power Department, Punjab: Review of research and land reclamation oDerations.
International Waterlogging and Salinity Research Institute (IWASRI). 1990. Identification of constraints faced by the farmers in adopting reclamation techniques for saline/sodic soils within irrigated areas. Lahore, Pakistan: International Waterlogging and Salinity Research Institute.
41
Javaid, M. A,; and M. Q. Channa. 1990. Brackish groundwater for cotton and wheat production in the lower lndus Basin. Proceedings of Irrigation System Management Research Symposium, Islamabad.
Kijne, J. W and G. Levine. 1991. Opportunities for management inrervenrions in irrigation systems in Pakistan. Paper presented in Internal Program Review. International Irrigation Management Institute, Colombo, Sri Lanka.
Kuper, M. and E. V. Waijjen. 1993. Farmers' irrigation practices and their impact on soil salinity in the Punjab, Paklstan: Is salinity here to stay? Paper presented in Internal Program Review. December, 1993. International Irrigation Management Institute, Colombo, Sri Lanka.
Mian, M. A. 1985. Keynote Address, Third International Congress of Soil Science on "Soil Health for Sustainable Agriculture." Lahore, Pakistan.
Murray-Rust, Hammond D.; and E. J. Vander Velde. 1992. Conjunctive use of canal and groundwater in Punjab, Pakistan: Management and policy options. Paper prepared for the Internal Program Review, 1992. Colombo, Sri Lanka: International Irrigation Management Institute.
Nasir, Sardar A. D. 1981. A practical treatise on analytical study of canal and drainage act (VIII of 1873) and detailed commentary with up-to-date case law, notifications, circular letters and instructions, etc. Lahore, Pakistan: Mansoor Book House.
Vander Velde, E. J.; and J. W. Kijne. 1992. Salinity and irrigation operations in Punjab: Are there management options? Discussion Paper 2. Lahore, Pakistan: International Irrigation Management Institute.
Water and Power Development Authority (WAPDA). Master Planning Division. 1979. Revised. action program for irrigated agriculture, Main Report Vol I. Lahore, Pakistan: WAPDA.
Water and Power Development Authority (WAPDA). Planning Division. 1981. Soil Salinity Survey, 41 Million acres of irrigated areas of lndus Basin. Lahore, Pakistan: WAPDA.
Water and Power Development Authority (WAPDA). 1984. WAPDA Projects. Public Relations Divisions, WAPDA. Lahore, Pakistan: WAPDA.
-. _ _ _ _ _ _ _ _ _ _ _ - . 1985. Appraisal of initial chemical quality of groundwater of private tubewells in the selected areas of Punjab. Pub No. SD-29, SCARP Monitoring, WAPDA. Lahore, Pakistan: WAPDA.
42
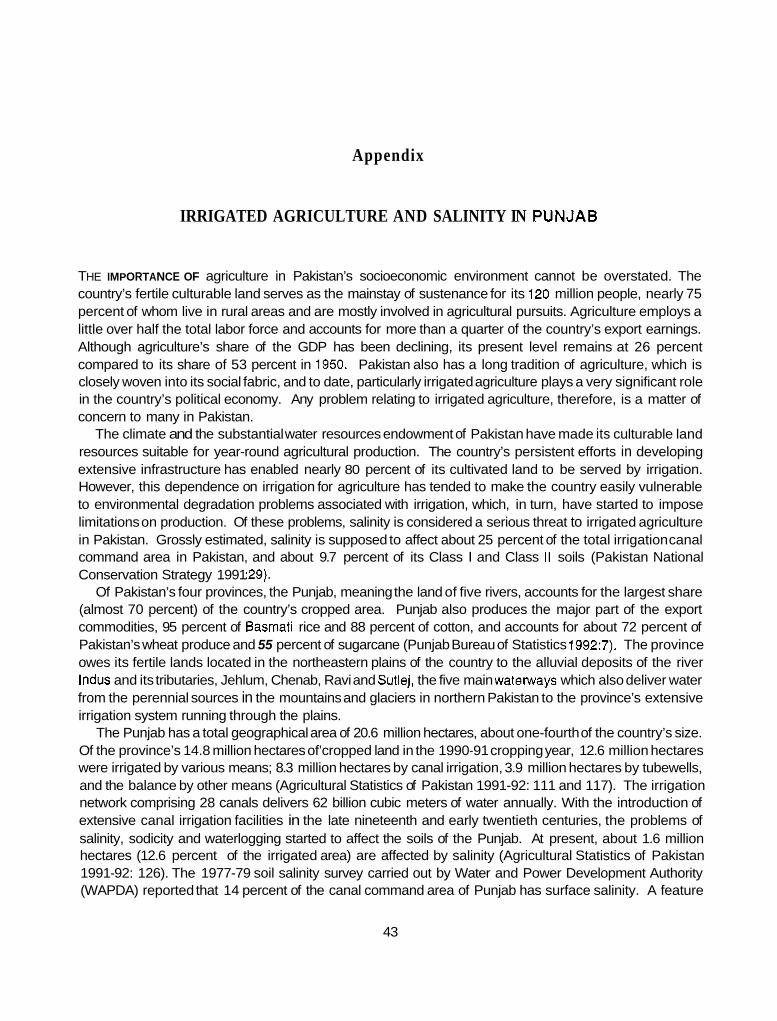
Appendix
IRRIGATED AGRICULTURE AND SALINITY IN PUNJAB
THE IMPORTANCE OF agriculture in Pakistan’s socioeconomic environment cannot be overstated. The country’s fertile culturable land serves as the mainstay of sustenance for its 120 million people, nearly 75 percent of whom live in rural areas and are mostly involved in agricultural pursuits. Agriculture employs a little over half the total labor force and accounts for more than a quarter of the country’s export earnings. Although agriculture’s share of the GDP has been declining, its present level remains at 26 percent compared to its share of 53 percent in 1950. Pakistan also has a long tradition of agriculture, which is closely woven into its social fabric, and to date, particularly irrigated agriculture plays a very significant role in the country’s political economy. Any problem relating to irrigated agriculture, therefore, is a matter of concern to many in Pakistan.
The climate and the substantial water resources endowment of Pakistan have made its culturable land resources suitable for year-round agricultural production. The country’s persistent efforts in developing extensive infrastructure has enabled nearly 80 percent of its cultivated land to be served by irrigation. However, this dependence on irrigation for agriculture has tended to make the country easily vulnerable to environmental degradation problems associated with irrigation, which, in turn, have started to impose limitations on production. Of these problems, salinity is considered a serious threat to irrigated agriculture in Pakistan. Grossly estimated, salinity is supposed to affect about 25 percent of the total irrigation canal command area in Pakistan, and about 9.7 percent of its Class I and Class II soils (Pakistan National Conservation Strategy 1991 :29).
Of Pakistan’s four provinces, the Punjab, meaning the land of five rivers, accounts for the largest share (almost 70 percent) of the country’s cropped area. Punjab also produces the major part of the export commodities, 95 percent of Basmati rice and 88 percent of cotton, and accounts for about 72 percent of Pakistan’s wheat produce and 55 percent of sugarcane (Punjab Bureau of Statistics 1992:7). The province owes its fertile lands located in the northeastern plains of the country to the alluvial deposits of the river lndus and its tributaries, Jehlum, Chenab, Ravi and Sutlej, the five main watenvays which also deliver water from the perennial sources in the mountains and glaciers in northern Pakistan to the province’s extensive irrigation system running through the plains.
The Punjab has a total geographical area of 20.6 million hectares, about one-fourth of the country’s size. Of the province’s 14.8 million hectares of’cropped land in the 1990-91 cropping year, 12.6 million hectares were irrigated by various means; 8.3 million hectares by canal irrigation, 3.9 million hectares by tubewells, and the balance by other means (Agricultural Statistics of Pakistan 1991-92: 111 and 117). The irrigation network comprising 28 canals delivers 62 billion cubic meters of water annually. With the introduction of extensive canal irrigation facilities in the late nineteenth and early twentieth centuries, the problems of salinity, sodicity and waterlogging started to affect the soils of the Punjab. At present, about 1.6 million hectares (12.6 percent of the irrigated area) are affected by salinity (Agricultural Statistics of Pakistan 1991-92: 126). The 1977-79 soil salinity survey carried out by Water and Power Development Authority (WAPDA) reported that 14 percent of the canal command area of Punjab has surface salinity. A feature
43
of Punjabs irrigated agriculture, which is not so clearly identified or articulated, is the important role played by groundwater as a supplement to canal irrigation. The Water Sector Investment Plan of 1990 estimated that in 1986, Punjab had almost 88 percent of the total number of private tubewells in Pakistan, and according to current estimates the number in the Punjab is about 300,000. The area irrigated by tubeweli water is about 3.9 million hectares in the Punjab as against a total of 4.3 million hectares in the country. The extensive use of groundwater and its inferior quality as compared to canal water are both significant factors affecting surface salinity.
Thus, the dominance of the Punjab province in Pakistan's irrigated agriculture is also accompanied by its correspondingly large share of irrigation-related environmental problems. Consequently, there has been a justifiable concern about these problems in the Punjab. Early attempts to arrest these problems included important institutional development strategies to evolve a more permanent organizational arrangement with adequate legal support.
At the initial stages of irrigation development during the last century, waterlogging was identified as the major and primary environmental problem. To.address this issue, the pre-partition Punjab authorities established a "Drainage Board" in 1917. The Board was later replaced by the "Waterlogging Enquiry Committee" with a mandate to investigate more scientifically the causes of the infertility of waterlogged lands and evolve methods by which such soils could be restored to normal productivity, and subsequently the Committee was renamed the "Waterlogging Board." In 1925, the Irrigation Research Institute was established, having a separate section dealing with the problems of land reclamation, and until about 1940, this section had conducted preliminary work on diagnosis and reclamation of saline and waterlogged areas. By the year 1940, the problem of salinity had emerged as a serious concern when salts were visible on the surface of land, and it was felt necessary to strengthen the institutional support to provide advice on reclamation operations based on the research conducted up to that time. To reach small farmers whose land had been damaged, land reclamation centers were established in selected areas, and later in 1942, the strategy was extended to cover reclamation on all the distributaries (Hussain and Nishat 1963:ll; Mashhadi 1987:27).
With the rapid expansion of soil-related problems in the fertile canal irrigated areas, the need to set up a separate Organizational unit to deal with land reclamation problems became imperative. The Directorate of Land Reclamation (DLR) was thus established in 1945 with its headquarters at Lahore under the control of the Punjab Irrigation Department. Basically, this was meant to be a research-oriented organization to identify and deal with the problems of salinity and sodicity in the irrigated areas of the Punjab, but later on the DLR has undertaken field operations in various canal circles in the Punjab, focusing on the reclamation of salt-affected lands.'
'The Directorate of Land Reclamation in its presentation, 'Land Reclamation Strategy of Irrigation and Power Depaltment, Punjab. 1992' provides a good description of its scope of work and a brief review of its achievements.
44
References
Agricultural Statistics of Pakistan. 1991-92. Ministty of Food, Agriculture and Cooperatives, Food and Agriculture Division, Economic Wing, Government of Pakistan, Islamabad.
Hussain, M.; and N. A. Nishat. 1963. Review of reclamation activities and suggested measures for waterlogging and salinity control. Pakistan Engineering Congress Golden Jubilee Session Lahore, Symposium on Waterlogging and Salinity in Pakistan.
Mashhadi, S. N. H. (Ed.). 1987. Pakistan Engineering Congress Diamond Jubilee Session. Special Publication. Lahore.
Pakistan Nationai Conservation Strategy. 1992. The Pakistan national consewation strategy: Where we are, where we should be, and how to get there. Environment and Urban Affairs Division, Government of Pakistan.
Punjab Bureau of Statistics. 1992. Punjab development statistics. The Government of Punjab, Lahore.
45
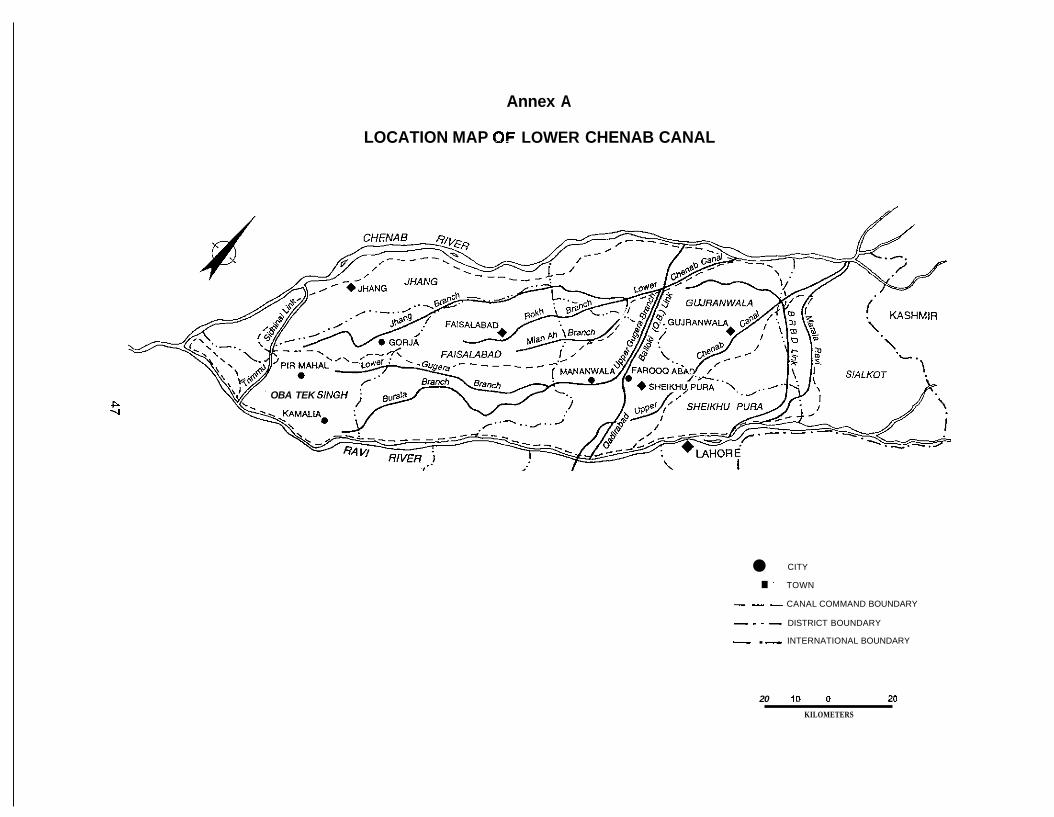
Annex A
LOCATION MAP OF LOWER CHENAB CANAL
OBA TEK SlNGH P -4
CITY . ' TOWN
- - - CANAL COMMAND BOUNDARY
- - - - DISTRICT BOUNDARY - . - INTERNATIONAL BOUNDARY
20 I 0 0 20
KILOMETERS
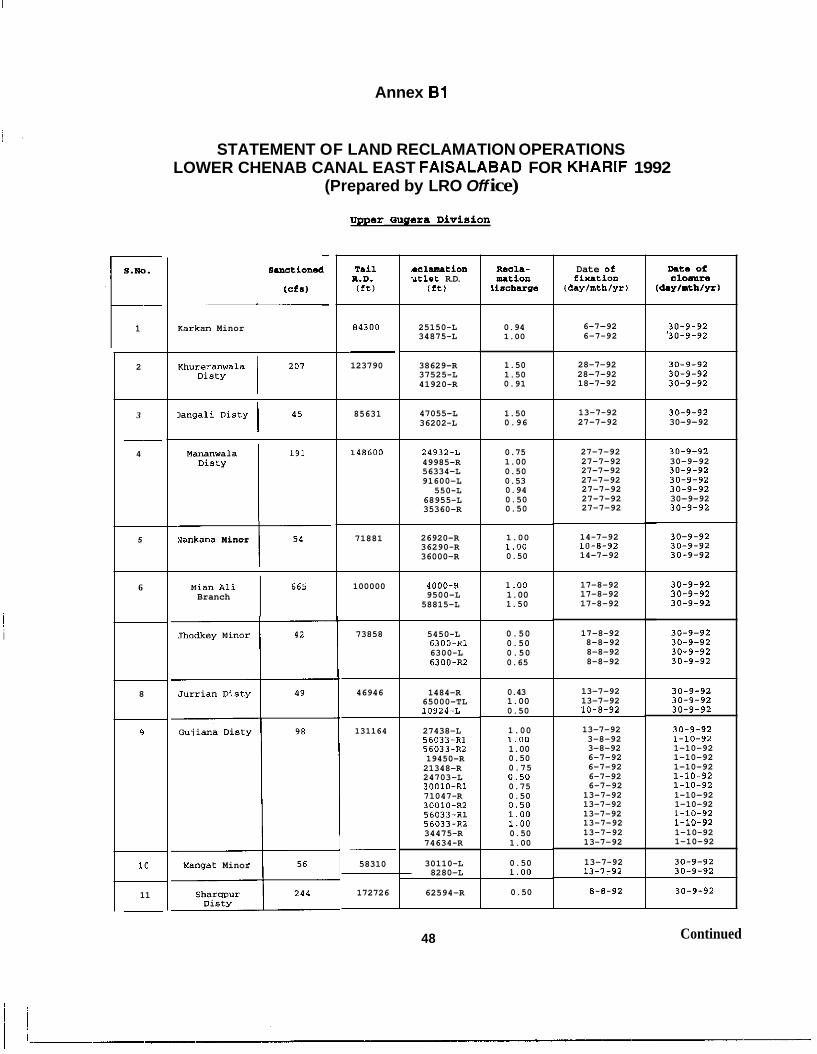
Annex B1
STATEMENT OF LAND RECLAMATION OPERATIONS LOWER CHENAB CANAL EAST FAISALABAD FOR KHARlF 1992
(Prepared by LRO Off ice)
m a r auger8 Division
T a i l R.D. (ttl
I.cl-ti0n lyt1.t R.D.
lttl
Date ot ciution
(da~lmthlurl
s.nctionOd
1Cf.I
Kart= Minor 84300
- 123790
6-7-92 6-7-92
30-9-92 '30-9-92
25150-L 34875-L
0.94 1.00
1.50 1.50 0.91
2 I 207
Khureranwala DiSty
38629-R 37525-L 41920-R
28-7-92 28-7-92 18-7-92
30-9-92 30-9-92 30-9-92
3
__ 4
I 45
,anga1i Disty 85631 47055-L 36202-L
1.50 0.96
13-7-92 27-7-92
30-9-92 30-9-92
148600 24932-L 49985-R 56334-L
27-7-92 27-7-92 27-7-92 27-7-92 27-7-92 27-7-92 27-7-92
30-9-92 30-9-92 30-9-92 30-9-92 30-9-92 30-9-92 30-9-92
30-9-92 30-9-92 30-9-92
0.75 1.00 0.50 0.53 0.94 0.50 0.50
1.00 1.00 0.50
91600-L 550-L
68955-L 35360-R
Nankana Minor 7 5 71881 26920-R 36290-R 36000-R
14-7-92 10-8-92 14-7-92
6 I 665
Mian Ali Branch
100000 4000-R 9500-L 58815-L
17-8-92 17-8-92 17-8-92
30-9-92 30-9-92 30-9-92
1.00 1.00 1.50
0.50 0.50 0.50 0.65
! i 73858 5450-L
6300-R1 6300-L 6300-R2
17-8-92 8-8-92 8-8-92 8-8-92
30-9-92 30-9-92 30-9-92 30-9-92
Jhodkey Minor
Jurrian Disty 8 46946 13-7-92 13-7-92 10-8-92
30-9-92 30-9-92 30-9-92
1484-R 65000-TL 10924-1
0.43 1.00 0.50
1.00 1.00 1.00 0.50 0.75 0.50 0.75 0.50 0.50 1.00 1.00 0.50 1.00
0.50 L O O
0.50
4 131164
- 58310
13-7-92 3-8-92 3-8-92 6-7-92 6-7-92 6-7-92 6-7-92 13-7-92 13-7-92 13-7-92 13-7-92 13-7-92 13-7-92
13-7-92 13-7-92
8 - 8 - 9 2
30-9-92 1-10-92 1-10-92 1-10-92 1-10-92 1-10-92 1-10-92 1-10-92 1-10-92 1-10-92 1-10-92 1-10-92 1-10-92
27438-L 56033-R1 56033-R2 19450-R 21348-R 24703-L 30010-R1 71047-R 30010-RZ 56033-R1 56033-R2 34475-R 74634-R
l o 30-9-92 30-9-92
30-9-92
30110-L 8280-L
Mangat Minor
Sharwur Disty
172726 11
- 62594-R
48 Continued
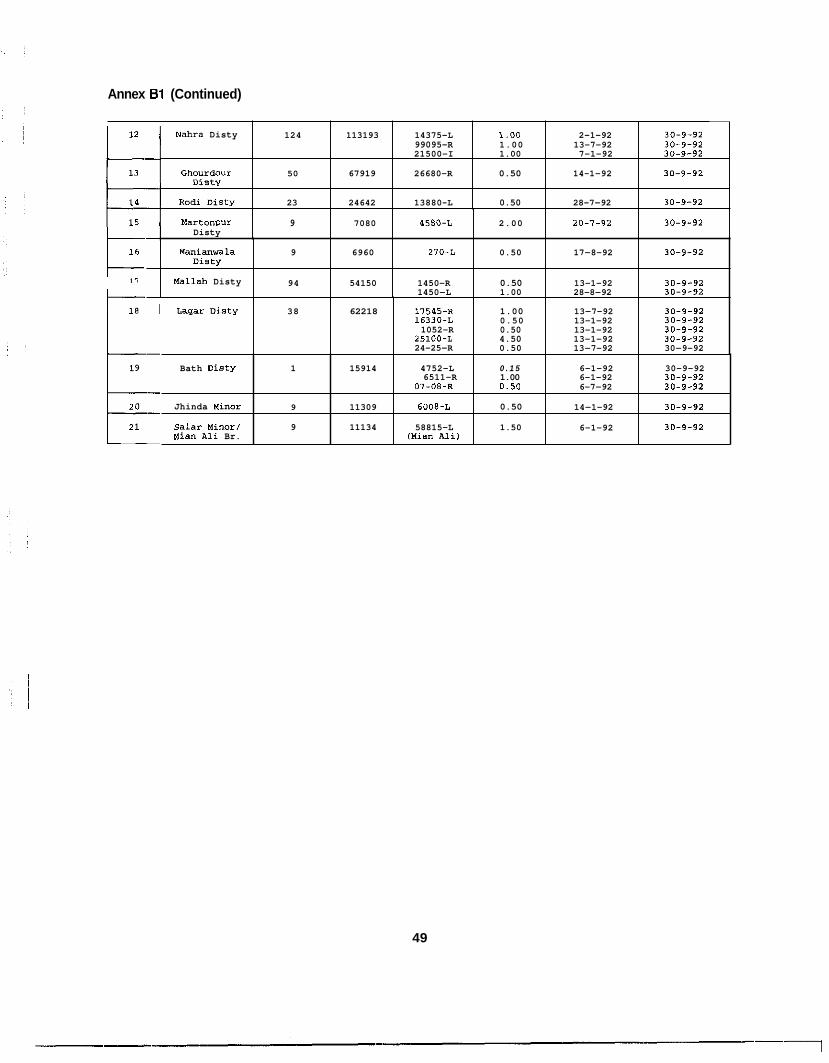
Annex 81 (Continued)
Nahra Disty
GhourdOur uisty
Rodi DiSty
124 113193 14375-L 1.00 2-1-92 30-9-92 99095-R 1.00 13-7-92 30-9-92 21500-I 1.00 7-1-92 30-9-92
50 67919 26680-R 0.50 14-1-92 30-9-92
23 24642 13880-L 0.50 28-7-92 30-9-92
Martonpur Disty
9 7080 4580-L 2.00 20-1-92 30-9-92
Manianwala uisty
Mallah Disty
9 6960 210-L 0.50 17-8-92 30-9-92
94 54150 1450-R 0.50 13-1-92 30-9-92 1450-L 1.00 28-8-92 30-9-92
49
Lagar Iliety 38 62218 11545-R 1.00 13-7-92 30-9-92 16330-L 0.50 13-1-92 30-9-92 1052-R 0.50 13-1-92 30-9-92
25100-1 4.50 13-1-92 30-9-92 24-25-R 0.50 13-7-92 30-9-92
Bath DiSty
Jhinda Minor
Salar Minor/ Mian Ali Br.
1 15914 4752-L 0 . 1 5 6-1-92 30-9-92 6511-R 1.00 6-1-92 30-9-92
01-08-R 0.50 6-7-92 30-9-92
9 11309 6008-L 0.50 14-1-92 30-9-92
9 11134 58815-L 1.50 6-1-92 30-9-92 (Mian Alil
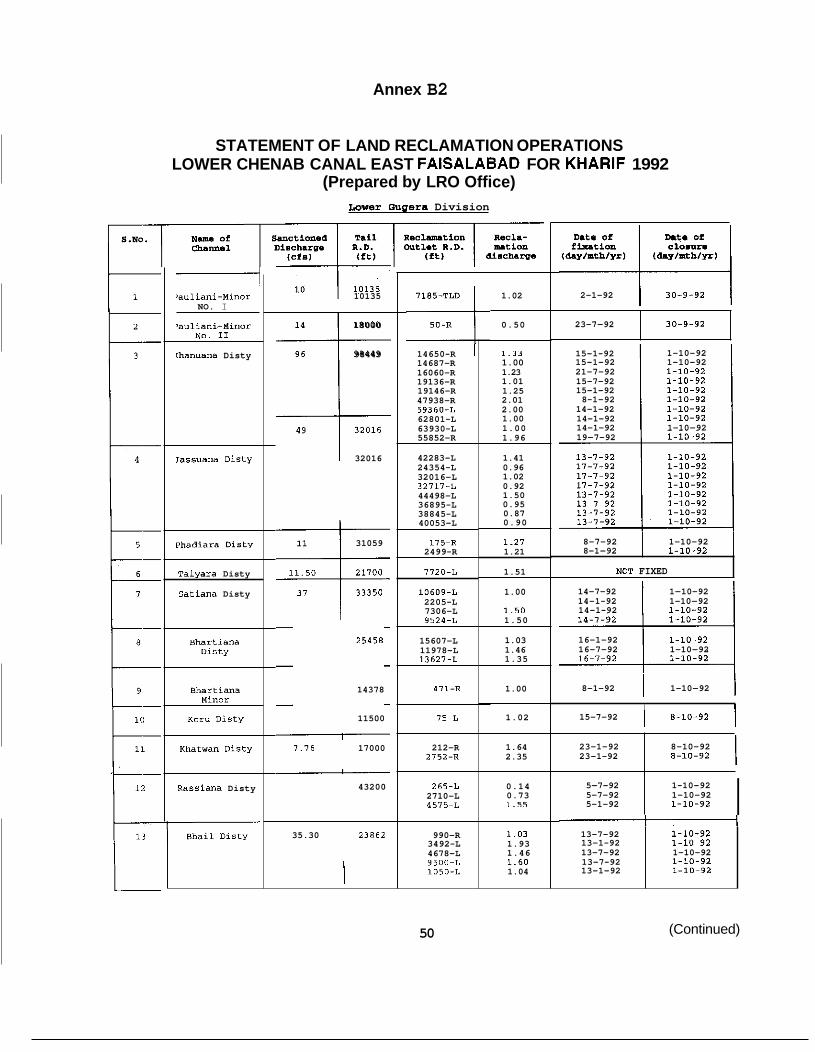
Annex B2
23-7-92
STATEMENT OF LAND RECLAMATION OPERATIONS LOWER CHENAB CANAL EAST FAISALABAD FOR KHARIF 1992
(Prepared by LRO Office) Lower (hlgera Division
30-9-92
14650-R 1 14687-R 16060-R 19136-R 19146-R 47938-R 59360-1 62801-L 63930-L 55852-R
8-7-92 8-1-92
1-10-92 1-10-92
13-7-92 13-1-92 13-7-92 13-7-92 13-1-92
1-10-92 1-10-92 1-10-92 1-10-92 1-10-92
I 7 10135 i 2-1-92 30-9-92 'auliani-Minor NO. I I 1.02
18000 q- 98449
0.50
1.33 1.00 1.23 1.01 1.25 2.01 2.00 1.00 1.00 1.96
1.41 0.96 1.02 0.92 1.50 0.95 0.87 0.90
1.21 1.21
1.51
1.00
1.50 1.50
1.03 1.46 1.35
1.00
1.02
'auliani-Minor NO. I1
ihanuana Disty 1-10-92 1-10-92 1-10-92 1-10-92 1-10-92 1-10-92 1-10-92 1-10-92 1-10-92
15-1-92 15-1-92 21-7-92 15-7-92 15-1-92 8-1-92
14-1-92 14-1-92 14-1-92 19-7-92 t 32016 ,assuana DiStY 42283-L
24354-L 32016-L 32717-L 44498-L 36895-L 38845-L 40053-L
Phadiara Disty 175-R 2499-R
7120-L
31059
NOT FIXED ~alyara Disty
Satiana Disty
37 I 33350
14-7-92 1-10-92 14-1-92 1-10-92 14-1-92 1-10-92
10609-1 2205-L 7306-L 9524-11
15607-L 11978-L 13621-L
Bhartiana DiStY
16-1-92 1-10-92 16-7-92 1-10-92
J545R
14378
11500
1.76 17000
43200
1 8-1-92 1 1-10-92 411-R Bhartiana Minor
1 15-7-92 1 8-10-92 75-L Kor" DiStY
212-R 2152-R
1.64 2.35
23-1-92 23-1-92 I 8-10-92
8-10-92 Khatwan DiSty
2655-L 2710-L 4575-L
0.14 0.73 1.55
Rassiana Disty 5-7-92 5-7-92 5-1-92
1-10-92 1-10-92 1-10-92 I
35.30 23862 990-R 3492-L 4678-L 9500-L 1050-L
1.03 1.93 1.46 1.60 1.04
(Continued) 50
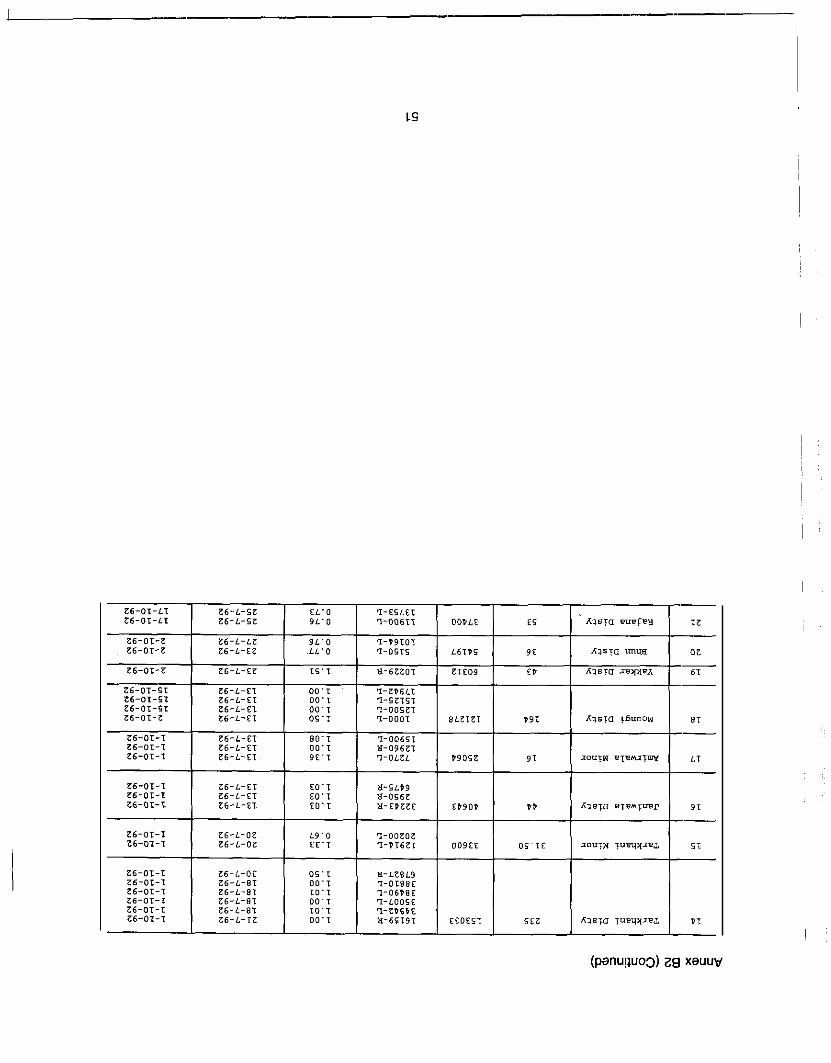
i i
I
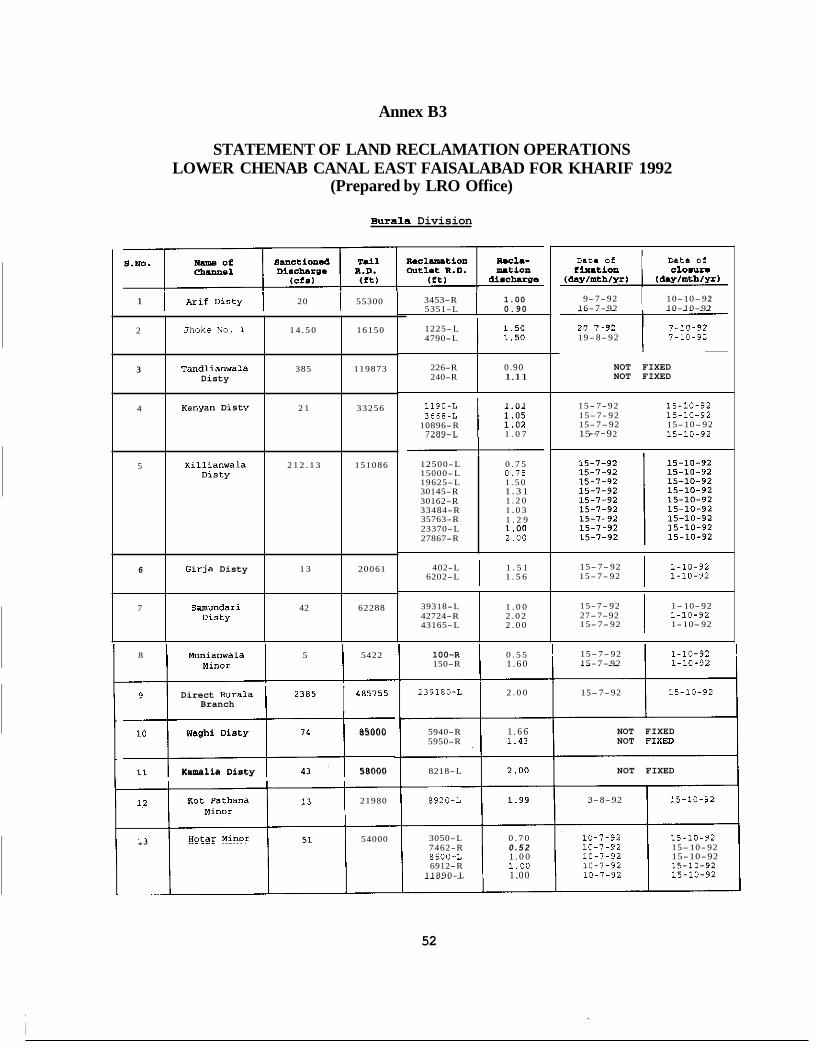
Annex B3
STATEMENT OF LAND RECLAMATION OPERATIONS LOWER CHENAB CANAL EAST FAISALABAD FOR KHARIF 1992
(Prepared by LRO Office)
BUrIla Division
3453-R 5351-L
1 1 Arif Oisty I 20 I 55300 1.00 0.90
2
3
4
5
6
7
8 Munianwala 5 5422 Minor
Jhoke NO. 1 1 4 . 5 0 16150
Tandlianwala 385 119873 Disty
Kanyan DiBtY 2 1 33256
K i l l i a n w a l a 2 1 2 . 1 3 151086 msty
Girja Disty 1 3 20061
Samundari 42 62288 msty
I 2385 I 485755
Direct BUrala Branch
12500- L 15000-L 19625-L 30145-R 30162-R 33484-R 35763-R 23370-L 27867-R
Waghi DiSty 85000 : Kamalia Disty 58000
0 . 7 5 0 . 7 5 1 . 5 0 1 . 3 1 1 . 2 0 1 . 0 3 1 . 2 9 1.00 2 . 0 0
KOt Fathana 21980 Minor
Hotar MinDr 54000
1225-L 4790-L
226-R 240-R
0 .90 1.11
1 1 9 0 - 1 1 . 0 1 3668 -1
10896-R 7289-L 1 . 0 7
402-L 1 . 5 1 6202-L 1 1 . 5 6
39318-L 42724-R 43165-L
1 . 0 0 2 . 0 2 2 . 0 0
100-R 150-R
0 . 5 5 1 . 6 0
239180-L I 2 . 0 0
5940-R 1 . 6 6 5950-R
8218-L
8920-L
3050-L 0 . 7 0 7462-R 0 . 5 2 8600-L 1 . 0 0 6912-R 1.00
11890- L 1.00
52
Mt. O f Dlt. of. eLutim ElO.UlX
9-7-92 10-10- 92 16-7-92 10-10-92
20-7-92 7-10-92 19- 8- 92 7-10-92
NOT FIXED NOT FIXED
15- 7- 92 15-10-92 15- 7- 92 15-10-92 15-7- 92 15-10- 92 15 - 7 - 9 2 15-10-92
15- 7- 92 1-10-92 15- 7- 92 1-10-92 1 15- 7- 92 1- 10-92 27-7-92 1-10-92 15- 7- 92 1-10- 92 1 15- 7- 92 1-10-92 15-7- 92 1-10-92
15- 7-92 15-10-92
NOT FIXED NOT FIXED
NOT FIXED
3-8-92 15-10-92
10-7-92 15-10-92 10-7-92 15- 10-92 10-7-92 15-10-92 10-7-92 15-10-92 10-7-92 15 -10 -92
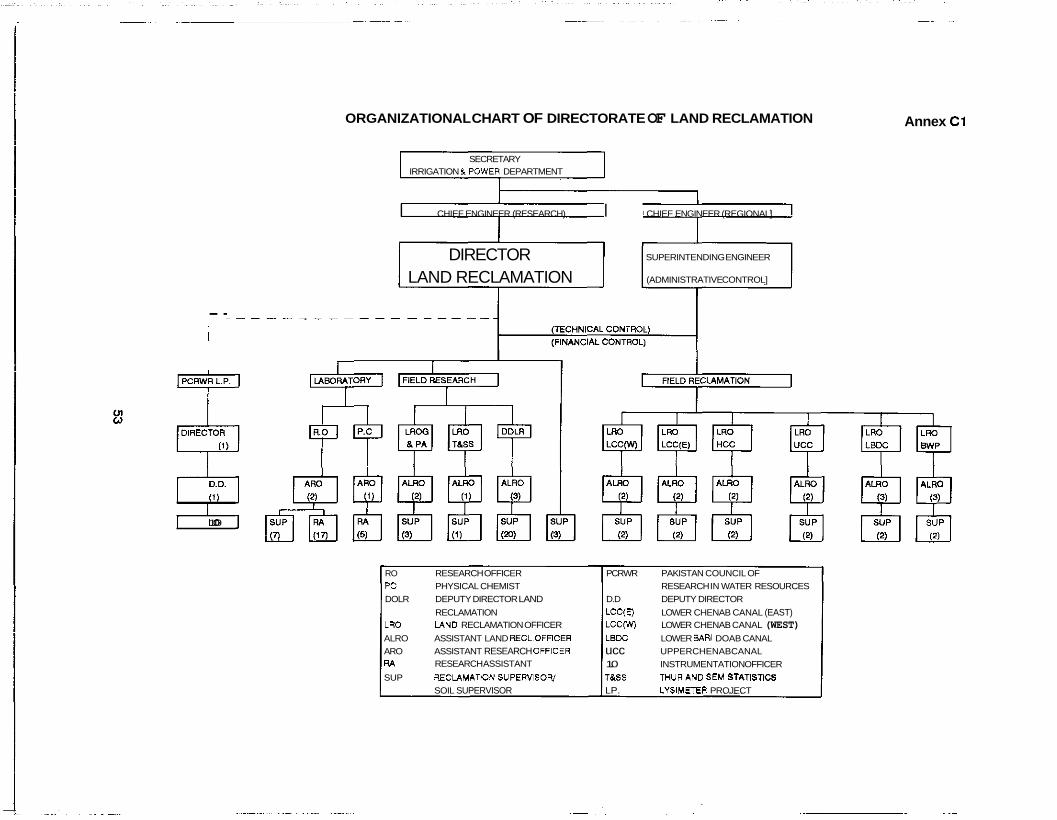
- -
PCRWR L.P. 9
Fj 1.0
ORGANIZATIONAL CHART OF DIRECTORATE OF LAND RECLAMATION Annex C1
SECRETARY IRRIGATION &POWER DEPARTMENT
I CHIEF ENGINEER (RESEARCH) I CHIEF ENGINEER (REGIONAL]
DIRECTOR SUPERINTENDING ENGINEER
LAND RECLAMATION (ADMINISTRATIVE CONTROL]
RO RESEARCH OFFICER PCRWR PAKISTAN COUNCIL OF PC PHYSICAL CHEMIST DOLR DEPUTY DIRECTOR LAND D.D DEPUTY DIRECTOR
RESEARCH IN WATER RESOURCES
RECLAMATION LCC(E) LOWER CHENAB CANAL (EAST) LRO LAND RECLAMATION OFFICER L C C O LOWER CHENAB CANAL (WEST) ALRO ASSISTANT LAND RECL.OFRCER LsDC LOWER M R I DOAB CANAL ARO ASSISTANT RESEARCH OWlCER ucc UPPERCHENABCANAL RA RESEARCH ASSISTANT 1.0 INSTRUMENTATION OFFICER SUP RECLAMATDN SUPERWSOW T&SS THURANO SEM srmsncs
SOIL SUPERVISOR LP. LYSIMETER PROJECT
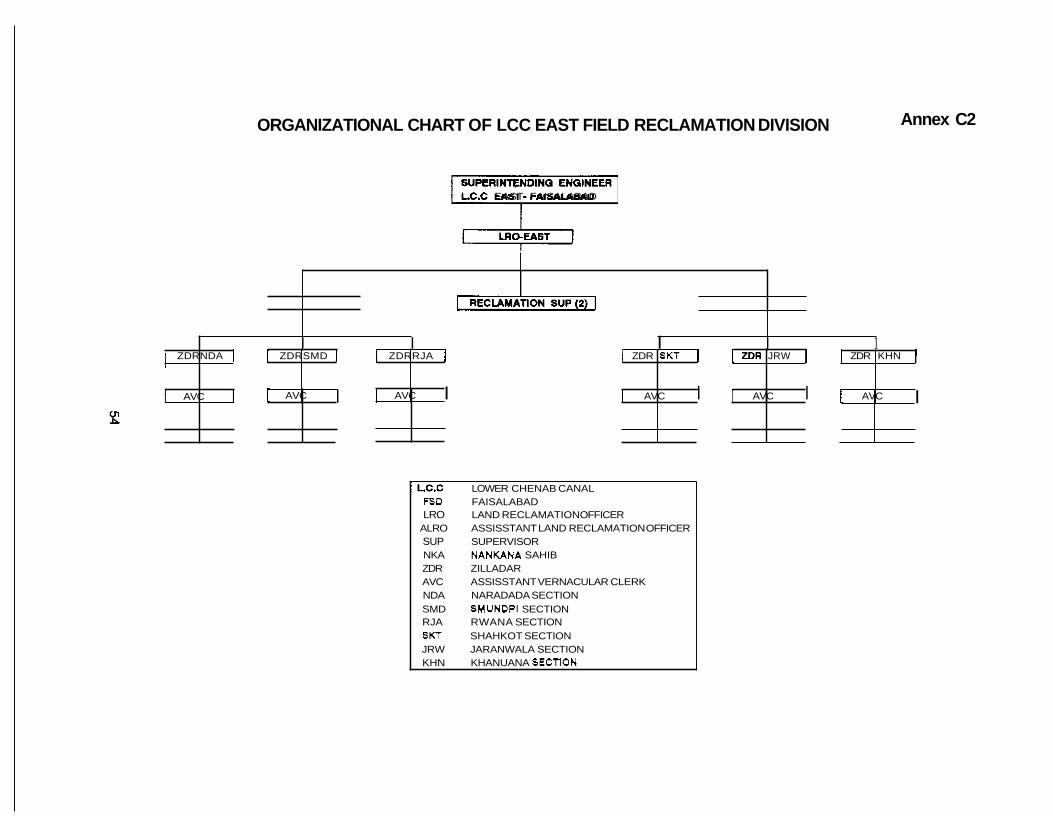
ORGANIZATIONAL CHART OF LCC EAST FIELD RECLAMATION DIVISION
I
I AVC
L.CC EAST- FAISALABAD
I I I I 1
I I I I AVC I I AVC I 1 AVC
ZDRNDA I I ZDRSMD 1 I ZDRRJA I 1 ZDR SKT I I ZDR JRW I I ZDR KHN I
[ AVC I AVC I
Annex C2
-L.C.C LOWER CHENAB CANAL FSD FAISALABAD LRO LAND RECLAMATION OFFICER
ALRO ASSISSTANT LAND RECLAMATION OFFICER SUP SUPERVISOR NKA NANKANA SAHIB ZDR ZILLADAR AVC ASSISSTANT VERNACULAR CLERK NDA NARADADA SECTION SMD SMUNDRI SECTION RJA RWANA SECTION SlCT SHAHKOT SECTION JRW JARANWALA SECTION KHN KHANUANA SECTION
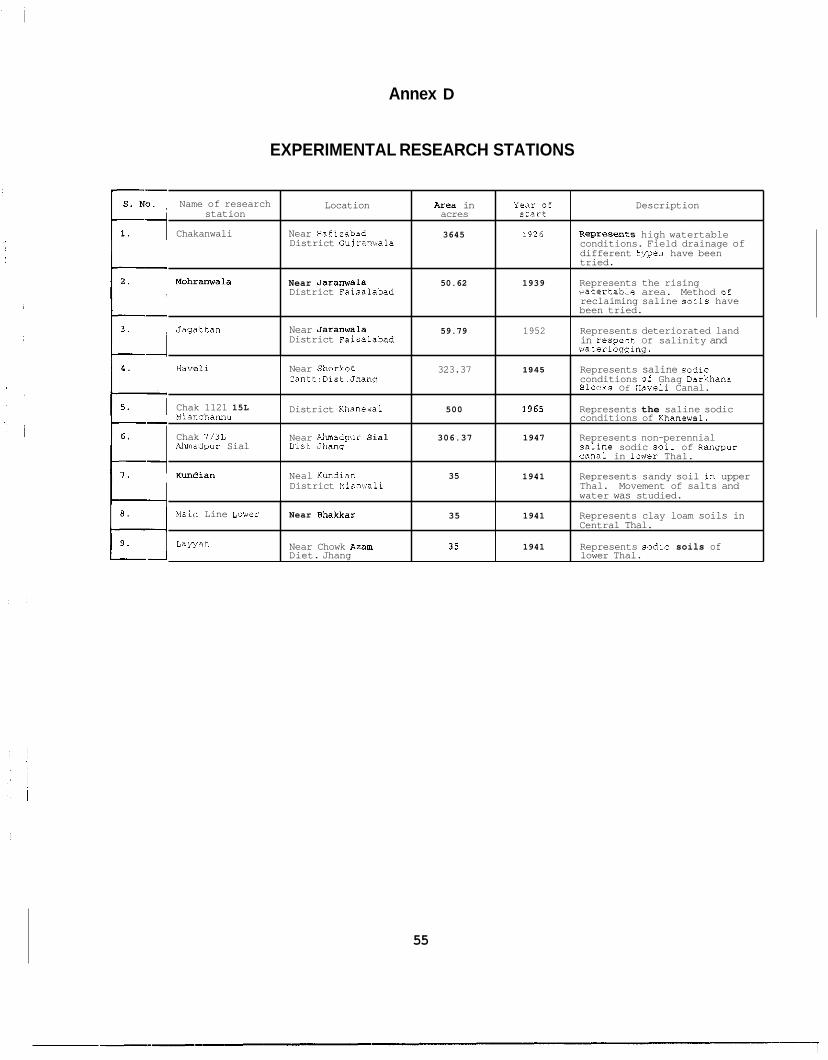
Annex D
Name of research station
Chakanwali
Mohranwala
Jagattan
EXPERIMENTAL RESEARCH STATIONS
Location Are- in Year of Description acres start
3645 1926 RePreaents high watertable Near Hafizabad District Gujranwala conditions. Field drainage of
different tmes have been tried.
Near Jaranwala 50.62 1939 Represents the rising District Faisalabad watertable area. Method o€
reclaiming saline soils have been tried.
59.79 1952 Represents deteriorated land Near Jaranwala District Faisalabad in respect Of salinity and
waterlogging.
Haveli 323.37 1 9 4 5 Represents saline SOdiC
Block9 Of Haveli Canal.
Near Shorkot Cantt:Dist.Shang conditions a€ Ghag Darkhana
Chak 1121 15L Mianchannu
Chak 713L Ahmadpur Sial
District Khanewal 500 1965 Represents the saline sodic
Near Ahmadpur Sial 306.37 1947 Represents non-perennial DiSt Jhang
conditions of Khanewal.
saline sodic soil of Rangpur Canal in lower Thal.
K"ndian
55
1941 Represents sandy soil in upper Neal Kundian 35 District Mianwali Thal. Movement of salts and
water was studied.
Main Line Lower
Lamah
35 1941 Represents clay loam soils in Near Bhakkar Central Thal.
Near Chowk Aaam 35 1941 Represents sadic soils of Diet. Jhang lower Thal.
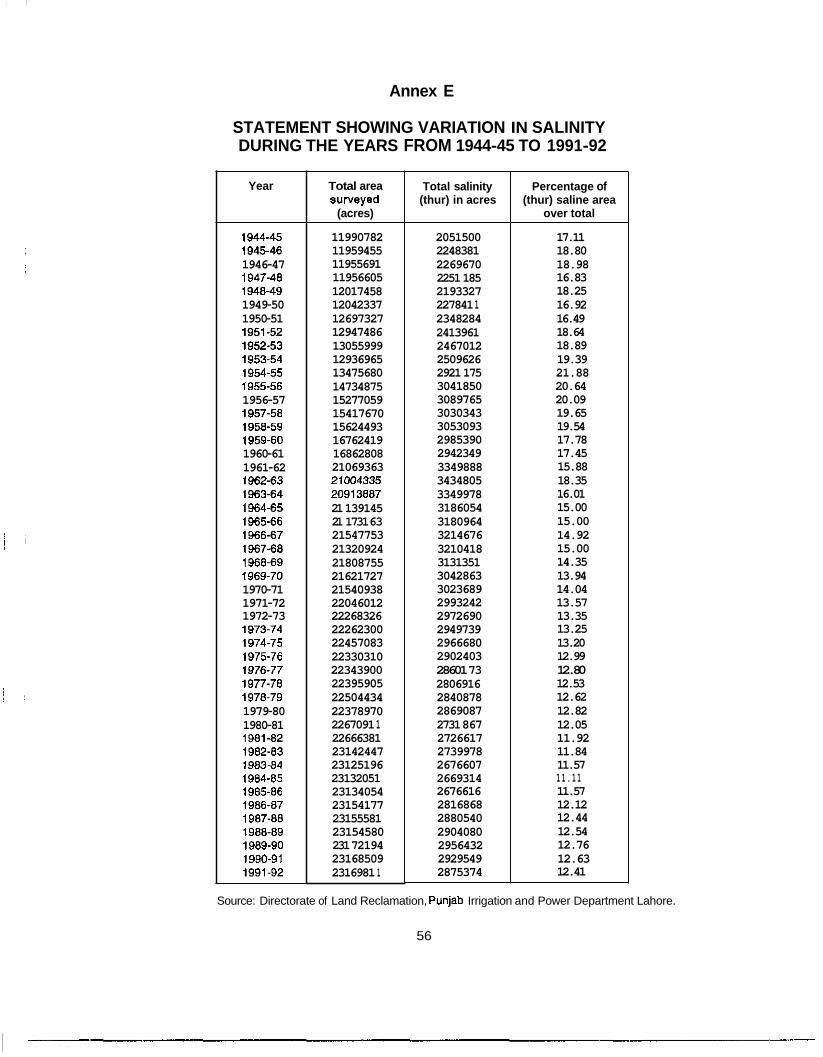
Annex E
STATEMENT SHOWING VARIATION IN SALINITY DURING THE YEARS FROM 1944-45 TO 1991-92
Year
1944-45 1945-46 1946-47 1947-48 1948-49 1949-50 1950-51 1951-52 1952-53 1953-54 1954-55 1955-56 1956-57 1957-56 1958-59 1959-60 1960-61 1961-62 1962-63 1963-64 1964-65 1965-66 1966-67 1967-68 1968-69 1989-70 1970-71 1971-72 1972-73 1973-74 1974-75 1975-76 1978-77 1977-76 1978-79 1979-80 1980-81 1961-82 1962-83 1983-84 1984-85 1965-66 1966-67 1987-88 1986-89 1989-90 1990-91 1991-92
Total area SUNeyed
(acres)
11990782 11959455 11955691 11956605 12017458 12042337 12697327 12947486 13055999 12936965 13475680 14734875 15277059 15417670 15624493 16762419 16862808 21069363 21004335 20913887 21 139145 21 1731 63 21547753 21320924 21808755 21621727 21540938 22046012 22268326 22262300 22457083 22330310 22343900 22395905 22504434 22378970 2267091 1 22666381 23142447 23125196 23132051 23134054 23154177 23155581 23154580 231 72194 23168509 2316981 1
Total salinity (thur) in acres
2051500 2248381 2269670 2251 185 2193327 227841 1 2348284 2413961 2467012 2509626 2921 175 3041850 3089765 3030343 3053093 2985390 2942349 3349888 3434805 3349978 3186054 3180964 3214676 3210418 3131351 3042863 3023689 2993242 2972690 2949739 2966680 2902403 28601 73 2806916 2840878 2869087 2731 867 2726617 2739978 2676607 2669314 2676616 2816868 2880540 2904080 2956432 2929549 2875374
Percentage of (thur) saline area
over total
17.11 18.80 18.98 16.83 18.25 16.92 16.49 18.64 18.89 19.39 21.88 20.64 20.09 19.65 19.54 17.78 17.45 15.88 18.35 16.01 15.00 15.00 14.92 15.00 14.35 13.94 14.04 13.57 13.35 13.25 13.20 12.99 12.80 12.53 12.62 12.82 12.05 11.92 11.84 11.57 11.11 11.57 12.12 12.44 12.54 12.76 12.63 12.41
Source: Directorate of Land Reclamation, Punjab Irrigation and Power Department Lahore.
56
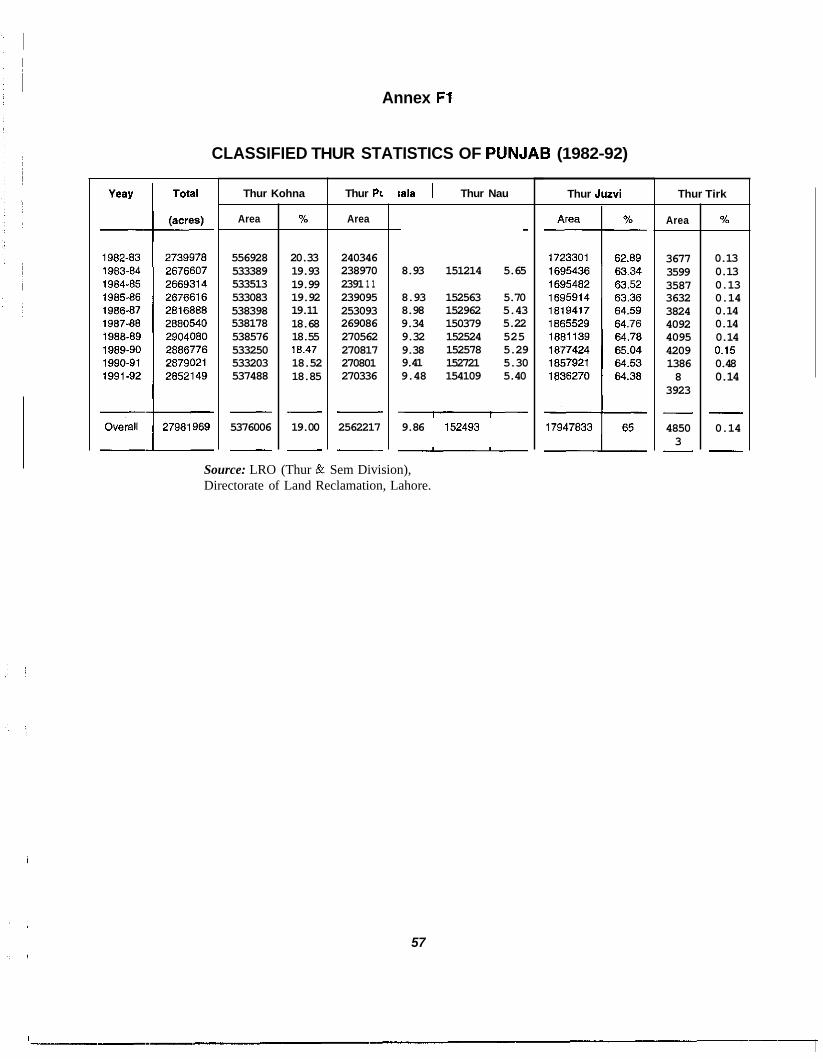
i
I
Annex F1
CLASSIFIED THUR STATISTICS OF PUNJAB (1982-92)
Tofai Thur Kohna
Area
556928 533389 533513 533083 538398 538178 538576 533250 533203 537488
- 5376006
-
%
20.33 19.93 19.99 19.92 19.11 18.68 18.55 18.47 18.52 18.85
- 19.00
-
Thur PI
Area
240346 238970 2391 1 1 239095 253093 269086 270562 270817 270801 270336
- 2562217
-
lala I Thur Nau
8.93 151214 5.65
8.93 152563 5.70 8.98 152962 5.43 9.34 150379 5.22 9.32 152524 525 9.38 152578 5.29 9.41 152721 5.30 9.48 154109 5.40
9.86 I52493
Source: LRO (Thur & Sem Division), Directorate of Land Reclamation, Lahore.
57
Thur Juzvi Thur Tirk
Area
3677 3599 3587 3632 3824 4092 4095 4209 1386 8
3923
- 4850 3 -
%
0.13 0.13 0.13 0.14 0.14 0.14 0.14 0.15 0.48 0.14
- 0.14
-

Annex F2
THUR STATISTICS OF LCC EAST RECLAMATION DIVISION FAISALABAD
YEAR AREA THUR THUR THUR THUR THUR THUR TOTAL %AGE SURVEYED KOHNA PUNJSALA NAU J U N l TlRK RECL. THUR THUR
_ _ _ _ _ _ _ _ _ _ _ _ _ _ _______________-__ __------------ -------------- -------------- -----_________ ---____------- --______------ ---__--------- -____________- 1982-83 1854568 28313 36452 18859 171795 71 9 7430 263568 14.21 198'3-84 1854568 28313 36452 18859 171795 71 9 7430 263568 14.21 1984-85 1854568 28313 36452 18859 171795 71 9 7430 263568 14.21 1985-86 1854568 28313 36452 18859 171795 71 0 7430 263568 14.21 1986-87 1854568 28313 36452 18859 171795 71 9 7430 263568 14.21 1987-88 1854568 28313 36452 18859 171795 71 9 7430 263568 14.21 1980-89 1854568 28313 36452 18859 171795 71 9 7430 263568 14.21 198490 1854568 22254 36416 18803 171915 71 9 7401 257508 13.89 1990-91 1854568 22254 36416 18803 171915 71 9 7401 257508 13.89 1991 -92 i856sa 28332 3 ~ 5 2 21460 181578 71 8 7380 275920 14.86
UI 0)
______________ __________________ ___.__-_______ ____--___--___ ------________ -----__-______ ---___________ _____-_______- --______-_-___ -_____________ Source : Annual Data Statements by LRO (Thur & Sern)
Directorate of Land Reclamation Punjab, Lahore.
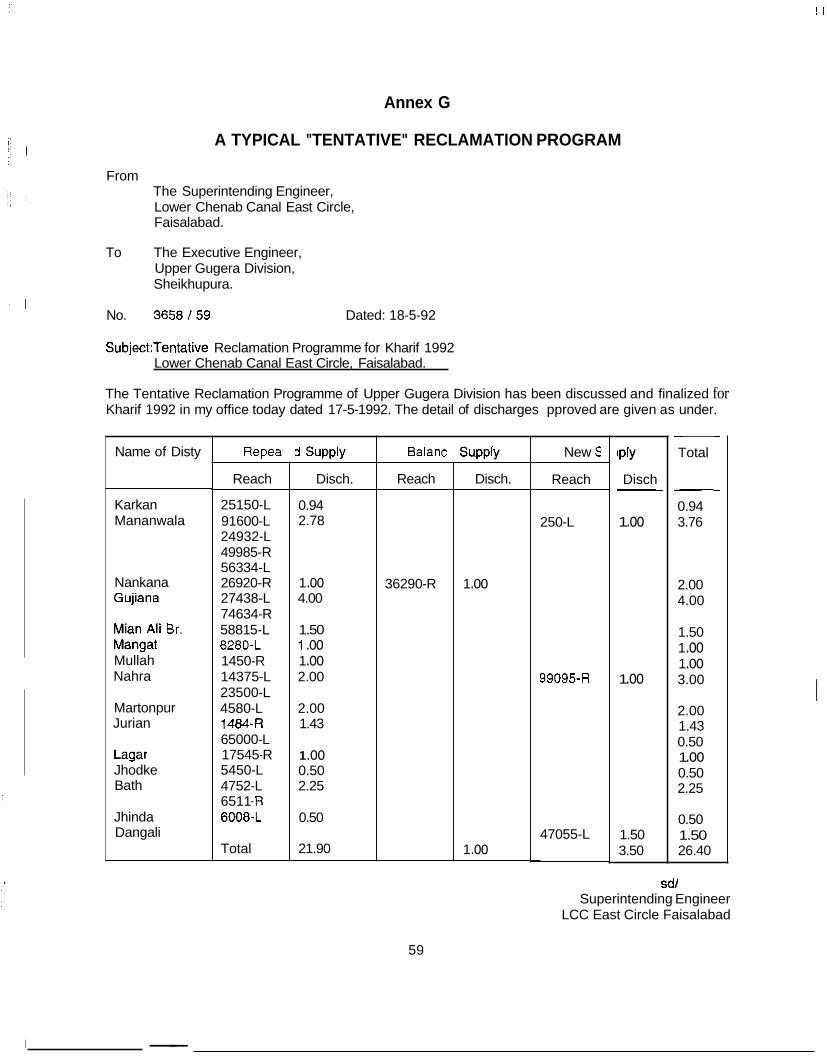
! I
Annex G
A TYPICAL "TENTATIVE" RECLAMATION PROGRAM
From The Superintending Engineer, Lower Chenab Canal East Circle, Faisalabad.
To The Executive Engineer, Upper Gugera Division, Sheikhupura.
No. 3658/59 Dated: 18-5-92
SubjectTentative Reclamation Programme for Kharif 1992 Lower Chenab Canal East Circle, Faisalabad.
The Tentative Reclamation Programme of Upper Gugera Division has been discussed and finalized for Kharif 1992 in my office today dated 17-5-1992. The detail of discharges pproved are given as under.
~~
Name of Disty
Karkan Mananwala
Nankana Gujiana
Mian Ali Br. Mangat Mullah Nahra
Martonpur Jurian
Lagar Jhodke Bath
Jhinda Dangali
Repea
Reach
25150-L 91600-L 24932-L 49985-R 56334-L 26920-R 27438-L 74634-R 5881 5-L 8280-L 1450-R 14375-L 23500-L 4580-L 14844 65000-L 17545-R 5450-L 4752-L 651 1 -R 6008-L
Total
3 Supply
Disch.
0.94 2.78
1 .oo 4.00
1.50 1 .oo 1 .oo 2.00
2.00 1.43
1 .oo 0.50 2.25
0.50
21.90
Balanc
Reach
36290-R
59
Supply
Disch.
1 .oo
1 .oo
New 5
Reach
250-L
9909543
47055-L
lPlY
Disch - 1 .oo
1 .oo
1.50 3.50
- Total
- 0.94 3.76
2.00 4.00
1.50 1 .oo 1 .oo 3.00
2.00 1.43 0.50 1 .oo 0.50 2.25
0.50 1.50 26.40
sdl Superintending Engineer
LCC East Circle Faisalabad
-- I
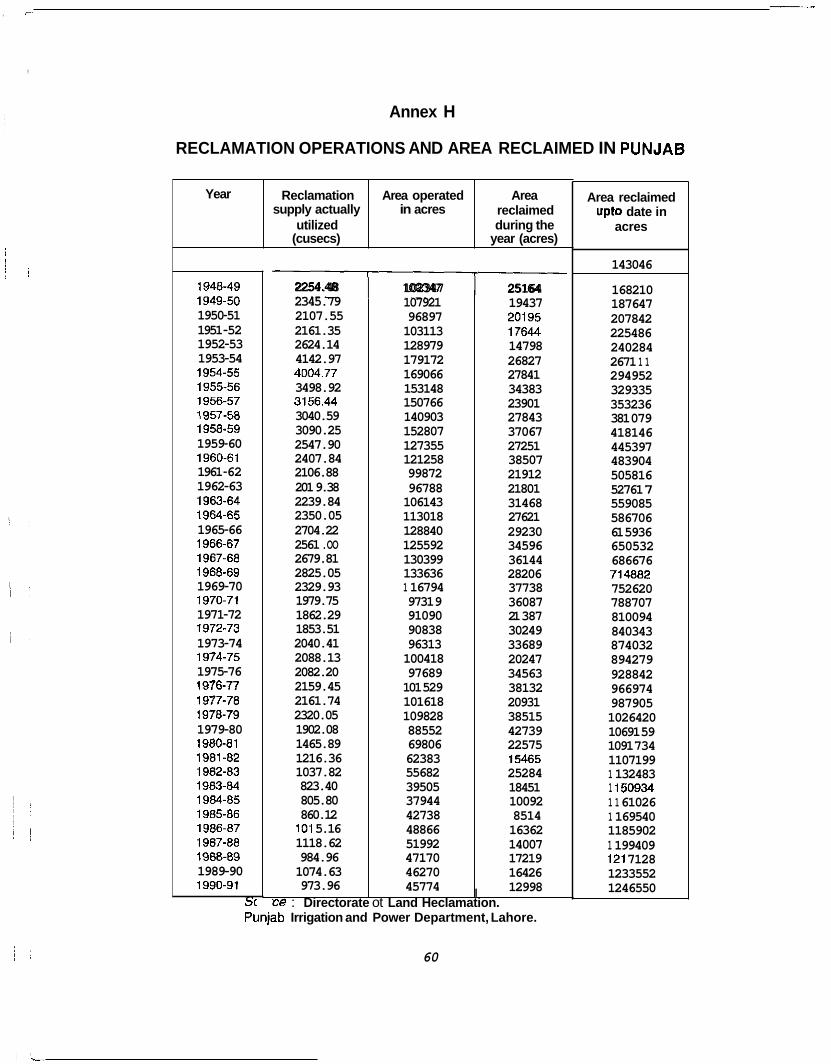
_i_
, c
,
Year
Annex H
RECLAMATION OPERATIONS AND AREA RECLAIMED IN PUNJAB
Reclamation Area operated Area reclaimed
utilized during the (cusecs) year (acres)
supply actually in acres
:
ce : Directorate ot Land Heclamation.
1948-49 1949-50 1950-51 1951 -52 1952-53 1953-54 1954-55 1955-56 1956-57 1957-58 1958-59 1959-60 1960-61 1961 -62 1962-63 1963-64 1964-65 1965-66 1966-67 1967-68 1968-69 1969-70 1970-71 1971-72 1972-73 1973-74 1974-75 1975-76 1976-77 1977-78 1978-79 1979-80 1980.81 1981-82 1982-83 1983-84 1984-65 1985-86 1986-67 1987-88 1988-89 1989-90 1990.91
S( I
2254.48 2345.79 2107.55 2161.35 2624.14 4142.97 4004.77 3498.92 3156.44 3040.59 3090.25 2547.90 2407.84 2106.88 201 9.38 2239.84 2350.05 2704.22 2561 .OO 2679.81 2825.05 2329.93 1979.75 1862.29 1853.51 2040.41 2088.13 2082.20 2159.45 2161.74 2320.05 1902.08 1465.89 1216.36 1037.82 823.40 805.80 860.1 2 101 5.16 1118.62 984.96 1074.63 973.96
102347 107921 96897 103113 128979 179172 169066 153148 150766 140903 152807 127355 121258 99872 96788 106143 113018 128840 125592 130399 133636 1 16794 9731 9 91090 90838 96313 100418 97689 101 529 101618 109828 88552 69806 62383 55682 39505 37944 42738 48866 51992 47170 46270 45774
25164 19437 20195 17644 14798 26827 27841 34383 23901 27843 37067 27251 38507 21912 21801 31468 27621 29230 34596 36144 28206 37738 36087 21 387 30249 33689 20247 34563 38132 20931 38515 42739 22575 15465 25284 18451 10092 8514 16362 14007 17219 16426 12998
Punjab Irrigation and Power Department, Lahore.
60
Area reclaimed upto date in
acres
143046
168210 187647 207842 225486 240284 2671 1 1 294952 329335 353236 381 079 418146 445397 483904 505816 52761 7 559085 586706 61 5936 650532 686676 714882 752620 788707 810094 840343 874032 894279 928842 966974 987905 1026420 10691 59 1091 734 1107199 1 132483 1 150934 1 1 61026 1 169540 1185902 1 199409 121 7128 1233552 1246550