institutional presentation december 2016...1 overview of the bank •gnb sudameris is a leading,...
TRANSCRIPT

Institutional
PresentationDECEMBER 2016

Presentación
Institucional
2
1 Overview of the Bank
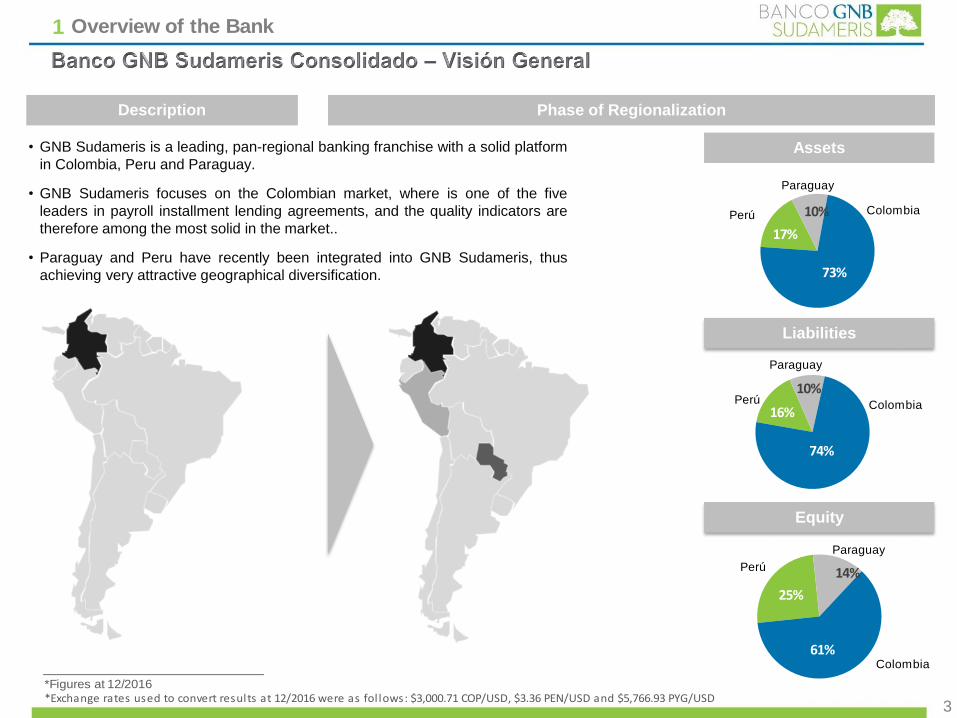
• GNB Sudameris is a leading, pan-regional banking franchise with a solid platform
in Colombia, Peru and Paraguay.
• GNB Sudameris focuses on the Colombian market, where is one of the five
leaders in payroll installment lending agreements, and the quality indicators are
therefore among the most solid in the market..
• Paraguay and Peru have recently been integrated into GNB Sudameris, thus
achieving very attractive geographical diversification.
3
Description Phase of Regionalization
Assets
Equity
Liabilities
17%
10%
73%
Paraguay
ColombiaPerú
16%
10%
74%
Paraguay
ColombiaPerú
25%
14%
61%
Paraguay
Colombia
Perú
*Figures at 12/2016*Exchange rates used to convert results at 12/2016 were as fol lows: $3,000.71 COP/USD, $3.36 PEN/USD and $5,766.93 PYG/USD

1 Overview of the Bank
2,378
68%
24%
8%
Colombia1,612
Perú565
Paraguay201
Paraguay
140
86%
9%5%
Colombia 120
Perú13
Paraguay7
4,13059%26%
16%
Colombia 2,420
Perú1,066
Paraguay 644
5,525
67%
21%
13%
Colombia3,674
Perú1,156
Paraguay695
9,041
73%
16%
10%
Colombia 6,621
Perú1,488
Paraguay 932
•In 2013, GNB Sudameris
completed the acquisition of
HSBC Paraguay and HSBC
Peru.
•In 2014 GNB Sudameris
completed the acquisition of
HSBC Colombia, creating
Banco GNB Colombia.
•In October 2014, Banco GNB
Colombia was merged into
GNB Sudameris.
763 61%25%
14%
Colombia469
Perú191
Paraguay104
4
Loans (US $million) Deposits (US $million)
Equity (US $million) Employees Branches
Total Assets (US $million)
*Figures at 12/2016*Exchange rates used to convert results at 12/2016 were as fol lows: $3,000.71 COP/USD, $3.36 PEN/USD and $5,766.93 PYG/USD

1 Overview of the Bank
1920
2010
2011
2013
2005
2008
2014
2015
FoundationBANCO
FRANCÉS E ITALIANO
Merger of BANCO SUDAMERIS
with BANCO TEQUENDAMA
BANCO GNB SUDAMERIS S.A.
Merger of FIDUCIARIA SUDAMERIS
with FIDUCIARIA TEQUENDAMA, now
SERVITRUST GNB SUDAMERIS
Gilex Holding BV
acquires majority
holding in
SUDAMERIS
2003
2004
Sudameris acquires BANCO TEQUENDAMA from
CREDICORP
Sudameris acquires majority
holding in SERVIBANCA
GNB SUDAMERIS acquires
COMISIONISTA DE BOLSA
SUMA VALORES S.A., now
SERVIVALORES GNB SUDAMERIS
Merger of SERVIVALORES GNB
SUDAMERIS and
NACIONAL DE VALORES
GNB SUDAMERIS acquires
COMISIONISTA DE BOLSA
NACIONAL DE VALORES
Incorporation of
SOCIEDAD DE TECNOLOGÍA
SERVITOTAL GNB SUDAMERIS
2012
Agreement signed to acquire
HSBC Colombia, Peru & Paraguay
GNB SUDAMERIS acquires
operations of HSBC
in Peru and Paraguay
GNB SUDAMERIS acquires the
operation of HSBC COLOMBIA
(Bank and Trust companies)
Merger of BANCO GNB COLOMBIA into BANCO GNB SUDAMERIS
Merger of SERVITRUST GNB
SUDAMERIS and FIDUCIARIA GNB
Subordinated bonds issued
Senior bonds issued
2016
Corporate image change

1 Overview of the Bank
Banco GNB
Sudameris94.99%
Otros 5.01%
ServivaloresServivalores
Banco GNB
Sudameris S.A.99.99%
Otros 0.01%
Banco GNB PerúBanco GNB Perú
Banco GNB
Sudameris88.49%
Otros 11.51%
ServibancaServibanca
Banco GNB
Sudameris97.34%
Otros 2.66%
ServitrustServitrust
AFFILIATES IN COLOMBIA AFFILIATES OUTSIDE COLOMBIA
Banco GNB
Sudameris S.A.99.96%
Otros 0.04%
Banco GNB ParaguayBanco GNB Paraguay
Banco GNB
Sudameris94.80%
Otros 5.20%
ServitotalServitotal
6
Gilex Holding B.V. 94.72%
Banco de Sabadell 4.99%
Otros 0.29%
Banco GNB SudamerisBanco GNB Sudameris
Others
Others
Others
Others
Others
Others
Others

2 National and Regional Economies
Sources: DANE, Banco de la República, FMI, Bloomberg and Banco GNB Sudameris internal calculations
GDP total (USD BN) Inflation (%)
Population (million)
380 378
292 299
202 203 192 201
29 31 28 29
2013 2014 2015 2016Colombia Peru Paraguay
1.9
3.7
6.8
5.7
2.8
3.2
4.4
3.22.7
4.2
3.1
3.9
2013 2014 2015 2016Colombia Peru Paraguay
47.3 47.8 48.2 49.0
30.6 31.0 31.4 31.8
6.5 6.6 6.6 6.8
2013 2014 2015 2016Colombia Peru Paraguay
7

3 History and Structure
Millones de COP dic-14 dic-15 dic-16 VAR %
Total Activo 17,501,377 19,620,629 19,866,911 1.3%
Inversiones 6,221,134 6,053,078 5,720,760 -5.5%
Cartera de Crédito 6,808,995 7,330,880 7,260,679 -1.0%
Depósitos 11,264,333 11,235,268 11,025,942 -1.9%
Créditos de Bancos 1,187,612 1,179,782 1,124,359 -4.7%
Patrimonio 1,140,285 1,252,492 1,406,229 12.3%
Utilidad 117,318 150,061 171,474 14.3%
Millones de USD dic-14 dic-15 dic-16 VAR %
Total Activo 7,315 6,230 6,621 6.3%
Inversiones 2,600 1,922 1,906 -0.8%
Cartera de Crédito 2,846 2,328 2,420 4.0%
Depósitos 4,708 3,567 3,674 3.0%
Créditos de Bancos 496 375 375 0.0%
Patrimonio 477 398 469 17.8%
Utilidad 49 48 57 19.9%
Banco GNB Sudameris - Individual
8
COP million
Total Assets
Investments
Loans
Deposits
Bank Debt.
Equity
Profit
USD million
Total Assets
Investments
Loans
Deposits
Bank Debt.
Equity
Profit

3 History and Structure
Ciudades 11 18 19 19 20 20
Empleados 930 1,011 1,114 1,517 1,607 1,612
81
106 107
133 132120
2007 2011 2013 2014 2015 dic-16
Branches Past Due Accounts
ROE Market share
2.4%2.2% 2.2%
2.3%
2.1%1.9%2.4%
3.2%
3.6%
3.9%
3.5%
3.1%3.6%
3.7% 3.6%3.6%
3.3%
3.1%
0%
1%
2%
3%
4%
5%
2007 2011 2013 2014 2015 dic-16
Cartera
Depósitos
Cartera de consumo
9
192% 193% 191% 181% 163% 190%Cobertura
de cartera
1.7% 1.6%1.5%
1.6% 1.6%1.8%
2007 2011 2013 2014 2015 dic-16
10% 11% 18% 18% 18% 18%Relación de
Solvencia
18.6%17.0%
8.7%10.3%
12.7% 12.6%
2007 2011 2013 2014 2015 dic-16
Loans
Deposits
Personal Loans
Cities
Employees
Capital
Ratio
Loan
Coverage

4 Results of Banco GNB Sudameris
dic-15 dic-16
% Activos con interés/ Activo total 91.8% 89.3%
% Gastos/ Activos productivos 1.6% 1.6%
% Partic. Cartera Sist. Banc. (*) 2.2% 1.9%
% Partic. Cartera Consumo Sist. Banc. (*) 3.4% 3.1%
% Partic. Depósitos Sist. Banc. (*) 3.8% 3.1%
% Morosidad 1.6% 1.8%
% Cartera en riesgo (B+C+D+E) 4.0% 5.9%
% Cobertura cartera 163.1% 190.4%
Roe - Equivalente año 12.7% 12.6%
Relación de Solvencia 17.5% 17.7%
% Liquidez 44.4% 43.5%
No. de filiales 6 6
Puntos de Atención 132 120
No. de ciudades 20 20
(*) Información Asobancaria a Noviembre - 2016
Performance indicators Loan indicators
10
Solvencia sep-15 dic-15 dic-16
Patrimonio Básico / APNR 9.2% 9.0% 9.7%
Patrimonio Adicional / APNR 8.9% 8.5% 8.2%
Solvencia total 18.1% 17.5% 17.9%
APNR : Activos Ponderados por Nivel de Riesgo
Cartera - Altura de Mora sep-15 dic-15 dic-16
Morosidad 1.93% 1.63% 1.81%
Moros idad: Cartera vencida / Cartera Bruta
Cartera vencida: > a 30 días
Cartera - Tramo sep-15 dic-15 dic-16
Comercial 56.9% 58.0% 55.6%
Consumo 42.6% 41.5% 43.9%
Otros 0.53% 0.52% 0.52%
Total 100.0% 100.0% 100.0%
% Interest-bearing assets / Total assets
% Expenses / Productive assets
% Share, loans in the banking system (*)
% Share, consumer loans in the banking system (*)
% Share, deposits in the banking system (*)
% Past due accounts
% Loans at risk (B+C+D+E)
% Loan coverage
Roe - Annual equivalent
Capital ratio
% Liquidity
Number of Affiliates
Service points for the public
Number of cities
Capital ratios
Tier I / RWA
Tier II / RWA
Total solvency
RWA - Risk weighted assets
Loans - aging
Past-due accounts
Past due indicator: Past-due loans/Gross loans
Past-due: >30 days
Loans - tranches
Commercial
Consumer
Other
Total

4 Results of Banco GNB Sudameris
Bogota 64 8 663 735
Cali 11 1 125 137
Medellin 10 2 97 109
Barranquilla 5 2 86 93
Cartagena 4 1 63 68
Bucaramanga 6 3 51 60
Santa Marta 3 1 25 29
Pereira 2 2 27 31
Monteria 1 1 21 23
Cucuta 2 0 18 20
Pasto 1 0 18 19
Villavicencio 1 0 16 17
Manizales 2 2 12 16
Armenia 1 0 16 17
Tunja 2 0 13 15
Neiva 1 0 13 14
Popayan 1 1 11 13
Ibague 1 0 10 11
Buenaventura 1 0 7 8
Yopal 1 0 7 8
Otras ciudades 0 0 1,037 1,037
Total 120 24 2,336 2,480
TotalCiudadPuntos Conv.
Libranzas
Cajeros
ServibancaAgencias*
Barranquilla
Santa Marta
Cartagena
Ibagué
Armenia
Pereira
Manizales
Bogotá
Cali
Popayán
Bucaramanga
Cúcuta
Montería
Medellín
Villavicencio
Tunja
Pasto
Buenaventura
Funza
Neiva
Agencias: 1Puntos de Atención: 1
ATMs: 21
Córdoba
Agencias: 10Puntos de Atención: 2
ATMs: 97
Antioquia
Agencias: 12Puntos de Atención: 1
ATMs: 132
Valle del Cauca
Agencias: 1Puntos de Atención: 0
ATMs: 10
Tolima
Agencias: 6Puntos de Atención: 3
ATMs: 51
Santander
Agencias: 64Puntos de Atención: 8
ATMs: 663
Cundinamarca
Agencias: 1Puntos de Atención: 0
ATMs: 18
Nariño
Agencias: 1Puntos de Atención: 0
ATMs: 16
Quindío
Agencias: 1Puntos de Atención: 1
ATMs: 11
Cauca
Agencias: 2Puntos de Atención: 2
ATMs: 12
Caldas
Agencias: 2Puntos de Atención: 0
ATMs: 18
Santander Norte
Agencias: 2Puntos de Atención: 0
ATMs: 13
Boyacá
Agencias: 2Puntos de Atención: 2
ATMs: 27
RisaraldaAgencias: 4Puntos de Atención: 1
ATMs: 63
Bolívar
Agencias: 1Puntos de Atención: 0
ATMs: 16
Meta
Agencias: 5Puntos de Atención: 2
ATMs: 86
Atlántico
Agencias: 3Puntos de Atención: 1
ATMs: 25
Magdalena
Agencias: 0Puntos de Atención: 0
ATMs: 1.037
Otras Ciudades
Agencias: 1Puntos de Atención: 0
ATMs: 13
Huila
Agencias: 1Puntos de Atención: 0
ATMs: 7
Casanare
Yopal
Banking NetworkNetwork Map
11
TotalCity Agencies*Customer
Serv. PointATM's
* Includes Branches and Collection points
Other cities
December 2016

4 Results of Banco GNB Sudameris
Lending focused on high quality and profitability
dic-15 dic-16 nov-15 nov-16
CARTERA COMERCIAL
Calidad Cartera Vencida 1.1 0.5 2.3 2.5
Cobertura Cartera Vencida 155.7 399.8 164.3 163.8
Calidad por Riesgo 4.5 7.1 6.4 8.4
Cobertura por Riesgo 37.7 30.3 59.1 49.5
CARTERA CONSUMO
Calidad Cartera Vencida 2.4 3.4 4.6 5.2
Cobertura Cartera Vencida 170.3 150.5 131.7 127.1
Calidad por Riesgo 3.2 4.4 7.1 7.9
Cobertura por Riesgo 125.2 115.0 85.5 83.1
CARTERA TOTAL
Calidad Cartera Vencida 1.6 1.8 3.0 3.3
Cobertura Cartera Vencida 163.1 190.4 145.8 142.3
Calidad por Riesgo 4.0 5.9 6.4 7.8
Cobertura por Riesgo 67.2 58.2 68.8 60.6
Sistema(%)
GNB Sudameris
Low level of past-dues; high level of cover
Empresas 45%
Institucional 6%
Consumo 2%
Convenios 47%
2005 - dic 2016 CAGR: %
15.5
2005 - dic 2016 CAGR: %
15.5
0
1,000,000
2,000,000
3,000,000
4,000,000
5,000,000
6,000,000
7,000,000
8,000,000
2007 2008 2009 2010 2011 2012 2013 2014 2015 dic-16
2,589,8603,144,103
3,407,6203,594,577
4,445,371
5,138,5075,730,093
7,015,1397,530,9377,519,989
Mil
lon
es
de
CO
P
Evolution of loan portfolioCharacteristics
12
• Highly-diversified portfolio with low concentration of debtors
and economic sectors
• 476 agreements with a focus on high-quality,
stable sectors (armed forces, social security, pensioners)
VARIAC. % 2007 2008 2009 2010 2011 2012 2013 2014 2015 dic-16
SISTEMA 24,1% 18,6% 2,5% 23,1% 25,6% 15,6% 12.8% 16.7% 15.6% 12.6%
BANCO 18,9% 21,4% 8,4% 5,5% 23,7% 15,6% 10.5% 6.2% 7.8% 0.6%
PARTIC. 2,4% 2,5% 2,6% 2,3% 2,2% 2,2% 2.2% 2.3% 2.1% 1.9%
Figures at 12/16
Source: Asobancaria
SYSTEM
BANK
SHARE
CO
P M
illi
on
System
Lending
Agreements
Business
Consumer Corporate
COMERCIAL LOANS
Classification of past-due
Coverage of past-dues
Risk Quality
Risk Coverage
PERSONAL LOANS
Classification of past-due
Coverage of past-dues
Risk Quality
Risk Coverage
TOTAL LOANS
Classification of past-due
Coverage of past-dues
Risk Quality
Risk Coverage
(%)

4 Results of Banco GNB Sudameris
0
2,000,000
4,000,000
6,000,000
8,000,000
10,000,000
12,000,000
2007 2008 2009 2010 2011 2012 2013 2014 2015 dic-16
2,724,8293,370,258
4,085,274
4,953,117
6,073,338
7,426,956
9,283,398
11,264,33311,235,268
11,025,942
Mill
ones
de
COP
Stable, diversified funding
Cuenta Corriente
10%
Certificados de Depósito a
Término 42%
Depósitos de Ahorro
48%
Characteristics Evolution of Deposits
13
VARIAC. % 2007 2008 2009 2010 2011 2012 2013 2014 2015 dic-16
SISTEMA 15,5% 18,1% 6,9% 11,5% 20,3% 18,0% 15.3% 9.9% 7.3% 12.0%
BANCO 27,8% 23,7% 21,2% 21,2% 22,6% 22,3% 25.0% 8.9% -1.0% -6.4%
PARTIC. 2,4% 2,5% 2,9% 3,1% 3,2% 3,3% 3.6% 3.9% 3.6% 3.2%
• High level of TD renewals (85.14% at 12/16)
• Funding through agreements with costumers (average 12+
years of business)
• 473 collection agreements
• Stability and diversification of funding
SYSTEM
BANK
SHARE
CO
P M
illi
on
Term
Deposits
Current
Accounts
Savings
AccountsFigures at 12/16

5 Affiliates in Colombia
Came into being with the merger of Fiduciaria Tequendama and Fiduciaria Sudameris in 2005.
In November 2015, Servitrust GNB Sudameris S.A. Absorbed Fiduciaria GNB in a merger.
With wide experience of managing unit investment portfolios, managed trusts and escrows.
As a major strength, it offers a network of service points expanded through several banks:
BBVA, Popular, Agrario, Colpatria, Davivienda, Occidente, Citibank, Bancolombia and Bogotá
14
Millones de COP dic-14 dic-15 dic-16
Activos 35,483 58,518 59,499
Pasivos 13,414 11,791 5,980
Patrimonio 22,069 46,727 53,518
Utilidad 2,356 5,602 6,780
Millones de USD dic-14 dic-15 dic-16
Activos 14.8 18.6 19.8
Pasivos 5.6 3.7 2.0
Patrimonio 9.2 14.8 17.8
Utilidad 1.0 1.8 2.3
COP million
Assets
Liabilities
Equity
Profit
USD million
Assets
Liabilities
Equity
Profit
5 Affiliates in Colombia
Servibanca is a strategic ally of the Bank for the implementation of novel , technology-based products.
Servibanca is a member of the VISA and MASTERCARD franchises; this allows it to provide cash dispensing services for all Colombian and foreign cards.
The company is currently present in more than 620 municipalities. There are over ATMs installed across the country
2,336
15
Millones de COP dic-14 dic-15 dic-16
Activos 107,913 124,494 140,089
Pasivos 38,619 40,038 30,636
Patrimonio 69,294 84,456 109,453
Utilidad 14,217 17,814 24,990
Millones de USD dic-14 dic-15 dic-16
Activos 45.1 39.5 46.7
Pasivos 16.1 12.7 10.2
Patrimonio 29.0 26.8 36.5
Utilidad 5.9 5.7 8.3
COP million
Assets
Liabilities
Equity
Profit
USD million
Assets
Liabilities
Equity
Profit
USD million
Assets
Liabilities
Equity
Profit
5 Affiliates in Colombia
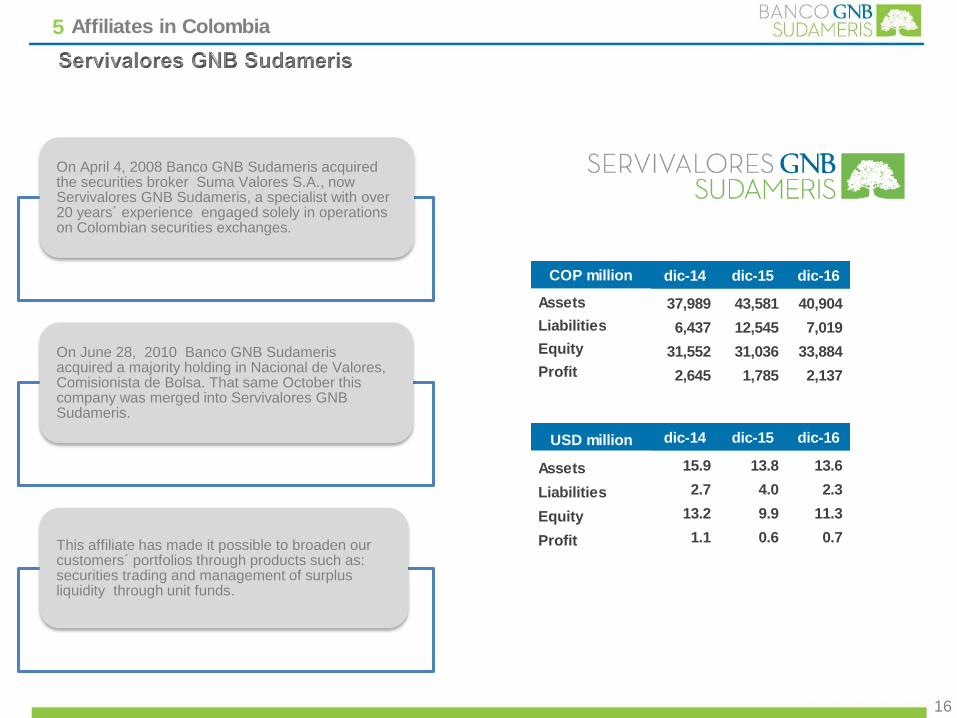
On April 4, 2008 Banco GNB Sudameris acquired the securities broker Suma Valores S.A., now Servivalores GNB Sudameris, a specialist with over 20 years´ experience engaged solely in operations on Colombian securities exchanges.
On June 28, 2010 Banco GNB Sudameris acquired a majority holding in Nacional de Valores, Comisionista de Bolsa. That same October this company was merged into Servivalores GNB Sudameris.
This affiliate has made it possible to broaden our customers´ portfolios through products such as: securities trading and management of surplus liquidity through unit funds.
16
Millones de COP dic-14 dic-15 dic-16
Activos 37,989 43,581 40,904
Pasivos 6,437 12,545 7,019
Patrimonio 31,552 31,036 33,884
Utilidad 2,645 1,785 2,137
Millones de USD dic-14 dic-15 dic-16
Activos 15.9 13.8 13.6
Pasivos 2.7 4.0 2.3
Patrimonio 13.2 9.9 11.3
Utilidad 1.1 0.6 0.7
COP million
Assets
Liabilities
Equity
Profit
USD million
Assets
Liabilities
Equity
Profit

6 Affiliates Outside Colombia
Started as Banco GNB in October 2013, following the acquisition of Banco HSBC´s operations there.
Has been operating since 2006. It has 13 Agencies (8 in Lima and 5 in Provinces).
17
Millones de Soles dic-14 dic-15 dic-16
Activos 4,369 4,921 4,995
Pasivos 3,869 4,381 4,353
Patrimonio 501 540 641
Utilidad 31 41 50
Millones de USD dic-14 dic-15 dic-16
Activos 1,467 1,443 1,488
Pasivos 1,299 1,284 1,297
Patrimonio 168 158 191
Utilidad 10 12 15
PEN million
Assets
Liabilities
Equity
Profit
USD million
Assets
Liabilities
Equity
Profit

6 Affiliates Outside Colombia
Started as Banco GNB in December 2013 following the acquisition of the operations of Banco HSBC in Paraguay.
Has operated since 1920: it has 7 Agencies in the country.
18
Millones de Guaraníes dic-14 dic-15 dic-16
Activos 3,697,294 4,776,216 5,374,094
Pasivos 3,319,415 4,286,489 4,776,088
Patrimonio 377,879 489,727 598,006
Utilidad 57,757 87,558 107,390
Millones de USD dic-14 dic-15 dic-16
Activos 797.6 822.5 931.9
Pasivos 716.1 738.2 828.2
Patrimonio 81.5 84.3 103.7
Utilidad 12.5 15.1 18.6
PYG million
Assets
Liabilities
Equity
Profit
USD million
Assets
Liabilities
Equity
Profit

7 Consolidated Information
19
DISPONIBLE 2,292,378 2,724,391 2,717,890
FONDOS INTERBANCARIOS 2,933,070 4,431,757 4,632,467
INVERSIONES 5,744,579 5,519,870 5,284,971
CARTERA DE CREDITO 10,662,833 12,635,321 12,556,690
OTROS ACTIVOS 732,909 786,214 1,037,418
TOTAL ACTIVO 22,365,769 26,097,552 26,229,437
DEPOSITOS Y EXIGIBILIDADES 15,437,599 16,754,738 16,504,680
Cuenta Corriente 1,407,337 1,908,892 1,785,811
Certificados de Depósito a Término 7,571,145 8,216,539 8,225,563
Depósitos de Ahorro 6,349,911 6,433,510 6,272,184
Otros Depositos y Exigibilidades 109,206 195,797 221,122
INTERBANCARIOS Y REPOS 2,372,664 4,016,669 4,523,439
CREDITOS DE BANCOS M/L 521,776 785,666 904,350
CREDITOS DE BANCOS M/E 796,672 781,203 464,963
BONOS 1,367,921 1,739,315 1,707,614
OTROS PASIVOS 595,099 529,328 520,654#N/A #N/A #N/A
TOTAL PASIVO 21,091,730 24,606,919 24,625,699#N/A #N/A #N/A
TOTAL PATRIMONIO 1,274,039 1,490,633 1,603,738#N/A #N/A #N/A
TOTAL PASIVO Y PATRIMONIO 22,365,769 26,097,552 26,229,437
MILLONES DE COP dic-14 dic-15 dic-16
Note: figures full NIIF
CASH AND BANKS
INTERBANK FUNDS
INVESTMENTS
LOANS
OTHER ASSETS
Total Assets
DEPOSITS AND DEMAND ACCOUNTS
Current accounts
Term deposits
Savings deposits
Other deposits and demand accounts
INTERBANK FUNDS AND REPOS
BANK DEBT, LOCAL CURRENCY
BANK DEBT, FOREIGN CURRENCY
BONDS
OTHER LIABILITIES
TOTAL LIABILITIES
TOTAL EQUITY
TOTAL LIABILITIES AND EQUITY
COP million

7 Consolidated Information
MILLONES DE COP Acum. Acum. Acum.
dic-14 dic-15 dic-16
INTERESES RECIBIDOS M/L 997,508 1,196,257 1,317,494#N/A #N/A #N/A
INTERESES PAGADOS M/L 579,640 702,934 876,761
MARGEN DE INTERMEDIACIÓN M/L 417,868 493,323 440,733#N/A #N/A #N/A
INTERESES RECIBIDOS M/E 326,766 449,886 598,837#N/A #N/A #N/A
INTERESES PAGADOS M/E 120,835 162,735 316,094
MARGEN DE INTERMEDIACIÓN M/E 205,931 287,151 282,743
MARGEN DE INTERMEDIACIÓN 623,799 780,474 723,476
Comisiones, Cambios y Otros 223,613 236,776 289,963
MARGEN FINANCIERO 847,412 1,017,250 1,013,439
Gastos de Personal y Administrativos 503,776 547,885 571,680
MARGEN OPERACIONAL 343,636 469,365 441,760
Provisiones e ingresos no operacionales 125,262 166,809 206,739
UTILIDAD ANTES DE IMPUESTOS 218,374 302,556 235,020
Provision Impuesto de Renta 63,182 106,771 25,800
UTILIDAD NETA 155,192 195,785 209,220
20Note: figures full NIIF
COP million
INTEREST RECEIVED, LOCAL CURRENCYINTEREST RECEIVED, LOCAL CURRENCY
INTEREST PAID, LOCAL CURRENCY
INTEREST MARGIN, LOCAL CURRENCY
INTEREST RECEIVED, FOREIGN CURRENCYINTEREST RECEIVED, FOREIGN CURRENCY
INTEREST PAID, FOREIGN CURRENCY
INTEREST MARGIN, FOREIGN CURRENCY
TOTAL INTEREST MARGIN
Commissions, Exchange, other
FINANCIAL MARGIN
Payroll and other overhead
OPERATING MARGIN
Provisions and non-operating income
PROFIT BEFORE TAX
Provision for income tax
NET PROFIT

7 Consolidated Information
Concepto dic-14 dic-15 dic-16
Activos Ponderados por Riesgo 12,467,793 15,423,564 15,363,929
Patrimonio Básico 833,872 906,226 980,089
Patrimonio Adicional 723,479 911,308 910,289
Patrimonio Técnico 1,557,350 1,817,534 1,890,378
Indice Solvencia Básica 6.69% 5.88% 6.38%
Indice Solvencia Total 12.49% 11.78% 12.30%
Bank Solvency, consolidated
Total loan indicators - Conglomerate
dic-14 dic-15 dic-16
Indicador de Calidad + 90 días 1.24% 1.40% 1.43%
Cubrimiento Vencida 191.50% 172.28% 188.28%
Indicador de Riesgo 3.35% 3.88% 6.08%
Cubrimiento Riesgo 98.99% 85.32% 65.41%
21
Figures in COP million
ITEM
Risk-weighted asset
Tier I
Tier II
Computable capital
Basic capital ratio
Total capital ratio
Quiality indicator > 90 days
Coverage of past-dues
Risk indicator
Risk coverage

Institutional
Presentation