institutionen för fysik, kemi och biologi
TRANSCRIPT

Institutionen för Fysik, Kemi och Biologi
Examensarbete
Karakterisering av bly-wolfram-oxid kristallers
optiska egenskaper till CERNs CMS ECAL
Nils Nedfors
LITH-IFM-EX--08/2026--SE
Institutionen för Fysik, Kemi och BiologiLinköpings universitet
581 83 Linköping


ExamensarbeteLITH-IFM-EX--08/2026--SE
Karakterisering av bly-wolfram-oxid kristallers
optiska egenskaper till CERNs CMS ECAL
Nils Nedfors
Handledare: Etiennette Auffray Hillemanns
CERN
Examinator: Hans Arwin
IFM, Linköpings universitet
Linköping, 5 February, 2009


Avdelning, Institution
Division, Department
Laboratory of Applied OpticsDepartment of Physics, Chemistry and BiologyLinköpings universitetSE-581 83 Linköping, Sweden
Datum
Date
2009-02-05
Språk
Language
� Svenska/Swedish
� Engelska/English
�
⊠
Rapporttyp
Report category
� Licentiatavhandling
� Examensarbete
� C-uppsats
� D-uppsats
� Övrig rapport
�
⊠
URL för elektronisk version
http://urn.kb.se/resolve?urn=urn:nbn:se:liu:diva-16595
ISBN
—
ISRN
LITH-IFM-EX--08/2026--SE
Serietitel och serienummer
Title of series, numberingISSN
—
Titel
TitleKarakterisering av bly-wolfram-oxid kristallers optiska egenskaper till CERNsCMS ECAL
Characterization of lead tungstate crystals optical properties for CERN CMSECAL
Författare
AuthorNils Nedfors
Sammanfattning
Abstract
The Large Hadron Collider (LHC) at CERN have a capacity to produce proton-proton collisions with an energy of 14 TeV. Four particle detectors are includedin the LHC with the purpose to detect all the particles that are created in thecollisions. In one of these detectors are scintillating lead tungstate crystals used,to detect the energy of photons and electrons created in the collisions. The energyis detected by measuring of the emitted light from the scintillating crystals. Asmuch knowledge as possible about the optical properties of the crystals are desiredto be able to analyze the acquired data from the crystals.This thesis work presents some techniques used for the characterization of the op-tical properties for the crystals. It also presents measurements done on the decaytime of lead tungstate crystals and on the temperature influence to the light yieldfrom the crystals. These measurement results are in addition used in an attemptto estimate how big influence the Cherenkov radiation has to the total amount ofemitted light from the scintillating crystals.The influence from the temperature to the light yield is around −2.02 %/◦C forBTCP and around −1.75 %/◦C for SICa. No conclusions could been drawn con-cerning the influence from the Cherenkov radiation to the total amount of emittedlight from the temperature measurements.The decay time measurements showed an influence from the Cherenkov radiationto the total amount of emitted light of; 8 % for crystal 1003, 47 % for crystal 1002and 19 % for crystal 1001.
Nyckelord
Keywords CERN, CMS, Lead tungstate crystals, Optical properties
aBTCP (Bogoroditsk Technical Chemical Plant) and SIC (Shanghai Institute of Ceramics) arethe two different crystal production facilities used for the production of the crystals


Abstract
The Large Hadron Collider (LHC) at CERN have a capacity to produce proton-proton collisions with an energy of 14 TeV. Four particle detectors are includedin the LHC with the purpose to detect all the particles that are created in thecollisions. In one of these detectors are scintillating lead tungstate crystals used,to detect the energy of photons and electrons created in the collisions. The energyis detected by measuring of the emitted light from the scintillating crystals. Asmuch knowledge as possible about the optical properties of the crystals are desiredto be able to analyze the acquired data from the crystals.This thesis work presents some techniques used for the characterization of the op-tical properties for the crystals. It also presents measurements done on the decaytime of lead tungstate crystals and on the temperature influence to the light yieldfrom the crystals. These measurement results are in addition used in an attemptto estimate how big influence the Cherenkov radiation has to the total amount ofemitted light from the scintillating crystals.The influence from the temperature to the light yield is around −2.02 %/◦C forBTCP and around −1.75 %/◦C for SIC1. No conclusions could been drawn con-cerning the influence from the Cherenkov radiation to the total amount of emittedlight from the temperature measurements.The decay time measurements showed an influence from the Cherenkov radiationto the total amount of emitted light of; 8 % for crystal 1003, 47 % for crystal 1002and 19 % for crystal 1001.
1BTCP (Bogoroditsk Technical Chemical Plant) and SIC (Shanghai Institute of Ceramics)are the two different crystal production facilities used for the production of the crystals
v


Acknowledgments
I would like to first express my appreciation to my supervisor at CERN, Etien-nette Auffray Hillemanns how have instructed and guided me through all stagesof my thesis work and given me useful feedback on my report. I would also liketo tell my thankfulness to Alessandro Thea who have helped me with my workand patiently answered many question especially in the early stages of my work.I would also like to thank my other co-workers at CERN, in particular BenjaminFrisch, Matthias Kronberger and Daniel Abler.I would also like to mention my examiner at Linköpings University, Hans Arwinfor the help with the report and for waiting patiently for me to finish my work.Finally I would like to thank all my friends in Geneva and especially my flatmatesat Rue du Vuache for making my time in Geneva a fantastic and unforgettableexperience.
Nils Nedfors
Karlskrona, November 2008
vii


Contents
1 Introduction 3
1.1 CERN . . . . . . . . . . . . . . . . . . . . . . . . . . . . . . . . . . 3
1.1.1 The Large Hadron Collider - LHC . . . . . . . . . . . . . . 3
1.1.2 The CMS experiment . . . . . . . . . . . . . . . . . . . . . 4
1.2 Scope of this thesis . . . . . . . . . . . . . . . . . . . . . . . . . . . 5
1.2.1 Problem description and objectives . . . . . . . . . . . . . . 6
1.2.2 Limitations . . . . . . . . . . . . . . . . . . . . . . . . . . . 6
1.2.3 Outline for this thesis . . . . . . . . . . . . . . . . . . . . . 6
2 Background 9
2.1 The CMS Electromagnetic Calorimeter . . . . . . . . . . . . . . . . 9
2.1.1 Photodetectors . . . . . . . . . . . . . . . . . . . . . . . . . 10
2.1.2 Preshower detectors . . . . . . . . . . . . . . . . . . . . . . 10
2.2 Scintillation . . . . . . . . . . . . . . . . . . . . . . . . . . . . . . . 10
2.2.1 Scintillating mechanism . . . . . . . . . . . . . . . . . . . . 11
2.2.2 Luminescence centers . . . . . . . . . . . . . . . . . . . . . 12
2.2.3 Scintillation properties . . . . . . . . . . . . . . . . . . . . . 15
2.3 Cherenkov radiation . . . . . . . . . . . . . . . . . . . . . . . . . . 17
2.3.1 Characteristics for the Cherenkov radiation . . . . . . . . . 17
2.4 Lead tungstate crystals . . . . . . . . . . . . . . . . . . . . . . . . 19
2.4.1 Crystal production . . . . . . . . . . . . . . . . . . . . . . . 19
2.4.2 Optical properties . . . . . . . . . . . . . . . . . . . . . . . 20
3 Characterization of lead tungstate crystals 25
3.1 Light yield measurements . . . . . . . . . . . . . . . . . . . . . . . 25
3.1.1 Experimental setup of bench 3 . . . . . . . . . . . . . . . . 26
3.1.2 Experimental setup of bench 4 . . . . . . . . . . . . . . . . 27
3.1.3 Extraction of light yield parameters . . . . . . . . . . . . . 28
3.1.4 The B4 software . . . . . . . . . . . . . . . . . . . . . . . . 33
3.2 Decay time measurements . . . . . . . . . . . . . . . . . . . . . . . 36
3.2.1 Experimental setup of the decay time bench . . . . . . . . . 36
3.2.2 Extraction of the decay time parameters . . . . . . . . . . . 37
ix

x Contents
4 Measurements 43
4.1 Description of measurements . . . . . . . . . . . . . . . . . . . . . 434.1.1 Decay Time measurements . . . . . . . . . . . . . . . . . . 434.1.2 Light yield at different temperatures . . . . . . . . . . . . . 44
4.2 Measurement results . . . . . . . . . . . . . . . . . . . . . . . . . . 444.2.1 Results from decay time measurements . . . . . . . . . . . . 444.2.2 Results for the measurements of the light yield at different
temperatures . . . . . . . . . . . . . . . . . . . . . . . . . . 47
5 Discussion and conclusions 55
5.1 The influence of the temperature to light yield . . . . . . . . . . . 555.1.1 Discussion . . . . . . . . . . . . . . . . . . . . . . . . . . . . 555.1.2 Conclusions . . . . . . . . . . . . . . . . . . . . . . . . . . . 55
5.2 The decay time measurements . . . . . . . . . . . . . . . . . . . . . 565.2.1 Discussion . . . . . . . . . . . . . . . . . . . . . . . . . . . . 565.2.2 Conclusions . . . . . . . . . . . . . . . . . . . . . . . . . . . 56
5.3 Future work . . . . . . . . . . . . . . . . . . . . . . . . . . . . . . . 575.3.1 Determination of the influence from Cherenkov light . . . . 575.3.2 The status of Bench 4 . . . . . . . . . . . . . . . . . . . . . 57
Bibliography 59

List of Figures
1.1 The Large Hadron Collider . . . . . . . . . . . . . . . . . . . . . . 41.2 The Compact Muon Sloenoid . . . . . . . . . . . . . . . . . . . . . 5
2.1 The electromagnetic calorimeter . . . . . . . . . . . . . . . . . . . 112.2 Energy bands in a crystal . . . . . . . . . . . . . . . . . . . . . . . 132.3 Potential energy diagram for a luminescent center . . . . . . . . . . 142.4 A Cherenkov radiation process . . . . . . . . . . . . . . . . . . . . 182.5 An endcap crystal . . . . . . . . . . . . . . . . . . . . . . . . . . . 202.6 Distribution of light yield values . . . . . . . . . . . . . . . . . . . 232.7 Longitudinal transmission and radioluminescence intensity for a
PWO crystal . . . . . . . . . . . . . . . . . . . . . . . . . . . . . . 24
3.1 An example of a photomultiplier with its vital parts. . . . . . . . . 263.2 A scetch over the electonic setup of bench 3. . . . . . . . . . . . . . 273.3 A scetch over the setup of the electronics used in bench 4. . . . . . 283.4 A light yield spectrum from a PWO crystal measured in bench 3. . 293.5 The compton scattering process. . . . . . . . . . . . . . . . . . . . 303.6 A plot over the light yield at different points along the crystal . . . 323.7 The workflow for operations with the software controlling Bench 4. 343.8 A flowchart describing the sequential data acquisition. . . . . . . . 383.9 The classes defined and used by the Bench 4 fitting software . . . . 393.10 The flow chart over how the B4 fitting software is running. . . . . 403.11 The flow chart describes how the AutoFit function works. . . . . . 413.12 A sketch over the electronics in the decay time bench. . . . . . . . 423.13 An example of a decay time spectrum from a PWO crystal . . . . 42
4.1 Decay time spectra acquired without a filter . . . . . . . . . . . . . 464.2 Decay time spectra acquired with a UV filter . . . . . . . . . . . . 474.3 Crystal 1001 decay time spctra, with and without filter . . . . . . 484.4 Crystal 1002 decay time spctra, with and without filter . . . . . . 494.5 Crystal 1003 decay time spctra, with and without filter . . . . . . 494.6 The summarized decay time spectra . . . . . . . . . . . . . . . . . 504.7 Temperature versus light yield for BTCP crystals . . . . . . . . . . 524.8 Temperature versus light yield for SIC crystals . . . . . . . . . . . 524.9 Temperature versus light yield for crystal 1001 . . . . . . . . . . . 534.10 Temperature versus light yield for crystal 1003 . . . . . . . . . . . 53
5.1 Variation of the B4 calibration factor . . . . . . . . . . . . . . . . . 58
List of Tables
2.1 Lead Tungstate properties . . . . . . . . . . . . . . . . . . . . . . . 19
3.1 The class types used by the B4 fitting software . . . . . . . . . . . 35

2 Contents
4.1 The different crystals used in the measurements . . . . . . . . . . . 444.2 The fast component decay time parameters . . . . . . . . . . . . . 454.3 The light yield at different temperatures for the ECAL PWO crystals 504.4 The light yield at different temperatures for the crystals 1001 and
1003 . . . . . . . . . . . . . . . . . . . . . . . . . . . . . . . . . . . 514.5 The change of light yield with temperature . . . . . . . . . . . . . 51
5.1 Saturation levels for the light intensity over time . . . . . . . . . . 57

Chapter 1
Introduction
1.1 CERN
The world’s largest particle physics centre is located outside Geneva close to theSwiss/France border since the 29 September 1954. It is named CERN ‘ConseilEuropeen pour la Recherche Nuclear’ and consists of 20 member states, severalobserver states and organizations.The main purpose for CERN is to supply scientist from Universities all over theworld with the necessary tools to study the building blocks of matter and theforces that holds them together. Extremely high particle energies are required tobe able to get a look at the particles holding matter together. To give the particlesthese high energies they are accelerated in particle accelerators. Therefore CERNsupplies scientists all over the world with particle accelerators, particle detectorsand computer centers for very powerful data processing.One of the achievements among many else that have been made during experimentsat CERN are the discovery of the W and Z bosons which led to the 1984 NobelPrize in physics for Carlo Rubbia and Simon van der Meer. World Wide Web wasborn at CERN originating from a hypertext based network for sharing informationbetween researchers, initiated by Tim Berners-Lee and Robert Cailliu in 1989.
1.1.1 The Large Hadron Collider - LHC
The latest project at CERN is a particle accelerator named The Large HadronCollider (LHC) which started beam ciculation in September 2008. The collider isbuilt in a tunnel with a circumference of 27 km located 50 to 175 m undergroundthe outskirts of Geneva. The LHC accelerator is capable to provide proton-protoncollisions with energy of 7 TeV per beam. To get this collision energy the protonsare accelerated in two separated beam lines, in opposite direction to each other, toa velocity of 99.999999 % of the speed of light in vacuum before the collision. Inaddition to proton-proton collisions, high-energy heavy-ion collision will also occurin the LHC. The two beam lines intersect with each other to form a collision pointat four different intersections along the accelerator. An experiment is built at each
3

4 Introduction
of these collision points with the purpose to detect the particles that are createdand the events that occur in the collisions from different point of views. Theseexperiments constitute the four main experiments in LHC and are called: ATLAS,ALICE, CMS and LHCb (See figure 1.1). To be able to circulate the particles inthe two beam lines they need to be bended by strong magnetic fields. These fieldsare created by superconducting magnets that are located along the accelerator.The main purpose for the LHC project is to further increase the understandingof the fundamental structure of the universe, concerning subjects as: dark energy,dark matter and Higgs particle.
Figure 1.1. The Large Hadron Collider with the location of the different experimentsalong the accelerator. http://atlas.ch/photos/detector-site-surface.html
1.1.2 The CMS experiment
In an underground ‘chamber’ under the village Cessy in France at the opposite sideof the LHC tunnel from the Meyrin site is a general particle physics detector builtcalled the Compact Muon Solenoid Detector (CMS). Roughly 2000 scientists from155 institutes are involved in the CMS project. The detector is constructed as ageneral purpose detector with the aim to exploit the physics of the proton-protoncollisions occurring in LHC over the full range of luminosities expected1 [1]. Thismeans that CMS should be able to measure the energy and momentum of photons,electrons, muons and other charged particles with a high precision.The completed detector has an overall length of 21.5 m, a radius of 7.5 m and a
1The luminosity is predicted to 1034cm−2s−1

1.2 Scope of this thesis 5
total weight of 12500 ton. The detector is built up by different layers, where eachlayer has different tasks in the detection of what occurs in the collision. Startingfrom the central collision point and going outwards are the different layers: ansilicon based inner tracking system, a scintillating crystal calorimeter, a samplinghadron calorimeter and a high magnetic-field superconducting solenoid coupledwith a multilayer muon system (see figure 1.2).
Figure 1.2. The Compact Muon Solenoid detector [2].
1.2 Scope of this thesis
This report covers a final thesis work for a Master of Science in Applied Physicsand Electrical Engineering at Linköping University at the department of Physics,Chemistry and Biology. The work has mainly been done at the PH /CMA divisionat CERN in Geneva. Supervisor at CERN was Etiennette Auffray Hillemanns. Inaddition to her supervision, the part of the work concerning the development ofthe software for bench 4 has been partly supervised by Alessandro Thea. Thework started at CERN the 3rd of September 2007 and ended the 31th of October2008.

6 Introduction
1.2.1 Problem description and objectives
The CMS electromagnetic calorimeter will consist of over 70 000 scintillating leadtungstate crystal. The crystals send out light when it absorbs radiation energy andthere is a proportional relationship between the energy absorbed by the crystalsand the energy emitted. So by knowing this proportional constant it is possibleto measure the energy of the incoming radiation by measuring the energy of theemitted light, which is the purpose for the crystals.To fully understand the acquired data from the CMS ECAL (ElectromagneticCalorimeter) the mechanism behind the emission of light in the crystals must befully understood. It is therefore desired to know as much as possible about the op-tical properties of the lead tungstate crystals. The aim of this thesis is to describesome of the techniques used for the characterization of the optical properties and touse these measurement methods to get results that can increase the understandingof the crystals. A part of the emitted light comes from Cherenkov radiation whichoccurs in the crystals when they are exposed to high energy particles. An opticalproperty, of the lead tungstate crystal that will be looked closer at, is how biginfluence this Cherenkov radiation has on the total emitted light from the crystal.So called light yield measurement benches are used to measure the light yield forseparate crystals. Their main principle is to acquire the light emitted by scin-tillating crystal with a photomultiplier tube when the crystals are excited by aradioactive source. A data analyzing software is then used to extract the lightyield of the crystal from the acquired light spectrum. A part of this work is tocontinue the development of the data analyzing software for the light yield inBench 4.
1.2.2 Limitations
It is desirable, as mentioned in the problem description, to know how big in-fluence the Cherenkov radiation has on the light emitted by the crystal in theCMS ECAL. The measurements done in this work is carried out on measurementbenches primarly constructed to measure other crystal properties than the influ-ence from Cherenkov radiation. The results to expect are therefore more to givea hint about the influence from Cherenkov radiation. The experimental setupsof the benches used in this work are not optimized for exact these type of mea-surements instead were experimental setups used based on experience from earliermeasurements with the benches. To increase the chances to see the CherenkovEffect the measurements are mainly done with lead tungstate crystals that havetheir scintillation properties suppressed.The development of the software for Bench 4 is mainly focusing on the data analyz-ing part, rather than the software that controls the measurements, and thereforeis the description of the software focusing on this part.
1.2.3 Outline for this thesis
The lead tungstate scintillating crystals that constitutes most to this thesis workis a part of the CMS detector which is a very big and technical complex system.

1.2 Scope of this thesis 7
It requires therefore a rather detailed description to introduce the reader into atechnical context. The reader is introduced to the technical context in chapter 2.This chapter provides also the reader with background information about howscintillation and Cherenkov radiation works and finishes with a description of thelead tungstate crystals.The techniques used for the characterization of the optical properties used in thisthesis work are described in chapter 3. Since a part of the thesis work have beento continue the development of the light yield Bench 4, the description of how thesoftware works for this bench is more detailed than for the other measurementbenches.Chapter 4 includes a description of the different measurements that is done in thiswork and also a small motivation to why these types of measurements are done.The description is followed by a result section where all the measurement resultsare presented.The conclusions drawn from the measurement results are presented in chapter 5together with discussion about the results. In addition to the discussions andconclusions, a description about future work for the understanding of the influenceof Cherenkov radiation is included. There is also a description about the statusof Bench 4 and additional improvements that needs to be done for the bench towork properly.


Chapter 2
Background
2.1 The CMS Electromagnetic Calorimeter
The main task for the CMS Electromagnetic Calorimeter (ECAL) is to measurethe energy of the electrons and photons that are created in the particle collisions.It shall also contribute to the measurement of hadron showers and missing energyin collaboration with the hadron calorimeter. The ECAL will play an importantrole in the search for the Higgs particle through the measuring of the two-photondecay mode for mH ≤ 150 GeV , and by measuring the electrons and positronsfrom the decay of W’s and Z’s1 originating from the H → ZZ(∗) and H → WWdecay chain for 140 ≤ mH ≤ 700 GeV . An excellent energy and angular resolutionare required in order to measure these physical processes. Another requirementfor the ECAL comes from the strict LHC operation conditions which mean thatthe calorimeter must have a fast response time and an optimum resistance to ra-diation [3].The ECAL is composed of a barrel part which is closed by two endcap parts, oneat each end of the central barrel part. The calorimeter consists of 61200 leadtungstate crystals (PbWO4) in the barrel part and by 7324 crystals in each of thetwo endcaps. The lead tungstate crystal were chosen because it offers the bestprospects to meet the requirements for the ECAL; short radiation length, a smallMoliere radius (allowing a compact calorimeter), relatively fast respons and easyto produce at two different plants.The crystals in the barrel part are mounted grouped together in submodules atradius of 1.29 m from the center of the CMS detector. The submodules are thenarranged in different modules, 400 - 500 crystals in each module. Four modulesare then forming a supermodule containing 1700 crystals. The barrel crystalshave a tapered shape with a length of 230 mm and with a square cross-section of22 × 22 mm2 towards the center and a cross-section of 26 × 26 mm2 at the rearface [2]. The crystals varies slightly in shape depending on were in the barrel theyare mounted in order to avoid cracks aligned with particle trajectories.
1W boson-weak and Z boson-zero, carrier particles for the weak interaction.
9

10 Background
The endcaps is mounted with its envelope placed 3.15 m from the detectors inter-action point. All the endcap crystals are of the same tapered form with a lengthof 220 mm, a front face of 28.62× 28.62 mm2 and a rear face of 30.0× 30.0 mm2.These crystals are grouped together into units of 25, known as supercrystals. Eachendcap is covered with 276 identical supercrystals plus 36 special partial super-crystals. The crystals are arranged in an x-y grid, with the crystals pointing at afocus point 1.30 m beyond the interaction point, giving off-pointing angles rangingfrom 2 to 8 degrees [2]. See figure 2.1 for an overview of the ECAL detector.
2.1.1 Photodetectors
The photo detectors, which are used to detect the light emitted from the crystals,need to be fast, radiation tolerant and able to work in an electromagnetic field of4 T. Because of the small light yield for the lead tungstate crystals the detectorsalso need to amplify their respons and in addition be insensitive to irradiationfrom particles. These requirements together with the difference in magnetic fieldconfiguration and expected level of radiation, between the barrel and endcap parts,lead to two types of photo detectors.In the barrel part will silicon avalanche photodiodes (APD) be used, developedspecially for the ECAL. Two APDs is glued on the back face of each crystal withan active area of 5 × 5 mm2 for each photo detector. A temperature sensor isembedded in every tenth APD pair [2].Another type of photo detectors are used in the endcaps, called vacuum phototriodes (VPTs). These photo detectors were also specially developed for CMS.They work as a photomultiplier with only one gain stage with an anode of veryfine copper mesh which makes them possible to use in the 4 T magnetic field. EachVPT is 25 mm in diameter with an effective area of approximately 280 mm2. OneVPT is glued to the back face of each endcap crystal [2].
2.1.2 Preshower detectors
In front of the crystals in the two endcaps are the Preshower detectors located.Their main purpose is to identify neutral pions in the endcaps. They will also helpthe identification of electrons against minimum ionizing particles and improvesthe position determination of electrons and photons with high granularity. Theyconsists of layers of lead radiators which initiate electromagnetic showers fromincoming electrons and photons. Silicon strip sensors are placed after each radiatorelement to measure the deposited energies and the transverse shower profiles.
2.2 Scintillation
What characterizes a scintillating (or radioluminescence) material is the ability toabsorb ionizing radiation energy (α, β, γ and X-ray) and reemit the energy in formof visible light. The luminescence can be divided in two different types depending

2.2 Scintillation 11
Figure 2.1. The electromagnetic calorimeter with the barrel part in the middle closedin the ends by the two endcaps [2].
on how fast after the absorption that the light is emitted. If the reemission occursimmediately after the absorption, or precisely within 10−8 s (Being roughly thetime taken for atomic transitions), the process is usually called fluorescence. If ittakes longer time than this it is called phosphorescence or afterglow. The timedelay between absorption and reemission is due to a metastable excitation stateand can last from a few microseconds to hours depending on the material.
2.2.1 Scintillating mechanism
When a scintillator absorbs incident high energy particles the scintilating materialfalls into a non-equilibrium state. When it relaxes it emits light, this process iscalled scintillation. The scintillator relaxes towards a new equilibrium state fromthis non-equilibrium state. The relaxation occurs through a multitude of processes.This scintillation relaxation process can be divided into these five steps [4]:
1. Creation of primary electrons and holes due to absorption of ionizing radia-tion energy.
2. Relaxation of the primary electrons and holes through the production ofnumerous secondary electrons, holes, photons, plasmon and other electronicexcitations.
3. Thermalization of the low-energy secondary electrons (holes) resulting in anumber of e-h pairs with energies just above the bandgap energy Eg.

12 Background
4. Energy transfer from the e-h pairs to the luminescence centers and theirexcitation.
5. Radiative deexcitation of the luminescence centers with emission of light.
The first three steps which end in the creation of the e-h pairs are similar in anycondensed matter. The second stage in the scintillating process is the most com-plicated process. The primary electron will create an electromagnetic cascade inthe solid consisting of an avalanche of electrons, holes, photons and plasmons. Thenumber of secondary particles increases with the depth of the cascade. This mul-tiplication process continues until the electron and photons are unable to createfurther ionization. At this point the electron - hole pairs relax to an energy nearthe band gap energy of the solid through thermalization. Some important param-eters are defined from the electromagnetic cascade. One of them is the radiationlength (X0) that can be defined as the mean distance traveled by a high energyelectron until its energy has been reduced to a fraction 1/e of the initial energy.Another parameter is the Moliere Radius (RM ) that can be understood as theradius of an infinite cylinder containing 90% of the shower energy.The fourth and fifth stages in the scintillating process are different for differentsolids since they involve the luminescence centers in the solid. These centers arethe reason for the emission of light and therefore what characterize most of thescintillating properties of a material.
2.2.2 Luminescence centers
The light emitted from scintillating materials originates from radiative transitionsbetween electronic levels. These electronic levels that are responsible for the emis-sion are called luminescent centers. The luminescent centers can either be intrinsicluminescent centers if the electronic levels are from the crystal itself. If the elec-tronic levels corresponds to impurities within the crystal it is classified as extrinsicluminescent centers.The band theory is a good tool to use when to describe how luminescence in scin-tillators works. This theory says that the electrons of a free standing atom occupycertain discrete energy levels given by Schrodinger’s equation. The energy levelswill increase in concentration and form a continuum of energy levels when a largeamount of atoms are brought together to form a solid. This continuum can beseen as an energy band of allowed energy levels which can be occupied by theelectrons. There are also certain energy values that the electrons cannot have,according to the Schrodinger’s equation. These forbidden energy levels create en-ergy gaps between the allowed energy levels in an insulator. When an insulatoris in a normal state the lower energy bands are fully occupied by electrons, whilethe higher energy bands are empty. The by electrons filled band with the highestenergy is usually called the valence band and the lowest empty band is called theconduction band, separated by an energy gap Eg (See figure 2.2).This model can only be applied on an insulator with a perfect crystal lattice.In reality for a scintillator there are lattice defects and impurities in the crystallattices resulting in local electronic levels in the energy gap between the valence

2.2 Scintillation 13
and conduction band (See figure 2.2). These energy levels can be occupied byelectrons that are moving freely in the conduction band at the vicinity of theseenergy levels. These local energy levels can be of three different types:
• Luminescence centers, where the transition to the ground state occurs witha photo emission.
• Quenching centers, from where the transition to the ground state occurs bythermal dissipation.
• Traps, a metastable level from where the electron can either acquire thermalenergy from lattice vibration and return to the conduction band or fall tothe valence band by dissipate non-radiative energy.
The luminescence and quenching centers comes from impurities, interstitial ionsand/or defects. They introduce local discrete energy levels representing the groundand excited state of the center. The traps arise from other lattice defects andintroduce additional energy levels for the electrons to occupy below the conductionband.
Figure 2.2. To the left is the energy bands in an insulator with a perfect crystal lattice.To the right is the energy bands together with the local energy levels which occurs in anon perfect crystal.
Mechanism for the luminescence of a center
To describe what is happening when a center emit light, a theoretical model isused where the potential energies of the ground and excited electronic states of theluminescent center is plotted against a configurational coordinate (X) (See figure2.3). The configurational coordinate is the mean inter-atomic distance betweenthe luminescent centre and neighboring atoms.

14 Background
When the luminescent center is in the ground stable state the center is in positionA. If the luminescent center absorbs a photon with enough energy an excitation ofthe center occurs. This means a transition from point A to point C. The transitionis vertical because the excitation and de-excitation of a crystal is fast comparedto ionic movements. By thermalization the center will then go to position B toachieve the minimum potential energy of the excited state. The transition back tothe ground state, from position B to D, is responsible for the luminescence emissionof the center. The amount of time the center spends in position B depends on theprobability of optical transition. The center will then go back to the position withthe minimum potential energy by non radiative dissipation of excess energy (D toA).The potential energy curves of the ground and excited states usually intersect orapproach each other closely at some point, F1 and F2 in figure 2.3. A luminescentcenter that reaches point F2 in the excited state can do a non radiative transitionback to the ground state point F1. This phenomenon is known as internal thermalquenching and is competing with the emission process. Thermal quenching is morelikely the higher the temperature is.
Figure 2.3. Potential energy diagram for a luminescent center. Curve a represent thepotential energy for the ground state and curve b the potential energy of the excitedstate of the luminescent center.
Lead tungsten luminescent centers
Studies have shown that PWO crystals have three luminescence bands [5]:
• Blue band: This band comes from the luminescence from WO2−4 centers in

2.2 Scintillation 15
the crystal. The emission has a wavelength around 420 nm.
• Green band: When anion vacancies are present in WO2−4 centers the irregu-
larWO3 anionic molecular complexes can appear which will cause this greenluminescence with a wavelength around 490 nm.
• Red band: The presences of Frenkel defects can deform the irregular WO3
center so it emits a red light with a wavelength around 650 nm.
All these centers contribute to the luminescent spectra for the lead tungstate crys-tals. The green and red luminescence centers are usually related to slow compo-nents in the emission spectra therefore have a great effort been made to suppressthe influence of theses centers. This has resulted in PWO crystals with scintilla-tion properties where the blue luminescence is dominant with an emission typicallypeaking at wavelengths around 420 nm.
2.2.3 Scintillation properties
Light yield
One property for a scintillator that is very interesting to know, especially whenit is used in a calorimeter, is the relationship between the amounts of light thescintillator emits in proportion to the incident energy. This relationship is givenby the light yield LY for the crystal and is expressed as the number of photonsemitted from the crystal per MeV of incident energy:
LY =nphEγ
(2.1)
The number of photons emitted by the scintillator is nph in (2.1) and Eγ is theenergy of the incident gamma-particle. The number of photons emitted by ascintillator can be written as:
nph = ne−hSQ where 0 < S,Q < 1 (2.2)
The number of electron hole pairs created is ne−h in the expression (2.2). S is theefficiencies to transfer the energy from the electron-hole pairs to the luminescentcenter and Q the efficiencies of light emission from the luminescence centers, step4 and 5 in section (2.2.1). The energy needed to create an electron hole pair Ee−his given by Ee−h = BEg, where Eg is the band gap energy of the scintillator andB is a material constant. The number of electron hole pairs that can be createdwith the incident energy Eγ can therefore be expressed as:
ne−h =EγBEg
(2.3)
It is possible to write an expression for nph with the use of (2.2) and (2.3):
nph = ne−hSQ =EγBEgSQ (2.4)

16 Background
An expression for the maximum light yield can be written with the use of (2.1)and (2.4):
LY =nphEγ
=1
BEgSQ (2.5)
Lead tungstate crystals have an energy gap, Eg = 4.5 eV and the value for Bis around 7. The ideal case, S = Q = 1, gives LYmax = 32000 ph/MeV forPWO crystals. This rough estimation is more than 300 times higher than the reallight yield measured experimentally. This huge difference is mainly because of thethermal quenching characteristic for lead tungstate resulting in a S << 1. Evenif this theoretical value is far from reality it gives a hint about the potential for ascintillating crystal when it comes to light yield.
Decay time
The decay time of a scintillator is a parameter that tells the amount of light thatis emitted by the scintillator after a certain time. It is usually defined as the timeafter which the intensity of the emitted light decays to 1/e of its initial value. Thelight intensity dependence with the time t can be expressed by a sum of exponentialdecay functions (2.6).
I(t) =n∑
i
Aie−t/τi (2.6)
Ai is the initial intensity of component i in (2.6) and τi is the decay time pa-rameter for component i. A god conformity with the model (2.6) and the actualintensity dependence with time are reached when each luminescent center of thescintillator is represented by one component in the model. From this model twomore parameters can be defined; the contribution from each component Ci (2.7)and the mean decay time τm (2.8). The contribution from each component is oftenmultiplied by 100 to give the result as a percentage.
Ci =Aiτi
∑nj=1Ajτj
(2.7)
τm =
∑ni=1 Aiτ
2i
∑nj=1 Ajτj
(2.8)
The total number of exponential components used to describe the light intensityis n in (2.7) and (2.8).The decay time of a scintillator is related to the mean lifetime of the excited statesand is therefore inversely proportional to the probability of de-excitation. Thede-excitation can be either radiative or non-radiative giving:
τ ∝1
pr + pnr(2.9)
where pr and pnr are the probability for radiative and non-radiative de-excitation.

2.3 Cherenkov radiation 17
2.3 Cherenkov radiation
When a charged particle moves through a solid material, with a speed faster thanthe speed of light in that material, the material starts to emit light. This radiationis called Cherenkov radiation after the physicist P. A. Cherenkov who was the firstto predict this phenomenon in 1934 [6]. For Cherenkov radiation to be possiblethe solid material must be non-conducting and transparent for an observable ra-diation.The movement of a charged particle through a solid disrupts the local electro-magnetic field in the solid causing the electrons in the solid to be displaced andpolarized. When the electrons go back to their equilibrium state, after the chargedparticle has passed, they emits photons. Under normal circumstances, these pho-tons are destructively interfering with each other and therefore result in a nonobservable radiation. In the case where a charged particle moves through thematerial with a speed faster than the speed of light, constructively interferencebetween the emitted photons is instead occurring which result in an intensifiedradiation. The Cherenkov radiation is analogous to the emission of a shock waveby a projectile, since in both cases the velocity of the object moving through themedium is faster than the resulting wave disturbance in the medium [6]. The ve-locity that must be exceeded by the charged particle is the phase velocity ratherthan the group velocity. The phase velocity of the light can be altered dramati-cally by employing a periodic medium and therefore decrease the required speedfor the charged particle to create Cherenkov radiation.The Cherenkov radiation is emitted at a constant angle theta to the direction ofthe moving charged particle. An expression for this angle theta can be determinedwith the aid of figure 2.4. If the charged particle is moving with a velocity of v ,it is during the time t moving the distance:
xcp = vt (2.10)
During the same time t the Cherenkov radiated photons are moving the distance:
xph =c
nt (2.11)
In (2.11), c is the speed of light in vacuum and n the refractive index of themedium. Then angle θ can then be described as:
cos(θ) =c
nv(2.12)
2.3.1 Characteristics for the Cherenkov radiation
The Cherenkov radiation shows a proportional behavior between the overall in-tensity of the radiation and the velocity of the charged particles and the amountof charged particles. The emitted light shows a spectra that varies with the wave-length as λ−2. This means that shorter wavelengths (higher frequencies) resultsin more intensive light. The Cherenkov light has therefore the highest intensity

18 Background
Figure 2.4. The thick arrow represents the charged particle moving through a non-conducting material causing Cherenkov radiation which is represented in the figure withthe small dashed arrows.
in the ultraviolet spectrum. The intensity of the radiation does not increase withever shorter wavelengths since the refractive index is a function that changes withwavelength. The refractive index becomes lower than one at X-ray wavelengthsand therefore no Cherenkov radiation is observable at these wavelengths. Thismeans that there is a cut off wavelength where equation (2.12) no longer holds forwavelengths shorter than the cut off wavelength.Some distinctive differences between the characteristics of Cherenkov light andscintillating light can be drawn [7]:
1. Directionality. The Cherenkov light is emitted at a fixed angle from thevelocity vector of the particle that generates it. The scintillating light on theother hand is emitted isotropically.
2. Time structure. Cherenkov light is prompt while scintillating light has oneor several characteristic decay times.
3. The spectrum. The Cherenkov light is emitted with a characteristic λ−2
spectrum. The scintillating light has instead a spectrum that varies betweenscintillating processes.
4. Polarization. Cherenkov light is polarized in contrary to scintillating light.
5. Temperature. The scintillating light is very temperature sensitive comparedto the light caused by Cherenkov radiation.

2.4 Lead tungstate crystals 19
2.4 Lead tungstate crystals
After four years of study with comparison between different inorganic scintillatingcrystals the lead tungstate crystals (PbWO4 usually written PWO) was chosenfor the ECAL [1]. The main advantages for the lead tungstate crystal are its highdensity which implies a short radiation length and short Moliere radius which al-low the construction of a compact calorimeter [2]. Other advantages are a fastresponse time, low production cost and that the production facilities to grow fullsize crystals were already available at the time when the decision was made. Themain drawback for the lead tungstate crystal is the low light yield. This problem isovercome by the high performance of the photo detectors used in the calorimeter.Another problem is that the scintillation in the crystals are very temperature de-pendent. This requires a temperature stabilization system to maintain a constantlight yield. Figure 2.5 shows an example of a lead tungstate crystal.The lead tungstate crystal have a sheelite structure belonging to the space groupI4 1/a or monoclinic raspite with a tetragonal unit cell [1], [3]. The dimension ofthe unit cell is a = b = 0.5466 nm and c = 1.2020 nm. Table 2.1 summarize theproperties for the lead tungstate crystals.
Parameter Value Unit
Density 8.28 [g/cm3]Radiation length 0.89 [cm]Interaction length 22.4 [cm]Moliere Radius 2.19 [cm]Light decay time 5(39 %) [ns]
15(60 %)100(1 %)
Refractive Index at emission peak 2.30Maximum of emission 420 - 440 [nm]Temperature coefficient -2 [%/◦C]Light Yield ≈ 10 [pe/Mev]
≈ 100 [ph]Melting point 1123 [◦C]Hardness 4 [Moh]
Table 2.1. Lead Tungstate properties
2.4.1 Crystal production
The lead tungstate crystals used for the CMS ECAL are produced by two differentmanufactures; Bogoroditsk Techno-Chemical Plant (BTCP) in Tula Russia andThe Shanghai Institute of Ceramics (SIC) in China. The producers together withthe CMS team had to put a great effort in to the understanding of how the crystalwork to be able to mass produce full size high quality PWO crystals. The PbWO4
crystals are grown from a mixture of 50 % lead oxide (PbO) and 50 % tungsten

20 Background
Figure 2.5. An endcap crystal with an vaccum phototriode detector attached to theback face of the crystal [2].
oxide (WO3). Two different methods are used for the growth; Choralski used byBTCP and Bridgman-Stockbarger used by SIC.
2.4.2 Optical properties
To be able to use and understand the data collected from the ECAL in the best wayas much knowledge as possible about the optical properties for the lead tungstatecrystals is desirable. Considering the enormous amount of crystals that is involvedin the detector some restriction has to be made to the optical characterizing ofthe crystals. Therefore only simple and easy measurable properties are studied.These properties are: light yield, decay time and light transmission. Knowledgeabout these optical properties also gives a confirmation that the requirements onthe crystals are fulfilled and therefore results in a scintillating crystal calorimeterthat can ensure the performance of the detector. This section summarize the re-quirements set for the optical properties of the crystals in the CMS ECAL togetherwith some results from measurements of the crystals in the CMS ECAL with theautomatic measurement systems ACCOCE 1 and ACCOCE 2, see section 3 for ashort description.
Light yield
The low light yield for the PWO crystals is one of the major drawbacks for usingthis type of crystals in the electromagnetic calorimeter. A huge effort has been

2.4 Lead tungstate crystals 21
done in attempts to increase the light yield of the crystals. This has resulted incrystals with a mean value for the light yield of 10.2 pe/MeV for BTCP crystalsand 12.3 pe/MeV for the SIC crystals [8]. This light yield is obtained when thecrystals are measured with a radioactive source placed 7.5 cm from the small endof the crystal and a Philips XP2262B photomultiplier tube. The rear surface ofthe crystal is in contact with the photomultiplier trough a thin layer of opticalglue. Figure 2.6 shows a distribution of light yield for 61267 BTCP crystals and1825 SIC crystals [8]. One of the major reasons for the low light yield is due to thestrong thermal quenching characteristic of PWO. This strong thermal quenchingalso results in the very temperature dependent light yield for the crystals (2%/◦C).The high refractive index of the crystal material is also a reason for the small lightyield [8].A light yield of 8 pe/MeV is required for the crystal to be used in the calorimeterwhen measured under the conditions mentioned above. The required light yieldmeasured under these circumstances corresponds to a light yield around 4 pe/MeVwhen detected by two APD’s, glued to the rear face of the crystals in test beammeasurements.
Light transmission
The light transmission is a measure of the difference in the amount of radiantflux that enters one side of the crystal and exits the opposite side. A longitudinaltransmission spectrum is shown in figure 2.7 together with a radio luminescencespectrum. Photon energies above the band gap energy of the crystal will be ab-sorbed by the material and there is therefore also a threshold wavelength wherephotons with energies above this value will be absorbed by the crystal. In additionto this absorption caused by band structure there exist internal absorption causedby impurities in the crystal lattice. This internal absorption will shift the thresh-old wavelength towards longer wavelengths (lower energies) and will influence thespectrum more the longer the crystal is.According to the radio luminescence spectra in figure 2.7, the PWO crystals emitblue-green scintillation light with a broad maximum at 420 - 430 nm. To achieve ashigh light yield as possible it is desirable to have as good transmission as possiblearound this light emission peak. The requirements set on the crystals for the lon-gitudinal light transmission at 420 nm is therefore set to a threshold transmissionof 55% [1]. The longitudinal light transmission spectra can tell more things aboutthe quality of the crystal. The transmission at especially 360 nm has been provento have connection to the presence of defects which are correlated to the radiationtolerance of the crystal. It has also been shown that a low transmission at higherwavelengths indicates the presence of a core defect that may affect light collection.Therefore there are two more requirements for minimum threshold transmission;25% at 360 nm and 65% at 620 nm [1].
Decay time
The short decay time that characterizes the lead tungsten crystals is one of the ma-jor reasons why this scintillating crystal have been chosen for the calorimeter. The

22 Background
decay time for the PWO crystals consist of three components since the scintillationlight for the crystals originate from three different types of luminescent centers.The components are: a fast ∼ 5 ns, a medium ∼ 15 ns, and a slow ∼ 100 ns.These three components contribute to the total emitted light as; ∼ 39 % fast,∼ 60 % medium and ∼ 1 % slow [1].

2.4 Lead tungstate crystals 23
Figure 2.6. Distribution of light yield values for the BTCP (top) and SIC (bottom)crystals [8].

24 Background
Figure 2.7. Longitudinal transmission (1, left scale) and radioluminescence intensity(2, right scale) for a PbWO4 crystal [2].

Chapter 3
Characterization of lead
tungstate crystals
The characterization of the PWO crystals include light yield measurements withtwo different benches working in a similar way. In addition to this decay timemeasurements have been done with the use of a decay time bench. The setup ofthese benches will be described in this chapter together with an explanation ofhow the measurements are done and the resulting data is extracted.An automatic measurement system has been used to measure, in a reasonableamount of time, the optical properties of the nearly 80000 PWO crystals in theECAL detector. The characterization has been carried out on two automatic mea-surement systems and they are called ACCoCE1 and ACCoCE2. They work in asimilar way and perform in an automatic sequence: a crystal dimension measure-ment, a longitudinal transmission measurement, a decay time measurement andfinally a transversal transmission measurement. The light yield is then extractedfrom the results from the decay time measurement. Light yield data from theclassical light yield benches 3 and 4, which are described further in this chapter,are used for the calibration of the ACCoCE benches. The ACCoCE benches arenot described further since they are not used in this thesis work.
3.1 Light yield measurements
The basic principle for the light yield measurements is that the light emitted froma PWO crystal is detected by a photomultiplier tube when the crystal is excitedby a radioactive source in. The sources used for the measurements in this workwas 60CO. The rear face of the crystal is placed upon the photomultiplier tubewindow with a layer of optical glue (n ∼ 1.5) between the two surfaces. Thecrystal is placed in a tyvek1 envelope so that all the crystal surfaces except therear face are covered. A cooling unit is also integrated in the benches so that thecrystal can maintain a constant temperature during measurement, usually 18◦C.
1A high density Polyethylen fibres material.
25

26 Characterization of lead tungstate crystals
A photon that is detected by a photomultiplier tube is absorbed by the photocath-ode. The photocathode will then transfer the photon energy to an electron fluxthrough the photoelectric effect. The efficiency this transformation occurs with iscalled the quantum efficiency (QE) and is defined as:
QE =Number of photoelectrons emitted
Number of incident photons(3.1)
The electron flux is then focused and accelerated towards the first dynode by anelectro-optical input system. The first dynode multiplies the electron flux whichis then multiplied further through a series of dynodes before it is collected by theanode. The anode converts the electron flux into an output signal. Figure 3.1shows an example of a photomultiplier.
Figure 3.1. An example of a photomultiplier with its vital parts.
3.1.1 Experimental setup of bench 3
The purpose for bench 3 is to measure the light yield for a scintillating crystal whenexcited by a radioactive source. The source used for the measurements in this workis a 60CO. The crystal holder in the bench has dimensions to suit the ECAL barrelcrystals. The light emitted from the crystal is detected by a XP2262B Photonisphotomultiplier tube supplied with a high voltage of 2170 V. In figure 3.2 is asketch over the bench and the electronics processing the outgoing signal from thePMT. The source is attached to a stepping motor so that the source can be moved

3.1 Light yield measurements 27
Figure 3.2. A scetch over the electonic setup of bench 3.
along the crystal. A cooling unit is also integrated in the bench so that the crystalcan maintain a constant temperature during measurement, usually 18◦C.When the PMT generates a signal, which is discriminated from background noise,it starts the time unit which gives a gate signal for 150 ns. During this timethe indiscriminate signal from the PMT is integrated by the QVT 2 unit workingin Q mode. The magnitude of the resulting analog output from the QVT unitrepresents the energy from the PMT and is converted to a 1024 bits digital valueby a analog to digital converter and then transferred to a PC. All the signals fromthe PMT are collected in a spectrum in this way. The pedestal in the spectra iscreated by a pulse generator which creates random pulses that triggers the gate.
3.1.2 Experimental setup of bench 4
The main principle of bench 4 is the same as for bench 3, to measure the light yieldfor scintillating crystals when excited by a radioactive source. The source used inbench 4 is also a 60CO. The crystal holder in B4 is a bit bigger and therefore ableto measure the ECAL endcap crystals which have larger dimensions comparedto the barrel crystals. The light yield is measured with a XP2262B Photonisphotomultiplier tube supplied with a high voltage of 2200 V. Figure 3.3 shows asketch over B4 and how the signal from the PMT goes through the electronicsand finally is recorded by a computer. The position of the source can be movedalong the crystal with a stepping motor. The bench has a cooling unit so that thecrystals can maintain a constant temperature throughout the measurements. Thedata acquisition can either work in pedestal gate mode or self gate mode, whichmode to use is controlled through an I/O register. The gate signal is createdby a time unit independent of the signal from the PMT in pedestal gate mode.This will result in a spectrum with one pedestal representing zero energy. If thebench is working in self gate mode, the gate signal is generated when the PMT
2A multichannel analyzer that can analyze the gate signal in three modes: Charge (area, Q),Voltage (peak, V) and time to digital conversion (start/stop, T)

28 Characterization of lead tungstate crystals
detects light. The signal from the PMT are then integrated during the time thegate signal is high and the resulting value corresponds to the photoelectron energyfrom the PMT. This energy value is then converted to a digital value and stored ina spectrum by a connected PC. In this way two different spectrums are created onefor each mode; pedestal mode consisting of only a pedestal corresponding to zerosignal energy and self gate mode with a spectrum consisting of a single electronpeak and the spectrum over the events created by the scintillating crystal.
Figure 3.3. A scetch over the setup of the electronics used in bench 4.
3.1.3 Extraction of light yield parameters
The resulting light spectrum from the data extraction (fig 3.4) is composed ofthree peaks: pedestal, single photoelectron and photoelectric peak. The 60COsource used in the light yield measurements emits gamma rays of two differentenergies; 1.17 MeV and 1.33 MeV . This ought to result in a spectrum withtwo distinguished photoelectric peaks but the light yield of the crystal is not highenough to allow the separation of the two peaks. The spectrum shows insteada single photoelectric peak that is composed of the two peaks. The pedestalrepresents gate signals when there is no signal coming from the photomultiplierand therefore it represent the level of zero energy. The width of the pedestaldepends on how big the electronic noise is. The single electron peak come fromthe normal conduction electrons within the photocathode, which can occasionallyhave enough energy to escape from the photocathode if they are close enough to thesurface. The difference between the position of the pedestal and the single electronpeak gives the number of channels representing the energy from one photoelectronand can therefore be used to calibrate the channels in terms of photoelectrons.To be able to do this calibration and finally determine the light yield, the positionof the different peaks must be estimated. The position of the pedestal is easyto estimate thanks to its distinctive shape. The single electron peak has also arather distinctive shape so its position can be determined with the fit of a Gaussian

3.1 Light yield measurements 29
Figure 3.4. A light yield spectrum from a PWO crystal measured in bench 3.
function. The position of the pedestal is subtracted from the value for the positionof the single electron peak and the result is the calibration factor CADC or thenumber of ADC channels that corresponds to one photoelectron.
CADC = Single electron peak position− Pedestal position (3.2)
Some of the photons that enter the crystal can undergo Compton scattering. Theincident photon is interacting with an electron and deflected an angle theta withrespect to its original direction when Compton scattering occurs. A part of thephoton energy is transferred to the electron during this interaction. A sketch ofthe Compton scattering process can be seen in figure 3.5. The following equationis derived from the conservation of energy and momentum:
E′γ =Eγ
1 +Eγmec2
(1 − cosθ)(3.3)
In (3.3) are; E′γ the energy of the compton scattered photon, Eγ the energy of theincident photon, θ the angle between the direction of the incident photon and thescattered one, me the free electron mass and c is the velocity of light. There is achance that the scattered photon leaves the scintillator and in this case, only theenergy of the Compton electron is transferred to the scintillation.
The energy of the scattered electron (3.3) varies with the angle θ with a max-imum when the scattered photon has its minimum value (θ = π). The maximumCompton energy Ec for the Compton scattered electron can be derived from (3.3):

30 Characterization of lead tungstate crystals
Figure 3.5. The compton scattering process.
Ec = Eγ
(
1
1 + mec2
2Eγ
)
(3.4)
The energy spectrum of these events is almost flat and is present in the part ofthe spectrum to the left of the photoelectric peak, i.e. at lower energies thanthe photoelectric peak. A compton edge is located for energies around Ec. Nocompton scattering will occur above this energy so the number of events causedby compton scattering in the spectrum will suddenly drop to zero and form acompton edge in the spectrum. This edge is smeared out due to resolution effectand by secondary photon interactions.The part of the spectrum that is caused by the Compton scattering must beincluded in the fitting to estimate the position of the photoelectric peak. Thisis accomplished with the use of a Fermi-dirac distribution with a Fermi level ofEc. Since the photoelectric peak is distributed around a central value with alimited number of photoelectrons it is fitted with a Poisson distribution. Thesetwo distributions are combined to form an analytical expression for the fittingfunction [9]:
NN
ECADCpe · e−Npe(
ECADC
)
!+
LC
eE−EcTe + 1
(3.5)

3.1 Light yield measurements 31
The first term represent the Poisson function, while the second represent the Fermi-Dirac distribution. There are five free parameters:
1. N is a normalization factor that takes into account the integral of the pho-topeak
2. Npe represent the average number of photoelectrons produced
3. CADC represent the number of ADC channels that correspond to one pho-toelectron, i.e. the calibration factor
4. LC is the mean level of the Compton background
5. Te is a parameter that controls the slope of the Fermi-Dirac distributionaround the Compton edge
The function (3.5) is fitted towards a defined region of the spectrum around thephotopeak. After the fit is done, the parameter Npe gives the number of pho-toelectrons that correspond to the fitted photopeak. This value is the number ofphotoelectrons that is produced in the photocathode when the photons emitted bythe crystal are detected by the photomultiplier. To know the real number of pho-tons (Nph) that reaches the PMT the quantum efficiency (3.1) of the PMT must beknown. The quantum efficiency is strongly dependent with the wavelength of theincident photons. Studies in the laboratory have shown a quantum efficiency thatpeaks at wavelengths around 400 nm with a peak quantum efficiency of ∼ 13%for the XP 2262B photomultiplier in B3. It is hard to get a precise value for thequantum efficiency and therefore to have more precise values for the light yield itis expressed in photo electrons instead of photons.As mentioned in section 2.2.3 the light yield is expressed as the number of pho-toelectrons per MeV (2.1). An average value of 1.25 MeV , for the gamma energyemitted by the 60CO source, is used since no distinction can be made betweenthe 1.17 MeV and 1.33 MeV gamma rays. This gives the following expression tocalculate LY:
LY [NpeMeV
] =Npe1.25
(3.6)
The Light Yield is measured with the source placed at different positions alongthe crystal usually at 20 different points with a distance of 10 mm between eachpoint. The light yield values at the different points are then plotted towards wherealong the crystals they are measured, see figure 3.6. Two linear functions arefitted towards the points in the plot to get a measure of the light yield uniformityalong the crystal. The first one is fitted against the nine points measured atclosest distance to the PMT (3.5 − 11.5 cm from the PMT), i.e the rear face ofthe crystal. The second function is fitted against the nine points measured atdistances of 11.5 − 19.5 cm from the PMT,i.e. the front face of the crystal. Thetwo fitted functions are written in the form:
yF (x) = aFx+ bF , x ∈ [11.5, 19.5]
yR(x) = aRx+ bR , x ∈ [3.5, 11.5] (3.7)

32 Characterization of lead tungstate crystals
9.4
9.6
9.8
10
10.2
10.4
10.6
10.8
11
11.2
0 2.5 5 7.5 10 12.5 15 17.5 20 22.5 25
BOUND valuesUNBOUND values
Dist. from PMT (cm)
Np
e/M
eV
Figure 3.6. A plot over the light yield at different points along the crystal [1].
A reference light yield is defined from (3.7) as the average value for the two linesat x = 11.5 cm:
yref =yF (11.5) + yR(11.5)
2(3.8)
The slope of these two linear functions gives a value for the light yield uniformity.They are called the Rear Non Uniformity (Rnuf) for the first function and FrontNon Uniformity (Fnuf) for the second function. They are expressed in units as
%/X0 instead ofNpeMeV /cm (3.9).
Fnuf [%/X0] = aF100
yrefX0
Rnuf [%/X0] = aR100
yrefX0 (3.9)

3.1 Light yield measurements 33
The electromagnetic shower described in section 2.2.1 reaches its maximum at adeep of 8 X0 from the front face of the PWO crystal [1]. This deep correspondsto a distance of 15.5 cm from the PMT or the rear face of the crystal. The lightyield for the crystals at this shower maximum is of interest and is calculated fromthe fitted function at the front face of the crystal, LY at 8X0 = yF (15.5) and isoften refered as the light yield of the crystal LY.These three parameters; Fnuf, Rnuf and LY (at 8X0) are the results that are ofthe biggest interest from the measurements with the light yield benches.
3.1.4 The B4 software
The software in B4 controls the measurements and extracts the desired resultsfrom the acquired data. All the required software is installed on one PC thatis connected to a VME3 crate on B4 and the motor that controls the movementof the source. The software can be divided in to two distinctive parts. Onepart controls the measurements and acquires the data. This part is done withthe National Instruments LabView software. The other part is extracting themeasurement results from the acquired data. This part is done with a C++ basedobject oriented data analysis framework called ROOT developed for data analysisat CERN.
The measurement control software
Measurements in B4 are controlled by the LabView program NewFastDAQPanel.viand its sub vi’s4. The LabView software is communicating with the motor in B4through a Parker Digiplan PDX-series motor driver which is connected to the com-port of the computer. It is also communicating, through a National InstrumentsMXI-2 bus, with an 16 channel I/O register and an LeCroy 1182 ADC 5 unitplaced in a VME crate. Fig 3.7 shows the workflow for the software controllingB4. Four basic operations can be reached from the main frame of NewFastDAQ-Panel.vi. The motor control is a window from where the motor that moves thesource can be controlled. All the settings for the measurements are done in theconfiguration window. It consists of two parts; one part where all the hardwaresettings are being done and one part where the settings for the data acquisition isbeing done. The hardware settings are both for the motor control (PDX settings)and for the LeCroy 1182 ADC device which transfers the data from the bench tothe computer. In the configuration panel is; information about where the datashould be stored, spectrum settings, number of source positions and settings forthe fitting of the acquired spectrum done.The data acquisition in B4 can occur in two different modes either with a pedestalrun or a self gate mode run. See section 3.1.2 for a description over how thedifferent modes operate. A measurement run can be built up by a sequence ofdifferent acquisition modes. This sequence is defined together with the size of
3VME is a computer bus standard4Programs that runs under LabView has the file extension .vi and a sub vi is a LabView
program integrated in to another LabView program5Analog to Digital Converter

34 Characterization of lead tungstate crystals
Figure 3.7. The workflow for operations with the software controlling Bench 4.
each acquisition directly in the main frame controlling B4. The LabView softwareis then selecting between the different modes through the I/O register. A highvalue on channel 9 enables Pedestal Run while a high value on channel 8 enablesSelf Gate run. The sequential data acquisition occurs according to the flowchartin figure 3.8. When a sequence has started a header file is created, consisting ofinformation about the measurement in the folder specified in the configurationwindow. The source is then moved to the position specified in the configurationwindow and the data acquisition begins in the mode defined by the first sequen-tial continuing until the desired measurement size is fulfilled. The next acquisitionmode specified in the sequence is then started. After the completion of a sequence,the source is moved to the next position specified in the configuration window andthe measurement sequence starts again. The complete measurement is finishedwhen all the source positions has been measured.
The software for extraction of the light yield parameters
The measurement results that are extracted from the acquired data are the lightyield at each measured point along the crystal. The LY at 8 X0, the Fnuf and

3.1 Light yield measurements 35
Rnuf values are then calculated from these light yield values. These parametersare presented in a graph and written into a text file together with the light yieldvalues at the different source positions. See section 3.1.3 for a definition of LY at8X0, Fnuf and Rnuf. There are several different classes created that together withthe by ROOT predefined classes carries out the data analyzing. Figure 3.9 showsthe different classes that are created for the B4 fitting, presented in a diagram thatalso shows the hierarchy between the classes. The main macro file that controlsthe fitting is creating an object of the type LyFitter, see figure 3.10 for a flowchartand table 3.1 for a list of LyFitters member functions. The LyFitter object is thenrunning the SetCalibration function. This function creates an object of the classtype Calibrator, table 3.1. The SetCalibration function is then telling the Calibra-tor object to perform a calibration using the method described in section 3.1.3.The result from the calibration is a calibration factor value that is assigned to oneof the data members of the LyFitter object. The SetConfig function is executedafter the calibration resulting in assignment of the values in the configuration fileto data members of the LyFitter object. The name of the files containing the
Class LyFitter Calibrator LyCalculatePublic Functions SetPedPath SetPedPath SetFile
SetPPPath SetSERPath GetLYGetCF Calibrate GetFnuf
GetSERPos GetResults GetRnufLoadPedPath ReadFileLoadPPPath Calculate
SetConfig PrintResultsSetCalibration
AutoFitWriteToFile
Table 3.1. The class types used by the macro file that controls the fitting and theirpublic functions.
data from the first measured position is assigned to data members of the LyFitterobject when the LoadPPPath and LoadPedPath member functions are executed.The LyFitter object is, after the file paths have been assigned, starting the func-tion AutoFit. A more detailed description of how the AutoFit function works isfollowing below.After the data fitting is done for all measured positions and all the resulting fit-ter parameters are stored in a text file an object of the class type LyCalculate iscreated, see table 3.1. This object reads the stored data from the text file andassign the values to its data members. The function Calculate is then called bythe object which calculates the LY at 8 X0 and the non-uniformity values Fnuf andRnuf in accordance with the definition in section 3.1.3. The LyCalculate objectalso presents the results in a graph by the call to the function PrintResults.The results from the fit at each position of the source together with the calculatedLY at 8 X0, Fnuf and Rnuf are finally written into the header file for the currentmeasurement, with help from the TempFileHandler class.

36 Characterization of lead tungstate crystals
The AutoFit function
The LyFitter member function AutoFit is responsible for the determination ofthe position of the photo peak in the light yield spectrum acquired from the dataacquisition. This is done by the fit of function (3.5) to the acquired spectrumwithin a range defined in a configuration file. Initial parameters for the fittingfunction are also loaded from the same configuration file.The function is fitted towards the spectrum with the predefined range and initialparameters. A flow chart over how the auto fit is done can be seen in figure 3.11.The fitted function is stored if the error for the parameter representing the lightyield (Npe in (3.5)) and the parameter representing the slope of the Compton edge(Te in (3.5)) are under a certain predefined threshold value and if the χ2 6 value forthe fit are the best so far. The initial light yield for the fit is then changed and thefit is done again and a check is done if the requirements are fulfilled. After a fit hasbeen done for all the initial LY values, that are within the specified range for thevariation of the initial LY, the fitting range is changed and the fitting procedureis repeated again. A fit is done for all the ranges that are within the maximumallowed fitting range. There is also a minimum value for how small the fittingwindow is allowed to be.When all the fits within the given fitting window are done the fit that fulfillsthe minimum requirements and has the lowest χ2 value is stored and treated asthe best possible fit of the fitting function (3.5) to the acquired spectrum. Theparameters from this fit are assigned to the LyFitter object data members andlater on written to a text file. All the fitting parameters are set to zero if there isno fit that manage to fulfill the minimum requirements; for the error of the lightyield parameter and the parameter representing the slope of the Compton edge.
3.2 Decay time measurements
3.2.1 Experimental setup of the decay time bench
The decay time is measured in a setup using a technique called single photoncounting; the setup can be seen in figure 3.12. A 22Na radioactive source is placedupon a plastic scintillator which is in optical contact with one PMT. The crystalwhich the decay time is measured on is placed on top of the source. A secondPMT is situated at a distance of 20 cm. This PMT is equipped with a diaphragmso that the amount of light that is detected by the PMT can be regulated. Thisdiaphragm had an opening of f = 5.6 during all measurements.The 22Na source emits a positron which annihilates with an electron into twogamma photons. One of those causes the plastic scintillator to emit light which isdetected by the PMT in optical contact with the plastic scintillator. This processoccurs with a very small time delay from the emission of the gamma ray due to
6The sum of the squared error between the original data and the calculated curve fit. Ingeneral, the lower the χ2 value, the better the fit.

3.2 Decay time measurements 37
the fast plastic scintillator. When the first PMT detects light it sends out a triggersignal which act as a start signal for the read-out electronics. The second gammaray excites the scintillating crystal, which causes the crystal to emit light. A stopsignal is given to the read-out electronics when the second PMT detects some ofthese photons [10].The time difference between the start and stop signal is converted in to a voltagepotential in a time to analog converter and then recorded in a spectrum on a PCafter a conversion of the analog value to a digital value. The data acquisitionoccurs for 8 hours for each measurement.
3.2.2 Extraction of the decay time parameters
The gathered spectrum from the decay time measurement shows the amount oflight that is emitted by the scintillating crystal at a certain time. The spectrumcan be presented in a time scale [ns] after a conversion factor have been appliedto the channels7.An expression for the intensity over time of the emitted light for the PWO crystalscan be described with (2.6), where each term represents a luminescent center(3.10).
I(t) = C +A1e−t/τ1 +A2e
−t/τ2 +A3e−t/τ3 (3.10)
The decay time constant for each component is represented by τi in (3.10), Aigives the weight for each component and C is a offset constant. The parametervalues are extracted from the obtained decay time spectrum by a fit of (3.10)to the spectrum in the time region between 0 − 1600 ns, see figure 3.13. TheKaleidaGraph software is used to do the fitting.
7A time difference of 1.935 ns between each channel.

38 Characterization of lead tungstate crystals
Figure 3.8. A flowchart describing the sequential data acquisition.

3.2 Decay time measurements 39
Figure 3.9. The classes defined and used by the Bench 4 fitting software and thehierarchy between the classes.

40 Characterization of lead tungstate crystals
Figure 3.10. The flow chart over how the B4 fitting software is running.

3.2 Decay time measurements 41
Figure 3.11. The flow chart describes how the AutoFit function works.

42 Characterization of lead tungstate crystals
Figure 3.12. A sketch over the electronics in the decay time bench.
Figure 3.13. An example of a spectrum from a PWO crystal acquired with the decaytime bench.

Chapter 4
Measurements
4.1 Description of measurements
The goal with the measurements done in this work is to be able to see how biginfluence the Cherenkov light has on the total light yield output from the leadtungstate crystals that are used in the ECAL of CMS. To be able to see the mag-nitude of this influence the light characteristics that differs between Cherenkovlight and scintillating light has to be investigated, see section 2.3.1. The charac-teristic differences in temperature and time structure are investigated in this thesiswork.As mentioned in section 2.4.2, the light yield from the scintillating light of thePWO crystals is changing dramatically with the change of the temperature. Theamount of Cherenkov light on the other hand should not change so much with asmall change of the temperature. This fact justifies a measurement of the lightyield for PWO crystals at different temperatures.The decay time of the scintillating light from the PWO crystals have three compo-nents; one fast ∼ 3 ns, one medium ∼ 15 ns and one slow ∼ 100 ns. For the lightcoming from Cherenkov radiation is the decay time instead abrupt. Measurementsof the decay time for different lead tungstate crystals are therefore measured sothat their time structure can be analyzed and a determination of the Cherenkovcontribution being done.
4.1.1 Decay Time measurements
Three different crystals was measured in the decay time bench for the decay timemeasurements.The setup as it is described in section 3.2.1 was used. These crystalswere 1001, 1002 and 1003, see table 4.1. The data was acquired during eight hourswith a waiting time of at least one hour before the data acquisition for the highvoltage to stabilize.The crystals were measured either with a UV filter or without any filter. Boththe measurements, without any filter and with a UV filter, was done once for eachcrystal. The UV filter only transmits light with wavelengths below 300 nm, or in
43

44 Measurements
other words it is filtering away the visible light. The UV filter is used in an atemptto filter away the scintillating part of the light.
Crystal Number Producer Comment
2210 SIC Same type as the one used in ECAL2630 SIC Same type as the one used in ECAL118 BTCP Same type as the one used in ECAL2368 BTCP Same type as the one used in ECAL1001 BTCP Doped1002 BTCP Doped1003 BTCP -
Table 4.1. The different crystals used for the Light Yield measurements at differenttemperature and the Decay Time measurements.
4.1.2 Light yield at different temperatures
The measurements of the light yield at different temperatures were measured in B4.Using the setup described in section 3.1.2. Seven different crystals were measured;five of the same type as the one used in the ECAL and two crystals with a bitdifferent scintillation characteristic. The two crystals with a different scintillationcharacteristics are doped which results in a quenching of the luminescent centersand the quenching leads to a decrease in scintillation. The amount of doping variesbetween the crystals and crystal 1001 shows therefore a slightly higher amount ofscintillation than crystal 1002. A summary of the measured crystals can be foundin table 4.1. The crystals were measured at five different temperatures: 16 ◦C,18 ◦C, 20 ◦C and 25 ◦C. After each temperature change followed a waiting periodof at least four hours before the data acquisition started to make sure that thecrystal had adopted a stable new temperature. The crystals were placed in a tyvekenvelope. A layer of optical grease was placed between the crystal and the PMTwindow to ensure good optical contact between the crystal surface and the PMTwindow. The light yield was measured at 16 points along the crystal. Starting70 mm from the rear face of the crystal and then with an increment of 10 mmbetween each measuring finishing at a distance 220 mm from the rear face. Twomeasurements were done at each temperature for the crystals of the type that is inECAL. For the other type of crystals the measurement was repeated three timesat each temperature.
4.2 Measurement results
4.2.1 Results from decay time measurements
The lead tungstate crystals 1001, 1002 and 1003 decay time spectra were fittedwith the exponential function (3.10). The lead tungstate crystals has three lumi-nescent centers see section 2.4.2 and therefore are the most reasonable fit a three

4.2 Measurement results 45
1001 No filter 1001 UV filterParameter Value Error [%] Value Error [%]C[events] 1451 1314A1[events] 4350 4.56 2580 39.57τ1[ns] 2.4 4.31 1.2 23.11
1002 No filter 1002 UV filterParameter Value Error [%] Value Error [%]C[events] 1569 1911A1[events] 6140 7.56 1430 3.00τ1[ns] 1.6 6.15 2.1 6.45
1003 No filter 1003 UV filterParameter Value Error [%] Value Error [%]C[events] 1425 1369A1[events] 3430 1.81 1930 6.13τ1[ns] 2.7 3.57 3.3 6.40
Table 4.2. The fast component decay time parameter for the PWO crystals measuredwithout any filter and with a UV filter.
component exponential function. Since this fit results in large errors especiallyfor the slow components this fit was of no use. The lead tungstate crystals 1001and 1002 have their scintillation suppressed resulting in a decay time spectrumdifferent compared to a decay time spectrum for ordinary PWO crystals. A fit ofa two component exponential function was therefore done instead. The resultingparameters for the first decay time parameter from the fits of the measurementsdone without any filter and the UV filter can be seen in table 4.2. The fitting ofthe slow component results in large errors even for a fit done with two exponentialdecay components. This is why the slow component is not presented in table 4.2.Crystal 1002, measured without filter and fitted with a two component exponen-tial, have a fast component with a decay time of 1.6 ns. For crystal 1001 and1003 is the decay time for the fast component slightly larger, around 2.5 ns. Theparameter errors are smallest for crystal 1003 which have the most scintillationand largest for the parameters that belongs to crystal 1002 which have the leastscintillation. The measurements with a UV filter gives a fast decay time of 2.1 nsfor crystal 1002. Crystal 1001 have a decay time of 1.2 ns for the fast componentand crystal 1003 a decay time of 3.3 ns for the fast component when the decaytimes is measured with a UV filter, see table 4.2. The error for the fitted param-eters are for these measurements very large for crystal 1001 but around the samesize as the non filter measurments for crystals 1002 and 1003.In figure 4.1 are the decay time spectra for all the crystals from the first decaytime measurement without any filter plotted. The decay time spectra from themeasurements with the UV filter for all measured crystals are shown in figure 4.2.The background noise level is not constant through all the measurement, this canespecially be seen in figure 4.2 where the baseline of the decay time spectrumsvaries a lot between the measurements. The baseline value is subtracted from

46 Measurements
the total number of events in each bin, to compensate for this variation in back-ground noise, resulting in decay time spectra with a baselines at the zero level.The baseline for a spectrum is the average number of events in a bin between time-114 to -27 ns when zero time is set at the peak maximum. This time interval ischosen because the baseline shows a stable behaviour within this range. A compar-ison is done between the normalized decay time spectrums from the measurementsdone with a UV filter and the measurements without any filter, see figures 4.3 - 4.5.
A sum of the number of events stored in each bin in a spectrum is done to seehow the amount of emitted light is increasing with time. The sum starts aroundthe time when the peak begin in a decay time spectrum, the bin corresponding totime -6 ns when zero time is set at the peak maximum is chosen as the start bin.This choice is made by directly look where the peak begin in the spectrum. Thenumber of events in this start bin, subtracted by the baseline value, is added tothe total number of summarized events (which is zero before this first addition).The number of events in the next bin, is then also subtracted by the baseline valueand added to the total number of summarized events. This goes on for all the binsthat follow; up to the bin representing 100 ns, resulting in the plot in figure 4.6.
Figure 4.1. The acquired decay time spectra for crystals 1001, 1002 and 1003 whenmeasured without a filter.
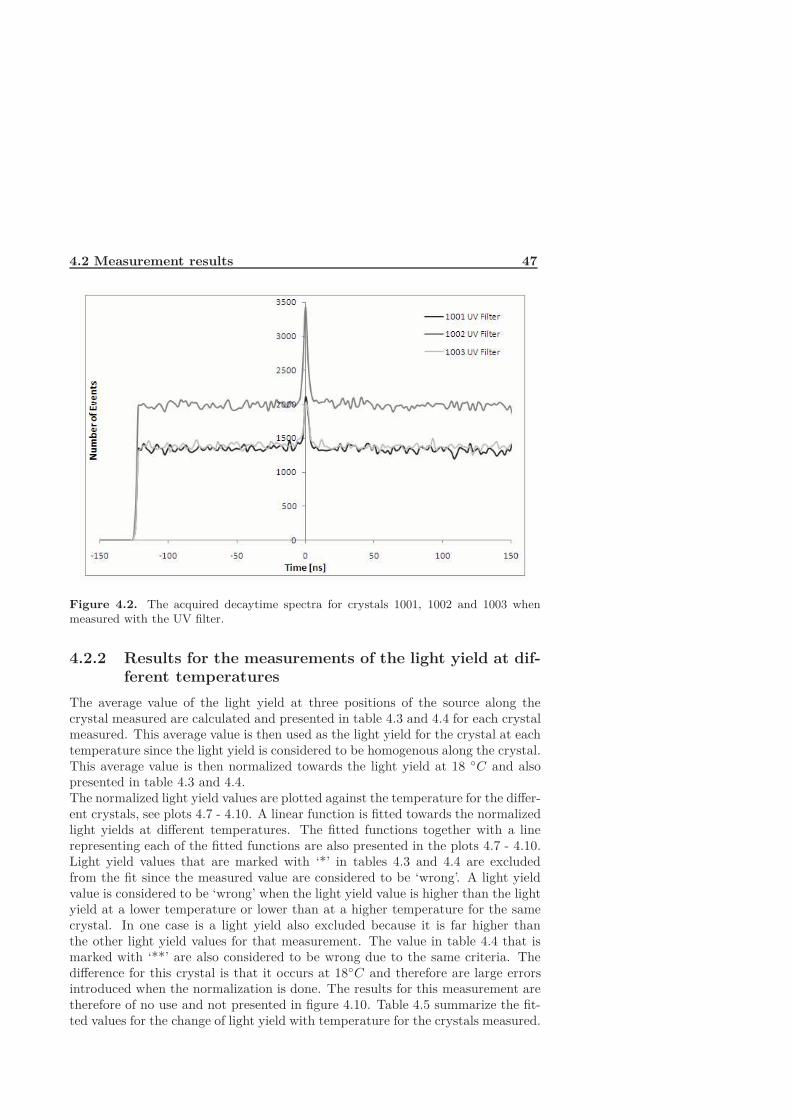
4.2 Measurement results 47
Figure 4.2. The acquired decaytime spectra for crystals 1001, 1002 and 1003 whenmeasured with the UV filter.
4.2.2 Results for the measurements of the light yield at dif-
ferent temperatures
The average value of the light yield at three positions of the source along thecrystal measured are calculated and presented in table 4.3 and 4.4 for each crystalmeasured. This average value is then used as the light yield for the crystal at eachtemperature since the light yield is considered to be homogenous along the crystal.This average value is then normalized towards the light yield at 18 ◦C and alsopresented in table 4.3 and 4.4.The normalized light yield values are plotted against the temperature for the differ-ent crystals, see plots 4.7 - 4.10. A linear function is fitted towards the normalizedlight yields at different temperatures. The fitted functions together with a linerepresenting each of the fitted functions are also presented in the plots 4.7 - 4.10.Light yield values that are marked with ‘*’ in tables 4.3 and 4.4 are excludedfrom the fit since the measured value are considered to be ‘wrong’. A light yieldvalue is considered to be ‘wrong’ when the light yield value is higher than the lightyield at a lower temperature or lower than at a higher temperature for the samecrystal. In one case is a light yield also excluded because it is far higher thanthe other light yield values for that measurement. The value in table 4.4 that ismarked with ‘**’ are also considered to be wrong due to the same criteria. Thedifference for this crystal is that it occurs at 18◦C and therefore are large errorsintroduced when the normalization is done. The results for this measurement aretherefore of no use and not presented in figure 4.10. Table 4.5 summarize the fit-ted values for the change of light yield with temperature for the crystals measured.

48 Measurements
Figure 4.3. The acquired decaytime spectra for crystal 1001, measured with a UV filterand without any filter.

4.2 Measurement results 49
Figure 4.4. The acquired decaytime spectra for crystal 1002, measured with a UV filterand without any filter.
Figure 4.5. The acquired decaytime spectra for crystal 1003, measured with a UV filterand without any filter.

50 Measurements
Figure 4.6. The summarized decay time spectra, showing how the amount of emittedlight increase with time.
118 2368Temp [◦C] Average [pe/MeV] Normalized Average [pe/MeV] Normalized16 12.60 1.065 11.37 0.99418 11.83 1.000 11.43 1.00020 11.33 0.958 10.97 0.95925 13.27* 1.121 9.43 0.82430 8.93 0.755 8.97 0.784
2210 2630Temp [◦C] Average [pe/MeV] Normalized Average [pe/MeV] Normalized16 17.10 1.026 18.10 1.00918 16.67 1.000 17.93 1.00020 16.60 0.996 17.40 0.97025 14.03 0.842 16.13 0.90030 13.43 0.806 13.67 0.762
Table 4.3. The light yield values at different temperatures for the ECAL PWO crystals118, 2368, 2210 and 2630.

4.2 Measurement results 51
1st Measurement 1001 1003Temp [◦C] Average [pe/MeV] Normalized Average [pe/MeV] Normalized16 5.27 1.002 13.40 1.13918 5.26 1.000 11.77** 1.00020 4.92 0.935 12.70 1.07925 4.74 0.901 11.73 0.99730 4.15 0.789 11.10 0.9432nd Measurement 1001 1003Temp [◦C] Average [pe/MeV] Normalized Average [pe/MeV] Normalized16 5.66 1.082 13.35 1.02418 5.23 1.000 13.03 1.00020 4.79* 0.916 12.90 0.99025 4.86 0.928 11.90 0.91330 4.65 0.889 11.13 0.8543rd Measurement 1001 1003Temp [◦C] Average [pe/MeV] Normalized Average [pe/MeV] Normalized16 4.78 1.139 13.47 1.02318 4.19 1.000 13.17 1.00020 4.10 0.978 12.87 0.97725 3.87 0.923 11.43 0.86830 3.53 0.841 11.17 0.848
Table 4.4. The light yield values at different temperatures for the crystals 1001 and1003.
Crystal 118 2368 2210 2630 1001 1003Change [%/◦C] −2.15 −1.88 −1.74 −1.76 −1.51 −1.32
- - - - −1.31 −1.24- - - - −1.26 −1.36
Average [%/◦C] −2.15 −1.88 −1.74 −1.76 −1.36 −1.31
Table 4.5. The change of light yield with temperature for all the measured crystals.

52 Measurements
Figure 4.7. The normalized average light yield at different temperatures for the BTCPprocuced crystals 118 and 2368.
Figure 4.8. The normalized average light yield at different temperatures for the SICproduced crystals 2210 and 2630.

4.2 Measurement results 53
Figure 4.9. The normalized average light yield at different temperatures for crystal1001.
Figure 4.10. The normalized average light yield at different temperatures for crystal1003.


Chapter 5
Discussion and conclusions
5.1 The influence of the temperature to light yield
5.1.1 Discussion
The origin of the lead tungstate crystals, either SIC or BCTP, seem to influencethe rate at which the light yield changes with temperature. The rate of changefor the light yield with temperature for the BTCP crystal have an average valueof −2.02 %/◦C while the SIC produced crystals shows an lower influence from thetemperature, an average of −1.75 %/◦C As mentioned earlier the light yield ispredicted to change more with the temperature for the ECAL crystals which hasmore scintillation than for crystal 1001. According to this reasoning, crystal 1001should have a lower rate of change than crystal 1003, since the scintillation forcrystal 1001 is suppressed more than for crystal 1003. The measurement resultsshow a lower influence on the light yield with a change of the temperature forcrystals 1001 and 1003 than for the ECAL lead tungstate crystals. On the otherhand is the rate of change for crystal 1001 higher than for 1003 which makesit hard to predict anything about the influence of the Cherenkov light from themeasurement results.Crystal 1001 have a low light yield compared to the other crystals measured, seetable 4.3 and 4.4. The low light yield for crystal 1001 results in a spectrum wherethe photo peak interfere with the single electron peak this makes the fitting of thespectrum drastically more complicated and the error sources bigger. On the otherhand, the rate of change for the light yield with temperature does not differ muchbetween the three measurements for crystal 1001 which indicates that the fittingis stable.
5.1.2 Conclusions
The average rate of change for the light yield with temperature for the BTCPproduced crystals was−2.02 %/◦C and for the SIC produced crystals−1.75 %/◦C.Earlier studies of the influence from temperature to the light yield have shown rates
55

56 Discussion and conclusions
of −2.0 %/◦C [11]. Crystal 1001 showed an average rate of change of −1.36 %/◦Cand crystal 1003 −1.31 %/◦C.No conclusions could be drawn about the influence from the Cherenkov light tothe total amount of emitted light from the measurements.
5.2 The decay time measurements
5.2.1 Discussion
The variation in the amount of scintillation between the crystals can be seen infigure 4.1 by looking at how the light intensity decrease with time. Scintillationlight shows an exponential decay of the light intensity while the Cherenkov lightintensity decreases more abrupt. Crystal 1003 with the most scintillation has aslower decay time comparing to crystal 1001 and 1002 which shows faster decaytimes according to figure 4.1. The fitted decay time parameters does not confirmthis reasoning. Even if the fast component for crystal 1002, which has least scin-tillation, is a bit faster than for crystal 1003 and 1001. A distinction between thefast component for crystal 1001 and 1003 cannot be made, considering the param-eter errors. The lack of scintillation light for crystals 1001 and 1002 results in veryabrupt decay time spectrums without an exponential decay and it is therefore hardto do a good fit using the model (2.6). Another reason to why the fit of the slowdecay time component results in large errors can be that the baseline of the decaytime spectra is not stable over the full time range. The fitted slow componentshave decay times much longer than expected for lead tungstate crystals. There isalso a big change of the fitted parameter values for the slow component when theconstant offset is changed slightly.The decay time spectrums in figure 4.2 are similar in shape for all three crystals.This indicates that the UV filter manage to filter away the scintillation part of thelight, it is especially obvious for crystal 1003. The reduction of the scintillationlight for the different crystals when measured with a UV filter can also be seen infigures 4.3 - 4.5.The level where the sum of the total number of events saturates in figure 4.6 givesthe amount of emitted light for that crystal. An estimation of the difference inthe amount of emitted light is estimated by comparing the ratio of this saturationlevel between the measurements. The saturation level is taken as the average valueof the total number of summarized events between time 50 ns− 100 ns. Table 5.1summarize the calculated saturation levels together with the ratio between differ-ent levels.The loss in the amount of light when applying the UV filter is largest for crystal1003 which also has the most scintillating light of the crystals. The crystal thatloses the least amount of light is 1002 which also has the least scintillating light.
5.2.2 Conclusions
The low amount of scintillating light for crystals 1001 and 1002 makes it hard todo a good fit with the use of model (2.6). The results indicates that the UV filter

5.3 Future work 57
Measurement 1001 1002 1003No Filter 1st 9143 7916 17848UV Filter 1771 3696 1418UV Filter / No Filter 0.19 0.47 0.08
Table 5.1. Saturation levels for the different measurements expressed in number ofevents and the ratio between the measurements with and without a UV filter.
used in the decay time measurements manage to filter away the scintillating light.The loss is 92% for crystal 1003, 81% for crystal 1001 and 53% for crystal 1002 tothe total amount of emitted light when the scintillation part of the emitted light isfiltered away. This value, especially for crystal 1003 which should have a similairyscintillation characteristic as ordinary PWO crystals, can be compared with earlierstudies of the Cherenkov contribution to the total amount of emitted light fromlead tungstate crystals which have shown a contribution of up to 15% [7].
5.3 Future work
5.3.1 Determination of the influence from Cherenkov light
It is as described earlier hard to draw any good conclusions from the results abouthow big the influence of the Cherenkov radiation is to the total amount of emittedlight from the lead tungstate crystals. Rather weak radioactive sources are usedin the measurements done for this work. The weak sources do not trigger muchCherenkov radiation to occur and it is therefore harder to register the Cherenkovradiation in the emitted light. A stronger source is therefore desirable to improvethe results .The crystals 1001, 1002 and 1003 that was used in the light yield and decay timemeasurements have recently been used in a test beam measurement. The testbeam provided an positron beam with energy of 120 GeV. A PMT was connectedat each end of the crystal and the particle beam intersected with the crystal in themiddle of the long side of the crystal. The angle of incidence was varied between−60◦ to 60◦ through the measurements. These measurements were repeated atdifferent temperatures varying between 18◦C to 40◦C. The acquired data fromthe test beam measurements are not analyzed yet and therefore is not any resultsavailable at this moment.
5.3.2 The status of Bench 4
The software is in a status where it is possible to run measurements to acquire aspectrum, determine the position of the photo peak and calculate the light yield,Fnuf and Rnuf. See section 3.1.4 for a more detailed description of the B4 software.Bench4 is despite this not a fully functional light yield measurement bench.When a measurement is completed in bench 4, the fitting software must be startedmanually and the required parameters for the fitting macro needs to be set manu-ally. The fitting software should ideally be started automatically by the LabView

58 Discussion and conclusions
software when a measurement is finished. The LabView software creates a stringcontaining the required parameters, what still needs to be implemented is a callto the fitting macro which starts the fitting software.The fitting software uses a set of standard initial parameter values each time itfits the fitting function (3.5) towards the acquired spectrum no matter of how thespectrum looks. The only parameter that is set, dependent on the shape of thespectrum, for the fitting function is an initial light yield. The standard initialparameters still gives a rather good fit in most cases but a better fit might beachieved by setting initial parameter values specific for a certain spectrum shape.There is a shift of the single electron peak when a spectrum, acquired without anycrystal inserted, is compared to a spectrum, acquired with a crystal inserted. Theshift of the single electron peak seems to vary between each measurement from noshift at all up to over 60 channels but usually the shift is somewhere around 10channels. The most common case is that the single electron peak shifts towardshigher channels when a crystal is inserted but there are measurements where thepeak has shifted towards lover channels. This shift does not exist in bench 3 whichuses a similar setup to acquire the light yield.Another problem with the bench is that the calibration factor changes a lot be-tween measurements seen over a long time even thou it ideally should be ratherconstant. Figure 5.1 shows how the calibration factor has varied over one year.The problem with the shift of the single electron peak might be connected to thevariation of the calibration factor since the position of the single electron peak isused for the calculation of the calibration factor (3.2).
Figure 5.1. The graph shows the variation of the calibration factor for bench 4 duringone year of measurements.

Bibliography
[1] P. Sempere Roldan: Quality control and preparation of the PWO crystalscrystals for the electromagnetic calorimeter of CMS,Doctoral student thesis,University the Santiago de Compostela, 2001
[2] CMS Collaboration: The CMS experiment at the CERN LHC, Journal ofInstrumentation 3 S08004, p.70-77, 2008
[3] CMS Collaboration: CMS The Electromagnetic Calorimeter Project, Tech-nical Design Report, CERN/LHCC 97-33, p.3, 1997
[4] P. A. Rodnyi: Physical Processes in Inorganic Scintillators,CRC Press,p.1,1997
[5] A.A. Annekov, M.V. Korzhik, P. Lecoq: Lead tungstate scintillation material,Nuclear Instr. and Methods in Physics Reaserch A490, p. 30-50, 2002
[6] W. B. Fretter, R. C. Lamb: Cerenkov radiation, in AccessScience@McGraw-Hill, http://www.accessscience.com, 1999
[7] N. Akchurin, L. Berntzon, A. Cardini, R. Ferrari, G. Gaudio, J. Hauptman,H. Kim, L. La Rotonda, M. Livan, E. Meoni, H. Paar, A. Penzo, D. Pinci, A.Policicchio, S. Popescu, G. Susinno, Y. Roh, W. Vandelli, R. Wigmans: Con-tribution of the Cherenkov light to the signals from lead tungstate crystals,Nuclear Instr. and Methods in Physics Reaserch A582, p. 474-483, 2007
[8] E. Auffray: Overview of the 63000 PWO Barrel Crystal for CMS ECALProduction, IEEE Transaction on Nuclear Science vol.55 no.3, June 2008
[9] B. Borgia, M. Diemoz, R. Faccini, E. Longo, G. Organtini, L. Pacciani, S.Pirro: Precise determination of the light yield of scintillating crystals, NuclearInstr. and Methods in Physics Reaserch A385, p.69-73, 1997
59

60 Bibliography
[10] B. Frisch: Characterisation of Scintillation Crystals for a MammographyPositron Emission Tomograph, Student diploma thesis, Vienna Universityof Technology, p.29-30, 2007
[11] R. Paramatti on behalf of CMS ECAL group: Crystal Properties in theElectromagnetic Calorimeter of CMS, CMS Conference Report, CMS CR2006/064, 2006