instruction for basic viewing of an m3 l0/l1b/l2 … · instruction for basic viewing of an m3...
TRANSCRIPT
INSTRUCTION FOR BASIC VIEWING OF AN M3 L0/L1B/L2 Image Cube File (*.IMG) USING ENVI 4.3
Prepared by: Sarah Lundeen, JPL
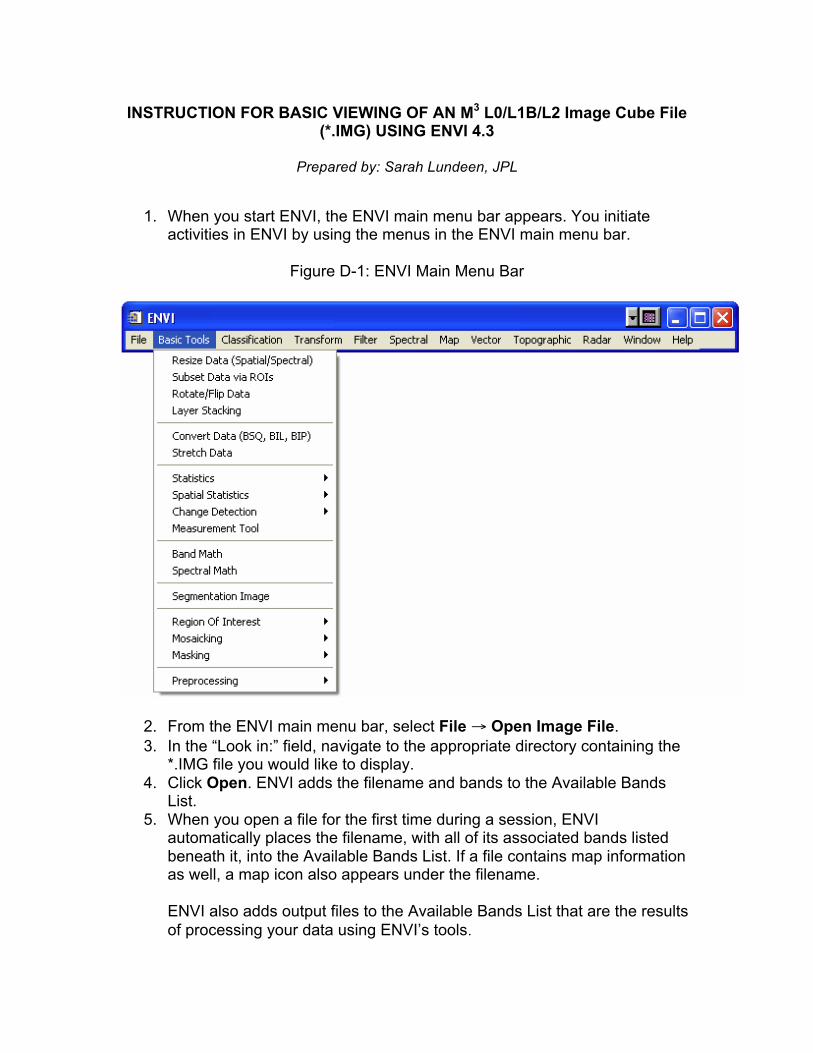
1. When you start ENVI, the ENVI main menu bar appears. You initiate activities in ENVI by using the menus in the ENVI main menu bar.
Figure D-1: ENVI Main Menu Bar
2. From the ENVI main menu bar, select File → Open Image File. 3. In the “Look in:” field, navigate to the appropriate directory containing the
*.IMG file you would like to display. 4. Click Open. ENVI adds the filename and bands to the Available Bands
List. 5. When you open a file for the first time during a session, ENVI
automatically places the filename, with all of its associated bands listed beneath it, into the Available Bands List. If a file contains map information as well, a map icon also appears under the filename.
ENVI also adds output files to the Available Bands List that are the results of processing your data using ENVI’s tools.
2
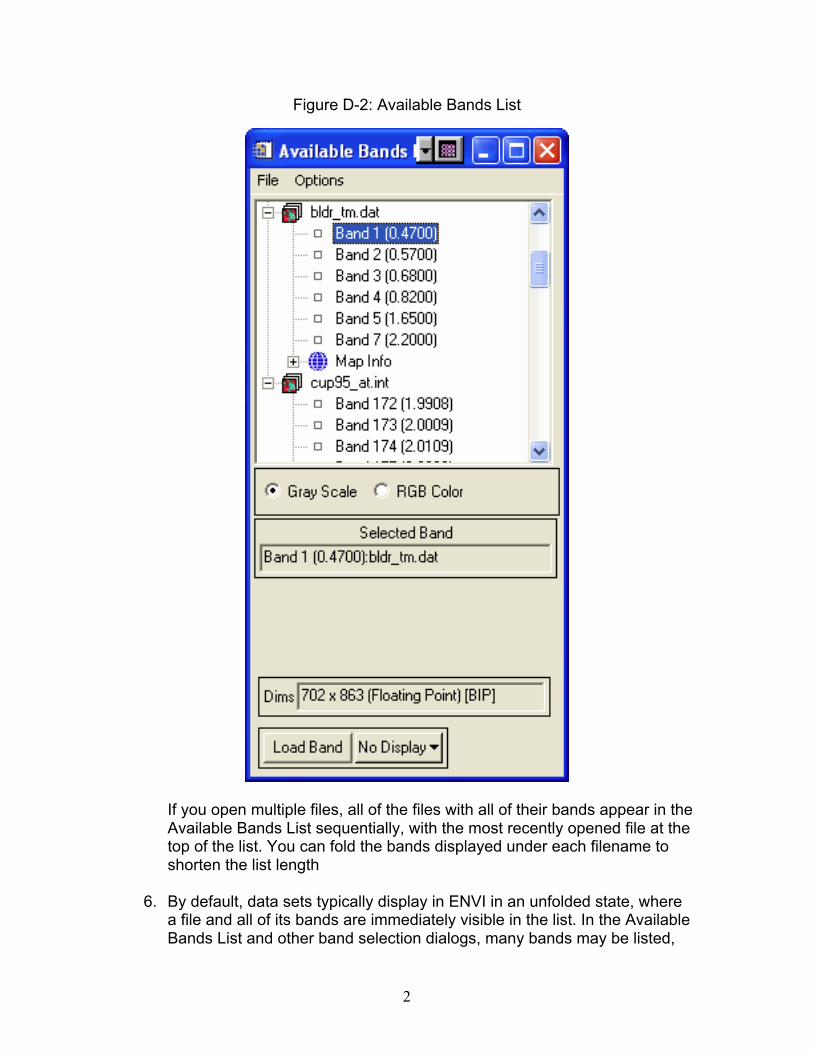
Figure D-2: Available Bands List
If you open multiple files, all of the files with all of their bands appear in the Available Bands List sequentially, with the most recently opened file at the top of the list. You can fold the bands displayed under each filename to shorten the list length
6. By default, data sets typically display in ENVI in an unfolded state, where
a file and all of its bands are immediately visible in the list. In the Available Bands List and other band selection dialogs, many bands may be listed,
3
particularly when using hyperspectral data. You can fold or hide all of the bands of a data set so that they appear on only one line. This keeps the lists shorter and easier to work with.
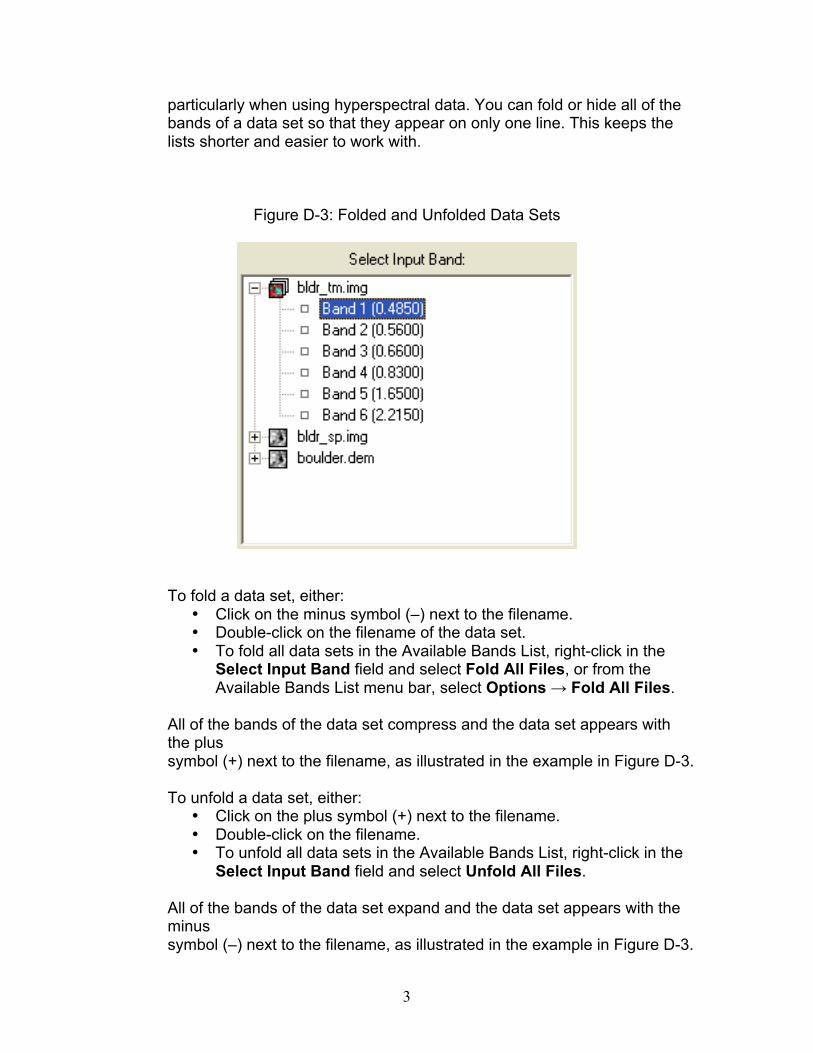
Figure D-3: Folded and Unfolded Data Sets
To fold a data set, either: • Click on the minus symbol (–) next to the filename. • Double-click on the filename of the data set. • To fold all data sets in the Available Bands List, right-click in the
Select Input Band field and select Fold All Files, or from the Available Bands List menu bar, select Options → Fold All Files.
All of the bands of the data set compress and the data set appears with the plus symbol (+) next to the filename, as illustrated in the example in Figure D-3. To unfold a data set, either:
• Click on the plus symbol (+) next to the filename. • Double-click on the filename. • To unfold all data sets in the Available Bands List, right-click in the
Select Input Band field and select Unfold All Files. All of the bands of the data set expand and the data set appears with the minus symbol (–) next to the filename, as illustrated in the example in Figure D-3.
4
If a band is currently displayed as either a gray scale or RGB image, an asterisk ( * ) appears next to the filename when it is folded.
7. To display an image, highlight the band you wish to display and select the “Gray Scale” radio button. The band name appears under the Selected Band area.
8. Click Load Band. ENVI loads the band into the display group. 9. When you select a file to display from the Available Bands List , a group of
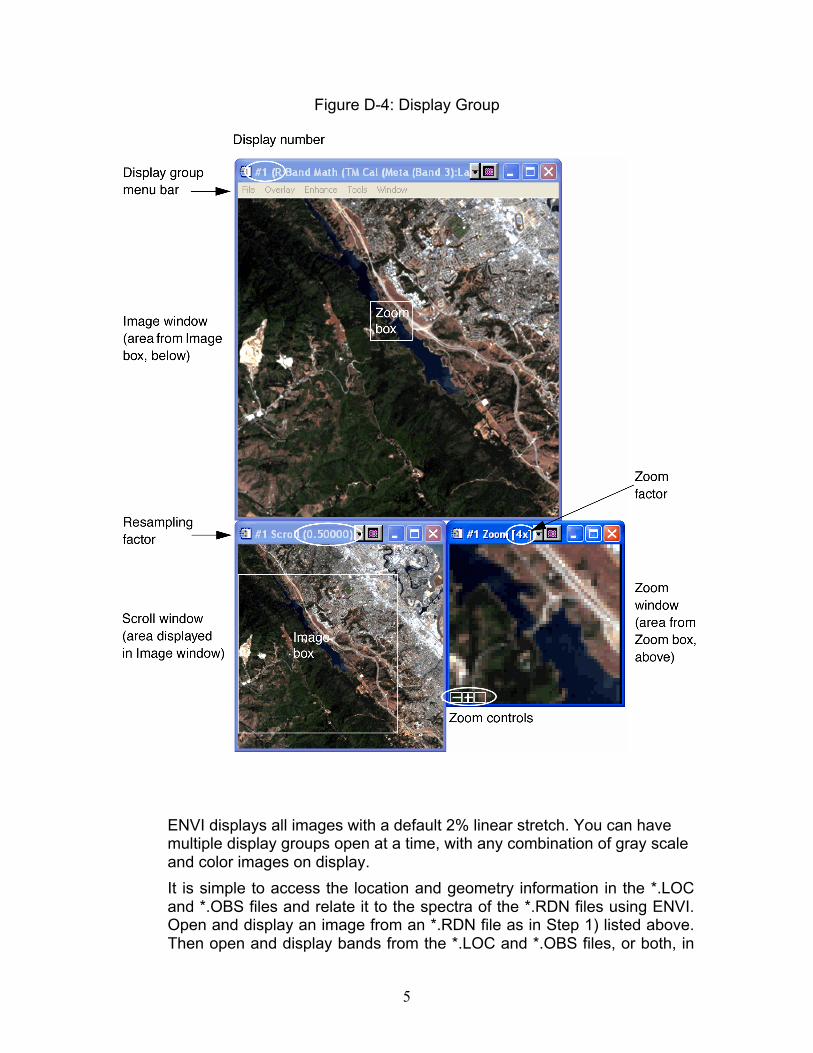
windows will appear on your screen allowing you to manipulate and analyze your image. This group of windows is collectively referred to as the display group (see Figure D-4). The default display group consists of the following:
• Image window — Displays the image at full resolution. If the image is large, the Image window displays the subsection of the image defined by the Scroll window Image box.
• Zoom window — Displays the subsection of the image defined by the Image window Zoom box. The resolution is at a user-defined zoom factor based on pixel replication or interpolation.
• Scroll window — Displays the full image at subsampled resolution. This window appears only when an image is larger than what ENVI can display in the Image window at full resolution.
5
Figure D-4: Display Group
ENVI displays all images with a default 2% linear stretch. You can have multiple display groups open at a time, with any combination of gray scale and color images on display. It is simple to access the location and geometry information in the *.LOC and *.OBS files and relate it to the spectra of the *.RDN files using ENVI. Open and display an image from an *.RDN file as in Step 1) listed above. Then open and display bands from the *.LOC and *.OBS files, or both, in

6
separate windows. Link the various windows using the Tools → Link → Link Displays pull-down menus. Once linked, you can interrogate spectra and simultaneously be provided the longitude, latitude and radius from the *.LOC file as well as values from all ten bands of observation geometry data in the *.OBS files. For more detailed documentation and user’s guides of ENVI and IDL software, visit the ITT Visual Solutions website, http://www.ittvis.com/