instructional booklet on easy and effective powerpoint design
TRANSCRIPT

1
How to Create
Easy and Effective Design using a PowerPoint
for Powerful Presentation Instructional Booklet
By YeonKyung Lee

2
Table of Contents
1. Introduction .............................................................................. 3
2. List of materials, tools, and conditions required ........................... 3
3. Sequentially ordered steps ......................................................... 4
Design Principle 1 – Don’t just use default fonts ............................ 4
Design Principle 2 – Don’t use installed templates ......................... 7
Design Principle 3 – TEXT < GRAPH < IMAGE .............................. 10
Design Principle 4 – Minimize edges of the picture ........................11
4. Conclusion .............................................................................. 14
5. Appendices ............................................................................. 14

3
1. Introduction This instructional booklet is designed for college students who frequently use Microsoft
PowerPoint program. While the importance of presentation skills is increasing, many students don’t know
how to create an effective PowerPoint slide.
The reason why you use PowerPoint slides in presentation is to deliver your messages clearly.
Effective slides can attract the attention and make your audiences concentrate. However, many students
don’t know how to use the program effectively. Common mistakes that students make are reading slides
while the presentation, using basic templates and fonts, and not using any graphs or images. By applying
simple design principles, students can make better presentations with effective PowerPoint slides.
Procedures in this instructional booklet will show you how to create effective slides out of a given
text. Instructions and graphics will be given each step to help complete the task. Moreover, important
design principles and resources that can be applied in the future will be given. Overall, this instructional
booklet will help students to understand simple and effective design principles and to create better
PowerPoint slides.
2. List of materials, tools, and conditions required
1) Computer
2) Microsoft PowerPoint program
3) Reliable internet access
4) We will make 2 PowerPoint slides with following texts:
a. Slide 1 – Title: Smartphone company market share
b. Slide1 – Content: IDC found that for the second quarter of 2013, devices running on
Google’s Android operating system had a 79.3 percent share, Apple’s iOS came in at 13.2
percent, Microsoft’s Window Phone ad 3.7 percent, and BlackBerry notched 2.9 percent of
the market.
c. Slide 2 – Content: U.S. Smartphone Penetration Is at 74 Percent
5) We will insert 2 Images on slides:
Image 1 Image 2
4
3. Sequentially ordered steps
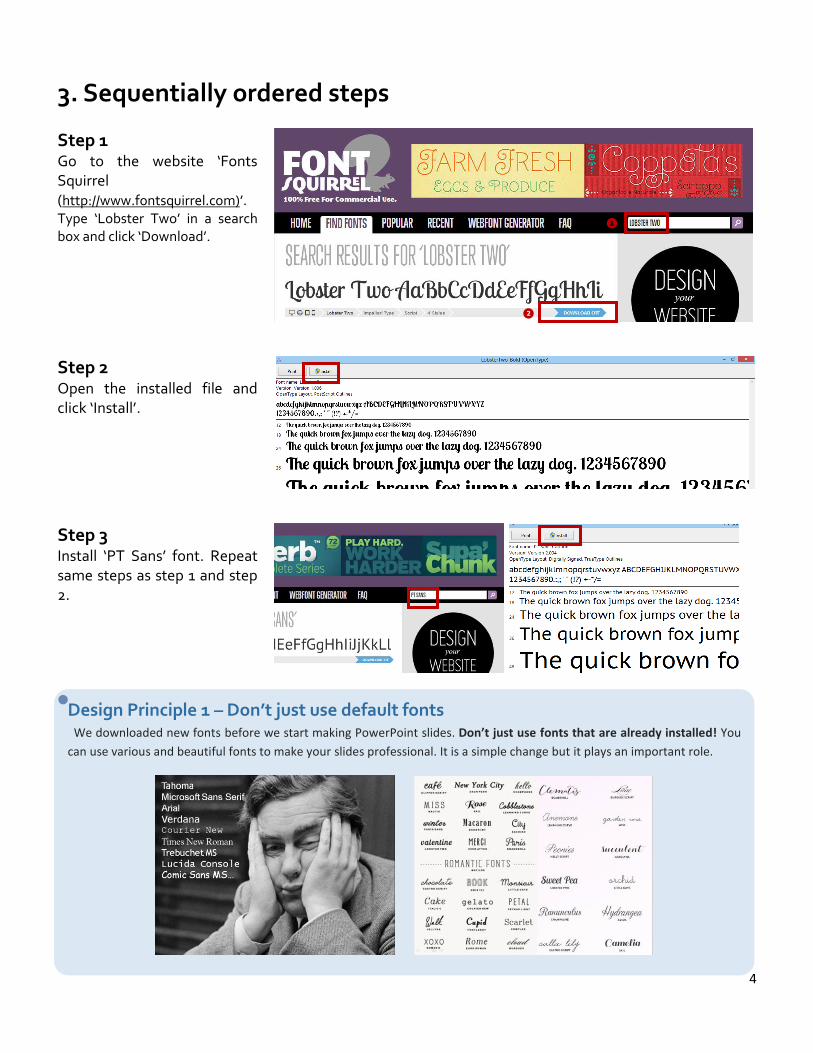
Step 1 Go to the website ‘Fonts Squirrel (http://www.fontsquirrel.com)’. Type ‘Lobster Two’ in a search box and click ‘Download’.
Step 2 Open the installed file and click ‘Install’.
Step 3 Install ‘PT Sans’ font. Repeat same steps as step 1 and step 2.
❶
❷
Design Principle 1 – Don’t just use default fonts We downloaded new fonts before we start making PowerPoint slides. Don’t just use fonts that are already installed! You
can use various and beautiful fonts to make your slides professional. It is a simple change but it plays an important role.
Fig 1. Example of boring fonts and beautiful fonts

5
Step 4 Start a Microsoft PowerPoint program.
Step 5 Insert the title of a slide 1. Click Menu - Insert – Text box – Horizontal text box to make a text box. Drag your mouse to change the box’s size.
Step 6 Change the font to ‘Lobster two’ and size to ‘54’ at Menu – Home – Font.
Drag your mouse to change the size

6
Step 7 Insert a rectangle figure. Click Menu – Insert – Shapes – Rectangle. On a slide, drag your mouse to create rectangle.
Step 8 Change the box’s color and outline. Click Menu – Format and change ‘Shape Fill’ to ‘Dark red’ and ‘Shape Outline’ to ‘No outline’.
Step 9 Insert a line under the title. Click Menu – Insert – Shapes – Line. On a slide, drag your mouse to draw a line.
Drag your mouse
❶
❷
Drag your mouse
❶
❷
7
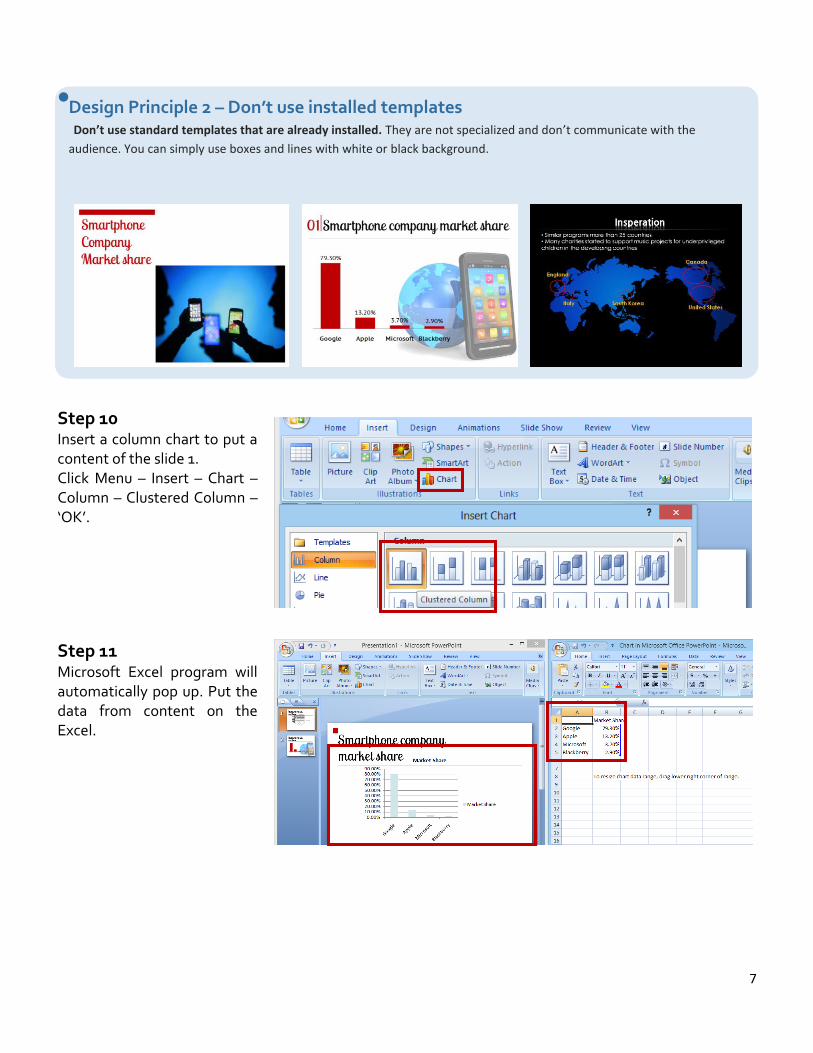
Step 10 Insert a column chart to put a content of the slide 1. Click Menu – Insert – Chart – Column – Clustered Column – ‘OK’.
Step 11 Microsoft Excel program will automatically pop up. Put the data from content on the Excel.
Design Principle 2 – Don’t use installed templates Don’t use standard templates that are already installed. They are not specialized and don’t communicate with the
audience. You can simply use boxes and lines with white or black background.
Fig. 2 Example of different titles and backgrounds

8
Step 12 Change a layout of the chart. Click Menu – Chart Tools –Design – Chart Layouts – Layout 4.
Step 13 Select the vertical axis data and delete it to make a chart simple.
Step 14 Change a chart color to red. Click Menu – Chart Tools – Design and choose red color in ‘Chart Styles’ column.

9
Step 15 Change font and size of the text inside the chart. Click the text in the chart with right click button and change a font to ‘PT Sans’ and size to ‘20’.
Step 16 Insert the Image 1. If you copied the image, put Ctrl+V on a keyboard to paste it. If you saved it, click Menu - Insert – Picture.
Step 17 Send the image backward. Click the image with right click button and click Send to back – Send to back.
❶
❷
Right click button
Right click button ❶
❷

10
Step 18 Change brightness and contrast of the image. Click image – Menu – Picture Tools – Format – Change brightness to +30% and contrast to -40%.
Step 19 Insert a new slide. Click right click button on a ‘Slides’ tab. Select ‘New slide’.
Design Principle 3 – TEXT < GRAPH < IMAGE Don’t put every detail on the slide. You’re giving a presentation, not a document. Change the data into charts and insert
interesting images. Graphs and pictures are strong tools that support your message.
Fig 3. Example of using images and graphs
11
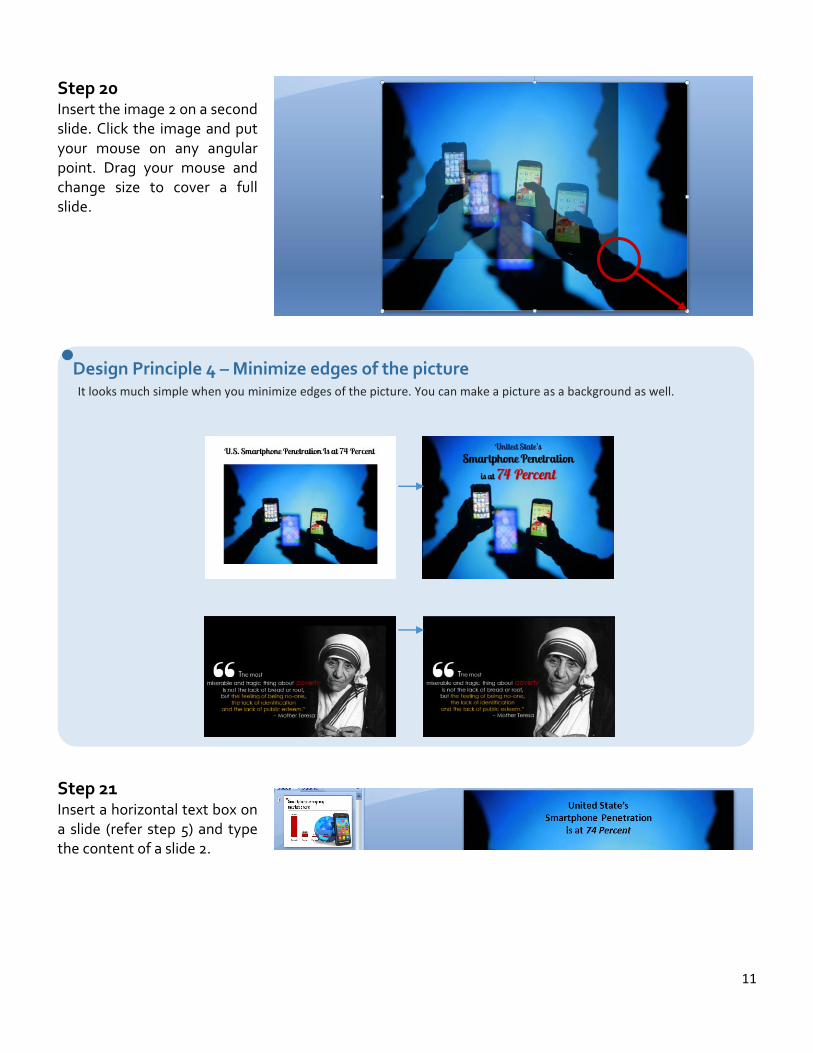
Step 20 Insert the image 2 on a second slide. Click the image and put your mouse on any angular point. Drag your mouse and change size to cover a full slide.
Step 21 Insert a horizontal text box on a slide (refer step 5) and type the content of a slide 2.
Design Principle 4 – Minimize edges of the picture It looks much simple when you minimize edges of the picture. You can make a picture as a background as well.
Fig 4. Example of using images and graphs

12
Step 22 Change the font to ‘Lobster two’ (refer step 6). Put different color and size effects on different words. Drag the word you want to change and change color and size.
‘United State’: Color - Blue, size – 32
‘Smartphone Penetration’: Color - Black, Size – 44
‘74%’: Size - 54, Color - Red, Italic effect
Step 23 Give shadow effect on a text. Click Menu – Format – Text effects – Shadow – Offset diagonal bottom right.

13
Step 24 Embed the font to the slide before you save. You can see the same font even though you use different computers without installing again. Click Office button – PowerPoint Options.
Step 25 When Power Point Options pops up, click save and check ‘Embed fonts in the file’. Select ‘Embed all characters (best for editing by other people)’ and Click ‘OK’.
Step 26 Save slides. Click Office button – Save as.

14
4. Conclusion Finished slides are look like below pictures.
Slide 1 Slide 2
5. Appendices 1) Free font download sources
Font Squirrel (http://www.fontsquirrel.com)
The League of Movable type (https://www.theleagueofmoveabletype.com)
Lost Type (http://www.losttype.com/browse/)
2) Free and quality image sources
Google (http://www.google.com)
Getty Images (http://www.gettyimages.com/)
Everystockphoto.com (http://www.everystockphoto.com/)