instructional materials for benford’s law: conceptual ...mysite.du.edu/~hkim162/pdf/instructional...
TRANSCRIPT

1
Instructional Materials for Benford’s Law: Conceptual
Background and Guided Software Instruction with
Supporting Teaching Notes
Abstract
Developing teaching materials suitable for audit professionals is an important step towards
increasing the understanding and usage of the Benford’s Law feature within Generalized Audit
Software. This teaching material provides both a conceptual background about Benford’s Law
and guided instructions about using the Benford’s Law feature of ACL to perform fraud
detection procedures. The associated teaching notes augment the instructional material with post
tests and an assignment covering Benford’s Law with accounting data.
Keywords: Generalized audit software; ACL; Benford’s Law; Digital Analysis
Introduction
Generalized audit software (GAS) has the potential to increase the efficiency of auditors in
performing many audit processes. However the usage of GAS is still relatively low, especially
the advanced features of GAS (i.e. Benford’s Law), in part because auditors perceived that
advanced features are useful but not easy to use (Kim, Mannino, and Nieschwietz 2009).
Advanced feature training can increase not only auditors’ perceptions of usefulness and ease of
use, but also the usage of advanced features of GAS among audit professionals (Kim, Mannino,
and Nieschwietz 2011).
Benford’s Law, developed by Frank Benford, is based on Benford’s findings that low first digits
occurred more frequently in most sets of data (Benford 1938). It has been implemented in GAS
(i.e. ACL and IDEA) as an advanced analytic tool to detect potential anomalies. Students can
apply this feature to most accounting data except invented, contrived, or manipulated numbers.
Novices with Benford’s Law, either audit professionals or students majoring in accounting, will

2
learn the background knowledge of Benford’s Law and how to use the Benford’s Law feature of
ACL to find fraudulent data through the materials provided in the appendices.
The teaching materials provide a short lecture on Benford’s Law, an exercise with guided
instructions, and a case-based assignment to apply the Benford’s Law feature of ACL. The
lecture on the conceptual background of Benford’s Law provides the foundation for students to
effectively use the Benford’s Law feature of ACL. In the initial exercise (Appendix 1), students
should follow all directions from the exercise to practice the Benford’s Law feature of ACL with
expense reimbursement data1. In the case-based assignment (Appendix 2), they will practice
what they learned from the exercise to answer the questions provided in the assignment.
These instructional materials were used by professional internal auditors in the data collection of
a study focusing on the impact of advanced feature training for Generalized Audit Software (Kim,
Mannino, and Nieschwietz, 2011). Fifty internal auditors used the lecture, guided exercise,
quizzes, and assignment. Before conducting the study, the material was developed through pilot
testing conducted using a master’s level advanced auditing class and several internal auditors.
Teaching notes for lecture, exercise, and assignment
Summary of the lecture
A web-based lecture is produced by the authors to improve the understanding of theory behind
the advanced analytic feature of GAS. Students will gain an understanding of the conceptual
knowledge of Benford’s Law through the lecture. This lecture covers the definition, history,
examples, applications, and exceptions of Benford’s Law. The lecture is available on the
1 Data file from “Auditing: A Business Risk Approach; 6th edition; South-western; 2008; L. E. Rittenberg, B. J.
Schwieger, K. Johnston.”

3
YouTube2 and the lecture slides are also available at the public link
3. It will take approximately
15 minutes.
Summary of the exercise
The exercise is a guided self-tutorial asking students to find suspicious employees among 1000
expense reimbursement records. They should follow the numbered steps to learn how to perform
digital analysis with expense reimbursement data. This exercise covers downloading a data file,
creating a project, importing a table, performing a first digit analysis, graphing the output of the
first digit analysis, performing a first two digits analysis, graphing the output of the first two
digits analysis, changing the format of data to ASCII to summarize the data, and summarizing
the data file to identify employees having suspicious transactions. The original excel file4 is
available on the Cengage Learning website without cost, but we ask students download the data
file from the link in the exercise.
Summary of the assignment
The assignment is a case-based practice of Benford’s Law with invoice data. Students will be
given simple instructions to find suspicious vendors among 2000 records in the invoice data of
Wake County. This case-based assignment deepens the understanding of students how Benford’s
Law can be applied in real situations. The original excel file5 is available on the EZ-R Stats
website without cost, but we ask students to download the file from the link in the assignment
because the file we provide is already prepared for the assigned audit tasks.
2 http://www.youtube.com/watch?v=D-JNc8RXT6w, http://www.youtube.com/watch?v=zH6CCg9Rhhk (April,
2011) 3 http://ouray.ucdenver.edu/~h1kim/BenfordsLaw/ConceptualBackground/ConceptualBackground.ppt (April,
2011) 4
http://www.thomsonedu.com/accounting/book_content/0324375581_rittenberg/biltrite_data_files/Expense
Reimbursements.xls (April 2011)
5 http://www.ezrstats.com/CS/CS_Wake_County.htm (April, 2011)

4
Teaching objectives and target audience
Through the teaching material, we are intended for students to acquire the knowledge and skills
to
Understand the conceptual background of Benford’s Law
Understand how to perform the Benford’s Law feature of ACL with accounting data.
Learn how to graph the output of Benford’s analysis in ACL.
Understand how to interpret the result of Benford’s analysis.
The target audience for the lecture, exercise, and the assignment are novices with Benford’s Law,
either audit professionals or accounting students who could become auditors. In order to
complete these exercise and assignment, they need to have basic knowledge of computers and
the functionalities of ACL6
Teaching approach
We suggest instructors to present the web-based lecture on Benford’s Law first because most
advanced features of GAS (i.e. Benford’s Law) require an understanding of theories behind the
software. Then instructors can ask students to follow the instructions of the exercise to
familiarize themselves with the Benford’s Law feature of ACL. Once students understand how to
use the Benford’s Law feature of ACL, instructors can give students the assignment to practice
Benford’s Law with invoice data. If students already know the theoretical background of
Benford’s Law, instructors can skip the lecture part. We suggest four test questions to ensure
students to understand the conceptual part of Benford’s Law.
6 Import, Age, Classify, Duplicates/Gaps/Sequence, Export, Extract, Filters, Join Files, Sampling, Sort, Statistics,
Stratify, Summarize, Verify, etc.

5
Lecture quiz
1. What is Benford’s Law?
a. The primary mechanism for retrieving information from a database.
b. A form of digital analysis based on the findings that low first digits occur more
frequently in most sets of data.
c. A statistical technique whether there are differences between the average value, or
mean, across several population groups.
d. The application of audit procedures to less than 100% of the items within a
population to obtain audit evidence about a particular characteristic of the population.
2. What is the typical usage of Benford’s Law?
a. Predict membership of an individual observation in a predefined group.
b. Discover a mathematical relationship between two or more variables using a set of
individual observations.
c. Detect potential fraud, possible errors, manipulated biases, and costly processing
inefficiencies or other irregularities.
d. Calculate and compare ratios which are derived from the information in a company’s
financial statements or from other non-financial information.
3. Which data typically conform to Benford’s Law?
a. NYSE stock quotes
b. Invoice numbers
c. Account payable amounts
d. Hourly wage rates
4. What procedure is not recommended to identify fraudulent data?
a. Make sure if data conform to Benford’s Law.
b. Examine the negative peaks if actual proportion exceeds Benford’s Law-predicted
proportion.
c. Verify if there is any abnormal level of duplication for a certain digit.
d. Check the amounts just below a limit, the rounded amounts, and repeated digit
patterns through digit tests.
Lecture quiz answers
The answers to lecture questions are as follows.

6
1. What is Benford's Law? b
2. What is the usage for Benford's Law? c
3. Which data typically conform to Benford's Law? c
4. What procedure is not recommended to identify fraudulent data? b
Analysis of Exercise
An abnormal level of items is processed at transactions started with 49 and 24. EMP_NO 265
has 10 transactions right below the approval level of $5,000. These transactions need detail
review.
The answers to lecture questions are as follows.
1. How many transactions are started with 24? 71 records
2. How many transactions are between 2,400 and 2,500? 22 records
3. When you summarize the transactions between 2,400 and 2,500 by EMP_NO, are there any
suspicious employees? No
Analysis of Assignment
All transactions are under $2,500. Vendor A11 accounts for almost 50% of the transactions. As
the fiscal year end approached, A11 submitted lots of invoices. Many invoices were paid to
vendor A11 in the same invoice date and same invoice number.
The answers to lecture questions are as follows.
1. How many transactions were started with 16? 146 records.
2. How many transactions are between 1,600 and 1,700? 22 records
3. When you summarize the transactions between 1,600 and 1,700 by EMP_NO, are there any
suspicious vendors? A11
4. How many transactions were started with 17? 125 records

7
5. How many transactions are between 1,700 and 1,800? 112 records
6. When you summarize the transactions between 1,700 and 1,800 by EMP_NO, are there any
suspicious vendors? A11
Concluding remarks
Theses instructional materials are designed for instructors to present the Benford’s Law feature
of ACL with theoretical lecture and practical cases. Students can enhance their knowledge of
Benford’s Law through the web-based conceptual lecture and have hand-on practices with
Benford’s Law using ACL. After completing the instructional materials, students will improve
their understanding of Benford’s Law in theory, and be more proficient in using the software so
that the usage of advanced features of GAS in practice will be increased, improving their audit
efficiency.
References
Benford, F. (1938) The law of anomalous numbers. Proceedings of the American Philosophical
Society, March, 551–572
Kim, H., Mannino, M., and Nieschwietz, R. J. (2009) “Information Technology Acceptance in
the Internal Audit Profession: Impact of Technology Features and Technology Complexity,”
International Journal of Accounting Information Systems 10, 4 (December 2009), 214-228.
Kim, H., Mannino, M., and Nieschwietz, R. J. “Technology Training of Internal Auditors:
Impact of Advanced Features of Generalized Audit Software,” CSIS Program Working Paper,
University of Colorado Denver, 2011.

8
Appendix 1: ACL Exercise with Expense Reimbursement
Data
Learning Objectives
After this exercise, you should have acquired the knowledge and skills to
Understand how to perform Benford’s Law in ACL with accounting data.
Learn how to graph the output of Benford’s analysis in ACL.
Understand how to interpret the result of Benford’s Law.
Conventions Used in the Exercise
To facilitate your reading of this tutorial, some conventions are useful. Table 1 lists the
conventions along with examples.
Term Convention Examples
Data files, typed input Italics ExpenseReimbursements.xls
Icons, commands, equations Bold File | New | Project
Field names FULL CAPS AMOUNT Table 1 Convention Used
Time estimation: Approximately 20 minutes
Assume that you are auditing the expense reimbursement records of ABC Company for 2007.
Company policy requires receipts for expenses greater than $25 for the travel, entertainment, and
meal reimbursements. All reimbursements over $5,000 require management approval separately.
Use Benford’s Law in ACL to identify employees who is circumventing this policy.
ExpenseReinbursements.xls contains 1,000 transaction records with document number, employee
number, and amount.
STEP #1 - Obtaining the data files from the website and loading onto the PC
9
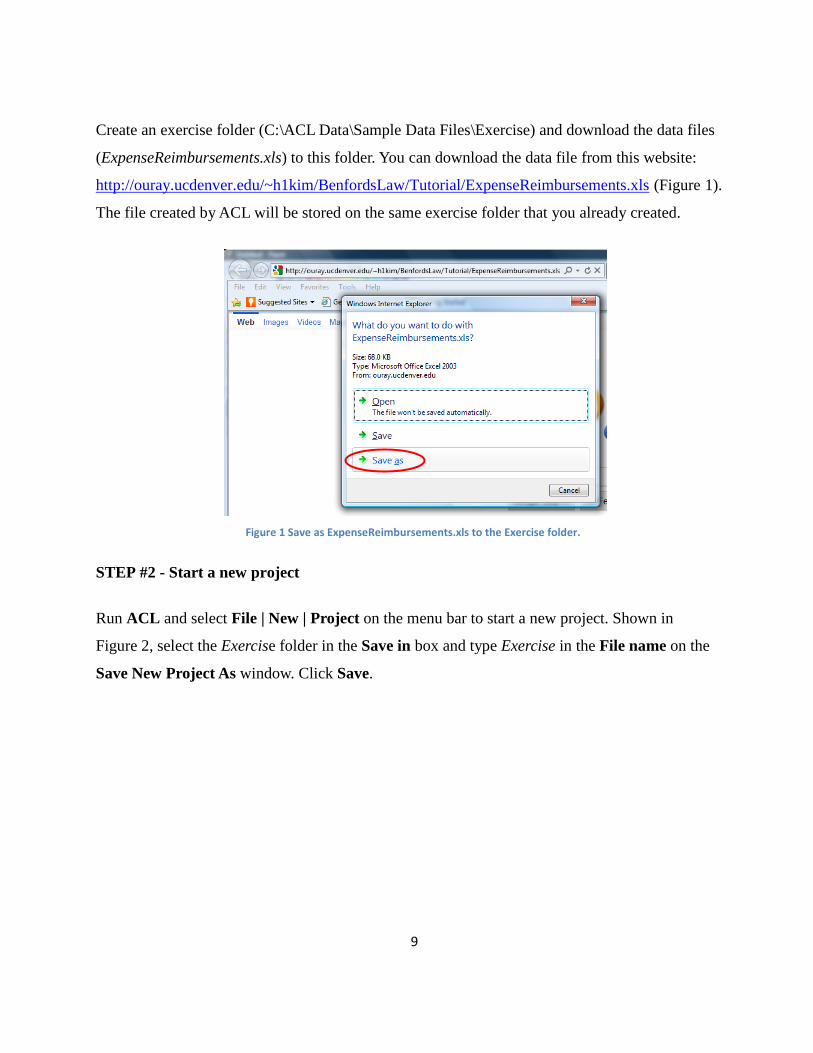
Create an exercise folder (C:\ACL Data\Sample Data Files\Exercise) and download the data files
(ExpenseReimbursements.xls) to this folder. You can download the data file from this website:
http://ouray.ucdenver.edu/~h1kim/BenfordsLaw/Tutorial/ExpenseReimbursements.xls (Figure 1).
The file created by ACL will be stored on the same exercise folder that you already created.
Figure 1 Save as ExpenseReimbursements.xls to the Exercise folder.
STEP #2 - Start a new project
Run ACL and select File | New | Project on the menu bar to start a new project. Shown in
Figure 2, select the Exercise folder in the Save in box and type Exercise in the File name on the
Save New Project As window. Click Save.

10
Figure 2 Create the Exercise project in the Exercise folder.
STEP #3 – Import a table
To import a file, click Next on the Data Definition Wizard window. Click Next on the Select
Data Source window. Shown in Figure 3, select ExpenseReimbursements.xls on the Select File
to Define window. Click Open.
Figure 3 Select ExpenseReimbursements.xls to import.
11
Click Next three times. Give the file a new name – ExpenseReimbursements. Click Save | Finish,
and OK on the Table ‘Untitled’ changed, save as window. If you successfully import the
expense reimbursements table, you can see the table shown in Figure 4.
Figure 4 Correctly imported Expense Reimbursement data file into ACL.
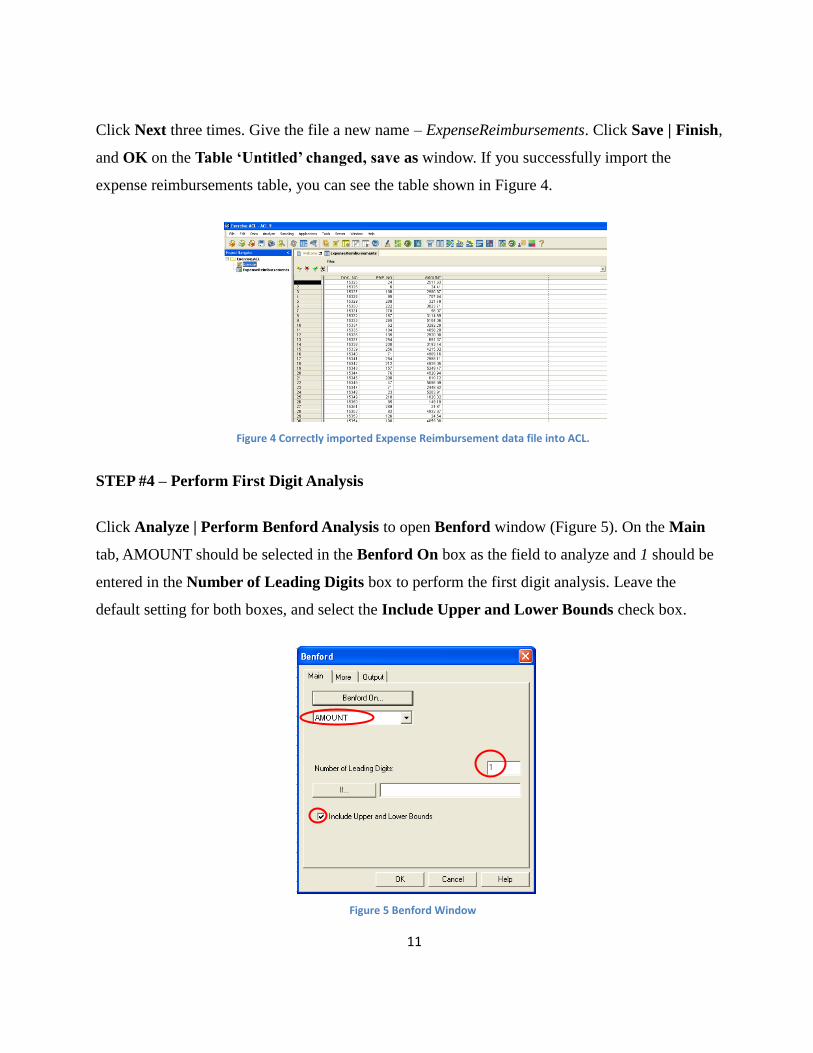
STEP #4 – Perform First Digit Analysis
Click Analyze | Perform Benford Analysis to open Benford window (Figure 5). On the Main
tab, AMOUNT should be selected in the Benford On box as the field to analyze and 1 should be
entered in the Number of Leading Digits box to perform the first digit analysis. Leave the
default setting for both boxes, and select the Include Upper and Lower Bounds check box.
Figure 5 Benford Window
12
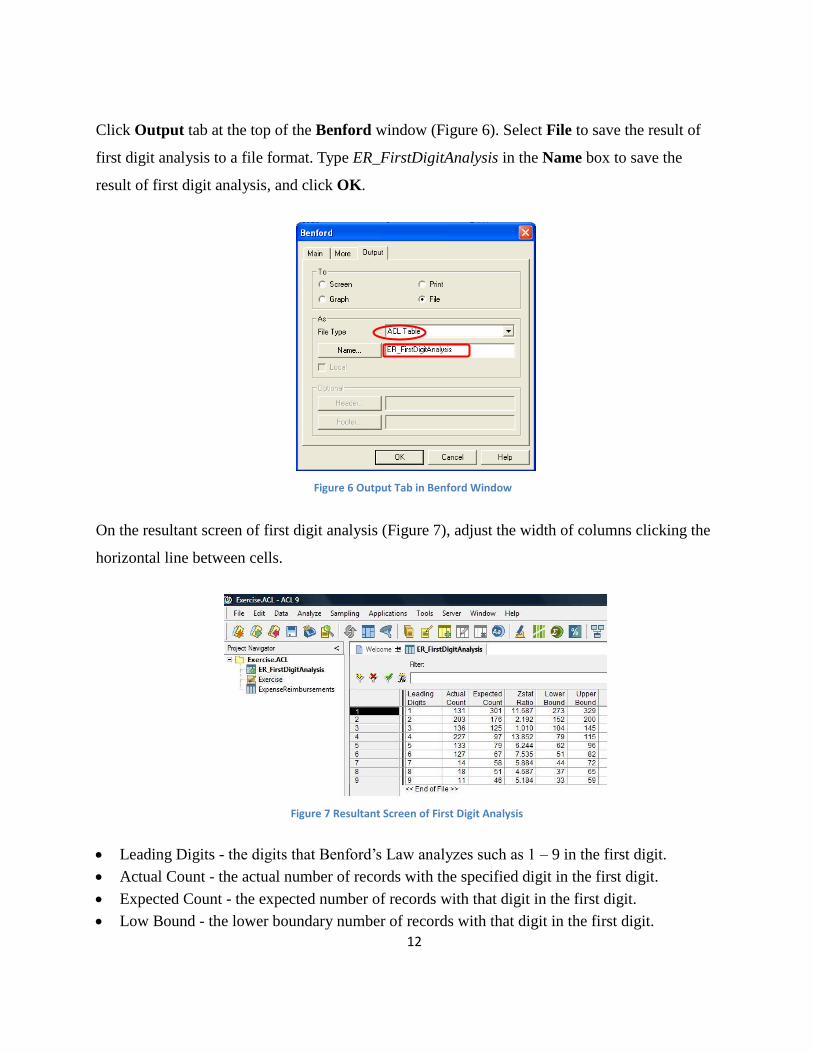
Click Output tab at the top of the Benford window (Figure 6). Select File to save the result of
first digit analysis to a file format. Type ER_FirstDigitAnalysis in the Name box to save the
result of first digit analysis, and click OK.
Figure 6 Output Tab in Benford Window
On the resultant screen of first digit analysis (Figure 7), adjust the width of columns clicking the
horizontal line between cells.
Figure 7 Resultant Screen of First Digit Analysis
Leading Digits - the digits that Benford’s Law analyzes such as 1 – 9 in the first digit.
Actual Count - the actual number of records with the specified digit in the first digit.
Expected Count - the expected number of records with that digit in the first digit.
Low Bound - the lower boundary number of records with that digit in the first digit.
13
Upper Bound - the upper boundary number of records with that digit in the first digit.
Zstat Ratio - the probability of the deviation between the actual count and the expected count
of the digit.
Any Zstat Ratio greater than 2.58 would indicate a 99% chance of deviation between actual
count and expected count, a very rare occurrence. You will focus on the largest Zstat Ratio to
find unusual transactions processed in the data file. Right click the title bar of the ZSTAT
RATIO column, and click Quick Sort Descending. Actual and expected counts of first digit are
most significantly different at digit 4 with Zstat Ratio of 13.852. Double click the
ExpenseReimbursement in the left pane of Project Navigator to go back to the original data file.
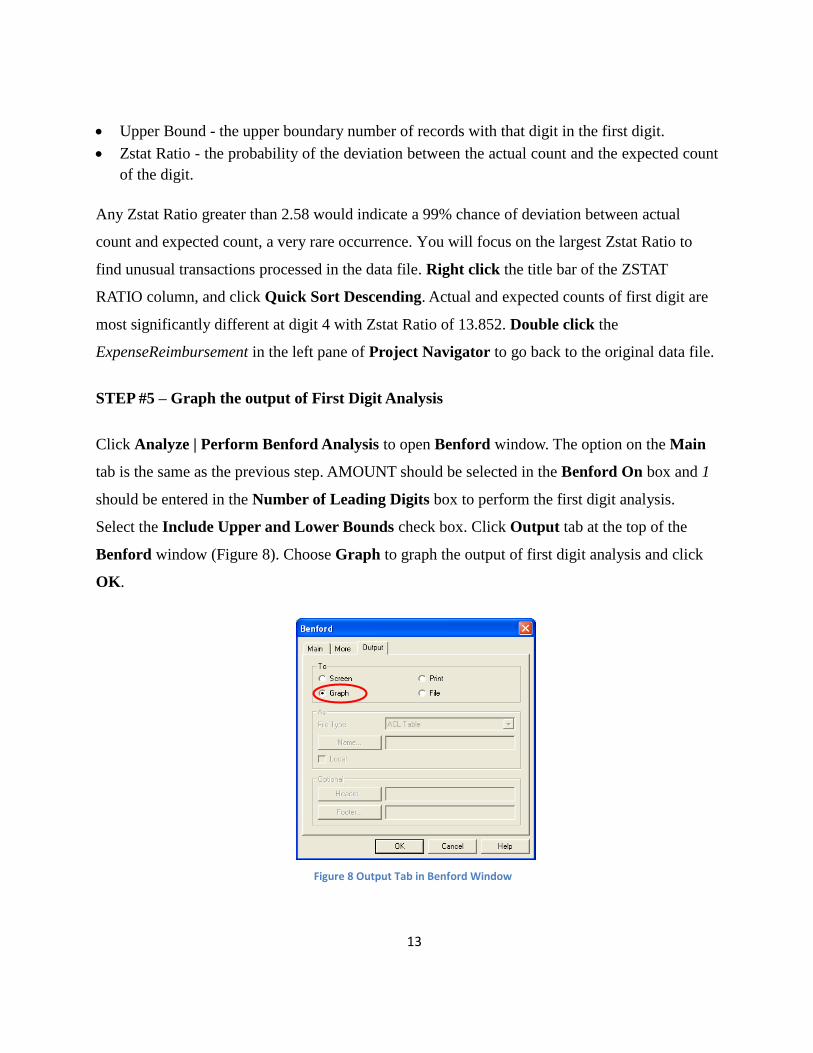
STEP #5 – Graph the output of First Digit Analysis
Click Analyze | Perform Benford Analysis to open Benford window. The option on the Main
tab is the same as the previous step. AMOUNT should be selected in the Benford On box and 1
should be entered in the Number of Leading Digits box to perform the first digit analysis.
Select the Include Upper and Lower Bounds check box. Click Output tab at the top of the
Benford window (Figure 8). Choose Graph to graph the output of first digit analysis and click
OK.
Figure 8 Output Tab in Benford Window

14
Figure 9 is the first digit graph of the Expense Reimbursements data file. It shows the actual,
expected, lower bound, upper bound numbers of the digits appeared in the first digit. The digit 4
is the highest positive spike indicating an abnormal level of items being processed at digit 4 in
the first digit, which is just below the additional approval level of $5,000.
Figure 9 First Digit Graph
Double click the bar of digit 4 to see the records started with digit 4. You can see (LEADING
(AMOUNT, 1) = “4”) in the Filter box. Click Analyze | Total Fields to see the total number of
records started with digit 4. On the Total window (Figure 10), click DOC_NO and then click
OK.
Figure 10 Click “DOC_NO” to see the number of records.
227 transactions are started with digit 4. Close the Total window. Double click
ExpenseReimbursements in the left pane of Project Navigator to go back to the records started

15
with digit 4. Delete (LEADING (AMOUNT, 1) = “4”) in the Filter box to see all records in the
original data file.
STEP #6 – Change the format of data
To find suspicious employees in the expense reimbursement data file, you need to summary data
by employee number. So the data type of employee number should be changed into the ASCII
format. Click Edit | Table Layout to open the table layout window. Double click EMP_NO on
the Edit Fields/Expressions tab (Figure 12).
Figure 11 Change the data format of EMP_NO to ASCII to summarize by EMP_NO.
Shown in Figure 12, change Type into ASCII. Click the Accept Entry icon and then click the
Close icon on the Table Layout window. This step can be done immediately after the data file is
imported.

16
Figure 12 Edit Fields/Expressions Window
STEP #7 – Perform First Two Digits Analysis
The first two digits analysis is a high level test and it has a same process to the first digit analysis
except the setup for the number of leading digits. Click Analyze | Perform Benford Analysis to
open Benford window. Shown in Figure 13, AMOUNT should be selected in the Benford On
box and 2 should be entered in the Number of Leading Digits box on the Main tab to perform
the first two digits analysis. Select the Include Upper and Lower Bounds check box.
Figure 13 Set up for first two digits analysis.
17
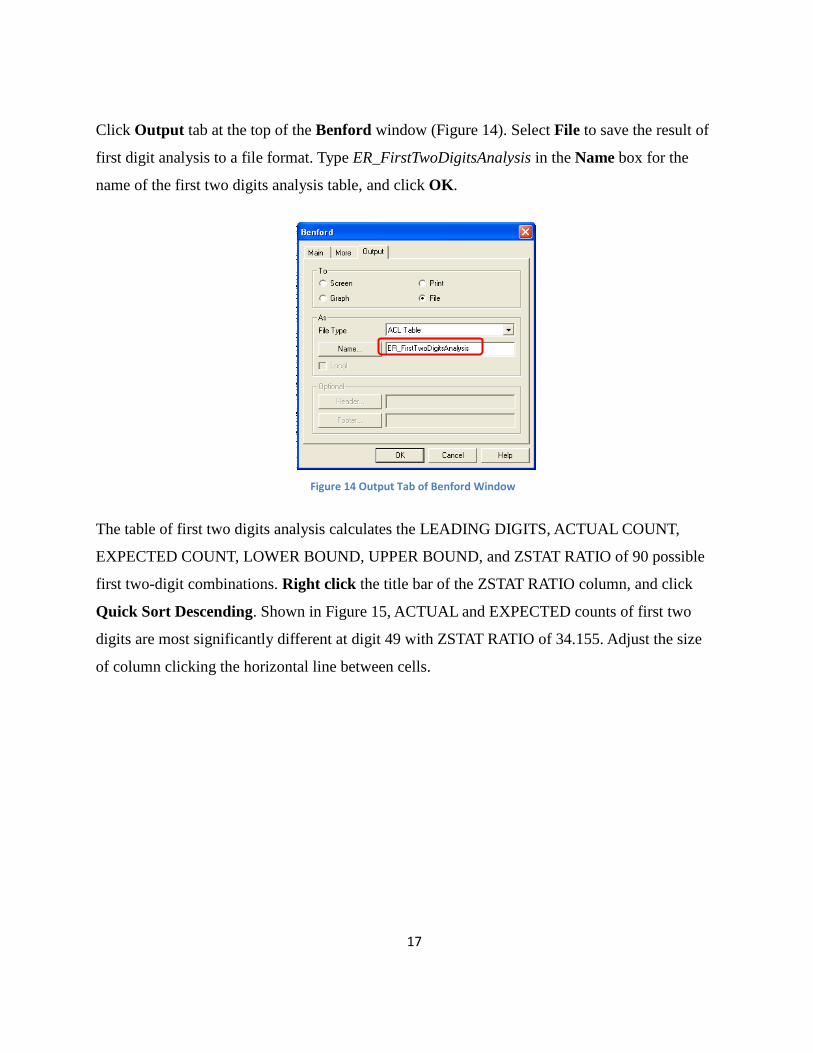
Click Output tab at the top of the Benford window (Figure 14). Select File to save the result of
first digit analysis to a file format. Type ER_FirstTwoDigitsAnalysis in the Name box for the
name of the first two digits analysis table, and click OK.
Figure 14 Output Tab of Benford Window
The table of first two digits analysis calculates the LEADING DIGITS, ACTUAL COUNT,
EXPECTED COUNT, LOWER BOUND, UPPER BOUND, and ZSTAT RATIO of 90 possible
first two-digit combinations. Right click the title bar of the ZSTAT RATIO column, and click
Quick Sort Descending. Shown in Figure 15, ACTUAL and EXPECTED counts of first two
digits are most significantly different at digit 49 with ZSTAT RATIO of 34.155. Adjust the size
of column clicking the horizontal line between cells.

18
Figure 15 Actual and expected counts are most significantly different at digit 49.
Double click ExpenseReimbursements in the left pane of Project Navigator to go back to the
original file.
STEP #8 – Graph the output of First Two Digits Analysis
Click Analyze | Perform Benford Analysis to open Benford window. On the Main tab,
AMOUNT should be selected in the Benford On box and 2 should be entered in the Number of
Leading Digits box to graph the first two digits analysis. Select the Include Upper and Lower
Bounds check box. Click Output tab at the top of the Benford window. Choose Graph to create
the first two digits graph and click OK.

19
Figure 16 First Two Digits Graph
Shown in Figure 16, 49 that caused the spike in digit 4 in the first digit graph is clearly visible in
the first two digits graph. Double click the 49 spike to display the records started with 49. You
can see (LEADING (AMOUNT, 2) = “49”) in the Filter box. Click Analyze | Total Fields to see
the total number of records started with digit 49. On the Total window, click DOC_NO and then
click OK. Transactions start with digit 49 is 110. Close the Total Window. Right click the title
bar of the AMOUNT column and click Quick Sort Ascending to index data in the ascending
order. 109 transactions except for 1 transaction ($497.94) are just below the additional approval
level of $5,000. Shown in Figure 17, type AND ((AMOUNT >= 4900) AND (AMOUNT < 5000))
in the Filter box and click Set Filter icon to extract the transactions between $4,900 and $5,000.
Figure 17 Type this additional function to extract the records between $4,900 and $5,000.
Double click this bar to see the records started with 49.
20
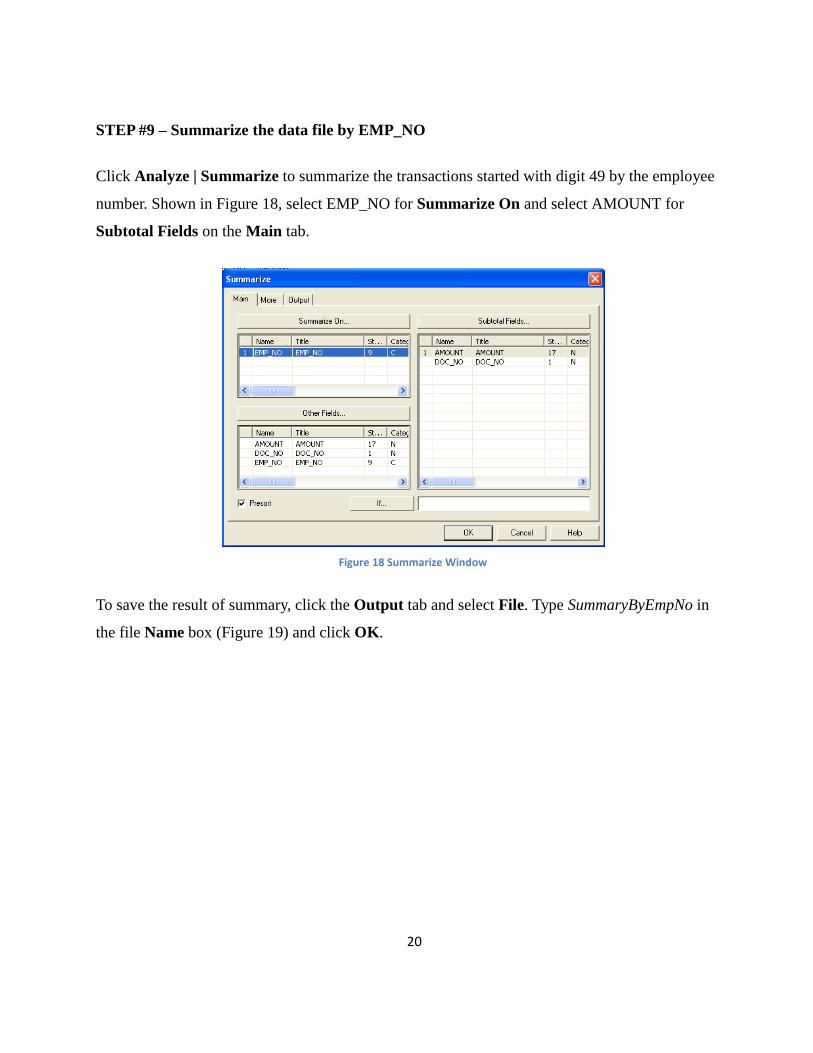
STEP #9 – Summarize the data file by EMP_NO
Click Analyze | Summarize to summarize the transactions started with digit 49 by the employee
number. Shown in Figure 18, select EMP_NO for Summarize On and select AMOUNT for
Subtotal Fields on the Main tab.
Figure 18 Summarize Window
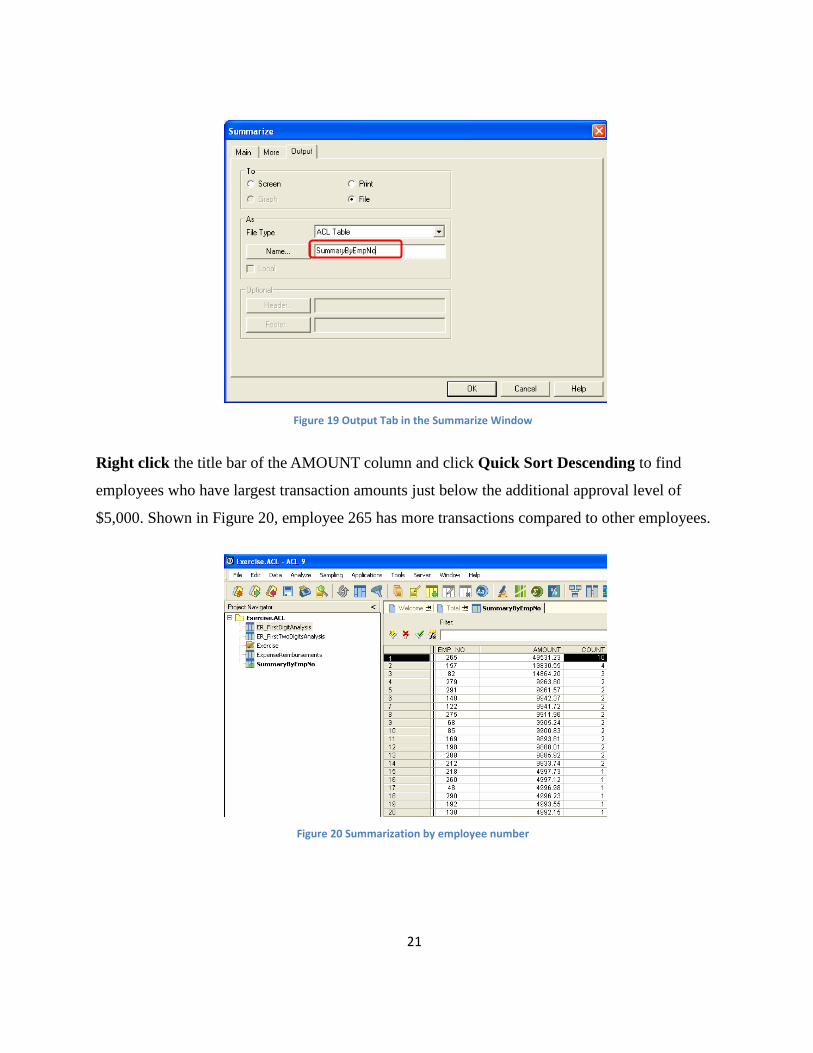
To save the result of summary, click the Output tab and select File. Type SummaryByEmpNo in
the file Name box (Figure 19) and click OK.
21
Figure 19 Output Tab in the Summarize Window
Right click the title bar of the AMOUNT column and click Quick Sort Descending to find
employees who have largest transaction amounts just below the additional approval level of
$5,000. Shown in Figure 20, employee 265 has more transactions compared to other employees.
Figure 20 Summarization by employee number

22
The first three digits analysis is a highly focused test to obtain a smaller sample, but the number
of records produced from the first two digits analysis is already small. In this exercise, you do
not need to perform the first three digits analysis.
Questions
In the first two digits analysis, 24 is another positive spike.
1. How many transactions are started with 24?
2. How many transactions are between 2,400 and 2,500?
3. When you summarize the transactions between 2,400 and 2,500 by EMP_NO, are there any
suspicious employees?

23
Appendix 2: Assignment about the Wake County Fraud Case
Time estimation: Approximately 15 minutes
Objectives: Wake County School employees in the school transportation department and Barnes
Motors & Parts Co. submitted fraudulent invoices for school bus and automotive parts. Much of
the money was used by the employees to buy personal items such as automobiles, campers, golf
carts and plasma-screen televisions. The county policy requires that each transaction was limited
to $2,500. The fiscal year end of this county is June 10, 2006. Assume that you are auditing the
invoices between January 11, 2006 and September 3, 2007 for Wake County School. Use
Benford’s Law in ACL to identify suspicious vendors having exceptional transactions.
WakeCounty.xls contains 2,000 transaction records with vendor identifier, invoice number,
invoice date, and amount.
1. Create the Assignment folder and download WakeCounty.xls into this folder from this website:
http://ouray.ucdenver.edu/~h1kim/BenfordsLaw/Tutorial/WakeCounty.xls
2. Create a project named Assignment. Import the WakeCounty.xls file into the project and name
the table as WakeCounty.
3. Perform the first digit analysis and save the file as FirstDigitAnalysis. Sort the result of first
digit analysis by the ZSTAT RATIO column in descending order.
4. Graph the output of the first digit analysis and double click the highest positive spike.
5. Perform the first two digits analysis and save the file as FirstTwoDigitsAnalysis. Sort the
result of first two digits analysis by the ZSTAT RATIO column in descending order.
6. Graph the output of the first two digits analysis and double click the highest positive spike.
7. Summarize the result of Step 6 by VENDOR and list any suspicious vendors processed the
unusual levels of transactions.
Questions
In the first two digits analysis, 16 and 17 were highest positive spikes.

24
1. How many transactions were started with 16?
2. How many transactions are between 1,600 and 1,700?
3. When you summarize the transactions between 1,600 and 1,700 by EMP_NO, are there any
suspicious vendors?
4. How many transactions were started with 17?
5. How many transactions are between 1,700 and 1,800?
6. When you summarize the transactions between 1,700 and 1,800 by EMP_NO, are there any
suspicious vendors? A11