instrumentation for ballistocardiography
TRANSCRIPT

! ELEC-E8003 Project work course, year 2016
Instrumentation for Ballistocardiography
PROJECT TEAM 31
ARSLAN, AHMAD
EL-MADHOUN, SAMI
JOHANSSON, MARKUS
PIHLAJA, JULIUS
SUMAN, RISHI
PROJECT MANAGER: TIKKA, JUHO
INSTRUCTOR: SEPPONEN, RAIMO
1

Table of contents
1. Introduction 1 ...........................................................................................
2. Ballistocardiography 2 .................................................................................
3. Instrumentation 3 .......................................................................................
3.1. First prototype 3 ...................................................................................
3.2. Final solution 3 .....................................................................................
3.2.1. Force sensors 3 ...............................................................................
3.2.2. Frame and mattress 4 ........................................................................
3.2.3. Electronics 6
3.2.4. Software 9
4. Results 10 ................................................................................................
5. Business Aspects 12 .....................................................................................
6. Discussion 13 ............................................................................................
6.1.1. Future work 13
6.1.2. Learning aspects of the course 13 .........................................................
7. References 15 ...........................................................................................
8. Appendix A, Load cell datasheet 16.................................................................
2

1. Introduction
Ballistocardiography (BCG) is a method for measurement of the reaction forces due to the function of the heart. There are several different types of BCG: force, velocity and displacement ballistocardiography.
BCG signal includes information about the volume and speed of blood pumped during each cardiac cycle. This information can be used to evaluate the condition of the heart. The method may be useful to evaluate the effects of physical exercise, medication and removing of atrial fibrillation. It is potentially usable for monitoring of the progress of heart failure. If combined with other diagnostic methods, it may improve the diagnostic accuracy.
Other measurements that include information about the pumped volume include Echocardiography and arterial catheterization. Compared to arterial catheterization, BCG has the advantage of being non-invasive. Compared to most methods, BCG is easy-to-use.
BCG has been studied in the past and due to inaccurate and ill-suited instruments, it acquired a bad reputation [2]. Lately interest towards BCG has grown and different instrumentations have been studied including embedding sensors in a wheelchair [3].
The goal of the project is to design and construct a new demonstrative instrumentation for ballistocardiography. The system should also include registration of electrocardiogram (ECG) and peripheral pulse.
During the first months of the project, development was focused on finding a practical and affordable option for displacement ballistocardiography. The original idea did not produce satisfying results and design was switched to force ballistocardiography. Previous studies have indicated that the measurable force is in the range of 0,1 to 1,5 N with the subject sitting on a chair equipped with BCG sensors. [4] Forces were measured in XY-plane.
The project team consisted of six Aalto University students from three different majors: Juho Tikka, Translational engineering, project manager, Julius Pihlaja, Translational engineering, Ahmad Arslan, Electrical drives, Rishi Suman, Electrical drives, Markus Johansson, Control, Robotics and Autonomous Systems, Sami el Madhoun, Control, Robotics and Autonomous Systems.
1

2. Ballistocardiography
Ballistocardiography (BCG) is an indirect method for measuring the amount of blood passing through the heart in a specified time by recording the recoil forces and movements of the body that result from contraction of the heart muscle and ejection of blood. The results can be presented in a graph similar to the figure 1 below, which presents the theoretical typical signal resulting from BCG measurements. The different valleys and peaks, marked with letters, represent different phases of the cardiac cycle and of the movement of the blood in the cardiovascular system. The most prevalent feature is the section from I to K that represents the recoil after the contraction of the heart and the blood hitting the aorta and the great vessels.
!
Figure 1. Typical BCG signal.[1]
There are three different approaches to obtaining ballistocardiography measurements: displacement, velocity and acceleration. All these variables are results of the same cardiac forces. Acceleration is in a direct relation to the cardiac forces while the velocity and displacement are relational to the integrals of the forces.
The signal recovered from BCG measurements carries information on the cardiac force output, stroke volume and cardiac contractibility of the subject being measured. Thus, it provides qualitative data on the health and performance of the heart of an individual, but is not directly comparable to the signals of other individuals. However, this qualitative information can be used to observe the effects of physical training, medication or other factors such as stress. In can also indicate the presence of cardiac abnormalities and dysfunction.
2

3. Instrumentation
3.1. First prototype
The first direction in implementing the instrumentation was displacement ballistocardiography (DBCG), which means measuring the actual distance of movement caused by the cardiac forces. The basic schematic of the first prototype solution for the platform used in the displacement measurements is presented in the figure 2 below. The objective was to produce a bed that promotes the movement of the subject lying on top of it. The prototype construction consists of two light-weight but rigid wall-insulation panels with variable amount of bubble wrap placed between them. The upper insulation panel also functions as the mattress that the subject lies on, but placing a soft memory foam mattress as the upmost layer was also experimented with. The function of said memory foam mattress was to enhance coupling between the subject and the mattress, but it did not improve the results as the coupling was not the source of problems.
!
Figure 2. First prototype of the bed structure used for displacement ballistocardiography (DBCG).
The prototype was tested along with testing different possible displacement measurement techniques, such as a microphone and an optical computer mouse, and also many others were considered. However, no usable measurement results were obtained in the experiments. The conclusion inferred from the experiments was that the occurring displacement was too small to reliably and accurately measure. The bed structure attenuated the movement too much, possibly due to the interlocking of the air bubbles in the bubble wrap, and thus did not function properly in this application. The approach of measuring displacement was found to be too difficult to implement in practice. Additionally, the natural frequency of the prototype construct was measured with an accelerometer as approximately 11 Hz. This natural frequency is exactly in the range of the BCG signal and therefore creates interferences that cannot be filtered. Later a new approach for the measurements was taken with a new design of the bed installation and using force sensors.
3.2. Final solution
3.2.1. Force sensors
3

The top view and side view of the sensor is shown in Fig. 3.3. The mechanism of the sensor is based upon resistors connected in a bridge. Any change of weight changes the resistance across the bridge and this change in resistance is amplified and fed to the DAQ for further signal processing.
! Figure 3. Top and side view of the sensor.
The datasheet of the sensor is attached as per Appendix A at the end of the report.
3.2.2. Frame and mattress
The purpose of the frame in this application was to not just to serve as a robust platform but also to provide good capabilities to attach the sensors and hang the mattress. In addition, it had to provide means to fasten the mattress in its place, when a patient lays down on the bed, for example, to protect the sensitive sensors. As for the mattress, it had to be relatively inexpensive and light while also being robust enough to carry a normal weight person. Obviously, overall dimensions of the bed were determined by normal person’s height and width.
Early on, we decided the frame, from which the mattress will be hanging, to be designed on aluminium profiles mainly due to aluminium’s availability but also robustness and formability. After some research and comparison between aluminium profile providers, we ended up to order the aluminium profiles in SKS Group. The aluminium frame was designed using a CAD software called MayCAD, developed by MayTec. It provided us a simple platform on which we were able to construct a 3D model consisting of parts available in the SKS Group’s catalogue. For now, the fastening of the mattress would be done with screws in several locations in the frame.
4

!
Figure 4. A 3D model of the frame and its dimensions.
Dimensions of the bed were defined by the size of the mattress that would be hanging in between the frame: in the end, the total size of the bed was 2040 x 910 x 500 mm, as can be seen in figure 4 above. Total weight of the frame, without the frame for the mattress, is approximately 29 kg.
Other dimensions of the frame, such as the height of the supportive horizontal profiles or the profiles in the corner pillars from which the mattress is hanging, are not given since they can be modified. Therefore, this frame gives the engineers good possibilities to experiment different combinations that might alter the properties, such as the natural frequency, of the hanging mattress, and thus, the measurement results. In our measurements, the lower supportive horizontal profiles were at the height of 100mm from the ground while the length of the pendulum (distance from the fastening point, i.e. the tip of the hook) and the bottom of the mattress was approximately 200 mm in each of the four corners.
The mattress consisted of two components, the mattress itself and a frame for support and fastenings. Material for the mattress was a standard insulator panel (polyurethane) due to its lightness and good enough robustness. The frame for the mattress was constructed of 3 mm thick 5x5 mm aluminum L-profile, with steel plates in the corner to keep the L-profiles together. Holes were drilled through the mattress, L-profile and the steel plates in order to hang the mattress from the hook with the cord.
In addition to the mechanics described above, the attachment of the sensors to the frame needed some attention. The was achieved with a plastic adapter block seen in the figure below.
5
!
Figure 5. Adapter block for the sensor.
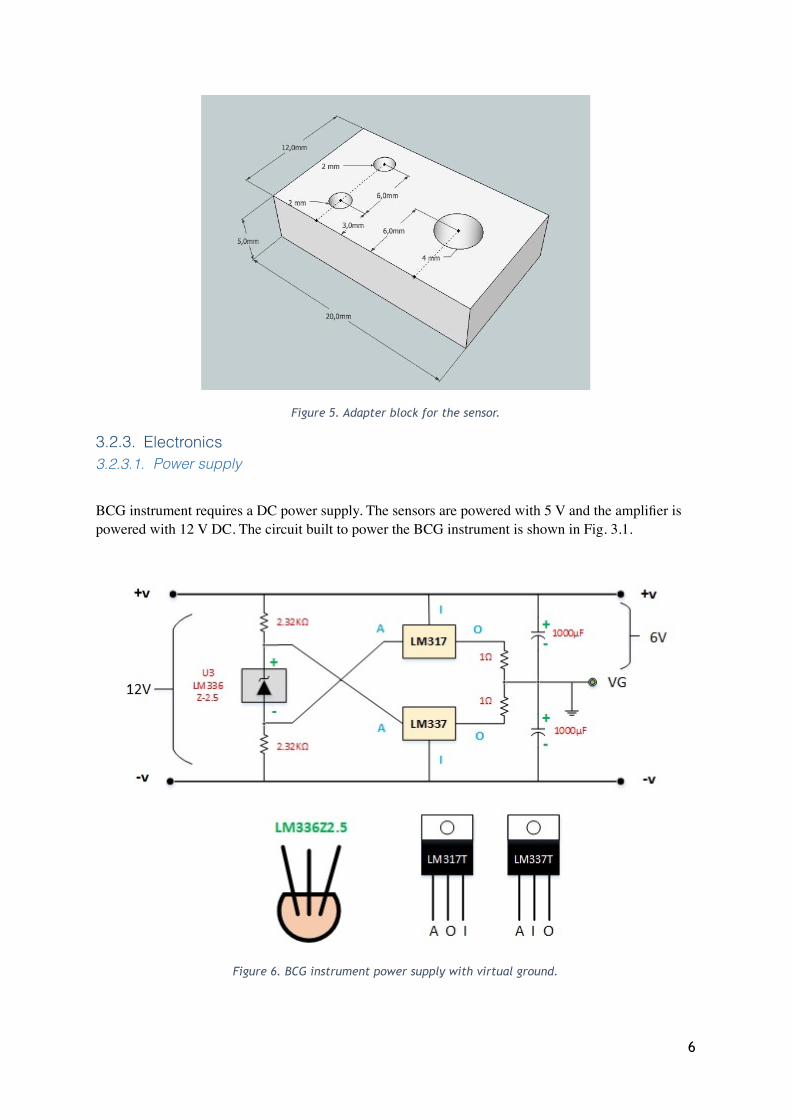
3.2.3. Electronics 3.2.3.1. Power supply
BCG instrument requires a DC power supply. The sensors are powered with 5 V and the amplifier is powered with 12 V DC. The circuit built to power the BCG instrument is shown in Fig. 3.1.
Figure 6. BCG instrument power supply with virtual ground.
6

The power supply uses a 12 V DC adapter supplyingV. The chip LM336 and LM317T was used to make virtual ground (VG) for the system so that the sensors can give both positive and negative values. VG enables to measure the movement of the bed in both direction and thus, captures all the vibrations in the body caused due to pumping of blood by heart. The potential between + & VG is +6 V and - & VG is -6 V. The capacitor connected across the output and VG of the power supply is for filtering the output voltage from high frequency noise. This supply board gives a stable, non-pulsating and regulated DC supply which is highly essential for smooth functioning of the instrument. A voltage regulator is used to supply 5V DC to the sensor with each amplifier circuit. The input to the voltage regulator is the output of power supply, as shown in figure 6.
Figure 7. Voltage Regulator.
3.2.3.2. Amplifier and low pass filter
There are in total of 6 sensors used in the BCG instrumentation. The output of the sensors is in range and the DAQ requires a signal around 5V for optimal functioning. Therefore, it was decided to make a two-stage amplification with a gain of 2000. The first stage is a differential amplifier which gives the difference of the voltage between the two terminals of the sensors (Blue and White). The first stage has a gain of 10. The output of the first stage was fed to another non-inverting amplifier of gain 200.
The impedance of the first stage was kept relatively high to make the sensors very sensitive so that they can capture the tiniest movement. The amplifier circuit is shown in Fig. 3.2. This circuit is also equipped with a two-stage low pass filter (LPF). LPF was divided into two-stage so that the output of each amplifier can be filter with a total attenuation of -40 dB to the high frequencies.
7

Figure 8. Amplifier circuit with low pass filter.
The calculation of the circuit components of the amplifier and the filter are given in the subchapters below.
3.2.3.2.1. Differential amplifier
So,
3.2.3.2.2. Low pass filter for differential amplifier
3.2.3.2.3. Non-inverting amplifier
Rated output of the sensor = 0,5 mV/V
DC Voltage supply Vdc = 5 V
Output of the sensor = 0,5 mV/V * 5 V = 2,5 mV
Amplification = 2,5 mV to 5 mV = 2000
8

So,
3.2.3.2.4. Low pass filter for differential amplifier
3.2.4. Software
Presentation of the measurements was done with a LabVIEW program, which was developed during the project. The program utilizes a ready-made LabVIEW library which was developed by the data acquisition tool’s (DAQ) manufacturer Measurement Computing. Once the user has defined the correct input channels and clicked ‘run’, the basic sequence of the program is as follows:
• read voltages from the defined DAQ inputs
• store the value in an array
• update the graph
• save the data in a text file (if ‘save’ button is activated)
• repeat these steps until the user stops the execution.
Each signal is plotted on individual graphs. The program is also capable of digital filtering and spectrum analysis of the signals. However, these features require some development and testing.
9

4. Results
Initially, we were slightly concerned about the natural frequency of the hanging mattress being similar to components in the BCG signal, and thus distorting the measurements. By simplifying the mattress to be a simple pendulum, the natural frequency of a freely hanging mattress could be estimated: depending on the length of the pendulum (ranging from 0.05 to 0.40 m), the mattress’s natural frequency ranges from 2.2 to 0.79 Hz, [5]. However, fastening the mattress for the measurements with the sensor screws turned out to increase the natural frequency considerably. As such, we were able to measure clear BCG signal with the instrumentation described in the previous chapter.
Figure 9. 6-channel BCG signal over time of 8.4 seconds. Channels #1 and #6 are from the sensors near head and feet, respectively, while the other signals are from the sensors on both sides of the bed. The offset
between the signals are generated by the sensors.
The figure above represents signals measured from the six sensors over 8.4 seconds while a member of our group was lying on the mattress. All sensors were installed perpendicular to the frame so that four sensors measure forces in x-direction and two sensors measure in y-direction. Especially, the signals from the y-direction sensors placed at the ends of the mattress (#1 and #6) are clearly periodic and they have several components characteristic for a BCG signal. For example, in the first complete oscillation we can clearly see three distinct peaks: the first (negative) peak is generated by blood ejection from the heart, the second (positive) by blood mass decelerating in aorta and the third (negative) by blood striking the peripheral circulation’s resistance. In addition, before the first great negative peak we can see a smaller positive peak, which is generated by the apex thrust of the
10

heartbeat. All of these peaks can also be seen in the theoretical BCG signal, presented earlier in figure 1. Maximum recorded force was approximately 0,15 N.
11

5. Business Aspects
Successfully commercialized BCG instrument has extensive market potential. Possible customer segments include Hospitals, health centres, sports clubs, fitness centres, gymnasiums and household users. The possibility of measuring heart’s condition without medical or healthcare training is very attractive to professional and serious amateur athletes. Fast and simple measurements at home or in hospital could be used to monitor effectiveness of heart medication on patients. This would help athletes assess the efficiency of their training and healthcare organizations to reduce costs and time spent on a patient.
BCG has not yet penetrated the potential market, but there are a couple of examples of products utilizing BCG, notably, Beddit sleep tracker. BCG-products measuring the condition of heart for athletic or medical use have not entered markets. Designing and manufacturing a product for medical use requires meeting strict conformity standards. Requirements for consumer products are less strict but usability, user interface and encompassing services must be well designed.
12

6. Discussion
After testing the original design, decision was made to change the method of measurement from displacement to force measurement. Displacement ballistocardiography can be performed with either more complex or considerably larger instrumentation [2]. The force measurement setup proved to be reasonably sensitive and to have a good signal to noise ratio (SNR).
There is a growing need for cardiac research and BCG shows promise in being an affordable, easy to use solution for monitoring changes in heart condition for both medical and fitness purposes.
6.1.1. Future work
Main inconsistencies rose from the connection between the sensor and the hanging bed. Used screws had M-type coarse threading and they were long compared to their diameter. The threading makes very accurate adjustments difficult and the length causes bending of the screw. The bending can result in contact point moving as a result of sudden, slightly larger movement. This in turn causes the offset level to move in either direction, possibly so high that parts of the signal are lost. The movement of the contact point can be helped with lubrication, but this doesn't solve the problem completely. Our proposed solution is to mount the sensors on a moving part that is moved with a fine pitch screw drive. The contact to the bed should be made with a short screw with carefully machined round tip.
To improve the practicality of the instrument, both the securing screws and the moving sensors should be automated. This would make the measurement setup considerably faster. Sensors on the sides could be attached to a single moving holder on each side.
The bed is another focus point for development. The current bed was manufactured with high tolerances, considerably higher than the frame. If the bed was reconstructed, it could be suspended more precisely in the middle of the frame and with certainty that the suspension strings do not pull the bed in any direction in equilibrium. The suspension method should be re-examined. At the moment the string is a light-weight, high tensile strength, low-stretch rope. It works nicely but problems arise from uneven stretching. The strings in the head side of the bed stretch more due to the centre of gravity of an average person being closer to the head than the feet and this in turn places higher strain on the head side suspension. The result is that the subject on a non-level plane and this could cause distortion in the signal due to the effect of gravity on blood. Possible solution could be to shorten the head side strings so that when stretched they would be same length as the foot side strings. Another possibility would be to change the suspension method so that adjustments can be made after the subject has lain on the bed. This could be automated on either side of the bed.
6.1.2. Learning aspects of the course
In the beginning of the course the team agreed to try agile management. This was clearly a mistake due to the following reasons:
-Every team member had other responsibilities during the course
13

-Timetables of the team members didn't match
-Materials were not available from the start of the course
Agile calls for frequent meetings and concentration on the current task and the project as a whole. University courses fit this description badly. Important aspect of Agile is iterative product development. This is best suited for programming but it can be applied to physical product design also. However, in case of this project, adaptation should have been considered in depth, especially since the project started as theory heavy.
Original timetable held fairly well for the spring part but realization of the risks led to massive changes in the autumn period. This in turn added the workload in the end of the course. Some parts of the project plan were changed and changes were discussed with and accepted by the instructor.
From scientific point of view, the failure of the initial idea was not a failure, but a result. However, from the project point of view this was a realization of a risk that led to aforementioned results.
Communication of the course worked fairly well during the spring period, but different communication methods and distribution of tasks was made needlessly complicated. This issue was addressed at the beginning of fall period and communication was simplified.
14

7. References
1. H. Brown, M. Hoffman and V. De Lalla. Ballistocardiographic findings in patients with symptoms of angina pectoris. Circulation., 1:132–140, 1950.
2. Weissler, Arnold M., Noninvasive cardiology
3. Postolache, Octavian A., et. Al., Physiological Parameters Measurement Based on Wheelchair Embedded Sensors and Advanced Signal Processing
4. Trefny Z. M., et. Al., Quantitative Ballistocardiography (Q-BCG) for Measurement of Cardiovascular Dynamics
5. HyperPhysics, "Simple Pendulum," [Online]. Available: http://hyperphysics.phy-astr.gsu.edu/hbase/pend.html.
15

8. Appendix A, Load cell datasheet
16

17