instrumenting, analyzing, & tuning the performance of ... · instrumenting, analyzing, &...
TRANSCRIPT
Instrumenting, Analyzing, & Tuning
the Performance of Oracle ADF
Applications Frank Houweling
UKOUG 2014

Frank Houweling
• Frank Houweling
• Senior Java / ADF specialist
• Focus on performance diagnosis and performance management
• Lead developer of the ADF Performance Monitor
• AMIS (Netherlands)
• Oracle Partner

3
Agenda
• What is instrumentation
• Why instrumentation is important
• Cost of tracking
• Analyzing and tuning
• Oracle ODL Analyzer
• Build your own performance monitor
– What you can instrument • Not ADF specific
• ADF specific
– Five examples how you can instrumentation key spots in ADF applications • HTTP Request
• Errors / Exceptions
• ADF Business Components
• JVM memory consumption
• ApplicationModule pooling (activation and passivation)

4
Instrumentation
• Instrumentation; we can not live without it

5
Instrumentation of Code
• Instrumentation refers to an ability to monitor or measure the level of a product's performance, to diagnose errors and to write trace information
• Instrumenting gives visibility and insight of what is happening inside the application
– What methods and queries are executed, when and how often
• Programmers implement instrumentation in the form of code instructions that monitor specific components in a system

6
Why instrumentation is important (1)
• Many applications are like a smoke screen
• It is very unclear what is happening in the background
• Where should we look for bottlenecks ?

7
Why instrumentation is important (2)
• End-users do not accept slow applications anymore
• Is your application running as it should?
• Response Times within SLA agreements?
• Are there errors? What type/severity of errors?

8
Cost of Tracking
• Tracking everything is impossible – it is like a fire hose; there is far too much data and there will be a significant performance overhead
• We should find the balance; to track important/relevant events but also not tracking too much
• Tracking should be able to be turned on and off at runtime

9
Analyzing and Tuning
• What is the SLA?
• If users are complaining and if they are right, you have to know where time is spent
• Instrumentation should give clear performance information (metrics) when methods/operations begin and when they end, and calculate how long it took to execute
– What methods and queries are executed, when and how often
• When we have insight into performance problems specific problems may be addressed
10
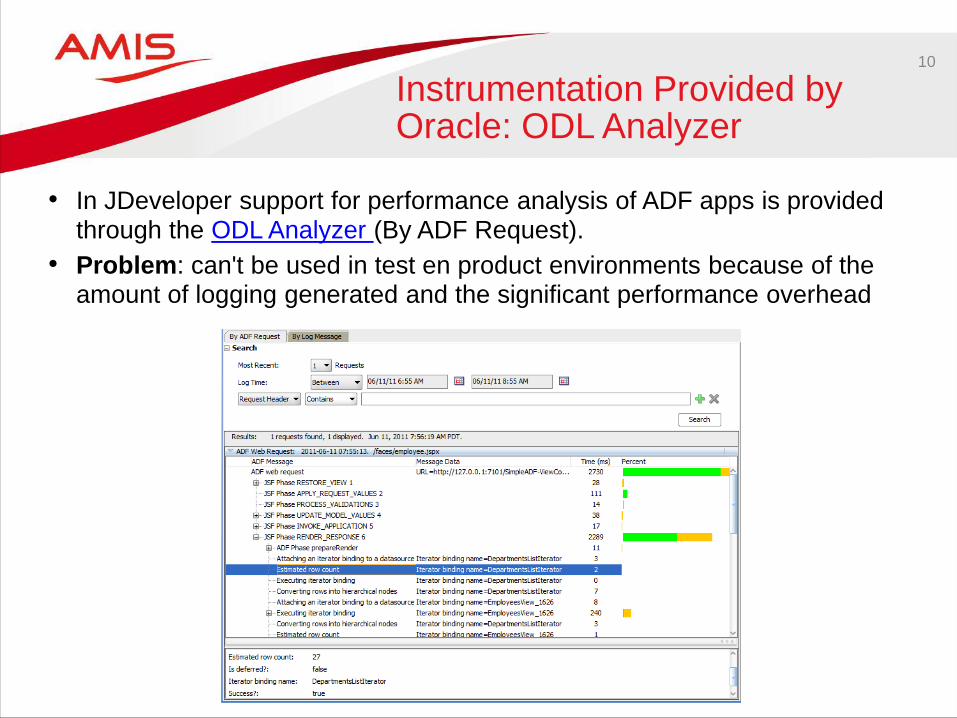
Instrumentation Provided by Oracle: ODL Analyzer
• In JDeveloper support for performance analysis of ADF apps is provided through the ODL Analyzer (By ADF Request).
• Problem: can't be used in test en product environments because of the amount of logging generated and the significant performance overhead

11
Built Your Own Monitor; Instrument your ADF code
• You can instrument your own ADF code and create your own performance monitor tracking tool
• Create several ‘stopwatch’ metrics classes that can be plugged in into the ADF framework
– ADF BC framework extension classes
– Fusion lifecycle phaseListener
– ServletFilter
– HTTP eventListener
– Error eventListener
• Create a “metrics” library that contains your metrics code

12
Save Metrics in Database
• Add this library to your ADF app
• The metrics library saves the metrics to the database
– That uses its own JDBC Datasource
• You can create a Dashboard Reporting App based on the metrics

13
Instrument Multiple Layers
Metrics
Database

14
Instrumentation in Enterprise Manager
• SQL Execution Details shows metrics that give visibility and insight
– After analysis SQL experts can take action to solve slow SQL executions

15
ADF Call Stack
• Like the database EM we can also create call stacks in ADF
– Gives visibility into which ADF method caused other methods to execute
– Organized by the sequence of their execution
– Elapsed times and a view of what happened when.

16
What you could Instrument (1) (Not ADF specific)
• HTTP Request
– Response Time
– User ID,
– User Organization
– Button/Link clicked on (ADF component ID)
– View ID
– Session ID
– Date and Time
– Browser
– Client IP
– WLS Managed Server Name
– Server URI
– ECID
• Errors / Exceptions
– Error Code, Error Message, Error Class
– Stack Trace
• JVM
– Heap Space
– Garbage Collection Time
• ………………..

17
What you could Instrument (2) (ADF specific)
• ViewObject SQL queries – BindVariable values
– Rows fetched (loaded) from database into ADF app
– Applied ViewCriteria
– SQL query statement
– ViewAccessors
• EntityObject – DML methods
– Locks
• ApplicationModule – AM Pooling; passivations and activations
– Database transactions
– Creation Time
– Connection time to database
• Fusion Lifecycle phases – Start & end of phases
• Taskflow paramaters – Initializers and start parameters
– finalyzers
• BindingContainer (PageDef) – Iterator executions
– Operations and Custom Methods
• …………………………….

18
Case 1 HTTP Request Instrumentation
• Use a ServletFilter to instrument HTTP Request response time
– Instrument doFilter()
– Alternatively HttpServletRequestListener
• User ID
– ADFContext adfCtx = ADFContext.getCurrent();
SecurityContext secCntx = adfCtx.getSecurityContext();
String userId = secCntx.getUserName();
• Managed Server
– System.getProperties().getProperty("weblogic.Name");
• Session ID
– httpServletRequest.getSession().getId()
• Server URI
– httpServletRequest.getRequestURI();

19
Monitor Service Level Agreement (SLA)
• Real-time performance information
• Are response times within or outside SLA boundaries?
• Is immediate action required?

20
Monitor SLA - HTTP Request Response Time
• Example: from 15:00 to 16:00 the response times have increased significantly (more red and yellow colored parts in the 15u bar)
– This should be a trigger to investigate the root cause

21
Monitor a specific End-users
• Problems of specific end-users can be analyzed

22
Case 2 Instrumenting Errors / Exceptions
• Configure a custom MetricsDCErrorHandler that extends from DCErrorHandlerImpl:
– http://technology.amis.nl/2014/04/27/adf-performance-monitor-troubleshooting-test-
and-production-errors/
23
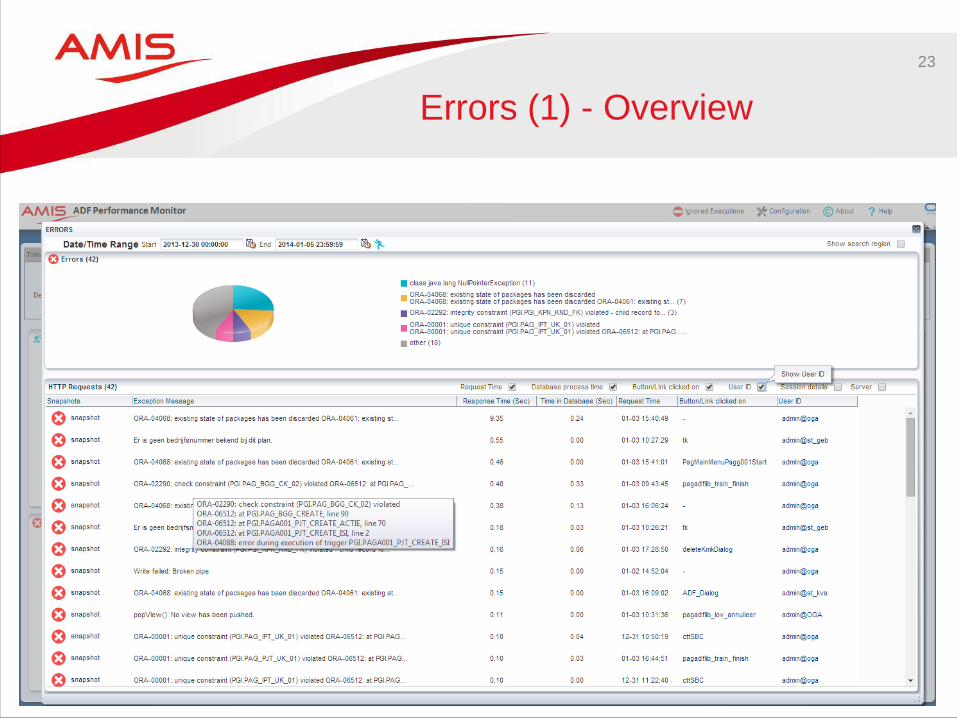
Errors (1) - Overview

24
Errors (2) - Stacktrace

25
Errors (3) - ADF Callstack
27
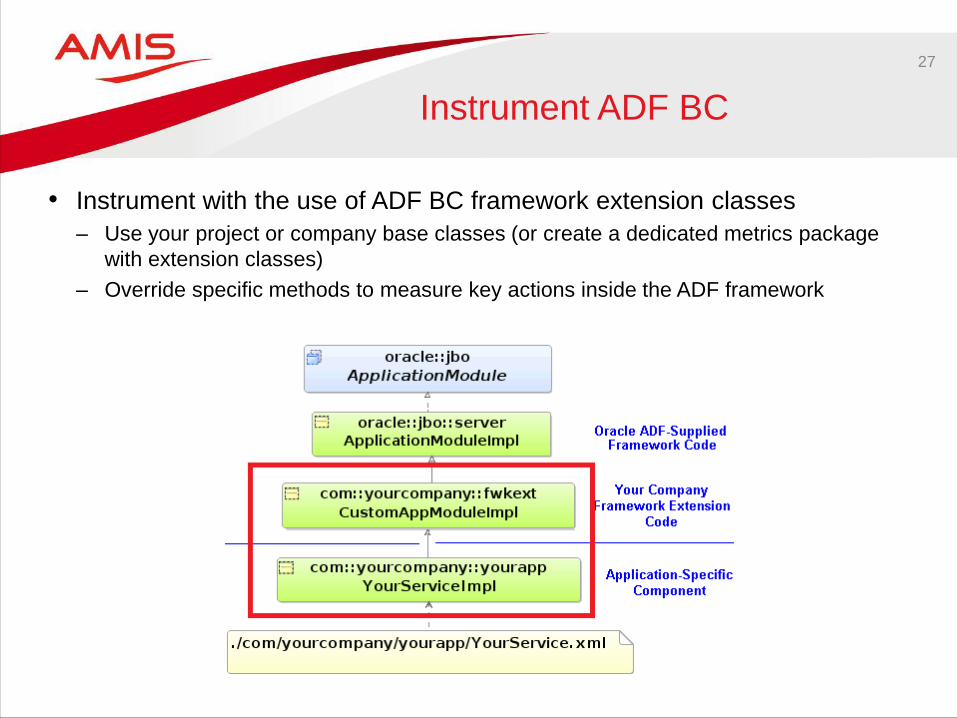
Instrument ADF BC
• Instrument with the use of ADF BC framework extension classes
– Use your project or company base classes (or create a dedicated metrics package
with extension classes)
– Override specific methods to measure key actions inside the ADF framework

28
Creating a Metrics ApplicationModule
• Create a dedicated “metrics ApplicationModuleImpl” that extends from oracle.jbo.server.ApplicationModulempl
• Your project base class extends from this MetricsApplicationModulempl:

29
Creating a Metrics EntityObject
• Create a dedicated “metrics EntityObject” that extends from oracle.jbo.server.ViewObjectImpl
• Your project base class extends from this MetricsViewObject:

30
Creating a Metrics ViewObject
• Create a dedicated “metrics ViewObject” that extends from oracle.jbo.server.ViewObjectImpl
• Your project base class extends from this MetricsViewObject:

31
Look for Key Methods to instrument
• You can look at the ViewObjectImpl API doc for important and interesting methods to instrument & monitor
32
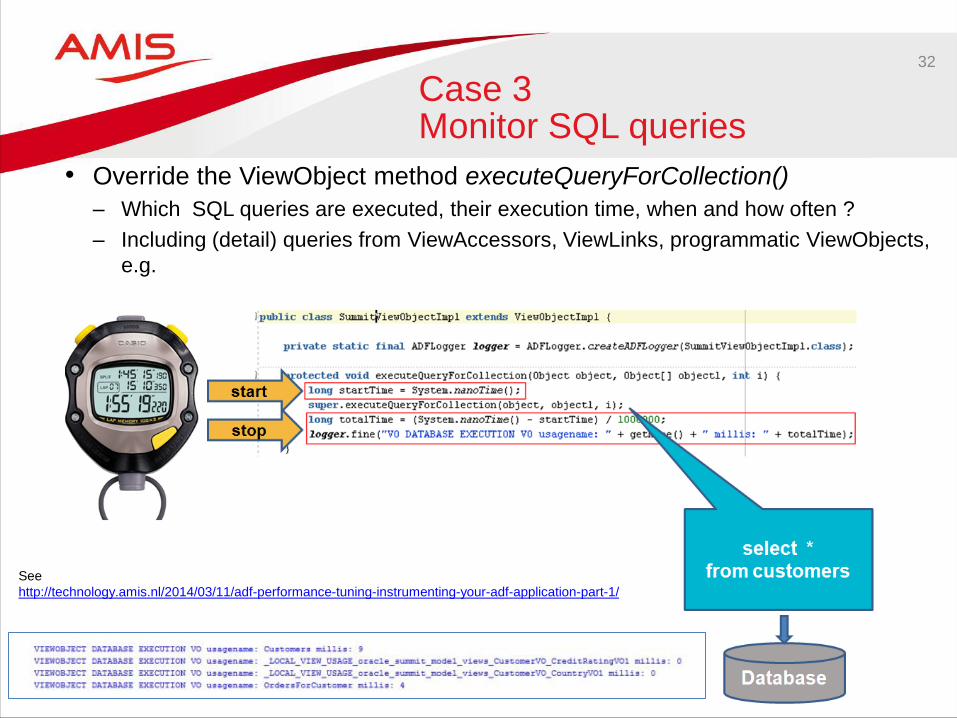
Case 3 Monitor SQL queries
• Override the ViewObject method executeQueryForCollection()
– Which SQL queries are executed, their execution time, when and how often ?
– Including (detail) queries from ViewAccessors, ViewLinks, programmatic ViewObjects,
e.g.
See
http://technology.amis.nl/2014/03/11/adf-performance-tuning-instrumenting-your-adf-application-part-1/
33
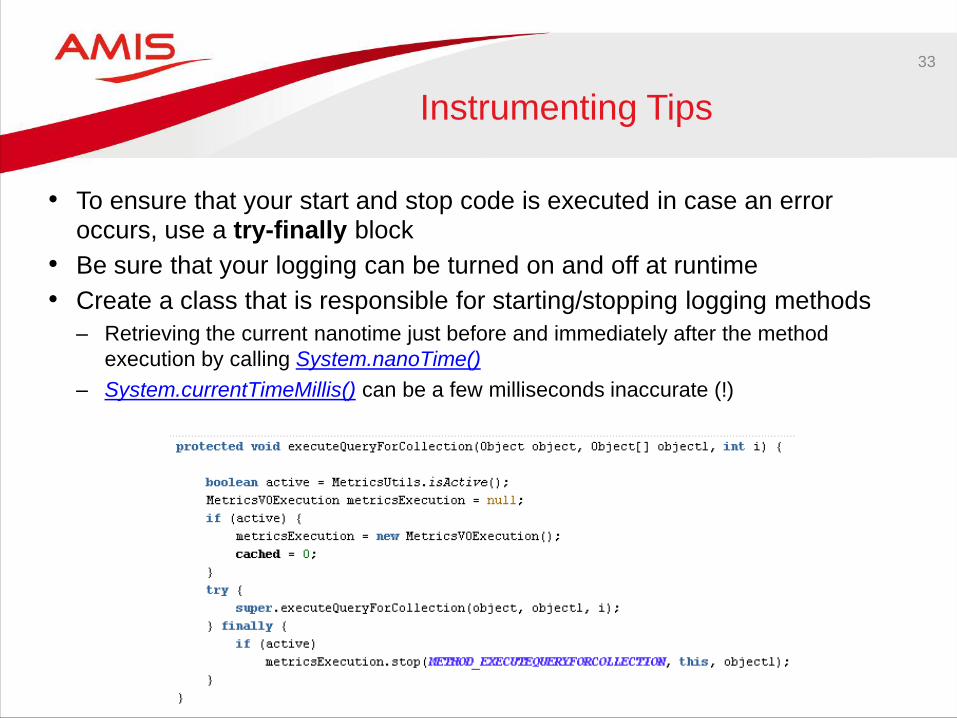
Instrumenting Tips
• To ensure that your start and stop code is executed in case an error occurs, use a try-finally block
• Be sure that your logging can be turned on and off at runtime
• Create a class that is responsible for starting/stopping logging methods
– Retrieving the current nanotime just before and immediately after the method
execution by calling System.nanoTime()
– System.currentTimeMillis() can be a few milliseconds inaccurate (!)

34
Additional ViewObject Runtime Metrics (1)
• Possible additional ViewObject runtime metrics
– Bind variable names / values
– Fetched rows loaded into ADF app
– Applied ViewCriterias
– SQL statement

35
ADF Callstack Slow ViewObject Query
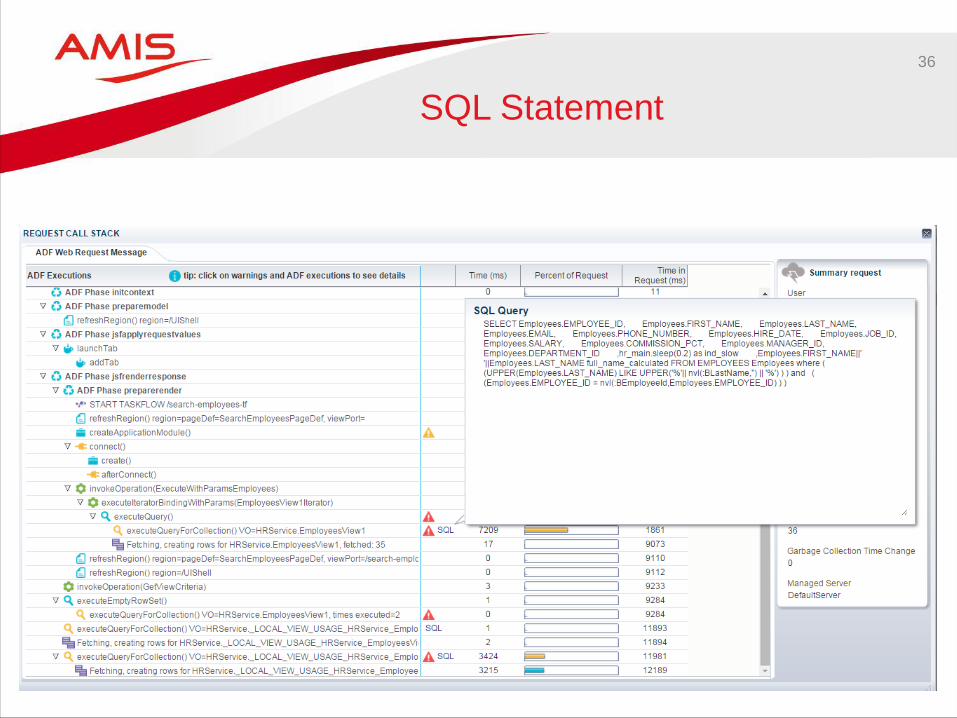
36
SQL Statement

37 ViewObject Query Performance Aggregated
• AVG, Occurrences, Total execution time, Min, Max

40 Case 4: Instrumenting how many rows are fetched/loaded
• Detecting an overload of ViewObject rows
– Prevent JVM memory overconsumption (!)
– http://technology.amis.nl/2014/02/03/adf-performance-monitor-detecting-and-
analyzing-a-high-adf-bc-memory-consumption/

41
Instrumenting how many rows are fetched/loaded
• Overriding the method createRowFromResultSet() and counting them in your MetricsViewObjectImpl.
– Reset the counter before a query is executed (again):

42
Instrumenting how many rows are fetched/loaded
• A high load can now be detected in JDevelopers console log
– You might want to not log every single row that is fetched like here but only above a
certain threshold (for example for every hundred)

43
Loaded Rows in Memory (1) JVM memory overconsumption
– Example: ADF application with JVM memory overconsumption
We see many JVM warnings of long garbage collections; this should be a trigger to
investigate

44
Loaded Rows in Memory (2) ADF BC Memory Analyzer
– In this production ADF app, for a single ViewObject instance,
more than 900.000 rows were loaded in the ADF app (Blue) !

– In this production ADF app, for a single ViewObject instance,
more than 900.000 rows were loaded in the ADF app (!)
– Loading 900.000 rows takes more than 10 minutes
45
Loaded Rows in Memory (3) ADF CallStack

46 Case 5: Instrumenting AM activation and passivation
• ApplicationModule pooling enables multiple users to share several application module instances. It involves saving and retrieving session state data from the database, file, or Java memory.
• This mechanism is provided to make the application scalable and becomes very important under high load with many concurrent users.

47
Instrument ApplicationModule passivation
– Override the ApplicationModule method passivateState() in your metrics base class:
– See http://technology.amis.nl/2014/04/01/adf-runtime-diagnostics-instrumenting-your-
adf-application-part-2/

48
Instrument ApplicationModule activation
• Override the ApplicationModule method activateState() in your metrics base class:

49
Test Instrumentation Activation and Passivation
• In this way you can monitor which ApplicationModules are activated/passivated, their activation/passivation time, when and how often it is executed.
• Run your ADF application with Djbo.ampool.doampooling=false to test this

50
Test ApplicationModule Activation and Passivation
• Logging JDevelopers console log:

52
Example: Slow Activation of ApplicationModule

53
Example: Slow Passivation of ApplicationModule

54 Example: Worst ApplicationModule activations & passivations overview
• Monitor aggregates of ApplicationModule activations and passivations
– AVG, Occurrences, Total Exec Time, Min, Max
– Zoom in into single executions

55 Example: Worst ApplicationModule activations & passivations overview (2)
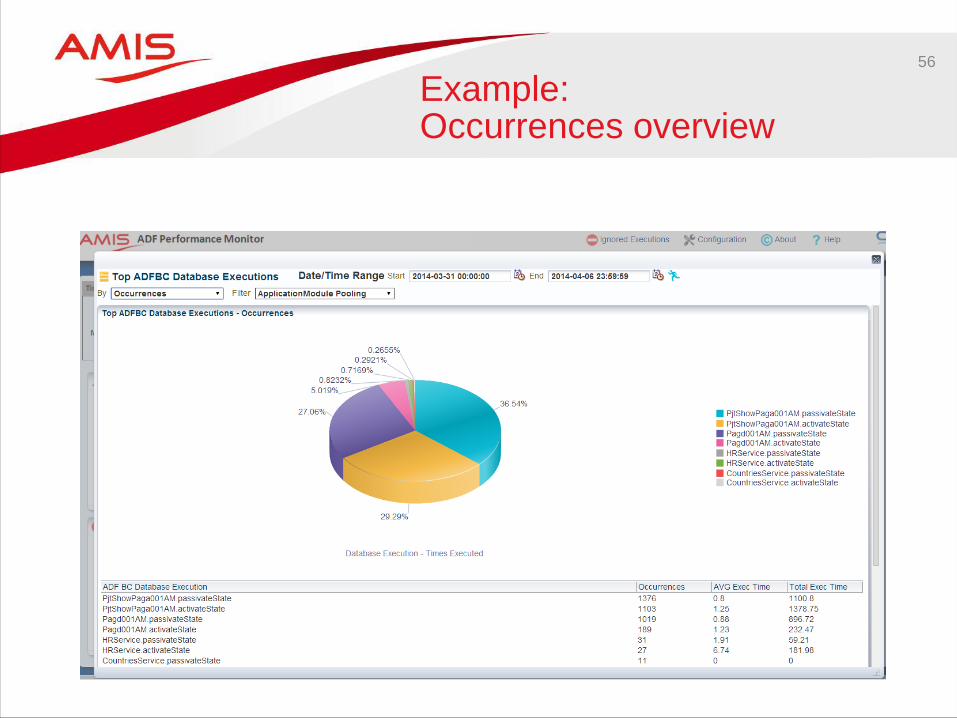
56
Example: Occurrences overview
57
Learn More
• Instrumenting your ADF Application – part 1
• Instrumenting your ADF Application – part 2
• Tips on How to Limit ADF BC Memory Consumption
• ADF Performance Monitor
– Whitepaper
– Information

58