insulated container testing & rating system development · ii university of southern queensland...
TRANSCRIPT

ii
University of Southern Queensland
Faculty of Health, Engineering & Sciences
Insulated Container Testing & Rating system
Development
A Dissertation submitted by
Mr. Thierry-Jacques Patrick Vever
Mechanical Engineering
In fulfilment of the requirements for the degree of
Bachelor of Engineering
October 2015

iii
© Copyright by Thierry-Jacques Patrick Vever 2015
All Rights Reserved

iv
Abstract
This research project seeks to develop a cheap, accurate, objective, repeatable and universal
testing & rating system for insulated containers (eskies, chilly bins, coolers, ice boxes, cooler
bags, pizza pouches, etc), similar to the star ratings for white goods, plumbing fixtures and
motor vehicles, whether used for cold or hot items. Currently, there is no such system
available on the domestic market, and none has been observed in any other market.
The testing consists of placing an empty vessel in a chamber at 5°C, and waiting until its
temperature is in equilibrium with that chamber, then transferring it to a chamber at 55°C,
and again waiting until equilibrium is reached, and the time taken to reach equilibrium is
observed. This process is then reversed as a double check to compare heat ingress and heat
egress.
The rating consists of taking the temperature differential and the time taken to reach steady-
state and applying them to the volume of the vessel and the internal heat of air in the volume
to determine a numerical result in W/K. The resultant number is the rating. This is far simpler
than converting this into a number of stars (as is common with other ratings systems), and
very quickly, consumers will begin to know the general range of numbers and be able to
compare them to know what is sufficient for each of their needs.
Successful tests have been carried out to demonstrate that this is a viable testing & rating
system which stands to benefit the general community whenever a consumer chooses to
purchase an insulated container. By displaying the results of such a testing & rating system,
manufacturers can instil confidence for their customers that their purchase will meet their
needs with respect to the thermal performance of the chosen product.
This research project is ready to progress to a level of formulating a standard and a set of
protocols with a view to starting commercial testing in established laboratories for existing
manufacturers.

v
Disclaimer
University of Southern Queensland
Faculty of Health, Engineering and Sciences
ENG4111/ENG4112 Research Project
Limitations of Use
The Council of the University of Southern Queensland, its Faculty of Health, Engineering &
Sciences, and the staff of the University of Southern Queensland, do not accept any
responsibility for the truth, accuracy or completeness of material contained within or
associated with this dissertation.
Persons using all or any part of this material do so at their own risk, and not at the risk of the
Council of the University of Southern Queensland, its Faculty of Health, Engineering &
Sciences or the staff of the University of Southern Queensland.
This dissertation reports an educational exercise and has no purpose or validity beyond this
exercise. The sole purpose of the course pair entitled “Research Project” is to contribute to
the overall education within the student’s chosen degree program. This document, the
associated hardware, software, drawings, and other material set out in the associated
appendices should not be used for any other purpose: if they are so used, it is entirely at the
risk of the user.

vi
Certification
University of Southern Queensland
Faculty of Health, Engineering and Sciences
ENG4111/ENG4112 Research Project
Certification of Dissertation
I certify that the ideas, designs and experimental work, results, analyses and conclusions set
out in this dissertation are entirely my own effort, except where otherwise indicated and
acknowledged.
I further certify that the work is original and has not been previously submitted for
assessment in any other course or institution, except where specifically stated.
TJ Vever
0050078313

vii
Acknowledgements
My first thanks must go to my wife and children, who have been so patient and understanding
over the last 8 years as I completed my degree in mechanical engineering. My second thanks
must go to my supervisor, Ruth Mossad, without whom I would have given up at least 2
years ago. Ruth’s ability to extend herself for me during some of the final courses of my
degree has made it all bearable. I specifically chose Ruth to be my supervisor knowing that
she would humbly continue that support all the way to the end.
I would also like to thank Terry Byrne for all his assistance with preparing the laboratory
tests carried out for this project, including making temperature and pressure sensors for live
reads in the hot and cold chambers, which also involved some clever 3D printed brackets and
cradles for containing them in small packages. There is also the fine assistance of Friederike
Eberhard and Adrian Blokland for monitoring and assisting with regards to the use of the
laboratory equipment and carrying out tasks during the tests.
I must also thank the various librarians that have assisted me in this project. They include
Sandra Cochrane, for consistently coming back with answers, Vivienne Armati, for walking
me through EndNote, and Marcos Riba, for spending his personal time helping me
manipulate databases. None of my research or my citations & referencing would have been
possible without their training and support.
I would also like to thank various industry organisations that have assisted with information
for the research of this project. They include Choice Magazine Australia, NATA (National
Association of Testing Authorities), Standards Australia, and NMI (National Measurement
Institute).
Lastly, but equally importantly, I would like to acknowledge the invaluable assistance of 4
manufacturers whose assistance at the beginning of my research allowed me to know
firsthand where the industry currently is and how they feel about such work being done. They
include Coleman – Esky, Evakool, Techniice and Waeco.
viii
Table of Contents
Abstract .................................................................................................................................................. iv
Disclaimer................................................................................................................................................ v
Certification............................................................................................................................................ vi
Acknowledgements ............................................................................................................................... vii
List of Equations .................................................................................................................................... xii
List of Figures ....................................................................................................................................... xiii
List of Tables .........................................................................................................................................xiv
Glossary of Terms.................................................................................................................................. xv
Nomenclature .......................................................................................................................................xvi
1. Introduction .................................................................................................................................... 1
1.1. Selection Confusion ................................................................................................................ 1
1.2. Project Aim .............................................................................................................................. 2
1.3. Project Focus ........................................................................................................................... 3
1.4. Limitations............................................................................................................................... 3
2. Literature Review ............................................................................................................................ 5
2.1. Current Industry Practice ........................................................................................................ 5
2.1.1. Industry Tests & Ratings ................................................................................................. 6
2.1.2. Similar Industry Processes .............................................................................................. 6
2.2. Industry Observers .................................................................................................................. 7
2.3. Researchers Insights ............................................................................................................... 8
2.4. Regulators ............................................................................................................................... 9
2.5. Applicability of Literature ..................................................................................................... 10
3. Methodology ................................................................................................................................. 14
3.1. Target Products ..................................................................................................................... 14
3.1.1. Consumer Market Testing ............................................................................................. 15
3.1.2. Commercial Market Testing .......................................................................................... 15
3.2. The Science Within ................................................................................................................ 16
3.3. The Concept of Heat ............................................................................................................. 16
3.3.1. Modes of Heat ............................................................................................................... 17
3.3.2. Media for Heat .............................................................................................................. 21
3.4. Testing Processes .................................................................................................................. 23
3.4.1. Mathematical Analysis .................................................................................................. 23

ix
3.4.2. Experimental Testing .................................................................................................... 24
3.5. Testing Procedure ................................................................................................................. 27
3.5.1. Volume & Surface Area ................................................................................................. 27
3.5.2. Temperature Versus Time ............................................................................................. 30
3.6. Rating Procedure................................................................................................................... 31
3.6.1. Human Interpretation ................................................................................................... 31
3.6.2. Shifting the Interpretative Function ............................................................................. 31
3.6.3. Rating System Options .................................................................................................. 32
3.7. Sustainability ......................................................................................................................... 35
4. Analysis (Results) .......................................................................................................................... 36
4.1. Mathematical Results from MS Excel ................................................................................... 36
4.1.1. Air/Water Comparison .................................................................................................. 36
4.1.2. Shape Impacts ............................................................................................................... 38
4.1.3. Size Impacts ................................................................................................................... 38
4.1.4. Total Internal Energy ..................................................................................................... 39
4.1.5. Temperature Selection ................................................................................................. 41
4.1.6. Specific Internal Energy ................................................................................................. 42
4.1.7. Material Impacts ........................................................................................................... 44
4.2. Experimental Results from USQ Laboratory ......................................................................... 47
4.2.1. Sample Specimen Selection .......................................................................................... 48
4.2.2. Laboratory Equipment .................................................................................................. 50
4.2.3. The Test Plan ................................................................................................................. 52
4.2.4. Outputs ......................................................................................................................... 56
4.2.5. Analysis of Experiments ................................................................................................ 63
4.3. Rating System Selection ........................................................................................................ 71
5. Conclusion (Discussion)................................................................................................................. 73
5.1. Observations ......................................................................................................................... 73
5.2. Considerations ...................................................................................................................... 74
5.3. Reflections............................................................................................................................. 74
5.4. Looking Forward ................................................................................................................... 75
5.4.1. System Development .................................................................................................... 75
5.4.2. System Ownership ........................................................................................................ 77
5.4.3. Remuneration Options .................................................................................................. 77
List of References .................................................................................................................................. 79

x
Appendices ............................................................................................................................................ 81
A. Project Specification ................................................................................................................. 82
B. Timeline & Resources................................................................................................................ 83
C. Guarded Hot Box Apparatus ..................................................................................................... 84
D. Test Plan .................................................................................................................................... 86
Test Plan ............................................................................................................................................... 86
Equipment & Personnel .................................................................................................................. 86
Equipment .................................................................................................................................... 86
Personnel ..................................................................................................................................... 86
Test 1 – Standard Test .................................................................................................................... 87
Objective....................................................................................................................................... 87
Task Run ....................................................................................................................................... 87
Test 2 – Half Standard Test with Volume Change ......................................................................... 88
Objective....................................................................................................................................... 88
Task Run ....................................................................................................................................... 88
Test 3 – Half Standard Test with RH Change ................................................................................ 89
Objective....................................................................................................................................... 89
Task Run ....................................................................................................................................... 89
Test 4 – Standard Test with Design & Material Change ............................................................... 90
Objective....................................................................................................................................... 90
Task Run ....................................................................................................................................... 90
Test 5 – Half Standard Test with ATM Change .............................................................................. 91
Objective....................................................................................................................................... 91
Task Run ....................................................................................................................................... 91
E. Risk Assessment & Management .............................................................................................. 92
Risk Assessment & Management .......................................................................................................... 92
F. Work Permit .............................................................................................................................. 94
G. Induction Checklist .................................................................................................................... 95
H. Standard Operating Procedure ................................................................................................. 96
I. ELG Logger Graphs .................................................................................................................... 97
a. Test 2 ..................................................................................................................................... 97
b. Test 3 ..................................................................................................................................... 99
c. Test 4 ................................................................................................................................... 101
J. Excel Temperature Graphs ...................................................................................................... 103

xi
d. Test 2 ................................................................................................................................... 103
e. Test 4 ................................................................................................................................... 105

xii
List of Equations
Equation 3.1 .......................................................................................................................................... 18
Equation 3.2 .......................................................................................................................................... 18
Equation 3.3 .......................................................................................................................................... 18
Equation 3.4 .......................................................................................................................................... 19
Equation 3.5 .......................................................................................................................................... 20
Equation 3.6 .......................................................................................................................................... 20
Equation 3.7 .......................................................................................................................................... 27
Equation 3.8 .......................................................................................................................................... 27
Equation 3.9 .......................................................................................................................................... 28
Equation 3.10 ........................................................................................................................................ 28
Equation 3.11 ........................................................................................................................................ 28
Equation 3.12 ........................................................................................................................................ 28
Equation 3.13 ........................................................................................................................................ 28
Equation 3.14 ........................................................................................................................................ 28
Equation 3.15 ........................................................................................................................................ 29
Equation 3.16 ........................................................................................................................................ 29
Equation 4.1 .......................................................................................................................................... 37
Equation 4.2 .......................................................................................................................................... 37
Equation 4.3 .......................................................................................................................................... 37
Equation 4.4 .......................................................................................................................................... 37
Equation 4.5 .......................................................................................................................................... 40
Equation 4.6 .......................................................................................................................................... 40
Equation 4.7 .......................................................................................................................................... 43
Equation 4.8 .......................................................................................................................................... 43
Equation 4.9 .......................................................................................................................................... 44
Equation 4.10 ........................................................................................................................................ 44
Equation 4.11 ........................................................................................................................................ 44
Equation 4.12 ........................................................................................................................................ 45
Equation 4.13 ........................................................................................................................................ 46
Equation 4.14 ........................................................................................................................................ 67
Equation 4.15 ........................................................................................................................................ 67
Equation 4.16 ........................................................................................................................................ 67
Equation 4.17 ........................................................................................................................................ 67
Equation 4.18 ........................................................................................................................................ 67
Equation 4.19 ........................................................................................................................................ 67

xiii
List of Figures
Figure 4.1 – The Willow Sixer cooler (image courtesy of Willow) ........................................................ 48
Figure 4.2 – The EvaKool IceMate ice box (image courtesy of EvaKool) .............................................. 49
Figure 4.3 – The Outdoor Plus cooler bag............................................................................................. 50
Figure 4.4 – The data logger used for testing (image courtesy of Lascar) ............................................ 52
Figure 4.5 – ELG graph of the logger from the vessel for Test 1 ........................................................... 57
Figure 4.6 – ELG graph of the logger from the cold room for Test 1 .................................................... 57
Figure 4.7 – ELG graph of the logger from the oven for Test 1 ............................................................ 58
Figure 4.8 – Excel temperature graphs of the loggers for Test 1 showing both the heat ingress and
egress processes ................................................................................................................................... 59
Figure 4.9 – Excel temperature graphs of the loggers for Test 1 showing the heat ingress with greater
clarity .................................................................................................................................................... 60
Figure 4.10 – Excel temperature graphs of the loggers for Test 1 showing the heat egress with
greater clarity ........................................................................................................................................ 60
Figure 4.11 – Excel temperature graphs of the loggers for Test 3 showing the time taken to gain a
maximum RH in the oven and vessel .................................................................................................... 62
Figure 4.12 – Excel temperature graphs of the loggers for Test 3 showing the heat egress with
greater clarity ........................................................................................................................................ 63
Figure C.1 – Schematic diagram of the operation of a guarded hot box apparatus............................. 84
Figure C.2 – A guarded hot box apparatus in use ................................................................................. 85
Figure I.1 – ELG graph of the logger from the vessel for Test 2 ............................................................ 97
Figure I.2 – ELG graph of the logger from the cold room for Test 2 ..................................................... 98
Figure I.3 – ELG graph of the logger from the oven for Test 2 ............................................................. 98
Figure I.4 – ELG graph of the logger from the vessel for Test 3 ............................................................ 99
Figure I.5 – ELG graph of the logger from the cold room for Test 3 ................................................... 100
Figure I.6 – ELG graph of the logger from the oven for Test 3 ........................................................... 100
Figure I.7 – ELG graph of the logger from the vessel for Test 4 .......................................................... 101
Figure I.8 – ELG graph of the logger from the cold room for Test 4 ................................................... 102
Figure I.9 – ELG graph of the logger from the oven for Test 4 ........................................................... 102
Figure J.10 – Excel temperature graphs of the loggers for Test 2 showing the heat egress process . 103
Figure J.11 – Excel temperature graphs of the loggers for Test 2 showing the heat egress with greater
clarity .................................................................................................................................................. 104
Figure J.12 – Excel temperature graphs of the loggers for Test 4 showing both the heat ingress and
egress processes ................................................................................................................................. 105
Figure J.13 – Excel temperature graphs of the loggers for Test 4 showing the heat ingress with
greater clarity ...................................................................................................................................... 106
Figure J.14 – Excel temperature graphs of the loggers for Test 4 showing the heat egress with greater
clarity .................................................................................................................................................. 106

xiv
List of Tables
Table 4.1 – Volume to Surface Area Ratio w.r.t. Shape ........................................................................ 38
Table 4.2 – Volume to Surface Area Ratio w.r.t. Size ........................................................................... 39
Table 4.3 – Interpolation for Specific Internal Energy .......................................................................... 42
Table 4.4 – Interpolation for Density .................................................................................................... 43
Table 4.5 – Thermal Conductivity of Some Common Materials ........................................................... 45
Table 4.6 – Heat Transfer Rates and Timeframes ................................................................................. 46
Table 4.7 – Test 1 Raw Data .................................................................................................................. 64
Table 4.8 – Test 1 Outputs .................................................................................................................... 65
Table 4.9 – Ratio of Test 1 Outputs....................................................................................................... 65
Table 4.10 – Test 2 Raw Data ................................................................................................................ 68
Table 4.11 – Test 3 Raw Data (See for %RH results) ............................................................................. 68
Table 4.12 – Test 4 Raw Data ................................................................................................................ 69
Table 4.13 – Test 2 Outputs .................................................................................................................. 69
Table 4.14 – Test 3 Outputs .................................................................................................................. 69
Table 4.15 – Test 4 Outputs .................................................................................................................. 70
Table 4.16 – Test 1 Raw Data for %RH (heat egress only to match Test 3) .......................................... 70
Table 4.17 – Test 3 Raw Data for %RH .................................................................................................. 71

xv
Glossary of Terms
Term Definition
ATM Normally this notation means ‘atmosphere’ in
the context of the pressure of air in the
atmosphere, such as 1atm=101.325kPa.
However, in this document it is mostly used as
shorthand to denote atmospheric pressure in
general, as opposed to any other pressure,
allowing for the fact that atmospheric pressure
changes with elevation.
ISC Insulated Shipping Containers – these are
typically cardboard boxes lined with insulating
material such as foam.
PCM Phase Change Material – any substance which
changes state with the addition or subtraction of
heat, specifically with the aim of achieving a
desired temperature, ice being the most obvious
(and natural) example.
Product Any insulated vessel from the manufacturer’s
perspective
Stock Any contents in a vessel from the producer’s
perspective which may ordinarily be referred to
as a product

xvi
Nomenclature
Symbol Definition
L (m) Length along a heat flow path, equivalent to
material thickness
r (m) Characteristic length of a shape with respect to
the unit volume. For a sphere it is the radius,
while for a cube it is the side.
V:As (m) Ratio of volume and surface area of a 3D shape.

1
1. Introduction
Esky is a brand name. It is so common in general Australian parlance that many may not
know that. In New Zealand, they are known as chilly bins (possibly also a brand name), while
other countries may refer to them as ice boxes, ice chests, coolers or other terms. These are
portable, hard-cased, insulated vessels designed to keep food and drink cool by repelling heat
ingress. There are drink specific ones, known as a Thermos (also a brand name) or soft
versions known as cooler bags, and others designed to keep food hot, such as pizza pouches.
There are even disposable vessels such as the foam boxes for fruit and vegetables, or the
more specialised insulated shipping containers, used for transporting medicines and other
temperature sensitive products.
1.1. Selection Confusion
Whatever the name and whatever the use, selecting the correct one is not an easy task since
no information about the thermal performance of each product on the market is provided by
the manufacturers. Commercial consumers, who develop strong relationships with their
suppliers will come to know the right product for their needs, but may sustain unnecessary
expense leading to that arrangement. A retail consumer entering a shop with the intent of
purchasing such a product could easily struggle to determine which one would meet their
specific needs. Is it to be for camping, a picnic, or just bringing frozen foods home from the
shops?
Whatever the need, even the most fastidious consumer will be relying heavily on the
knowledge of the sales person, who may only use one or two types for only a couple of
purposes; certainly not all products in all situations, and unless consumers return to tell the
sales person about their experience, there is not likely to be much genuine feedback from the
field for the sales industry, leaving their view rather biased and varied from one outlet to the
next. Granted, there are consumer groups such as Choice Magazine Australia, who provide
comparisons to assist the general public, however their tests are not universal and may have

2
different criteria, one from another, which can prolong the consumer’s uncertainty about
which product is most suitable for a given need.
So how can a consumer, commercial or retail, know for sure which product has the best
thermal performance that suits their particular need? What is needed is an objective testing &
rating system that allows any consumer to interpret the result to their specific needs.
1.2. Project Aim
This project aims to create a universal, independent, transparent and repeatable testing &
rating system for portable, insulated vessels that allows consumers to purchase the right
product for each purpose with confidence. The outcome should be similar to the energy-
efficiency ratings for refrigerators, the water-efficiency ratings for showers or the fuel-
efficiency ratings for cars. With rating labels on every product on display in any commercial
or retail environment, any consumer can determine for themselves, based on their own
individual interpretation of what the ratings mean to them, the right product they may need
for any given situation they may encounter.
To ensure consumer confidence, it is important that the testing is carried out by independent
bodies, rather than the manufacturers. These bodies should also be above reproach by being
authorised by an independent accreditation body, such as NATA (National Association of
Testing Authorities, Australia) who carry out the accreditation programs for laboratories and
provides them with support in their obligations, while the tests themselves should be
approved by independent bodies such as NMI (National Measurement Institute, Australia)
who oversee the right and wrong ways of measuring things in industry. Although, the general
public would not necessarily understand what these bodies do, they are more likely to have
confidence in a labelled rating which cites such bodies as being involved in the process.
Meanwhile, the commercial market will have a greater level of assurance in their selections
knowing that the data is not manipulated by an over-eager manufacturer seeking to increase
market presence at the expense of their potential client base. For the manufacturer, it means

3
they can state ‘hand-on-heart’ that their products achieve a certain rating, while also being
able to fast track R&D1 processes to fulfil market demand.
1.3. Project Focus
The work in this project is divided into two distinct parts. Firstly, there is the scientific aspect
which looks at the insulated vessels thermal efficiency and how this affects stock in the
vessels. Secondly, there is the human aspect which looks at meeting the perceived
understanding of the consumer to whom this system is targeted. From the scientific
perspective, the testing system must look at both ingress and egress of heat, if the application
is to extend to both hot and cold requirements. From the human perspective, the rating system
must have a meaningful reading, such as the stars on refrigerators and showers.
1.4. Limitations
It is important to state at this stage that the aim of this project in not to rate the quality of the
products. This is only aiming to rate the thermal efficiency which will determine the products
effectiveness in resisting temperature change over time. To this end, cooler bags used for
keeping lunch or shopping cool for a few hours (or a pouch to keep pizza warm for a similar
timeframe) will not require as high a rating to be considered a quality product for the task,
while ice boxes that are used on fishing trips (keeping the prized catch cold for days) will
require a much higher rating to be considered fit for purpose.
This system is also aimed only at passively cooled or heated vessels, not any actively
controlled vessels such as fridges or ovens, and is only aimed at enclosed vessels, which
excludes ‘stubbie’2 coolers for keeping single-serve drink bottles cold once opened, or any
other similar open insulators.
1 R&D stands for Research and Development.
2 Stubbie, or stubby, is Australian slang for a small bottle of beer. Summers, E, Kuether, J, Isaacs, A, Butterfield,
J, Holmes, A & Law, J 2003, Collins English Dictionary: Complete and Unabridged, HarperCollins.

4
This project does not aspire to limit the freedom of manufacturers to design products in any
shape or choice of construction materials or construction processes that may reduce their
opportunity to meet market demands. They should be free to do whatever they deem
necessary to meet all their other consumer demands as a function of meeting the desired
thermal performance requirements stipulated by their customer base.

5
2. Literature Review
The literature review for this project has been carried out through 4 key searching processes.
Initial searches via the internet and databases failed to return any meaningful results. As a
consequence of this, manufacturers were contacted for information on how they have carried
out the tests for their performance claims, as well as any literature that they may have used.
This allowed returning to the internet and database searches with more specific search terms.
This lead to more fruitful information, which in turn allowed further research based on the
references in some of those documents.
2.1. Current Industry Practice
Three local manufacturers were contacted in order to ascertain current industry practices. The
selection was relatively random, and no favour was placed on any manufacturers over any
others. One of the three firms selected suggested contacting a fourth, which was done. The
manufacturers contacted were Coleman – Esky, Evakool, Techniice and Waeco.
Each company was quick to share current practices over the phone, all of which showed
similar thinking with variations on a theme. Emails were sent to each firm with questions
regarding existing rating systems that they were aware of (either internal or from other
sources, such as Choice Magazine), or the use of R-values for raw materials in product
development, and any literature that may have been accessed, such as journal articles, papers
standards or procedures. Each was also invited to share policy or procedure documents used
for the testing of performance characteristics of their products.
The responses, either by phone or email, were similar: No literature is available at present, R-
values are for pre-fabricated sheets, and each manufacturer carries out their own testing. Two
of them were kind enough to provide some written details of their testing procedures.

6
2.1.1. Industry Tests & Ratings
In an email from Evakool (R Mendes 2015, pers. comm., 22 May) it was demonstrated that
their current testing regime consists of using a control room at 32oC, in which a test specimen
is placed. It is loaded fully with ice (not specified whether block ice or party ice – bags of ice
cubes) and opened thrice daily (time open was not stated). The quantity of ice is observed
daily and once no ice is observed the number of days is noted. The melted water was left in
the vessel. The rating for this test was simply the number of days of keeping ice frozen.
Similarly, Waeco provided their procedure in an email (S Elliott 2015, pers.comm., 31 May).
Waeco, who are better known for actively-refrigerated portable vessels, pointed out that they
are relatively new to the market with passively-cooled vessels, and therefore developed their
system based on the claims of the competition. They observed that their competitors were
claiming numbers of days for keeping contents cold and set about doing the same. Their test
consists of a control room at 30oC and the use of 6 blocks of 5kg ice as well as a 4kg bag of
party ice. The lid is opened once daily for 1 minute and water is removed daily during the lid
opening. In one example test of one of their models, they observed enough ice left for
‘effective use’ after 11 days, 1kg of ice left after 12 days, and no ice remaining on day 13.
The published result was ‘10 days’, allowing a conservative experimental margin of error,
however no scientific explanation was provided for this factor of safety.
2.1.2. Similar Industry Processes
In order to determine whether processes could be replicated from similar industries, a brief
search for other products was also made: In particular, the use of insulated materials as a
construction material for industrial cold storage. However, as expected, this industry is
inclined to conform to the methodology of the construction industry. As an example,
insulated panels (Kingspan 2012) are given an R-value for the individual panels, rather than a
particular construction being given an energy rating. Given the custom nature of each
construction, the fact that active chilling of air with air-conditioning systems is used, and
each building design is modelled in complex programs to determine the overall energy
efficiency, this isolated material rating (as opposed to a complete package rating) makes

7
sense in that industry, which means that borrowing from that industry would not lend itself
well to this particular project, since the aim here is to have a rating for a complete product.
2.2. Industry Observers
Choice Magazine has been a household name in Australia for quite some time, and was
targeted in the initial searches for any testing of this range of products. One of the
manufacturers contacted also suggested contacting Choice, which provided kudos for this
rationale. Other reviews were also found, two of which are shared here.
Choice Magazine has actually been regularly reviewing ‘eskies’ for about 20 years (M Steen
2015, pers. comm., 26 May) using a test and rating that has satisfied their readers over time.
In their most recent test (Steen 2014) a variety of products were put to the test for not only
their thermal performance, but also their features, which was far more subjective. Their
thermal testing consists of filling each vessel with bottles equivalent to 20% of the vessel
volume (no details on the temperature or contents of the bottles was provided, but it is
assumed that they had sensors inserted for the ensuing results) as well as ice also equivalent
to 20% of the vessel volume (again no mention of the type, but assumed to be party ice to fit
around the bottles) and placing them in a control room at 32oC (each specimen was
preconditioned to this temperature). The temperature of the bottles was measured over time
for ranges of 0oC-2oC and 2oC-8oC, but not enough detail was provided to determine whether
the bottles were already at 0oC or had to initially cool to this temperature within the test (this
would provide uncontrolled variables in the testing process which could skew the results).
Each vessel was opened for a few seconds to ‘tamp down the ice’ but the frequency of this
task is not defined. Each product was given a percentage score; however the method of
determining this was not explained. The best performer achieved 95%, which leads to
questions such as ‘was this based against the rest of the products tested, against some uncited
benchmark, against manufacturers claims, or some other yard stick’.
In another review, this time of fluid vessels – as in Dewar flasks or Thermos flasks -
(Martinet 2013), a small sample of new and used vessels, including a mug as a reference
specimen, were filled with hot liquid to a set temperature and measured regularly for their
temperature change over time. The control room was a domestic apartment, which would

8
have had fluctuations, however all samples were together so this should not have impacted
significantly for the purposes of this analysis. The products in question were not given a
rating as such, but were ranked in terms of which held the liquid at the highest temperature
for the duration of an average 8 hour work day: An objective outcome, but nonetheless
specific to one subjective perception of performance.
In a third review, again with insulated vessels, called coolers in this instance – as it was
performed in the USA - a number of specimens were tested with boating needs in mind
(Vance 2013). This review also looked at a number of factors, including the ratio of internal
and external volumes; therefore the thermal performance was not necessarily the most
important consideration. In this test, each vessel was filled to full with ice (not specified as to
whether block, party or otherwise, however the article stated ‘slight crushing of ice’ when
closing the lid which suggests party ice). They were then placed in the sun (the first test to
hint at radiant heat and not just assume conductive or convective heat alone), and water was
drained daily for one week, at the end of which the quantity of ice was calculated as a
percentage of the original ice. The remaining ice percentage acted as the rating of thermal
performance.
2.3. Researchers Insights
Research was also carried out to determine what other researchers may have uncovered or
developed over time. There was very limited material found, suggesting that (as far as this
particular product type is concerned) little emphasis has been placed on thermal performance
in the past. Given that until recent decades there has been little emphasis on thermal
performance in other more significant industries, such as the built environment, this is a
plausible deduction.
One particular paper is quite anecdotal of this. An analysis was carried out nearly a century
ago on refrigerated domestic vessels. In those days the choices were either ice, or a brine
circuit. It would be some time before the modern ‘fridge’ using the compression-expansion
cycle would be used in homes; therefore performance would have been a critical factor for
food preservation. In an article titled “Food In The House Refrigerator” (Broadhurst & Van
Arsdale 1924), in which 3 vessels are tested for bacterial changes with respect to temperature

9
and humidity, there is little mention of the physical or thermal aspects of the test specimens.
There is mention of the materials in a casual way – with more focus on the shape for
convective air flow inside – but no mention of the thermal performance of each construction
(as if this aspect was not a consideration in that era), other than one sample having a metal
lined wood with a density conducive to resisting heat, but certainly no R-value or even an
indication of W/m-K or similar parameter for any material combination.
At the other end of the spectrum, a Paper on insulated shipping containers (ISC) proved to be
very useful for this analysis. In this particular study (Singh, Burgess & Singh 2008) there is a
dedicated focus on determining the R-values of various package systems. This involved an
‘ice-melt’ test which preconditioned slabs of ice (by allowing a small amount of water to be
produced to ensure a 0oC temperature of the ice) with which the actual test was carried out.
Each shipping container was then left in a control room of 23oC such that air could contact
the top and all sides of each specimen, containing a preconditioned ice slab within a bucket,
which was taped up as per industry practice. These were left for 12 or 24 hours (ensuring a
minimum of ice remained) after which the quantity of water was measured and divided by the
timeframe to determine the ‘melt rate’. From this a system specific R-value was created for
each sample. This is the first test that takes the specimen surface area into consideration,
showing an understanding that variations in volume and surface area can skew the results if
not taken into account in the tests.
It is important to note here that this study focused on the combination of a package type and
an anticipated product thermal load, making it more industry specific than would be useful
for this project. This paper even discussed how the commercial operator would calculate the
quantity of ice required to adequately ship products without excursion from their desired
temperature range during shipment. This would certainly not be adopted by domestic
consumers who are more likely to guess their requirements than perform any computations.
2.4. Regulators
There were also two rather interesting test procedures discovered which also focused on
ISCs, however these were from regulators within industry; one independent, and one
governmental.

10
The International Safe Transit Association has developed numerous procedures for a variety
of issues for the container shipping industry, one of which (ISTA 2007) focuses particularly
on the thermal performance of ISCs. Their test methodology is similar to the process outlined
above for ISCs by researchers; however there is more focus on a specific product/package
combination, as well as the actual trip taken by the parcel. The testing consists of a sequence
of different temperatures over varying timeframes, with ramping up and down in some cases,
intended to simulate generalised shipping lanes for their clients’ products. In more recent
work (Cox 2012), they have greatly increased their research on temperature fluctuations of
actual shipping lanes within the USA and developed software simulation models for
determining the exact packaging requirements for any client’s product’s trip from door to
door. The aim is to maintain the product within an acceptable temperature bandwidth
(measured with sensors inside the packaging) for each given product throughout the sequence
of test cycles. The rating in this instance is simply pass or fail.
The other testing process is one developed by the World Health Organisation (WHO)
specifically for the transport of vaccines (and similar temperature-sensitive medical products,
such as pathology samples) where refrigeration is not possible. Their methodology (World
Health Organisation 2010) is quite similar to that defined for ISTA above, however their
focus is on not exceeding a critical temperature, either up or down (depending on the
requirements), within a minimum timeframe. The ratings of this test are known as ‘cold life’,
‘cool life’ and ‘warm life’, of which only the cold life rating must meet a minimum
timeframe, suggesting that for the others the methodology is still in a developmental phase of
its life.
2.5. Applicability of Literature
There is a fair range of information within this literature review to prepare a suitable
methodology and subsequent testing & rating system. There are strong and weak points about
each of the processes outlined above.
On one hand, the current industry players are obviously responding to market demand, but
this does not mean that the average consumer knows and demands the best possible testing
methodology. The common use of ice is certainly analogous to how most consumers might
11
use the vessels, however it is clear that ice comes in different forms and at different
temperatures which would make comparisons very difficult. Since water holds much more
heat than air (due to a much higher specific heat value) or certain food items, any test using
large quantities of ice will favour larger vessels which have more ice to thaw. These tests also
make broad assumptions about how the products will be used by all consumers, rather than
being as objective as possible and allowing each consumer to interpret the ratings, tailored to
their own usage patterns. Much the same can be said for the comparisons carried out by the
3rd party observers. There is also noticeable vagueness in the ratings, some of which are very
subjective. The best is the percentage ice remaining, followed by the final temperature at the
end of a work day, but others don’t necessarily reflect a result that can be easily repeated by
any other tester/consumer.
On the other hand, the commercial systems are obviously applying science to achieve a
commercially viable outcome, but for very specific applications. These tests and ratings are
far more objective in their nature and apply more controls to ensure repeatable results;
however they may not lend themselves to such a broad application as for this analysis, since
each has been designed for a particular outcome. For example, the Paper on ISCs used only
cube shaped boxes with the same insulation and cold packs, however coolers come in all
different shapes and sizes and consumers will use a variety of cooling media from gel packs
to dry ice, and will be needing to preserve a wide variety of food items for a number of
different scenarios, so such a test may not cover all these combinations and permutations.
Similarly, a rating which does not exceed a temperature within a timeframe is very precise for
vaccines being transported in a predetermined way, but may be meaningless to a variety of
consumers using the same product in different ways. Also, these systems are designed to
ensure that a specific temperature sensitive product is preserved over the same repeated
transit on a regular basis, which again does not reflect the random usage patterns of the
average consumer using an esky for different activities at different times of year.
This raises another important point. All the tests have been carried out with control
temperatures, some using just one temperature while others use multiple bands: ISTA in
particular has summer and winter profiles to ensure that their clients’ needs are met
throughout the year, while WHO have 3 different ratings for use in different climates around
the world. However, a domestic consumer will be using a cooler which is exposed to a
variety of random temperature changes during each usage. For example a cooler may be in

12
the sun in the back of a vehicle at nearly 60oC at one point and then sitting on the ground
outside a tent at nearly 0oC during the night. Therefore testing to a set temperature or to a set
of temperatures is not indicative of how a domestic consumer will use their cooler, even if it
can be seen as appropriate for replicating the shipment of a commercial product in a
predictable and repeatable process.
It is also worth pointing out that some tests involve opening the samples while others don’t.
This is based on predicted usage patterns. For example a domestic consumer is likely to want
to access stock from a vessel at various times, but an ISC will remain closed from the start to
the finish of its transportation. Similarly, some tests use ice and gel packs or phase change
materials (PCMs) while others have air gaps, or a combination. These practices are also
intended to mimic usage patterns; however it is less likely to be precise for consumer
applications than for known commercial applications.
The combination of air and water will greatly affect the temperature change patterns, so there
must be care taken in determining such combination, which of course is again less likely to
be precise domestically than commercially. This is even more important with the use of
PCMs which are capable of maintaining a particular temperature for long periods of time,
perfect for a known stock requirement. The same can be said of ice melting, which will
maintain food at 0oC for longer than at other temperatures when the water is either solid or
liquid, which could greatly skew any results as a function of the quantity of ice.
Extending from this point is the fact that one test left melted ice in the cooler, while the
others drained the water: This will allow heat transfer in two different ways, which again can
skew the results. The commercial ratings are also clearly based on a stock/product
combination, and in some cases a stock/product/trip combination, while the domestic ratings
are limited to assessing the product (insulated vessel) only, as the contents in real applications
will not be what was tested.
Lastly, it is important to discuss some short comings that may arise if performance metrics
were to be developed along the same lines as the construction industry. Each building is
almost unique in shape, while each esky is mass-produced. Equally, each building tends to
have relatively simple shapes – parallel surfaces with even thicknesses – while coolers are
moulded to a more free-form shape to allow for wheels, handles, hinges, clasps and other
practical considerations which ultimately vary the thicknesses and densities of all the

13
surfaces. The construction industry relies on complex software programs which model the
design of a building and allow for the R-values of each material used. This is highly complex,
open to interpretation, which leads to differences in results from one modeller to another, and
is also very expensive to carry out, which can be justified for a large building that will stand
for several decades, but not to a cooler that may only last 5-10 years. Applying such a process
to eskies would require determining the R-values of the materials, which is not as easy for
blown insulators in a custom mould as it is for more uniform shapes with even densities, such
as the insulated panels mentioned earlier. Even if this could be carried out with a high degree
of accuracy, it is then incumbent on the designer of the insulated vessel to carry out energy
models on each product design within their software, which would be fraught with the same
dangers of interpretation as for the construction industry. This would be an expensive
exercise which may not lead to the desired market confidence, so a simpler system should be
developed rather than replicating what the construction industry has determined is suitable for
its needs.

14
3. Methodology
The methodology for this project consists of firstly defining the specific range of products to
be included in the analysis, followed by analysing current processes by manufacturers and
other testing & rating bodies. There must be a review of heat transfer principles with an
analysis of what is pertinent to this project. Next, a testing procedure can be developed. This
can then be followed by mathematical analysis, using software, to determine approximate
ranges of results, and then also by experimental testing, using laboratory equipment at the
USQ Toowoomba campus. The experimental results must be analysed against the
mathematical results to determine whether the testing process achieves the objectives of this
project. Finally, a rating system can be devised to reflect the testing results in a meaningful
way for the consumer.
3.1. Target Products
As has been mentioned in the sections above, this analysis primarily aims at developing a
system to meet consumer needs, but is not limited to just that sector of the market. The
previous section has demonstrated that there are viable systems in place for the commercial
market which appear to be limited to very specific circumstances such as the repetitive
delivery of a specific product along the same transit path each time; however they do not
appear to be universal for other applications. That does not mean that this system (being
developed here) could not or would not be adopted by the manufacturers of ISCs.
However, there may be certain commercial requirements that may lead to a preference for the
system developed in this project. For example, agricultural producers, using foam boxes, may
prefer the flexibility of different products from different suppliers from season to season,
based on different produce of differing sizes, which may not allow the other systems to be
easily adopted by a foam box manufacturer whose clients have many varied needs and don’t
seek to have lock-in contracts for the supply of insulated shipping containers when their
needs may go up and down based on seasonal variations.
15
3.1.1. Consumer Market Testing
The current testing regimen by the manufacturers tends to be based on simulation of
consumer usage, with a rating of meeting a number of ‘days cold’, rather than assessing the
thermal resistance of the unit as a whole and having a more objective rating. This is fraught
with too many assumptions about what the consumer needs, which simply reflects the many
varied usage patterns of so many different consumers.
There are also too many variations in the test procedures, such as keeping water in the vessel
or removing it on a regular basis. This will greatly influence the results since the water in the
vessel will act as a bridge for the heat path to the ice, where air would act as a barrier.
Equally, the use of ice does not define the temperature of the ice to begin with, so additional
time may be gained by using very cold ice and draining it regularly, compared with one of the
commercial tests, which ensures the ice is at 0oC before commencing the process and retains
the water for measuring the heat gain.
The risk with this for consumers is that they may naïvely assume that the claimed number of
days cold is based on their own usage patterns rather than anyone else’s usage patterns, not
stopping to think about the fact that different people use the product in different ways. This
leads to consumer dissatisfaction and lack of consumer confidence for the manufacturers,
who are actually trying to achieve the very opposite.
3.1.2. Commercial Market Testing
Similarly, the commercial sector of the market also tests products based on client usage
patterns, although in this case the clients usage patterns are well determined and repeatable,
and in some cases almost able to be completely simulated in a laboratory, as alluded to by
ISTA’s paper on the applications of lane data (Cox 2012). Since monetary demands control
supply in such an industry, one must assume that these systems are effective for their target
market, or else other systems would be being developed. That does not mean that the system
being developed in this analysis could not be adopted by operators within the commercial
market, but this analysis is certainly not trying to compete with or replace those application-
specific systems.

16
3.2. The Science Within
Past assessments have focused more on temperature than heat; however heat is more
important as it is the source which creates any resultant temperature. In particular the heat
transfer from one side of the vessel walls to the other (due to a temperature differential across
the wall, driving the heat transfer from hot to cold) is more important than the heat holding
capacity of the volume of the vessel itself.
Therefore, the requirements for assessing thermal performance of an insulated vessel is about
heat, but only as limited to the effects of heat passing through the vessel walls. In particular,
this is about the rate of heat transfer (Watts, or Joules per second) rather than the quantity of
heat being transferred (Joules), as that is limited to the volume of the vessel and the thermal
properties of its contents, while the rate of transfer will impact directly on the success of
maintaining an internal temperature within a desired bandwidth over a desired timeframe for
the preservation of the vessel’s contents.
Fluid mechanics (such as any convective flows of air within or around the vessel), however,
are not aspects of the science that need to be addressed in this analysis. These would be for
any entity choosing to educate the consumer on how to maximise the use of their cooler.
Such an objective is clearly beyond the scope of this analysis.
Likewise, the assessment of the different thermal properties of various materials should be
kept within the realm of the manufacturer’s design processes, as the testing & rating system
being proposed in this analysis is not attempting to define the best designs, but simply to rate
what has been designed. This obviously extends to shape and size of each product.
3.3. The Concept of Heat
There are different modes of heat which can transfer from one point to another: These are
known as radiant, convective and conductive heat. Likewise, there are different media in
which heat can exist: These are commonly, food, drink, ice, gel packs, air, and other contents
of a typical insulated vessel. These can all be considered in many different ways, as a

17
function of the total usage patterns of these media by a consumer, so it is important to
consider the limitations of this analysis.
A consumer would understandably be keen to know good practices for keeping food colder
longer, such as allowing air flow around items, and draining water from the vessel regularly:
One touches on convective heat, while the other touches on conductive heat (although heat
through water is convective, the transfer of heat from the vessel wall to the ice, via the water,
involves conduction, which is relevant to this project3). They may also be keen to know that
leaving their esky in the sun is worse than having it in the shade, even though the air may
have the same temperature in both places. This touches on radiative heat. Alas, all these are
beyond the scope of this project, simply because the way that a consumer chooses to use their
cooler is beyond the control of this testing & rating system.
Similarly, the analysis of heat transfer within the contents is beyond the scope of this project,
because the aim here is not to prescribe to the consumer what they can and cannot transport
in their cooler, but to allow them to learn to determine for themselves, based on experience
using this system, which vessel will meet a particular need.
Another aspect of heat transfer is how it travels through the walls of the vessel. A Dewar
flask has a vacuum between an inner and outer lining, while a budget model cooler might
have an air gap between two layers of moulded plastic, and a premium ice box could be made
of polyurethane. The considerations of radiant, convective and conductive heat in each
application are different; however these are ultimately beyond the scope of this analysis since
it is the prerogative of the manufacturer, based on a multitude of customer demands, to
determine what construction materials are used.
3.3.1. Modes of Heat
All heat ultimately comes from the sun, with the possible exception of the heat rising to the
earth’s crust from within: however since this is highly insulated (other than via volcanoes or
geothermal applications, far removed from this analysis), it can be ignored and only the sun’s
3 Note that the same can be said of the air; however since far less heat would be transferred through the air
compared with the water, this point is ignored.

18
heat will be considered. There are also other forms of heat, such as a fire or an electric heater,
but they do ultimately get their energy from the sun, stored in wood or fossil fuels.
The heat from the sun is radiant, so this form of heat should be discussed first. As the sun’s
heat reaches earth, it interacts with the earth’s atmosphere, which is gaseous (a fluid) and is
the subject of convective heat, which will be discussed second. Finally, the radiant and
convective heats, identified herein, come into contact with solids, such as the soil, plants &
animals, humans, and humanity’s entire built environment, converting to conductive heat:
Logically this will be discussed third.
Radiant heat flow can be estimated mathematically by
����� = −���
� − � ���� �
Equation 3.1
measured in Watts (W), based on the Stefan-Boltzmann law, using the Stefan-Boltzmann
constant
= 5.67 × 10�� � �� ∙ ��⁄
Equation 3.2
and ε is the emissivity of a grey body4, A is the surface area (more regularly referred to as As
in this report) and � is the surface temperature of the grey body in question, and � ��� is the
surface temperature of the surrounding surface, such as a room’s extremities or the
atmosphere, (Cengel & Boles 2007).
Convective heat flow can be estimated mathematically by
��!"#$ = ℎ!�� − �&�
Equation 3.3
using Newtons’ law of cooling, where �& is the fluid temperature and hc is the convective
heat transfer coefficient, which is far too complicated to calculate easily (as each instance
4 It is assumed that the reader of this analysis is familiar with the concepts of black bodies and grey bodies.

19
requires a variety of preliminary calculations which make each situation unique), and is not
necessary to meet the scope of this project, but suffice to say that it ranges from 2-100,000
(Cengel & Boles 2007).
Conductive heat flow can be estimated mathematically by
��!"#� = −'(
)�
)*
Equation 3.4
as per Fourier’s law of heat conduction, where kt is the thermal conductivity and dT/dx is the
temperature differential with respect to the thickness, x, of the conducting material, otherwise
identified as L in this analysis (Cengel & Boles 2007).
According to The Principles of Heat Transfer (Kreith, Manglik & Bohn 2010) only
conduction and radiation are heat transfer processes, suggesting that convection requires not
just a temperature differential (like the other two) but also mechanical mass transport. This
would be for a fluid, whether gas or liquid. This may be a consideration for PCMs as they
change phase and convective flows start to occur within, however this analysis in not
intending to cover the efficacy of such aids in the temperature control process. Another
example that could look at convection is in the simpler coolers which have an air gap
between the inner and outer shells. However, since this is a small, contained volume of fluid,
which is only demonstrating mass transport perpendicular to the overall heat flow direction, it
is not necessary to investigate this when ultimately it will be converted from conductive heat,
to convective heat, and back to conductive heat through the walls of the vessel at the micro
level, equating to one overall conductive heat transfer at the macro level.
Similarly, much work could be carried out for the effects of radiant heat transfer, however, as
noted in Thermodynamics: An Engineering Approach (Cengel & Boles 2007), radiation that
is incident on an opaque solid body (as hard and soft coolers invariably are) is only absorbed
to within a few microns of the surface, after which it becomes conductive heat transfer
(which is what makes the vessel surface hotter than the ambient air surrounding it).
Common terms can be observed in each equation shown above. Each has a surface area and a
temperature differential, and each has other factors which can be manipulated to represent a
similar construct that is interchangeably representative of each form of heat, known as the

20
overall heat transfer coefficient. This is most obvious in the equation for convective heat, by
the use of the letter h with the subscript c; hc. In fact it could be defined as hconv, while for
radiant heat it could be defined as hrad – although this requires some manipulation with
respect to temperature, given the power of 4 in the equation and the Stefan-Boltzmann
constant – and as hcond (sometimes written as hk5) for the conductive heat, which is
mathematically equivalent to kt/L, where L is the thickness of the conductive material (as
mentioned above), also referred to as the thermal conductance per unit area (Kreith, Manglik
& Bohn 2010): The thermal conductance being defined as
� = '( +⁄ �� �⁄ �.
Equation 3.5
Alternatively, this can also be considered in terms of
, = 1 �⁄
Equation 3.6
being the mathematical reciprocal which looks at the thermal resistance of the vessel rather
than its conductance; perhaps more pertinent for the understanding of the end user in this
application when selecting an appropriate vessel for their needs.
The heat transfer coefficient, measured in W/m2-K, is heat flux (in W/m2) divided by the
temperature (measured in K or oC), effectively making it the heat flow rate (in W) per unit
area (in m2) per unit temperature (in seconds). All things being equal in our testing of each
vessel (the surface area of the vessel, and the temperature differential of the test), this is the
characteristic of each vessel which will determine its performance. Given that, in the case of
the conductive heat transfer coefficient, hcond, it is governed by the thermal conductivity, kt,
and the material thickness, L, both of which are entirely in the hands of the manufacturer to
correctly select materials according to their thermal properties and correctly design the vessel
body based on thermal requirements, as a function of other requirements driven by market
demand.
5 The letter k is often used to represent the word conductive, as opposed to the letter c which tends to
represent the word convective, to avoid confusion in using both in various equations.

21
3.3.2. Media for Heat
Consideration must be given to the medium through which heat is transferred. This is
complex, since there is the outside environment through which heat is transferred, there are
the vessel walls, through which heat is transferred, and then there is the stock within the
vessel through which heat is also transferred.
Ultimately, it is all about the stock in the vessel. Each individual item has a preferential
temperature at which it is best to be stored: Milk requires a different temperature from frozen
meat, while a pizza heading towards an excited ‘footy’ fan has an entirely different ideal
temperature altogether. All of these are outside the control of the manufacturer of the vessel
(who cannot dictate to the consumer how to use the vessel), and therefore beyond the scope
of this project (other than the ratings guiding manufacturers to improve their designs for
better ratings).
What is within the scope of this project is the temperature change across the vessel walls,
within the limitations of simply observing and reporting on the changes. Current industry
testing tends to use ice, mimicking the most common current practice of the consumer.
However, this may not be conducive to carrying out an accurate, repeatable, universal testing
methodology. Testing needs to be objective, repeatable and universal, if it is to be acceptable,
therefore the methodology must remove any subjective criteria which create ‘noise’6 in the
testing regimen. Furthermore, testing should be quick and cheap in order to gain industry
acceptance. No manufacturer is going to go through the arduous process of some horribly
convoluted, expensive, uncertain testing regimen which then fails to instil any confidence in
their customer base, therefore this analysis must aim to achieve a fast and cost-effective
system which is accepted primarily by the consumer and then, by consequence, by the
manufacturer.
If one looks at the contents of any insulated vessel there will always be a minimum amount of
air in the mix, with the exception of a vessel with a convex internal lid profile which is filled
to the brim with a liquid on a perfectly flat surface (with respect to gravity, where a liquid is
concerned). Therefore, any fully conclusive scientific analysis of a vessel with a variety of
stock must consider the properties of each constituent, which includes the air in between
6 In recording terms, noise is defined as ‘unwanted sound’ as opposed to the sounds being recorded. In this
case, the ‘noise’ is any deviation from an accurate result due to extra variables which are not necessary.

22
everything. Effectively, the air makes up the balance of the volume regardless of the contents,
and therefore must always be part of any heat transfer consideration, whether simply through
the walls – as in this project – or within the confined space (as every keen camper or fisher
may want to discover in order to prolong their pleasure).
Looking at air as a testing medium, one can quickly find some simple comparisons with the
ice/water combination. Firstly, air holds far less heat than water; whether the water is liquid
or solid: This means that the temperature change will be faster in air. Secondly, in the
temperature range that most consumers are likely to use there insulated vessels, the ice/water
combination will go through a phase change: This means that during that phase change there
will be no change in temperature, and is the key attraction to modern phase change materials
(PCMs) designed to change phase at a particular desired temperature. This is a good thing for
the consumer; however it adds time to any test for the testing laboratory. The test is not meant
to replicate applications in real life, but to provide an idea of efficiency for any application in
real life: This can be done with a test which is different from real life situations, but provides
the understanding required for interpretation and application to a real life scenario (which
will be interpreted differently for each consumer – this is the crux of this project; to develop a
universal testing regimen which can be interpreted by all users to their own benefit!).
If the temperature change of air is faster than that of an ice/water mixture then the results
must happen faster, which leads to a cheaper testing process in the laboratory. Equally, if
there is no phase change in the testing process, then the heat transfer is truly a function of
temperature differential at any value, making all tests comparable, regardless of the
temperature range or the contents or PCMs used, effectively isolating such variables from an
objective universal and repeatable testing regimen.
Given that the volume of a vessel has already been identified as an issue for comparing the
performance of vessels, the use of air as a heat sink reduces the variance from one sized
vessel to another, leading to more controlled testing times regardless of product size.

23
3.4. Testing Processes
Traditionally, there are two main approaches that can be employed in any research project of
this nature. Firstly, there is always some form of mathematical analysis, starting from simple
sums and calculations to complex numerical modelling approaches employing such concepts
as Finite Difference Method (FDM), Finite Element Method (FEM) – also known as Finite
Element Analysis (FEA) – or Boundary Element Method (BEM), as examples. All of which
have their strengths and weaknesses, depending on what needs to be achieved. Similarly,
there is also the experimental approach, which can range from a simple laboratory
confirmation of the numerical analysis, to more complex empirical processes, in the field,
which actually drive the scientific and engineering understanding of the nature of life on earth
which surrounds us. Both of these processes are discussed below.
3.4.1. Mathematical Analysis
Mathematical analysis involves making calculations that predict a desired outcome. If done
correctly, this may also identify errors, anomalies and even derivations from our current
understanding.
Given the complex shapes and the variety of materials of insulated vessels, one could easily
start to think that some incredibly complex software program would be required to carry out a
viable analysis of these products, involving one of the numerical methods listed above. This
might be of interest to a manufacturer who wants to know exactly where in their product the
heat is passing through so that they can improve the design, but for the intent of this project
such complex analysis is not necessary. Counter-intuitive to this initial thinking, the best
option is to simply carry out some quick sums in any simple software, such as Microsoft
Excel (or similar open software program) or even with a calculator and a notepad.
Since this analysis is about developing a real testing process that will be carried out in
laboratories, then the focus should be on experimental testing. This shifts the focus away
from the mathematical analysis, which can be used simply to provide direction and any
necessary order of grandeur for setting up the experimental testing process.

24
Such a mathematical analysis process has been developed in MS7 Excel, which is expanded
upon in Section 4 below.
3.4.2. Experimental Testing
Experimental testing involves actual replication of a real-life situation, or at least a simulation
which is as close as possible to the real situation. Again, if done correctly, may identify
errors, anomalies and even derivations from our current understanding.
Herein lies the most important part of this whole project. The point of this research is to
develop a testing methodology which can be replicated anywhere at any time by any
accredited organisation, so it makes sense to carry out such a testing regimen as part of the
experimental testing for this project. The purpose of carrying out experimental testing is to
determine whether such a testing regimen actually works or not. The aim, here, is to
determine exactly what such an effective testing process is.
Testing for the thermal performance of raw materials (either individually or in composition)
already exists. A common test is the hot plate test, which is a simpler version of the guarded
hot box test used in the construction industry for determining R-values of building fabric
constructions (Sugo, Page & Inglis 2007a). Such testing consists of placing a sheet of the
material in question between two environments of dissimilar temperature and measuring the
heat exchange across the material. This is acceptable for any homogeneous material that is
effectively 1-dimensional (1D), meaning that the heat transfer is in one direction through its
thickness and the area does not impose any impact on the result, since the output will be
measured in W/m2-K.
This is not initially a suitable option for a vessel which is intrinsically a 3D object, through
which heat will transfer in all 3 dimensions, and has non uniform thickness or density
throughout its surfaces: i.e. we are looking at heat transfer in or out of the object, not just
through a sample of the walls of the vessel in isolation, and we are also looking at that heat
transfer through variable thicknesses, densities and materials (as these vessels are often made
of more than one material in their construction), rather than a homogeneous thickness of one
7 MS stands for Microsoft: The manufacturer of the Excel spreadsheet program.

25
individual material or a consistent composition of materials. However, with a little lateral
thinking this testing methodology can be adapted to achieve a similar outcome in a 3D
application.
The guarded hot box tests require two chambers from which the heat is transferred through
the medium in real time, with the chambers butted up to each other. If we look at the
possibility of storing the heat in the medium, momentarily, and transferring it from one
chamber to the other (the chambers may not be butted up together, to avoid excessive
insulation between them, but should be in close proximity to each other to reduce the transfer
time to a minimum), then the same assessment could be achieved. Effectively, the proposed
testing regimen in this analysis is a 3D equivalent of the hot box test, and it is not too
dissimilar from the testing carried out by ISTA and WHO (as outlined earlier).
In brief, this project attempts to determine whether it is possible to create a universal rating
system for all insulated vessels with this one simple test.
The test involves the use of two chambers at dissimilar (but stable) temperatures. A test
specimen is placed in one chamber and allowed to equalise its internal temperature with the
chamber (this can be accelerated with the vessel open). At this time, the specimen should be
transferred swiftly to the other chamber, preferably via an intermediary space with thermal
properties lying between those of both chambers (i.e. the temperature, relative humidity or air
pressure are not outliers for the test, but are all between the high and low equivalents in each
chamber) to mitigate any ‘noise’ in the data such that the transfer happens faster than any
heat exchange could happen across the vessel wall.
The test should then be repeated in reverse order as a double check and to determine whether
there is any difference between heat ingress and heat egress as a function of the design (such
as a weakness in the lid/body interface) because heat in a natural convective flow tends to
move upwards, although in many cases this may not be a detrimental issue (however cooler
bags with zippers at the top may prove to need this double test, as an example).
Any such test requires sensors to measure the required properties (such as temperature).
These sensors must be beyond reproach; therefore a calibration regimen is intrinsic with any
such testing regimen. To obtain accurate results, it is best to avoid opening the vessels during
testing (once closed after the initial acceleration of reaching steady-state at the beginning of
the testing process), which is a departure from the testing procedures in the current domestic

26
industry, but in line with the current commercial industry. Although not analogous to how the
consumer uses the product, it avoids further ‘noise’ in the data collection.
The primary sensors required are temperature sensors. These are ideally cordless and capable
of transmitting feedback to a computer which can track real-time changes for more accurate
results in this analysis, for determining the best commercially viable test regimen for this
industry.
Equally, relative humidity (RH), φ, and atmospheric pressure (ATM) should also be
controlled. If the RH in one chamber is vastly different from the other, then the water vapour
present in one chamber will impact the heat transfer one way or the other, depending on the
chamber in which it is present. Equally, if the air pressure is different from one chamber to
the other (due to different fan pressures), then again the results could be skewed. Either of
these possibilities is far less likely than the difference between one test (on one product in one
laboratory at one time of year) compared with another test (of another product in another
laboratory at another time of year), especially where altitude is involved. This is where the
importance of universal testing comes to light.
To a lesser degree, but still important, is the need to ensure that the chambers operate at
consistent temperatures, RH and ATM. This is attested in the hot box testing protocol which
requires an internal control box and an outer supply box8, although in this particular testing
methodology the stability of these parameters is less critical. This can be mitigated by the use
of chambers with modern HVAC systems which operate with VSD (variable speed drive)
mechanisms and inverter technology to reduce hysteresis for small variations in the identified
parameters.
A final consideration, only within the context of this project, is the age of any specimen used
for the experimental tests. The ideal would be to use brand new products, however if any
specimen is used that has been in service, there is a possibility that damage or degradation
may reduce its performance and skew the results. This however should not be an issue for
this project, as the aim here is not to test every current product and rate them all, but to
8 It is left to the reader to find the freely available information on the internet regarding the basic
understanding of the hot box test, although it is demonstrated in the UoN paper cited herein Sugo, H, Page, A
& Inglis, C 2007b, 'Thermal performance studies at the University of Newcastle', in Solar 07: proceedings of
theSolar 07 ANZSES, Alice Springs, Australia. Images of the apparatus have been provided in the appendices for
a quick visual understanding for the reader.
27
establish a possible testing & rating methodology, therefore any sample that has seen service
will not be representative of that product, but simply an example for this analysis.
3.5. Testing Procedure
In order to be certain of the best testing procedure, there must be a discussion of the variables
that can be measured. Given that the materials, shape and size are all determined by the
manufacturer, the remaining variables are the ratio of volume to surface area (V:As), the
temperature differential (ΔT)and the time elapsed (Δt).
3.5.1. Volume & Surface Area
Thermal energy is a function of both the volume of a vessel and its surface area. The volume
can store only so much thermal energy, based on the thermal properties of its stock (air,
water/ice, food, etc.) while the volume boundary can transfer that quantity of thermal energy,
but only at a rate determined by the thermal properties of the material in question. Therefore,
the stored thermal energy of the volume governs the timeframe of the heat transfer, as a
function of the temperature differential, ΔT and the heat transfer coefficient, k/L (hcond), and
the surface area of the volume.
Volume and surface area are related in some geometric shapes. In such cases, surface area is
the derivative of the volume with respect to their shared characteristic length. For example, a
sphere has a volume,
- =4
3012
Equation 3.7
and a surface area,
= 401�.
Equation 3.8

28
Differentiating the volume with respect to the radius gives
)-
)1= 3 ×
4
301�
Equation 3.9
reducing to
)-
)1= 401�
Equation 3.10
which is the surface area. Similarly, a cube, with a side, s, and a half-side, a, has a volume
- = 32 = �25�2 = 852
Equation 3.11
and a surface area
= 6�25�� = 245�.
Equation 3.12
Differentiating the volume with respect to the half side, a, gives
)-
)1= 3 × 85�
Equation 3.13
reducing to
)-
)1= 245�
Equation 3.14

29
which is the surface area, again. Likewise, the same could be done with an open cylinder of
length, l, as
- = 01�7
Equation 3.15
And
= 2017.
Equation 3.16
However this relationship is only valid for certain shapes. If one tried the same with an
enclosed (or solid) cylinder, for example, the two end circles must be added which would
change the relationship.
However a more important relationship exists between volume and surface area. There is a
ratio between them which is different for different shapes. It is well known that a sphere has
the smallest surface area for a unit volume, while a cube will have a smaller surface area than
a cuboid of the same volume. Therefore, applying this to the shape of our insulated vessels, it
would be best to have a spherical shape, but this would be impractical. Coolers tend to be of
cuboidal shape; even cooler bags are inclined to be cuboidal rather than cubic, cylindrical or
spherical. This obviously will impact the thermal efficiency of the vessel.
More important than the impact of the shape is the impact of the size. If the characteristic
length, r, of the sphere above is doubled the volume would then be 8 times larger (23) but the
surface area would only be 4 times larger (22). Therefore the ratio of the volume to the
surface area gets larger as the size increases, which means the quantity of heat stored
increases more than the surface area through which it can pass. This unfairly favours larger
vessels while smaller vessels suffer greater heat loss or gain.
Initially one might be tempted to develop a test that compensates for this so that regardless of
shape and size all vessels are rated on their own merits. This would be true if one wanted to
rate vessels on some other metric, however this is actually counter-intuitive to the whole aim
of this testing & rating system development. For example, if the ratio of V:As were taken into
account, then smaller vessels would appear to perform better than reality while larger vessels

30
would appear to perform worse. This would favour the manufacturers of smaller vessels but it
would actually give the consumer a false belief that a smaller vessel actually performs like a
larger one when this is not true. This would only lead to eventual lack of confidence in the
system, therefore such an approach must be quite intentionally avoided in order to provide
consumers with an understanding that larger vessels tend to perform better than smaller ones.
The manufacturers are then left to find the balance between providing the thermal
performance demanded by the consumer and the practicality of size and shape also
demanded. This may ultimately prove to drive manufacturers to tweak the ratio of the
dimensions of the shape to improve performance rather than to just increase size, although it
may also ultimately drive consumers to purchase larger vessels as they will provide better
performance for the money spent.
That said, the effects of volume impacting on performance can be offset by the manufacturers
by adjusting the vessel wall thickness to compensate, which would have to be done as a
function of the penalty of product mass and physical footprint for the effective storage
capacity, something which was rated by Boating Magazine in their assessment of various
products (Vance 2013).
3.5.2. Temperature Versus Time
After all is said and done (and this project has attempted to do just that), there are just 2
parameters that can be considered for a meaningful assessment of the thermal performance of
insulated vessels: These are the internal temperature change, as a result of heat transfer across
the vessel walls, and the timeframe over which this happens; These are known as ΔT, and Δt,
respectively.
Since these are the only parameters left, it is mathematically clear to pick either one
arbitrarily and carry out a test. However if there is a very large insulated vessel with an
incredibly resistant construction it may take a very long time to achieve a rating for a set
temperature differential, if time is the variable, which would make for an inefficient, albeit
accurate assessment: After all, ‘time is money’ as they say.
On the other hand, if the timeframe is fixed and there should be a very small vessel with a
very poor insulating material, the result may be achieved so quickly that accuracy would be
31
questioned. This is far less likely than the first scenario for obvious commercial reasons (poor
products create poor sales), however poor products exist in all industries, so such an outcome
should not be considered impossible.
It now becomes important to consider mathematical analysis. The results achieved
analytically will greatly determine whether temperature or time should be the variable.
Section 4 below expands on this as the core of this analysis is developed.
3.6. Rating Procedure
Testing is of little use unless the results are used in some way. In this case, the results of any
test are used to compare with other results of other tests, which is the tool for rating each
vessel. This is the process of rating the tested specimens.
3.6.1. Human Interpretation
Each different person has their own views in life, and this will influence everything one does.
Each person developing a testing & rating system will be influenced by their world view as to
what makes a good test. This can be seen in the variety of tests that already exist, and it is the
reason why this particular analysis is looking to develop a system that is as objective as
possible in order to remove such differences.
Equally, each person selecting a rated product will interpret the testing & rating system based
on their world views. This is actually useful in this analysis since the results are as objective
as possible: It leaves the consumer with the freedom to have their own perspective of what
the results mean to them, as opposed to what they might mean to the next person.
3.6.2. Shifting the Interpretative Function
The analysis in this report looks to shift the interpretive function from the manufacturer to the
consumer. The manufacturers cannot possible know how every single potential customer will

32
view their products, and should not be expected to do so, and should not attempt it as it has
more chance of failure than success. Consumers, however, know how they think and are not
concerned about other consumers’ needs or views, as they are not needed in making an
appropriate selection for their own needs.
By having a universal, objective, transparent and repeatable testing & rating system, the
manufacturer no longer has to make any assumptions about how the product will be used in
order to determine how best to test its thermal efficiency. At the same time, with a simple
result labelled on every product on display, the consumer can easily compare one product
from another, even if they don’t yet understand what that means for them.
Very soon after the introduction of such a system, consumers will come to understand what
ratings suit their needs, in much the same way that consumers also interpret the ratings of
white goods or passenger vehicles to suit their own needs.
3.6.3. Rating System Options
The key to making this system work is to ensure that the rating is user-friendly. If the results
provided are too complicated they will cause confusion and disinterest. If they are too
simplistic, they may not allow consumers to perceive full value, and this will cause
frustration and disinterest. For example, a rating that uses complex terms that only scientists
would know will not work, equally rating products as “Good” or “Bad” or “Excellent” will
not work either.
3.6.3.1. Rating Metrics
Possible metrics for the rating system include representative integers, percentages, absolute
values, and asymptotic or parabolic curves. Each will be considered for their strengths and
weaknesses.
But what should be the basis of this rating? Perfection? Existing practice (aka ‘Business as
usual’)? The risk with using perfection is that it is unachievable, and it is possible that the
results will always appear very small which could fail to generate consumer confidence. The

33
risk with comparing with existing practice is that, with large improvements during major
uptake of the system by the industry, the results could start to get cramped around 1 ultimate
value leaving nowhere for the ratings to go in the future. This would then force the system to
either be extended (like NABERS9) or have values reassigned (like Green Star10) in order to
continue. Extending the results would make past ratings look bad by comparison, while
reassigning values would keep an understanding of the ‘value’ of any given rating throughout
time.
3.6.3.1.1. Representative Integers
There are already rating systems on the market that use this type of metric. Star ratings are
the most common. These consist of assigning a value from the results to be worth one star.
These can either by linear or non-linear: i.e. 2 stars are just twice one star, or the value of 2
stars might be the square of the 1 star value, or another value defined as appropriate for that
rating system.
Given that stars are so common, it might be better to find another symbol for this rating
system, such as snowflakes or ice cubes for coolers, and flames or hot coals for pizza
pouches.
3.6.3.1.2. Percentages
Percentages are also common for rating things. By its very nature, a percentage rating is a
comparison with something else. This could either be an absolute rating where everything
rated is compared with the same initial value, or a relative rating where they are all compared
against each other.
9 The National Australian Built Environment Rating System is an environmental rating system for the built
environment, administered by the federal Department of Industry, Innovation and Science. 10
Green Star is an environmental rating system for the built environment, administered by the Green Building
Council of Australia.

34
3.6.3.1.3. Absolute Values
Absolute values are simply the results from the testing, left un-interpreted. As the testing
process involves a volume of air going through a temperature differential over a timeframe,
the key parameters which could be used are the heat in the volume of air at the start and
finish temperatures, the temperature range and the time taken. There are also secondary
values to consider such as the heat transfer coefficient of the vessel material, the thermal
conductance of the vessel walls and the thermal conductivity of the volume of air.
These could be used to look at the heat flow or the resistance to heat flow. This is the case for
R-values used for construction materials in the building industry (BCA11). Generally
materials that allow much of the heat to pass are rated by their conductive properties (such as
the U-value for glass), while materials that block much of the heat are rated by their resistive
properties. Some possible absolute values include:
• Heat transfer coefficient, k/L, aka U-value (W/m2-K)
• Thermal conductivity, k (W/m-K)
• Thermal conductance, K (W/K), which equates to the U-value times the surface area
• K/s-m3 (temperature change per unit time per unit volume)
• K/s-m2 (temperature change per unit time per unit surface area)
• K/s (ignoring size and shape)
3.6.3.1.4. Asymptotic and Parabolic Curves
Curves are good visual cues for any observer with limited understanding of the science in
question, however they are limited to when values are broad and are in the main part of the
curve; any values at the ends don’t appear as contrasting, one from another, as those in the
middle of the curve.
Asymptotic curves are useful when showing that something is reducing to a limit of zero,
while parabolic curves are useful when showing that something is approaching infinity.
However, there are risks with both of these for the purposes of rating insulated vessels.
11
The Building Code of Australia is part of the National Construction Code (NCC), administered by the
Australian Building Codes Board.

35
Asymptotic curves risk making poor results seem better than they are, while excellent results
may not seem to stand out as much, while parabolic curves could make poor results seem
much worse than they are, while excellent results may seem to look much better than they
really are. This means that manufacturers of products that are at either end of the spectrum
may not be as willing to use the system; either way this makes for a poor uptake in industry
which can only reduce the consumer’s experience.
3.7. Sustainability
The very nature of this project is sustainable. This is two-fold. Firstly, this project does not
aim to produce a product which can destroy the environment. Secondly, this project aims to
improve the sustainability of future products in the insulated container market.
The development of a testing & rating system leads to better user selection, which leads to
less waste that ends up in landfill. As a flow-on effect, this leads to better quality products,
which will also lead to less waste from manufacturers.
From a global/local aspect, the ratings will allow consumers in different locales to choose
only those products that meet their needs, reducing the wasted stock that is shipped around
the world where it’s not of use (including the embodied energy to ship that stock pointlessly).
Industry is normally happy with the status quo; however this testing & rating system will
empower the consumers to expect more from the manufacturers, which in turn will improve
outcomes and reduce waste and destruction of our valuable resources.
The outcome of this project stands to benefit manufacturers, retailers and consumers alike.

36
4. Analysis (Results)
This section provides the results from the mathematical and experimental testing processes
which have been carried out for this project.
4.1. Mathematical Results from MS Excel
The following simple calculations were performed in Microsoft Excel in order to confirm the
rationale for this testing & rating system, as well as to provide some key inputs for the
experimental testing.
4.1.1. Air/Water Comparison
Firstly, calculations were made to look at how air compares with water. Since most other
tests involve a combination of water and ice, it is important to look at the energy in both
states.
The specific heat values provide an understanding of the difference between both. From
Table 28 of Appendix 2 from Principles of Heat Transfer (Kreith, Manglik & Bohn 2010),
the specific heat at constant pressure, cp, for air at 0°C is 1.011 kJ/kg-K, while from Table A-
3 from Thermodynamics: An Engineering Approach (Cengel & Boles 2007), the equivalent
for water at the same temperature is 4.22 kJ/kg-K.
However these values are for the mass of each substance and this project is centred on a
volumetric analysis, therefore these values need to be multiplied by their respective densities
at the same temperature in order to compare the specific heat by volume. Again from the
respective tables cited in the previous paragraph, the density of air at 0°C is 1.252 kg/m3 and
the equivalent for water is 1000 kg/m3. Immediately, it can be seen that there is a vast
difference between the two. Multiplying these values provides the following enlightening
results, which shed some light on the difference in energy between air and water:

37
8 × 9:�;<�@>?� = 1.252 '@ �2⁄ × 1.011 'A '@ − �⁄ = 1.2658 'A �2 − �⁄
Equation 4.1
8 × 9:�B�(C�@>?� = 1000 '@ �2⁄ × 4.22 'A '@ − �⁄ = 4,220 'A �2 − �⁄
Equation 4.2
One can see immediately that a 1°C change in temperature would require far more energy for
water than for air. In fact dividing one by the other shows a difference of over 3,300 times the
energy required for water than for air.
Now this is only looking at water as a liquid. In order for the ice to melt it must take on even
more heat just to change state. This is the latent heat of fusion, hif, which is measured in kJ/kg
and happens at 0°C. From Table A-3 (Cengel & Boles 2007) again, the latent heat of fusion
of water is 333.7kJ/kg. Converting again to a volumetric value achieves the following result:
8 × ℎ<&�B�(C�@>?� = 1000 '@ �2⁄ × 333.7 'A '@⁄ = 333,700 'A �2⁄
Equation 4.3
Immediately, one can see that this is a vastly larger energy requirement. In fact, if the two
values for ice/water are compared by dividing one by the other, it can be shown that the water
could change temperature by nearly 80°C with the same energy as it takes to change state, as
shown here:
333,700 'A �2⁄ ÷ 4,220 'A �2 − �⁄ = 79.076�
Equation 4.4
This not only means that the water could nearly boil for the same energy; it also implies that
any testing regimen using ice melting is going to be a very long test. This explains why the
current tests are rated in number of days: Because that is how long the tests are taking (S
Elliott 2015, pers.comm., 31 May).

38
4.1.2. Shape Impacts
As discussed in 3.5.1 above, the shape has a significant impact with respect to the ratio of the
volume to the surface area. Table 4.1, below, demonstrates this more clearly for a sphere, a
cube and a cuboid (for which one side is twice the length of the other two).
Table 4.1 – Volume to Surface Area Ratio w.r.t. Shape
Shape Volume Surface Area Comparison
Sphere 1.00m3 4.84m2 100%
Cube 1.00m3 6m2 124% of sphere
Cuboid 1.00m3 6.30m2
130% of sphere
105% of cube
Needless to say, this can become more accentuated depending on the shape used for the
vessel. Given that some ice boxes for fishing can be very long compared with their depth and
height, the surface area could be much greater than those shown above.
4.1.3. Size Impacts
Also discussed in 3.5.1 above, the size has a considerable impact as well. Table 4.2, below
shows how the surface area of a sphere does not increase at the same rate as the volume (the
proportions can be demonstrated to be the same for the cube – r=1m – and the cuboid –
r=0.794m).

39
Table 4.2 – Volume to Surface Area Ratio w.r.t. Size
Characteristic Radius, r
(0.620m) Volume
Surface
Area Comparison
1r 1.00m3 4.84m2 None
2r 8.00m3 19.3m2
8V
4AS
4r 64.00m3 77.4m2
64V
16AS
6r 216.00m3 174m2
216V
36AS
This clearly shows that larger vessels can store far more heat whilst not having the same
proportion of surface area through which the heat can transfer, making larger vessels
intrinsically more efficient. Manufacturers can compensate this in smaller vessels by using
thicker vessel walls; however the weight gain for the effective storage volume would
compromise the products appeal and would remain a marketing dilemma for the
manufacturers.
4.1.4. Total Internal Energy
The key piece of information for this test is the quantity of heat energy that the air in a vessel
can hold. This is the total internal energy, U. To find U requires finding the specific internal
energy, u, for a unit volume and then multiplying that by the volume of a given vessel to
determine its total internal energy.
To do this there must be some initial calculations performed using the specific heat of air, dry
air to be exact, and the temperatures being considered. Firstly, it can be safely assumed that
air in the temperature range of interest for this project can be taken to be an ideal gas,

40
therefore it obeys the Ideal Gas Equation of State, as given by Equation 3-10 in
Thermodynamics: An Engineering Approach (Cengel & Boles 2007):
G- = ,�
Equation 4.5
From the same text (Cengel & Boles 2007), Equation 4-23 shows that:
)H = 9I���)�
Equation 4.6
du being the change in internal energy, cv(T) being the specific heat at constant volume with
respect to temperature, and dT being the change in temperature. This means that the change
in internal energy is the result of the specific heat at constant volume with respect to
temperature multiplied by the change in temperature in the process.
Earlier calculations, in 4.1.1 above, worked with cp, the specific heat at constant pressure, as
it was comparing air and water in general terms where using constant pressure for the
purposes of comparison is acceptable, and values for both were more easily available.
However, since this project is specifically working with closed vessels with constant volume,
cv is required because the pressure theoretically can increase or decrease with temperature
change since the volume of air does not change, and therefore cp would not be valid.
So Equation 4.6, above, can be used to establish the change in internal energy for the
temperature range being used for the tests. However the use of values for cv would create a
level of accuracy which would seem absurd for the process, given that the tests themselves
will always have margins of error in the temperature settings and the time recordings which
would create results that need not rely on a very accurate value for U. Furthermore, it has
been observed during the research for this project that tables in different sources have
differing values one from another, suggesting that values in tables are often approximations,
which is understandable given the empirical practices used to develop those tables.
A better rationale would be to use values for u which are provided in such tables as this
simplifies the process and ensures fewer errors throughout the process. Of greater importance
than the values selected is the use of the same values by all testing facilities. Therefore the

41
selection of a specific value for the internal energy of air should be confined to within the
protocol which would define any commercial testing procedures, such as Australian or
International Standards.
Table A-17 in Thermodynamics: An Engineering Approach (Cengel & Boles 2007) provides
u values for a range of temperatures of air as an ideal gas. These values are used to
interpolate for the chosen temperature values for this project, which will be discussed below.
4.1.5. Temperature Selection
Another key decision to be taken for this project is the selection of an appropriate
temperature range and what the best upper and lower values should be. The temperatures
chosen have been based on the properties of air and water vapour in the air, and the
temperatures which various cooler vessel materials can handle, as well as the equipment
available.
The lower temperature is the most important due to the ever present water vapour in air. As
has been shown earlier, water requires enormous quantities of heat to change state; therefore
it is best to avoid this change of state for simplicity and assurance of conformity for all tests.
As a result of this rationale the lower temperature has been set at 5°C.
The upper temperature is more arbitrary, but also important. The key determining factor in
the selection of the upper temperature for this project was the accuracy of the loggers used in
the experimental tests. The loggers supplied by USQ have an accuracy of 0.5°C. By selecting
a temperature range of 50°C, the tests would effectively have an accuracy of ±1%, which is
appropriate for this project, given the discussion above regarding the accuracy of values in
available tables. Therefore the upper temperature has been set at55°C.
Both these temperatures are appropriate for most vessels on the market, given that they tend
to hold frozen goods (especially ice) and are often subjected to greater temperatures during
use (such as the cabin of a closed-up vehicle in the sun in summer).

42
4.1.6. Specific Internal Energy
Having now defined the temperature range, ΔT, and more particularly, the upper and lower
temperature values, values for u, from Table A-17(Cengel & Boles 2007), can now be used to
find the specific internal heat. This was carried out in MS Excel, in a process which required
interpolating values from the table. As the table values are in Kelvin, and the temperatures
defined above are in °C, it is necessary to convert the target temperatures to Kelvin in order
to interpolate. Table 4.3, below, shows the extracts from Table A-17 followed by the
interpolated values. The values of interest are the bold values in the last column, which are
the internal specific energy at both temperatures.
Table 4.3 – Interpolation for Specific Internal Energy
Sourced Values Interpolation
Temperature
(K)
u
(kJ/kg)
Temperature
(°C)
Temperature
(K)
u
(kJ/kg)
270 192.60
5°C 278.15 198.427
280 199.75
325 232.02
55°C 328.15 234.282
330 235.61
These values, however, are not yet usable, as the testing process in this analysis is using a
volumetric approach, therefore these values must also be multiplied by the densities of air at
both temperatures to find the volumetric internal energy for this temperature range. Table 28
in Principles of Heat Transfer (Kreith, Manglik & Bohn 2010) provides density values, ρ, for
air which can be used to interpolate once again to find the necessary densities for the upper

43
and lower temperatures used for this testing process. These are shown in Table 4.4 below
(again the values of interest are in bold font in the last column).
Table 4.4 – Interpolation for Density
Sourced Values Interpolation
Temperature
(°C)
ρ
(kg/m3)
Temperature
(°C)
ρ
(kg/m3)
0 1.252
5°C 1.230
20 1.164
40 1.092
55°C 1.042
60 1.025
Now, from the calculated values for u and ρ, the volumetric specific internal energy can be
computed, from which the internal energy of any vessel can be determined.
H�55?� × 8�55?� = 234.282 'A '@⁄ × 1.042 '@ �2⁄ = 244.1218 'A �2⁄
Equation 4.7
H�5?� × 8�5?� = 198.427 'A '@⁄ × 1.230 '@ �2⁄ = 244.0652 'A �2⁄
Equation 4.8
Equation 4.7 and Equation 4.8, above, can now be used to find the difference which is the
volumetric specific internal energy.

44
244.1218 'A �2⁄ − 244.0652 'A �2⁄ = 0.056634 'A �2⁄ = 56.6 A �2⁄
Equation 4.9
This value is very small. This is due to the change in density of air, which is quite significant.
This has been used because it cannot be assumed that a vessel would be pressurised to
maintain its density, and therefore its original mass of air. If that were the case then the
following results would occur:
H�55?� × 8�55?� = 234.282 'A '@⁄ × 1.230 '@ �2⁄ = 288.1669 'A �2⁄
Equation 4.10
288.1669 'A �2⁄ − 244.0652 'A �2⁄ = 44.10165 'A �2⁄
Equation 4.11
This immediately shows the importance of sealing where air is concerned. With some
commercially available coolers, there is sufficient sealing to inhibit air ingress and egress to
the point that there would be some pressurisation (or vacuum), especially for those models
with retaining clasps, however this cannot be assumed for cheaper models on the market
which would be subjected to significant air leakage. The reality is that further analysis would
be required to define assumptions in a standard for applying to all vessels, where the internal
pressure is concerned, but these figures are sufficient for the purpose of demonstrating that
this testing procedure is viable.
4.1.7. Material Impacts
At this point, there is room for a brief observation of the impacts of materials on how the heat
would pass through the vessel walls. This is more of interest to designers; however such an
understanding can also assist testers to anticipate test run times for different products.
Since the size and shape are predetermined by the design of the vessel, and the temperature
range has been set within this project, there is just the thermal conductivity, k, left to consider
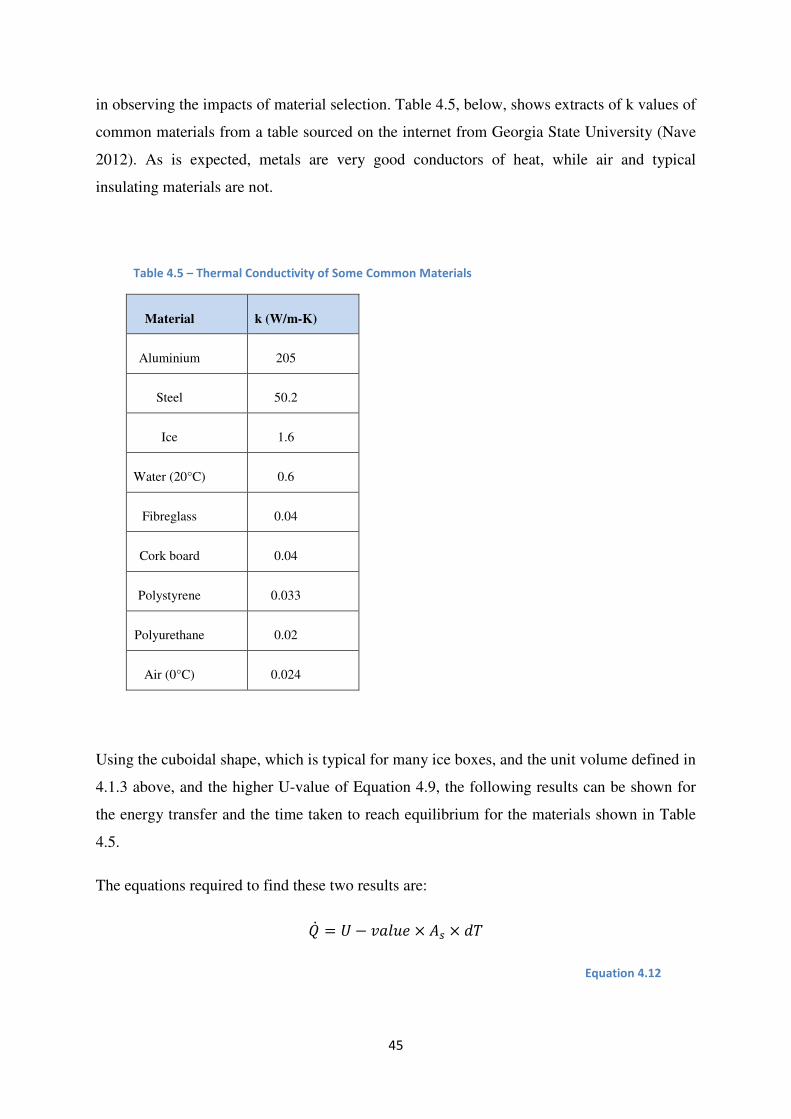
45
in observing the impacts of material selection. Table 4.5, below, shows extracts of k values of
common materials from a table sourced on the internet from Georgia State University (Nave
2012). As is expected, metals are very good conductors of heat, while air and typical
insulating materials are not.
Table 4.5 – Thermal Conductivity of Some Common Materials
Material k (W/m-K)
Aluminium 205
Steel 50.2
Ice 1.6
Water (20°C) 0.6
Fibreglass 0.04
Cork board 0.04
Polystyrene 0.033
Polyurethane 0.02
Air (0°C) 0.024
Using the cuboidal shape, which is typical for many ice boxes, and the unit volume defined in
4.1.3 above, and the higher U-value of Equation 4.9, the following results can be shown for
the energy transfer and the time taken to reach equilibrium for the materials shown in Table
4.5.
The equations required to find these two results are:
�� = J− K57HL × × )�
Equation 4.12

46
M =J
��
Equation 4.13
where �� is the heat transfer rate in Watts (J/s), the U-value is the heat transfer coefficient (in
W/m2-K), As is the surface area of the vessel (in m2), dT is the temperature differential (in K
or °C ), and t is the time (in seconds). Table 4.6, below, shows the results for 3 different
thicknesses of the materials shown (for ease of reading, the energy columns are italicised,
while the time columns are in bold font).
Table 4.6 – Heat Transfer Rates and Timeframes
Material
1mm 25mm 50mm
N�
(W)
t
(sec)
N�
(W)
t
(sec)
N�
(W)
t
(sec)
Aluminium 6.46E+07 6.83E-04 2.58E+06 1.71E-02 1.29E+06 3.41E-02
Steel 1.58E+07 2.79E-03 6.32E+05 6.97E-02 3.16E+05 1.39E-01
Ice 5.04E+05 8.75E-02 2.02E+04 2.19E+00 1.01E+04 4.38E+00
Water
(20°C) 1.89E+05 2.33E-01 7.56E+03 5.83E+00 3.78E+03 1.17E+01
Fibreglass 1.26E+04 3.50E+00 5.04E+02 8.75E+01 2.52E+02 1.75E+02
Cork board 1.26E+04 3.50E+00 5.04E+02 8.75E+01 2.52E+02 1.75E+02
Polystyrene 1.04E+04 4.24E+00 4.16E+02 1.06E+02 2.08E+02 2.12E+02
Polyurethane 6.30E+03 7.00E+00 2.52E+02 1.75E+02 1.26E+02 3.50E+02
Air (0°C) 7.56E+03 5.83E+00 3.02E+02 1.46E+02 1.51E+02 2.92E+02

47
These figures have been shown in scientific notation because some are very large. In
particular the metals show that they can transfer an incredibly large amount of heat for a ΔT
of 50K, while they also show that it takes a very short period of time to transfer the available
heat in the unit volume. Conversely, polystyrene and polyurethane show much smaller heat
transfer quantities and much longer timeframes.
It is important to note that these calculations only reflect the rate of heat transfer once the
material is saturated with heat. This means that the materials have already absorbed enough
heat that they can no longer store any more heat and are therefore passing the heat on one-
for-one as it enters via the higher temperature side and exits via the lower temperature side.
This can be better seen in Section 6-2 of Thermodynamics: An Engineering Approach
(Cengel & Boles 2007) which discusses how thermal sources and thermal sinks work
together. In this case, the atmospheric air surrounding the vessel is the thermal source
providing thermal energy, while the vessel walls are the thermal sink absorbing thermal
energy. As long as the vessel walls can continue to absorb that energy, based on the product
of its mass and its specific heat, there will be no temperature change inside the vessel. This
time taken to absorb sufficient heat to transfer it is known as thermal lag.
Thermal lag is based on the thermal mass of the material as a function of time. Unfortunately,
due to the complexities of determining the thermal lag of different vessels, far more time
would be required in this research project involving the participation of manufacturers to
provide very specific details of their product designs. Even to do so for one product would be
excessive, and would add nothing to the development of this testing & rating system.
However, it is clearly understood within this research that the thermal lag of the materials is a
key part of the success of an insulated vessel, but remains in the domain of the manufacturer
and not the developer of a testing & rating system for such products.
4.2. Experimental Results from USQ Laboratory
The following subsection presents the results of the tests carried out at the USQ laboratory to
determine whether the testing approach is viable or not. All necessary precautions were taken
for safety, including carrying out a risk assessment and completing a USQ induction and

48
obtaining a work permit for the experiments. These documents have been attached in the
appendices.
4.2.1. Sample Specimen Selection
In order to carry out tests in the laboratory, a sample range of vessels was required. For
budgetary reasons, the tester chose to use pre-owned samples. These include a Willow Sixer
cooler, an EvaKool IceMate IM070-W ice box, and an Outdoor Plus cooler bag. These were
selected for their variations in shape, size and material, and are shown in the figures below.
Figure 4.1 – The Willow Sixer cooler (image courtesy of Willow)

49
Figure 4.2 – The EvaKool IceMate ice box (image courtesy of EvaKool)

50
Figure 4.3 – The Outdoor Plus cooler bag
The first two figures have images taken from the respective manufacturer’s websites, while
the third image was taken by the tester as no such product was traceable on the internet. It is
obvious from Figure 4.3 that the cooler bag has been in service for some time. The same is so
for the other two, even though the images do not show it. No specimen showed any evidence
of damage, such as cracks or tears, which might adversely affect the test results.
4.2.2. Laboratory Equipment
In order to carryout experimental tests, a minimum of equipment was needed. The testing
process rationale aimed to keep cost and time to a minimum, in keeping with this project
being an undergraduate task, rather than being a commercially funded R&D process. The
general idea was to place a specimen in a chamber at a steady temperature and wait until it
reached equilibrium, and then transfer it to a chamber of another temperature and wait until it
reached equilibrium again, and then measure the time taken from one steady-state to the
other.

51
The equipment selected for use in the testing process consisted of the following, extracted
from the test plan which is reproduced in the appendices (note that some items were
eventually not used due to the tests not being carried out to plan, or being cancelled due to
circumstances beyond the control of this project):
• Cold room
• Oven
• 3x Data Loggers
• 1x live sensor for tracking when to shift vessels between chambers
• Willow 6-Can vessel
• Evakool Ice Mate vessel
• Outdoor Plus cooler bag
• Sowing thread (for stringing up logger in vessels)
• Sticky tape and blue tack (for attaching thread to vessel)
• Towel (for soaking in hot water for RH test)
• Large plastic bag (for increasing pressure for ATM test)
• Motor for compressing plastic bag
• Barometer to measure ATM inside plastic bag (Terry to determine if this will be possible)
• Atomiser bottle (for spraying inside cold room to create 100% RH)
• “KEEP DOOR CLOSED TO MAINTAIN CONDITIONS – TESTING IN PROGRESS” signs for cold
room and oven doors
• “DON’T RESET TEMPERATURE – TESTING IN PROGRESS” signs for cold room and oven
thermostats (as others may want to adjust them during tests)
• “DON’T TOUCH – TESTING IN PROGRESS” sign for vessel and logger in cold room (as others
may be in the cold room)
The cold room and the oven are the two chambers used for the tests, while the 3 loggers
where used to log information about the chambers and the test specimen in each test. The live
sensor was created by Terry Byrne of the USQ staff for tracking the temperature change in
the closed vessel in either chamber, as the loggers could not provide a live feed for knowing
when steady-state had been reached. This was a two-part piece of equipment which consisted
of a sensor and transmitter, with batteries, housed in a simple shell made with an in-house 3D
printer, and a receiver and display, also with batteries, and also housed in a ‘home-made’
shell. An incredible debt of gratitude is extended to Terry Byrne, without whom none of this
testing would have been possible. This is particularly so, as the live sensor malfunctioned
midway through the first test, and modifications had to be made under intense pressure to
maintain the testing schedule, whilst also adding complexity to the compromised, in-progress
first test due to having to resort to first principles to estimate when steady-state would be
reached so that the test would be a success, and not have to be repeated.

52
The key piece of equipment, apart from the vessels and chambers, was the data logger, which
can be seen in Figure 4.4, below. This is a Lascar EL-USB-2-LCD Temperature and humidity
USB data logger with LCD display (Lascar Electronics 2015), designed to log data for
temperature, relative humidity and dew point. It has a USB connection (visible under the
plastic cover) which allows for fast download of information to any computer. With the right
software from the manufacturer, the data can then be read in a program called EasyLogGraph
(ELG).
Figure 4.4 – The data logger used for testing (image courtesy of Lascar)
One can observe the mention of signs in the list of equipment. These were considered a
necessity given the importance of keeping the chambers at constant temperatures during the
tests in an environment where other staff and students could be accessing the laboratory
environment and perhaps needing to access items from either chamber.
4.2.3. The Test Plan
Testing was carried out to achieve a simple objective: Observe the process of heat ingress and
egress through placing specimens in chambers of different temperature, from which
comparisons about thermal efficiency could be made.
A test plan was developed to maximise the time spend in the laboratory, to be certain of
achieving effective results in a short space of time, and to be sure to remain on task during a
complicated process. The test plan consisted of the list of equipment required (shown above),

53
the personnel required, and the individual tests to be carried out. To be certain of success, a
special trip was made to the USQ campus ahead of the testing schedule to inspect all the on-
site equipment in order to finalise the test plan with greater knowledge of the testing
environment.
Individual tests were developed to investigate separate aspects of the testing process. Each
test consisted of an objective and a task run. The objective was to provide a practical
reminder of the purpose of the tests (of benefit to the USQ staff assisting in the process),
while the task run was provided to ensure that no critical step was missed throughout the
testing process (of most benefit to those carrying out individual tasks).
4.2.3.1. Test 1 –Standard Test
The first test consisted of placing the Willow Sixer in the cold room, followed by the oven,
and then back to the cold room and waiting for the vessel temperature to reach equilibrium
with the chamber temperature each time. There was no regard for the control of relative
humidity (RH) or the air pressure (ATM), as it was already understood that RH values would
be logged to provide information with which to make a comparison in subsequent tests, while
the pressure was assumed to be unchanged throughout the test, based on an assumption of
sufficient air leakage through the lid and body of the vessel. This is considered the standard
test because the focus is on temperature change in both directions regardless of the other
parameters. This test is used as the reference for the remaining tests. The idea behind testing
for heat ingress as well as heat egress was to see if there was a difference in the timeframes to
determine whether there might be other parameters not considered in this project (consider
this an insurance policy against lack of knowledge in a new field).
4.2.3.2. Test 2 – Half Standard Test with Volume Change
This test consisted of placing the EvaKool IceMate in the oven to begin with, and then
transferring it to the cold room, once equilibrium was reached, and then waiting for that
steady-state to occur again. This is only half the standard test, but involved a much larger
vessel (the idea behind the half test was simply to conserve time, as the tester was commuting

54
intercity and was able to leave vessels in a chamber overnight rather than waiting for steady-
state before removal).
The astute observer will also note that the vessel construction is not identical to that in Test 1.
This is true, and unfortunately, a limitation of such modest projects. However, it can be
noted, from the data shown in Table 4.5, above, that insulating materials all have similar k
values, compared with other materials, and since the volume change is far greater than the k
value change in this test, it is still anecdotal of how volume impacts the length of the tests.
(Note that this experimental testing is not intended to establish a yardstick, but to demonstrate
that the process is feasible.)
4.2.3.3. Test 3 – Half Standard Test with RH Change
This test consisted of placing the original specimen, the Willow Sixer, in the oven and then
transferring it to the cold room with the usual steady-state requirements. However, on this
occasion both the oven and the cold room were primed to achieve 100% RH (as best as
practically possible). This was done by soaking a large towel in hot water and placing it in the
oven to raise the RH of the oven, while using a spray bottle to charge the supply air of the
cold room with added water vapour. As the test results came to prove, neither chamber
actually achieved 100% RH, however the Δ%RH was sufficient in both chambers to
demonstrate that RH has a significant impact on the testing regimen.
4.2.3.4. Test 4 – Standard Test with Design & Material Change
This test was a replica of Test 1, only using the soft cooler bag instead. This test was far less
important than the others, and was only an additional ‘what if’ test to see if the zipper
opening at the top of the bag would have a significant impact on the difference between heat
ingress and heat egress, given that hot air rises. It also served to show how different materials
impact the timeframes.

55
Again, the astute observer will note that the vessel construction is not identical to that in Test
1. However, on this occasion, the volumes are similar but the materials are vastly different, so
the test is still anecdotal of how the material impacts the length of the tests.
4.2.3.5. Test 5 – Half Standard Test with ATM Change
Unfortunately, this test never saw the light of day. As can be noted in the full Test Plan in the
appendices, this test was still being developed at the time of starting the laboratory work.
At the time of planning the tests, the intention was to place the Willow Sixer inside a large
plastic bag (of strong material such as see-through weather awnings in alfresco dining areas)
which could be compressed by scrolling the excess material around a rod operated by a
motor, such that the motor could increase or decrease the pressure based on a pressure sensor
inside the bag, all-the-while having the live sensor and the data logger inside the vessel to
track the temperature and RH throughout the test. For simplicity, this test was also intended
to cover just half the process of the standard test.
Alas, the logistics of creating a pressure sensor with remote live access and data logging
capacity proved too difficult for the time and budget constraints of this humble project.
Again, much gratitude is extended to Terry Byrne of the USQ staff for going well beyond the
bounds of dedication to make this test a reality, including endless hours working on complex
coding algorithms to convert sensor outputs to meaningful air pressure values that could be
used in the results.
The intent of this test was to observe whether changes in atmospheric pressure would
significantly impact the test results. This is more important when considering the possibility
of testing laboratories at significantly different altitudes, rather than the effects of pressure
changes between or within the chambers and the test specimens. Although experimental data
is not available on this occasion, it can now be noted (rather than in the theoretical testing
section, where it would be out of context) that density of air changes less with altitude than
with temperature. This is easily observed in most of the reference texts from which tables
have been used for this project. It is also important to note that the affordable technology of
modern HVAC systems in the current market would allow for controlling air pressure,
through the use of VSD fans (variable speed drive), as easily as controlling temperature and

56
relative humidity, therefore this absence in testing has not negatively impacted the outcome
of this project.
4.2.4. Outputs
Having completed the tests, each logger was read to analyse the data obtained. From this
data, an amalgam of information had to be created in order to create meaningful results.
The key information for each test was combined in order to graph the information. For Test 1,
the key information was the temperature of the vessel, the cold room and the oven compared
with each other. This was the same for Test 2, although only for the heat egress. Test 3 was
more complicated as it required both the temperature and RH of all 3 loggers, even though it
was only for the heat egress. Test 4 required the temperature of all 3 loggers for the different
vessel for both heat ingress and egress, while Test 5, which did not happen, would have had a
similar complexity to Test 3, albeit with ATM rather than RH.
In general, the results proved the testing process to be successful, although the outcome was
not a perfect success. As with all new ventures, there are always unexpected issues as well as
failures in particular aspects. This project lived up to that scenario, but still achieved some
valuable insight.
4.2.4.1. ELG Graphs
The following images are of the graphs produced by the ELG software from the data
collected by the loggers for Test 1. These are just an indicative sample, while the whole
collection is presented in the appendices. The key curves to observe are the temperature (red
lines) and the RH (blue lines); while the dew point (green lines) curves are only of interest in
demonstrating how dew point is clearly analogous to temperature, as a function of relative
humidity (the dew point curves are not used in the Excel graphs in the following section).

57
Figure 4.5 – ELG graph of the logger from the vessel for Test 1
Figure 4.6 – ELG graph of the logger from the cold room for Test 1

58
Figure 4.7 – ELG graph of the logger from the oven for Test 1
Two observations can be made from the graphs above. Firstly, and rather unimportantly,
there is a spike in the readings from Logger 2, for the cold room. However this spike
occurred well after the test was complete and therefore did not affect any results. It was due
to old batteries in the logger and did not occur again for the remaining tests once the batteries
were replaced (the same occurred in the same logger during a preliminary home test, which
lead to suspect the batteries, since that logger was the only one to have already been in
service).
The other interesting observation, which will prove to be of note later in this report, is that the
steady-state temperature of the cold room is less even than that of the oven. This is due to the
design of the cycling process of the refrigerant equipment for the cold room compared with
the cycling process of the heating equipment for the oven.

59
4.2.4.2. Excel Graphs
The following images are of the graphs developed in MS Excel in order to view the relevant
information from all 3 loggers for each test. Note that the graphs of the oven temperature
appear to drop markedly after the vessel is transferred to the cold room in each experiment
(including in the ELG graphs). This is because the logger was removed from the oven each
time and the oven switched off to conserve energy, while the logger in the cold room was
placed in the cold room immediately upon commencing each test, because the cold room was
left on constantly and to ensure that the logger was tracking cold room temperature correctly
at whatever time the vessel was transferred into it. (The oven logger was also placed in the
oven at the start of each test to ensure it was ready whenever the transfer happened. It was
only left on in case the oven might be required again during testing.)
Figure 4.8 – Excel temperature graphs of the loggers for Test 1 showing both the heat ingress
and egress processes
0
10
20
30
40
50
60
Vessel
Coldroom
Oven

60
Figure 4.9 – Excel temperature graphs of the loggers for Test 1 showing the heat ingress with
greater clarity
Figure 4.10 – Excel temperature graphs of the loggers for Test 1 showing the heat egress with
greater clarity
0
10
20
30
40
50
60
Vessel
Coldroom
Oven
0
10
20
30
40
50
60
Vessel
Coldroom
Oven

61
One clear observation with the above graphs is that the cold room temperature is less even
than the oven temperature, as noted in 4.2.4.1 above (ignoring the even graph in
Figure 4.10, as it was left running outside the oven until the end of the test). At the time of
commencing the tests, the USQ maintenance staff (in charge of all HVAC equipment on
campus) came and provided instructions on the use of the cold room. They stated that the
cold room would cycle ±1°C, however the loggers suggest that the cold room would chill to
5°C and then slowly reheat to 7°C. This means that the mean temperature was actually 6°C
which leaves the results based on slightly less than the desired ΔT of 50°C. However, this is
not a major setback for the purposes of this project, since the start and finish temperatures are
taken from the loggers and used to provide ‘per Kelvin’ results.
Another observation which can be gleaned from Figure 4.9 and Figure 4.10 is that the steady-
state readings for the vessel and cold room do not appear very steady. Alas, this is a result of
the cold room not cycling efficiently enough to hold a steady temperature. However, this did
not pose too much of a problem, and simply required some additional analysis of the data to
determine a correct start time for the first part of the test. This was achieved by observing the
patterns of the cold room temperature around that point and superimposing the timeframes to
estimate, with relative accuracy, what the start time would have been with a more efficiently
cycling system.
The following graphs are from Test 3, which have the inclusion of RH for the analysis. The
confusion of colour in Figure 4.11 shows the difficulty experienced in achieving 100% RH in
the oven before commencing the test (partly due to the lack of a live RH sensor, meaning that
the oven had to be opened each time to read the RH level on the logger). In particular, the
purple line shows how it struggled to reach a significantly high figure even remotely close to
100%. The obvious dip in the middle of that initial period represents when the wet towel in
the oven was removed for rehydration. The test was eventually started with an oven RH value
of 52.5% while the oven RH in Test 1 was only 6%, therefore there was sufficient difference
to register any change in time to equilibrium. Ironically, the oven reached its maximum RH
value of 56.5% within the first 2 hours, however it could not be determined at the time, and
the vessel walls may not have reached heat saturation at that point, which would have skewed
the accuracy of the data. That said, the more important line is the orange line showing the RH
level in the vessel, which spikes just before the test started, directly as a result of deciding to

62
close the vessel lid in the hopes that the RH value would increase thereafter. That, at least,
was a success.
Figure 4.11 – Excel temperature graphs of the loggers for Test 3 showing the time taken to gain
a maximum RH in the oven and vessel
0
20
40
60
80
100
120
Vessel Celsius(°C)
Vessel Humidity(%rh)
Coldroom Celsius(°C)
Coldroom Humidity(%rh)
Oven Celsius(°C)
Oven Humidity(%rh)

63
Figure 4.12 – Excel temperature graphs of the loggers for Test 3 showing the heat egress with
greater clarity
Two interesting observations come from this result. Firstly, the fact that the oven could not
reach 100% RH leads the analyst to wonder whether the oven was equipped to control RH
and this was never communicated to the USQ staff involved.
The other is that the vessel RH has a downward spiral just after transfer from the oven to the
cold room. One would expect that a sudden drop in temperature would see a sudden rise in
relative humidity, yet this did not occur. Perhaps there was a significant pressurisation in the
vessel that the temperature drop was accompanied by a sudden pressure change which may
have impacted the RH reading until the air leakage allowed equalisation and the opportunity
for the RH to increase again.
4.2.5. Analysis of Experiments
Very large spreadsheets of data were logged by each logger for each test. Although the data
also provided user-friendly graphs for easy visual interpretation, more particular work was
possible by analysing the spreadsheets to determine correct start and finish times and
0
20
40
60
80
100
120
Vessel Celsius(°C)
Vessel Humidity(%rh)
Coldroom Celsius(°C)
Coldroom Humidity(%rh)
Oven Celsius(°C)
Oven Humidity(%rh)
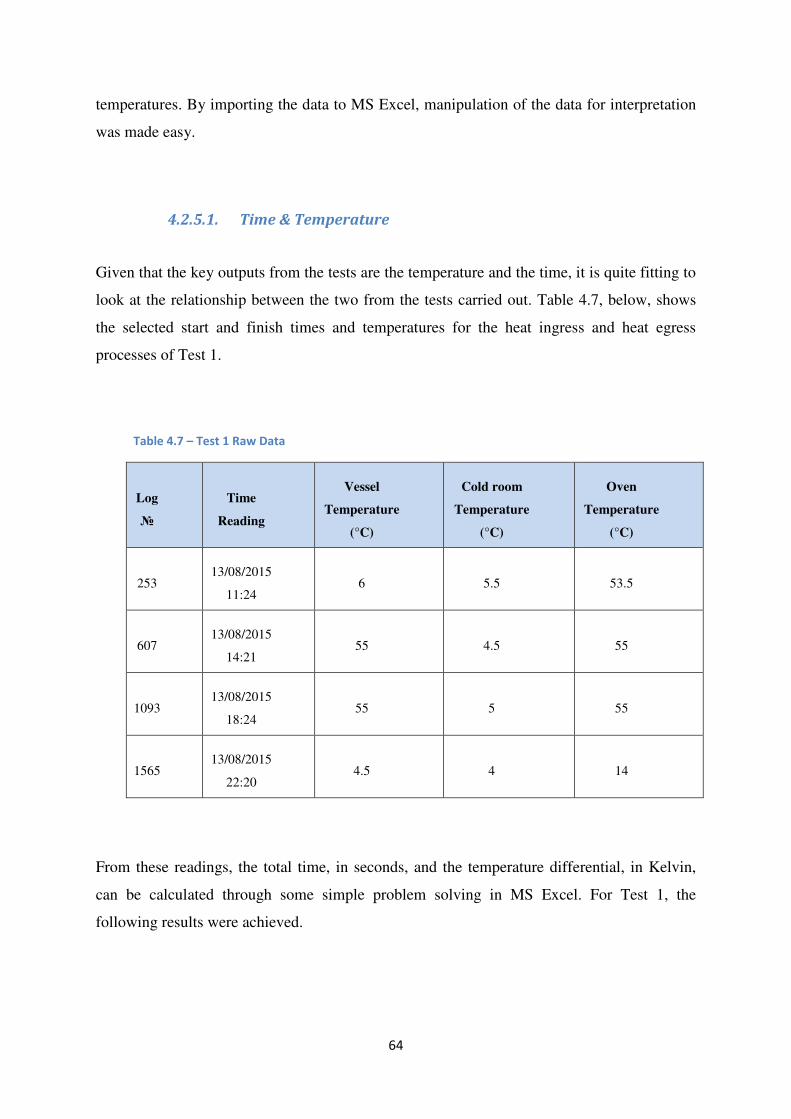
64
temperatures. By importing the data to MS Excel, manipulation of the data for interpretation
was made easy.
4.2.5.1. Time & Temperature
Given that the key outputs from the tests are the temperature and the time, it is quite fitting to
look at the relationship between the two from the tests carried out. Table 4.7, below, shows
the selected start and finish times and temperatures for the heat ingress and heat egress
processes of Test 1.
Table 4.7 – Test 1 Raw Data
Log
№
Time
Reading
Vessel
Temperature
(°C)
Cold room
Temperature
(°C)
Oven
Temperature
(°C)
253 13/08/2015
11:24 6 5.5 53.5
607 13/08/2015
14:21 55 4.5 55
1093 13/08/2015
18:24 55 5 55
1565 13/08/2015
22:20 4.5 4 14
From these readings, the total time, in seconds, and the temperature differential, in Kelvin,
can be calculated through some simple problem solving in MS Excel. For Test 1, the
following results were achieved.

65
Table 4.8 – Test 1 Outputs
Test
Heat Ingress Heat Egress
Timeframe
(s)
Temperature
Change (K)
Timeframe
(s)
Temperature
Change (K)
1 10,620 49 14,160 50.5
By dividing one by the other produces either K/s or s/K: both of which could be useful
information for further manipulation or as the simplest rating system. In the case of Test 1,
the 4 possible results are:
Table 4.9 – Ratio of Test 1 Outputs
Test
Heat Ingress Heat Egress
K/s s/K K/s s/K
1 4.61E-03 2.17E+02 3.57E-03 2.80E+02
With a little further manipulation, it can be observed that the heat ingress process is only
77.3% as long as the heat egress process, and conversely the heat egress process is 129% the
length of the heat ingress process.
4.2.5.2. Applying Vessel Volume & Internal Energy
If other metrics are desired for the rating system, then extra information is required. By
applying the time and temperature results from above to the volume of the vessel and then
applying the calculated value of the volumetric internal energy from 4.1.6 above, a new result
in W/K (J/s-K) can be produced. Alternatively, this could be a K/W results.

66
Firstly, the vessel volume needs to be determined. Willow and EvaKool were both contacted
for their data sheets, which were hoped to contain the gross internal volume of the vessels,
however this information was not available. No response was received from Willow, however
EvaKool provided data for the internal and external dimensions of their product range in a
simple MS Excel spreadsheet. From other conversations with manufacturers throughout this
project, it appears that manufacturers do not currently use CAD programs or similar software
for designing products, from which to draw precise information such as the gross internal
volume.
For the EvaKool IceMate, the product is known as a 70L vessel, while the contact at EvaKool
suggested that it was more likely to be about 76L. Using their internal dimensions produced a
value of 87L, which does not allow for the rounded internal corners of the vessel. Clearly,
this is insufficient for an accurate calculation, and more precise information would be
required.
Likewise for the Willow Sixer, internal dimensions were taken and multiplied to produce a
figure of 6.95L. The vessel was then filled with water measured in a domestic kitchen
measuring jug to produce a figure of 6.75L. Although both of these are lacking in accuracy,
there is a difference that would be equivalent to the effect of the rounded internal corners of
the vessel.
It is anticipated that the implementation of such a testing & rating system as this would drive
manufacturers to more performant designs which may well see them switch to designing in
CAD type programs. Alternatively, a more accurate way of measuring the gross internal
volume of a vessel would be to submerge it with an open lid into a precisely measured
volume of water, close the lid, remove the vessel, allow it to drip any excess water from the
external surfaces back into the volume of water, and then measure the difference between the
starting and finishing volumes of water.
In the meantime, for the purposes of this analysis, the approximated volume of the Willow
Sixer is sufficient to demonstrate how the W/K (or K/W) measurement would work. Using
the more conservative value of 6.75L as the vessel volume, and taking the average of the
values from Equation 4.9 and Equation 4.11 (assuming this vessel might partially inhibit air
leakage), the results can be calculated as follows:

67
�44.10165 'A �2⁄ + 0.056634 'A �2⁄ �
2= 22.079142 'A �2⁄ = 22.1 'A �2⁄
Equation 4.14
J = - × H = 0.00675�2 × 22.1 'A �2⁄ = 0.149175'A = 149A
Equation 4.15
Now applying this value with the values for time and temperature differential, the final figure
can be calculated. Firstly, using the heat ingress values achieves:
� =J
∆M × ∆�=
149A
10,6203 × 49�= 2.86 × 10�� � �⁄
Equation 4.16
While using the heat egress values achieves:
� =J
∆M × ∆�=
149A
14,1603 × 50.5�= 2.08 × 10�� � �⁄
Equation 4.17
Alternatively, these figures could be inverted to find their reciprocal R values:
, =∆M × ∆�
J=
10,6203 × 49�
149A= 3.49 × 10² � �⁄
Equation 4.18
, =∆M × ∆�
J=
14,1603 × 50.5�
149A= 4.80 × 10² � �⁄
Equation 4.19

68
4.2.5.3. Result Variations
All the calculations for Test 1, above, can be reproduced within the body of this report for
each test; however that would consume enormous space for little interest. That which is of
greater interest is the difference in the results from one test to another. The results of the other
tests are provided in the tables below.
Table 4.10 – Test 2 Raw Data
Log
№
Time
Reading
Vessel
Temperature
(°C)
Cold room
Temperature
(°C)
Oven
Temperature
(°C)
201 14/08/2015
13:06 55 7 55
1503 14/08/2015
23:57 7 7 13.5
Table 4.11 – Test 3 Raw Data (See for %RH results)
Log
№
Time
Reading
Vessel
Temperature
(°C)
Cold room
Temperature
(°C)
Oven
Temperature
(°C)
663 17/08/2015
16:05 54.5 6.5 57
1254 17/08/2015
21:00 5 5 16

69
Table 4.12 – Test 4 Raw Data
Log
№
Time
Reading
Vessel
Temperature
(°C)
Cold room
Temperature
(°C)
Oven
Temperature
(°C)
396 18/08/2015
11:57 5.5 5.5 54.5
558 18/08/2015
13:18 55.5 5.5 55.5
747 18/08/2015
14:52 55.5 5 5.5
1094 18/08/2015
17:46 6.5 6.5 17.5
Table 4.13 – Test 2 Outputs
Test
Heat Egress
Timeframe (s) Temperature Change (K)
2 39,060 48
Table 4.14 – Test 3 Outputs
Test
Heat Egress
Timeframe (s) Temperature Change (K)
3 17,730 49.5

70
Table 4.15 – Test 4 Outputs
Test
Heat Ingress Heat Egress
Timeframe
(s)
Temperature
Change (K)
Timeframe
(s)
Temperature
Change (K)
4 4,860 50 10,410 49
The results in the table above show clearly that the larger vessel took longer to reach a
steady-state, while the soft cooler bag took far less time to do so. The Test 3 results also show
a significantly longer time with a higher level of relative humidity. The results below show
the relative humidity for tests 1 & 3, which show that, although 100% was not attained as
desired, the difference in relative humidity that was possible demonstrated from the times
above that it is important to control the level of moisture content in the test air during the
testing procedure.
Table 4.16 – Test 1 Raw Data for %RH (heat egress only to match Test 3)
Log
№
Time
Reading
Vessel
Temperature
(%RH)
Cold room
Temperature
(°C)
Oven
Temperature
(°C)
1093 13/08/2015
18:24 13.5 76.5 6
1565 13/08/2015
22:20 67.5 80.5 38

71
Table 4.17 – Test 3 Raw Data for %RH
Log
№
Time
Reading
Vessel
Temperature
(°C)
Cold room
Temperature
(°C)
Oven
Temperature
(°C)
663 17/08/2015
16:05 93 77 32.5
1254 17/08/2015
21:00 91 79 46.5
4.2.5.4. Interpreting Data
In instances where the steady-state conditions were not obvious, the data was analysed from
one logger to another to determine when the vessel would have been at equilibrium with the
chamber. The loggers provide data every 30 seconds, and in 0.5°C increments, so for most
readings it was obvious how to interpret the data sets. The hardest test data to interpret was
from Test 3 with the high relative humidity, which must have impacted either the loggers to
read data or for the cold room and oven to cycle steadily.
One observation which allowed insight for interpretation of data was that in some cases two
loggers would maintain steady temperatures for long periods of time with only 0.5°C
difference, and then would switch values for a further long period of time. From this it was
deduced that both were actually at steady-state, but because of the rounding they were either
just above or below the cut off and therefore appeared to have oscillating temperatures, when
in fact loggers with an accuracy of 0.1°C would have been far easier to interpret as being at
steady-state.
4.3. Rating System Selection
Originally, there was a plan to carry out a survey of USQ staff and students to determine how
technical and non-technical people understood the results and what rating metric would make
the most sense for the general public, however it was discovered, too late, that the university

72
has an important but lengthy process of approving surveys, through their ethics committee,
which would have left insufficient time for the survey to be carried out in time. Therefore the
selection process has been carried out purely within this project, without any external input.
A number of possible rating metrics were presented in 3.6.3 above. The final choice is the K-
value, which is the thermal conductance, measured in W/K. Although others have their
merits, this one is considered to be the easiest to learn, yet far enough removed that the
consumers will not misinterpret it, as could be the case for K/s or others. Plus it is actually
J/s-K which uses the heat (J) which is important for demonstrating the impact of size
changes, and time is a key indicator for most people. The use of Kelvin to divide the result
simply reduces the number and allows for any future changes in testing methodology which
may increase or decrease the temperature range of tests.
The use of K/s-m3 or K/s-m2 were quickly discounted as they would create a compensating
factor for size and shape, which is counterproductive to the point of this testing & rating
system, while K/s or s/K were also considered less likely to make sense to lay people, but
more importantly, stock that holds more heat will take longer to change temperature but these
options would not show this. Watts, on the other hand, are used in a number of ways, and
although the lay person may not fully understand Watts there is a general understanding that
it means work, heat or energy, which can more easily be related to an insulated vessel
avoiding heat accessing their stock.
It would also be possible to use the reciprocal of the K-value, known as the R-value, however
two factors dampen this. Firstly, the R-value is used in many industries and can either
represent the reciprocal of k, K or U, all of which have different units. Therefore the units for
the R-value must also be different from one usage to another. This may be acceptable in
learned circles (where one must be careful to define the terms), but for lay people this may
simply cause confusion when trying to relate an esky to insulation batts. Secondly, using the
K/W value would make less sense and cause the lay person to question what it means, and the
values would increase with performance which may be counter-intuitive to their perception of
a larger number meaning more heat transfer. Therefore having W/K, showing ever-
decreasing values with increased performance, would meet the lay persons perception that the
smaller numbers mean less heat gets in, keeping their ‘stuff’ colder longer.

73
5. Conclusion (Discussion)
After the initial conclusion of realising that this testing & rating system can work, and is
therefore worth developing further, the key conclusion is that the testing process is measured
in hours, rather than days. This means that commercially viable laboratories, set up to carry
out these tests, can charge fees that manufacturers would be prepared to pay, due to the great
reduction in testing time. Coupled with the transparency of having a third party carry out the
tests, manufacturers are likely to see great value in this process as a marketing tool for
improving sales. It is also quite likely that this will drive the manufacturers to improve
designs and research better materials in order to keep up with their competitors’ ratings.
Another conclusion that is easy to draw is that this test is very simple and this rating is very
simple. Both of which lend themselves to being repeatable and understandable, therefore
making this testing & rating system a possible universal system for all insulated containers.
5.1. Observations
One of the key observations, from the experimental tests carried out, is that the time to
equilibrium was different depending on whether heat ingress or heat egress was being
tracked. Initially, this was considered to be due to the fact that convective flows take hot air
upwards and cold air downwards, however this was quickly discounted when it was realised
that the heating process was faster, which would require the hot air to move down into the
vessel. One would expect the opposite: hot air in the vessel would rise to the lid/body joint
and be expelled, making the cooling process faster.
However, a more likely result would be that the specific heat changes with temperature. Since
they are proportional, it would make sense that at a higher temperature more heat can be
gained or lost, than at a lower temperature. A further observation (albeit too late to control)
was that the specimen was placed on racks in the oven and placed on a solid surface in the
cold room. It is possible that the solid surface in the cold room had an impact on the heat
transfer. It is very important that the conditions in both chambers are identical to avoid any
such variations causing ‘noise’ in the data.

74
5.2. Considerations
Another observation leads to considering the importance of the testing order. During the tests
it was observed that the relative humidity in the vessel changed differently from that of the
chambers. Because the vessel is closed there is limited air transfer, depending on the quality
of the seal between the lid and the body. Once the test commences, the moisture content in
the air within the vessel will remain, which will impact the relative humidity in a different
way from the chamber which processes moisture differently due to its equipment. It is
therefore important that the testing process always includes both the heat ingress and heat
egress process and that the relative humidity is balanced between the primary chamber and
the vessel before the lid is closed, and then kept closed throughout the duration of the testing
process.
This is equally applicable to the air pressure inside the vessel, as temperature changes will
cause density changes. If the test were to start in the hot chamber, and finish in the cold
chamber then there would be an increase in density which, without sufficient air leakage due
to a good lid/body seal, the vessel would be under vacuum at the end of the test (something
that many an esky user has witnessed in the real world when they put cold items in a hot
vessel and try to open it again later). For this reason, it would be best that the test procedure
always starts from the cold chamber, and it would also be best that it always includes both
ingress and egress, returning to its initial conditions.
5.3. Reflections
The sensors used for this project were selected because the university happened to own them
already, which helped to reduce costs of running the tests. However, on reflection, it would
have been better to have sensors which provided air pressure data rather than the unused dew
point data. Even if a method for pressurising the vessel could not be realised, it may still have
been possible to observe air pressure changes during the tests, which may have provided
greater insight into the importance of air pressure regarding the timeframes of the tests.

75
5.4. Looking Forward
There are a number of key aspects of this project to consider for the future. These are touched
on in the subsections below, but could never be considered exhaustive as long as the future
remains unknown.
5.4.1. System Development
All in all, this has been a successful project by establishing the feasibility of such a simple,
repeatable, universal and cost effective testing & rating system for insulated containers.
However, there is more work to be done before this could be a viable commercial program
that would attract an uptake from the industry and its customers.
Further work must be done for finding the most appropriate total internal heat value for a unit
volume, based on experimental tests on pressurisation of vessels across the standard range of
products on the market. This would become the universal value which all laboratories would
apply to the test results, and it would be defined in a standard or protocol for this testing &
rating methodology.
Some of the results in the experimental testing, along with some of the figures derived in the
mathematical analysis, demonstrate quite clearly that more rigorous testing is required to
define the most appropriate testing regimen. This would allow finer control of the results
which would greatly assist in determining the most likely order of grandeur for the rating
system. With a large variety of specimen vessels being tested, it would be possible to see
what the most common W/K values would be, which would allow refinement of the rating
system: whether it would be in whole units, or milliwatts or just a number for which the
exponential of base 10 is not shown (provided that most tests are returning results within the
same range).
In order to ensure consistent testing from one laboratory to another, it would be best to
develop a design for the chambers which can be replicated cheaply by any HVAC firm such
that temperature, relative humidity and air pressure are all controllable within acceptable
tolerances for the purposes of creating steady-states in each chamber so that the vessel
readings can easily be identified as reaching equilibrium without the extent of interpretation

76
of data as was required in the experimental tests of this project. In hindsight, it was obvious
that having the cold room cycling with a 2°C margin proved to be excessive for testing, even
if it is considered acceptable for keeping stock at a constant temperature over time. This may
be controlled more cost-effectively by the use of a ‘guarded hot box’ design within the
HVAC design (a highly controlled volume within a larger well controlled volume).
Where the atmospheric pressure is concerned, particularly with respect to laboratories at
different altitudes, it could be possible to develop a conversion factor from published tables
such that laboratories could simply take the air pressure reading for their location and use that
in the adjustment factor to convert their results to values equivalent to readings that would be
taken at sea level (1atm). This may be more cost-effective in the long run for HVAC design,
but would require considerable extra testing to determine the impact of air pressure changes
on the test results.
Equally, the same could be achieved for the relative humidity, however this would be far
more complicated due to the more complex impacts of moisture content in the air,
particularly on the changes of RH with temperature and pressure, and it would not be cost-
effective compared with the existing processes within standard HVAC design for controlling
RH in the built environment.
Any such future developments should not be considered without the input and collaboration
of important bodies such as JASANZ (Joint Accreditation System of Australia and New
Zealand), NATA (National Association of Testing Authorities, Australia), Standards
Australia, NMI (National Measurements Institute) and any equivalent international bodies,
and, of course, as many manufacturers as possible, including any industry associations that
represent their interests, as well as consumer advocacy bodies such as Choice Australia and
various leisure activity organisations.
For the rating system, it would be worthwhile taking a sample of the general public to find
out which ratings discussed in this project have the most meaning, before finalising the
metric used.

77
5.4.2. System Ownership
There is obviously an inherent level of intellectual property (IP) for this testing & rating
system, which can be demonstrated within this project document, which can be proven to
belong to the author, however all legal considerations at a national and international level
must be considered by anybody wanting to be a party to the development of this system.
There may be a necessity for trademarks, copyrights or patents before any further work is
carried out.
5.4.3. Remuneration Options
There is also a need to consider any monetary aspects to this system. This is broken into two
parts: the cost of testing, and the worth of the rating.
Any laboratory carrying out testing will incur costs which must be recuperated. Since
laboratories are likely to be commercial businesses intending to make a profit, they are
entitled to charge a fee for each test performed, as they see fit, as a function of what
competing laboratories may be charging. Since they are making money from such testing, it
is only fair that they should provide a portion of their turnover to the owner of the IP as a
mark of respect for their source of income.
Any manufacturer obtaining a rating will be in a position to use the outcome as a marketing
tool to achieve increased sales. Therefore, it is only fair that they too should provide a portion
of their turnover to the owner of the IP as a mark of respect for their source of increased
income.
There are strategies that should be considered to maximise both of these aspects. By
developing a cost effective testing process, manufacturers are more likely to pay for the tests
to be carried out. At the same time if the cost of displaying the rating is in proportion to the
revenue, then again they are more likely to pay for the rating.
The costs of testing are more in the hands of the laboratories which will compete with each
other to be viable, therefore the IP owner is less likely to control that aspect. However, the
value of advertising the rating can be fully controlled by the IP owner. If the cost is an

78
absolute value (such as $X/sticker) then this will favour more expensive vessels and be of
less interest to less expensive vessels, or be of more interest to high turnover items and show
less favour for the small turnover items. It would be farer to charge a portion of the sale price
for each item (%RRP12/sticker) considering that the IP owner has already incurred all (or at
least most) expenses prior to the first test being carried out or the first rating being promoted,
meaning that revenue from this system is more likely to be pure profit over time.
12
RRP means recommended Retail Price. This is better than using the sale price, as it discourages the
manufacturers from having too many sales which could water down the revenue of the IP owner.

79
List of References
Broadhurst, J & Van Arsdale, M 1924, 'Food in the house refrigerator', The Teachers College
Record, vol. 26, no. 3, pp. 230-45.
Cengel, YA & Boles, MA 2007, Thermodynamics, An Engineering Approach Sixth Edition
(SI Units), Mc Graw Hill, Singapore.
Cox, JL 2012, 'Practical Applications of ISTA Lane Data to Pharmaceutical Cold Chain
Strategies', proceedings of the International safe Transit Association.
ISTA 2007, Procedure 7D - Temperature Test for Transport Packaging, International Safe
Transit Association, Michigan, March 2007, Procedure.
Kingspan 2012, Controlled Environments KS1100 CS Insulated Panels for Temperature
Controlled & Hygiene Safe Building Applications, Kingspan Insulated Panels Pty Ltd, July
2012, <http://www.kingspanpanels.com.au/Resource-Centre/Download/Controlled-
Environment-Brochures/KS-CS-brochure-digital-2012-pdf-1.aspx>.
Kreith, F, Manglik, R & Bohn, M 2010, Principles of heat transfer, 7th (SI) edn, Cengage
learning, CT, USA.
Lascar Electronics 2015, EL-USB-2-LCD Logger, viewed 10/08/15,
<http://www.lascarelectronics.com/temperaturedatalogger.php?datalogger=375>.
Martinet, D 2013, The Ultimate Thermos Test: You've Never Heard of the Winner, viewed
26/05/15, <http://www.withdrake.com/blog/youve-never-heard-of-the-winner-thermal-
performance-of-insulated-drink-carriers/>.
Nave, CR 2012, Thermal Conductivity Table, Georgia State University, viewed 15/10/15,
<http://hyperphysics.phy-astr.gsu.edu/hbase/tables/thrcn.html>.
Singh, SP, Burgess, G & Singh, J 2008, 'Performance comparison of thermal insulated
packaging boxes, bags and refrigerants for single-parcel shipments', Packaging Technology
and Science, vol. 21, no. 1, pp. 25-35, <http://dx.doi.org/10.1002/pts.773>.
Steen, M 2014, 'Cooling off for the weekend', Choice Magazine, no. Dec - Jan, December
2014, pp. 46-7.

80
Sugo, H, Page, A & Inglis, C 2007a, 'Thermal performance studies at the University of
Newcastle', in Solar 07: proceedings of the Solar 07 ANZSES, Alice Springs, Australia.
Sugo, H, Page, A & Inglis, C 2007b, 'Thermal performance studies at the University of
Newcastle', in Solar 07: proceedings of theSolar 07 ANZSES, Alice Springs, Australia.
Summers, E, Kuether, J, Isaacs, A, Butterfield, J, Holmes, A & Law, J 2003, Collins English
Dictionary: Complete and Unabridged, HarperCollins.
Vance, R 2013, 'Boatinglab Tests: Top-shelf Coolers', Boating Magazine, vol. 86, no. 3, Mar
2013, pp. 96-100.
World Health Organisation 2010, PQS Independent type-testing protocol, World Health
Organisation, UK, 21 May 2010, Protocol.

81
Appendices
Appendix A is a prerequisite for this student project, the remaining appendices are specific to
the development of text in this report.

82
A. Project Specification
University of Southern Queensland
FACULTY OF HEALTH, ENGINEERING & SCIENCE
ENG4111/4112
Engineering Research Project 2015
Project Specification
For: Thierry-Jacques Vever (0050078313)
Topic: Insulated Container Testing & Rating System Development
Supervisor: Ruth Mossad
Enrolment: ENG4111 EXT – S1,2015
ENG4112 EXT – S2, 2015
Project Aim: This project seeks to investigate and develop an independent testing & rating
system for insulated containers (‘Eskies’, etc.) for their capacity to repel or retain
heat (like pizza pouches) for consumers to compare products on the market.
Sponsorship: None at present
Program:
1. Define the range of products subject to such a system, such as (ice chests, cooler bags,
insulated lunch boxes, fruit & vegetable containers, pizza pouches, etc.) including limitations
2. Investigate the current market to assess manufacturers’ claims of thermal performance
3. Research other rating systems, including standards, and the methodologies of accrediting
bodies such as NATA (the National Association of Testing Authorities, Australia)
4. Develop a testing methodology for application to selected product types on the market
(with an intent for it to be universal for all products on the market if possible)
5. Investigate impacts and variations of conductive, convective and radiant heat transfer on the
heat transfer process through container walls
6. Carry out experimental testing on selected products following the methodology developed
7. Carry out theoretical estimates to validate experimental results
8. Develop an objective rating system based on test results for comparison of products
As Time Permits:
9. Survey ERP2015 students to determine an appropriate rating scheme (Stars, Snow Flakes,
values, etc.)
10. Develop a logo for the rating system
11. Develop a system of royalties which would be equitable across all products types and costs

83
B. Timeline & Resources
Vever ERP2015 Timeline & Resources
Timeline
• Literature review, market review, learning LaTeX, etc End May
• Define draft test method, theoretical analysis, preliminary report End Jun
• Experimental testing of sample products, compare with theoretical analysis End Jul
• Finalise test method based on results, format to suit industry norms End Aug
• Final report, prepare presentation & dissertation End Sept
• Review and correct any outstanding issues & submit End Oct
Resources (required in July)
• A hot room (or chamber)
• A cold room (or chamber)
• Some test specimens
• 3 remote sensors (one in hot room, one in cold room, one in test specimen)
Is USQ already in possession of these resources? If not, they will need to be sourced. Sensors should
be easily purchasable, while test specimens might be provided from local manufacturers interested
in supporting this research (otherwise borrowed from staff/students or purchased). The rooms
(chambers) will require additional work to source, and will need to be in close proximity to allow
rapid transfer of specimens from one to the other. They may be in another location which could be
used either at cost or free of charge (such as an industrial kitchen with large ovens and fridges).
Are any associated costs covered by USQ, or is the researcher expected to cover such costs?

84
C. Guarded Hot Box Apparatus
The following images are taken from the Conference Proceedings for the Thermal
Performance Studies at The University of Newcastle (Sugo, Page & Inglis 2007b) to provide
the reader with a quick visual understanding of the guarded hot box apparatus.
Figure C.1 – Schematic diagram of the operation of a guarded hot box apparatus

85
Figure C.2 – A guarded hot box apparatus in use

86
D. Test Plan
ERP2015TestPlanandRiskAssessment&ManagementInsulated Container Testing & Rating System Development
Test Plan
Equipment & Personnel
Equipment
• Cold room
• Oven
• 3x Data Loggers
• 1x live sensor for tracking when to shift vessels between chambers
• Willow 6-Can vessel
• Evakool Ice Mate vessel
• Outdoor Plus cooler bag
• Sowing thread (for stringing up logger in vessels)
• Sticky tape and blue tack (for attaching thread to vessel)
• Towel (for soaking in hot water for RH test)
• Large plastic bag (for increasing pressure for ATM test)
• Motor for compressing plastic bag
• Barometer to measure ATM inside plastic bag (Terry to determine if this will be possible)
• Atomiser bottle (for spraying inside cold room to create 100% RH)
• “KEEP DOOR CLOSED TO MAINTAIN CONDITIONS – TESTING IN PROGRESS” signs for cold
room and oven doors
• “DON’T RESET TEMPERATURE – TESTING IN PROGRESS” signs for cold room and oven
thermostats (as others may want to adjust them during tests)
• “DON’T TOUCH – TESTING IN PROGRESS” sign for vessel and logger in cold room (as others
may be in the cold room)
Personnel
• 2 people for set-up and transfer tasks, such as opening and closing the oven, cold room and
lab doors (Jacques +1)
• 1 person for monitoring tasks (Jacques)

87
Test 1 – Standard Test
Willow 6-Can vessel placed through ingress and egress tests – no control of RH or ATM
Objective
Determine whether ingress and egress are equal and establish timeframes for other tests.
Task Run
• Set cold room and oven to 5oC & 55
oC, respectively, to have a 50K ΔT – Thursday AM
• Place a logger in the cold room and a logger in the vessel – as well as the live sensor – and
place the vessel in the cold room with the lid open to allow equalising temperatures ASAP –
Thursday AM
• Place a logger in the oven in anticipation of the vessel transfer – Thursday AM
• Monitor live sensor reading until reading 5oC, and then allow a significant time delay to be
certain that the logger is also getting the same reading (cycling with the cold room would
indicate being beyond equilibrium) – Thursday AM
• Once temperature in the vessel is at 5oC, swiftly open the cold room, close the lid, pick up
the vessel, exit the cold room and close it, and then transfer the vessel swiftly to the oven,
opening and closing the oven as quickly as possible to avoid a significant variation in the
oven temperature, noting the time lapse the door is open to jot down later – Thursday AM
(possibly an hour or so later)
• Monitor live sensor reading and attempt to determine the timeframe for reaching
equilibrium (anticipated being about 5-12 based on hours from initial ‘Home Test’13
) –
Thursday AM (This could take a few hours)
• Once sensor reading reaches 55oC, allow a significant time delay to be certain that the logger
is also getting the same reading (cycling with the oven would indicate being beyond
equilibrium) – Thursday PM
• Once temperature in the vessel is at 55oC, transfer the vessel swiftly back to the cold room,
opening and closing the cold room as quickly as possible to avoid a significant variation in
the cold room temperature, noting the time lapse the door is open to jot down later –
Thursday PM (possibly quite late into the evening)
• Leave the vessel in the cold room overnight (it can remain well beyond equilibrium, as any
subsequent readings should only show cycling with the cold room) – Thursday PM
• Remove vessel and loggers from cold room and oven (oven logger can be removed after
oven portion of test is completed the night before), and download information from loggers
to computer and save files for analysis at a later stage – Friday AM
13
Jacques carried out a practice test at home using a typical domestic kitchen oven at approximately 50-60oC
and a domestic refrigerator at approximately 4oC over an approximately 12 hour period, which provided
valuable insight for setting up this Test Plan.

88
Test 2 – Half Standard Test with Volume Change
Evakool Ice Mate vessel placed through egress test – no control of RH or ATM (This is only going
from oven to cold room due to potential time issues with such a large volume of air to be subjected
to such a large change in heat).
Objective
Determine difference in heat egress in comparison with the Test 1 results.
Task Run
• Set cold room and oven to 5oC & 55
oC, respectively, to have a 50K ΔT – Friday AM
• Place a logger in the oven and a logger in the vessel – as well as the live sensor – and place
the vessel in the oven (it will have to be on its end) with the lid open to allow equalising
temperatures ASAP – Friday AM
• Place a logger in the cold room in anticipation of the vessel transfer – Friday AM
• Monitor live sensor reading until reading 55oC, and then allow a significant time delay to be
certain that the logger is also getting the same reading (cycling with the oven would indicate
being beyond equilibrium) – Friday AM
• Once temperature in the vessel is at 55oC, swiftly open the oven, close the lid, pick up the
vessel, remove it from the oven, and then transfer the vessel swiftly to the cold room,
opening and closing the cold room as quickly as possible to avoid a significant variation in
the cold room temperature, noting the time lapse the door is open to jot down later – Friday
AM (possibly an hour or so later)
• Leave the vessel in the cold room over the weekend (it can remain well beyond equilibrium,
as any subsequent readings should only show cycling with the cold room) – Friday AM
• Remove vessel and loggers from cold room and oven (oven logger can be removed after
oven portion of test is completed on Friday), and download information from loggers to
computer and save files for analysis at a later stage – Monday AM (Jacques will be late to
campus due to school drop-off)

89
Test 3 – Half Standard Test with RH Change
Willow 6-Can vessel placed through egress test with 100% RH – no control of ATM (only completing
egress portion due to lack of control of RH in vessel from cold room to oven, and due to time
restrictions as a function of intercity commuting)
Objective
Determine difference in heat egress in comparison with the Test 1 results.
Task Run
• Set cold room and oven to 5oC & 55
oC, respectively, to have a 50K ΔT – Monday AM
• Soak a large towel in hot water, wring to drip-dry, and place in oven to create moisture to
achieve 100% RH (towel should still be moist at 100% RH, otherwise RH will peak early once
towel is dry, if so resoak and re-wring towel and continue to equilibrium) – Monday AM
• Place a logger in the oven and a logger in the vessel – as well as the live sensor – and place
the vessel in the oven with the lid open to allow equalising temperatures ASAP – Monday
AM
• Place a logger in the cold room in anticipation of the vessel transfer, spray atomiser bottle to
increase RH in cold room to 100% and monitor logger to determine RH (respray if RH too
low) – Monday AM
• Monitor live sensor reading until reading 55oC & 100% RH, and then allow a significant time
delay to be certain that the logger is also getting the same reading (cycling with the oven
would indicate being beyond equilibrium – it may be necessary to open the oven and check
the RH on the logger if the live sensor cannot provide an RH reading) – Monday AM
• Once temperature in the vessel is at 55oC & 100% RH, swiftly open the oven, close the lid,
pick up the vessel, remove it from the oven, and then transfer the vessel swiftly to the cold
room, opening and closing the cold room as quickly as possible to avoid a significant
variation in the cold room temperature, noting the time lapse the door is open to jot down
later – Monday AM or PM depending on start time (possibly an hour or so later)
• Leave the vessel in the cold room overnight (it can remain well beyond equilibrium, as any
subsequent readings should only show cycling with the cold room) – Monday AM or PM
depending on start time
• Remove vessel and loggers from cold room and oven (oven logger can be removed after
oven portion of test is completed the night before), and download information from loggers
to computer and save files for analysis at a later stage – Tuesday AM

90
Test 4 – Standard Test with Design & Material Change
Outdoor Plus cooler bag placed through ingress and egress tests – no control of RH or ATM
Objective
Determine whether ingress and egress are equal, possibly due to the zipper at the top of the bag, as
well as time frame changes due to different materials.
Task Run
• Set cold room and oven to 5oC & 55
oC, respectively, to have a 50K ΔT – Tuesday AM
• Place a logger in the cold room and a logger in the cooler bag – as well as the live sensor –
and place the cooler bag in the cold room with the zipper open to allow equalising
temperatures ASAP – Tuesday AM
• Place a logger in the oven in anticipation of the vessel transfer – Tuesday AM
• Monitor live sensor reading until reading 5oC, and then allow a significant time delay to be
certain that the logger is also getting the same reading (cycling with the cold room would
indicate being beyond equilibrium) – Tuesday AM
• Once temperature in the cooler bag is at 5oC, swiftly open the cold room, close the zipper,
pick up the cooler bag, exit the cold room and close it, and then transfer the cooler bag
swiftly to the oven, opening and closing the oven as quickly as possible to avoid a significant
variation in the oven temperature, noting the time lapse the door is open to jot down later –
Tuesday AM (possibly an hour or so later)
• Monitor live sensor reading and attempt to determine the timeframe for reaching
equilibrium (anticipated being faster than Test 1 due to less performant material) – Tuesday
AM (This could take a few hours)
• Once sensor reading reaches 55oC, allow a significant time delay to be certain that the logger
is also getting the same reading (cycling with the oven would indicate being beyond
equilibrium) – Tuesday PM
• Once temperature in the vessel is at 55oC, transfer the cooler bag swiftly back to the cold
room, opening and closing the cold room as quickly as possible to avoid a significant
variation in the cold room temperature, noting the time lapse the door is open to jot down
later – Tuesday PM (possibly not quite as late as Test 1 due to less performant material)
• Leave the cooler bag in the cold room overnight (it can remain well beyond equilibrium, as
any subsequent readings should only show cycling with the cold room) – Tuesday PM
• Remove cooler bag and loggers from cold room and oven (oven logger can be removed after
oven portion of test is completed the night before), and download information from loggers
to computer and save files for analysis at a later stage – Wednesday AM

91
Test 5 – Half Standard Test with ATM Change
Willow 6-Can vessel placed through egress test with significant increase in pressure – no control of
RH (only completing egress portion in keeping with Test 3, and due to time restrictions as a function
of intercity commuting)
Objective
Determine difference in heat egress in comparison with the Test 1 results.
Task Run *
• Set cold room and oven to 5oC & 55
oC, respectively, to have a 50K ΔT – Wednesday AM
• Place a logger in the oven and a logger in the vessel – as well as the live sensor – and place
the vessel in the plastic bag with the motor attached (pressurise the bag such that the lid can
be left open and then closed for transfer), and then place the package in the oven with the
lid open to allow equalising temperatures ASAP – Wednesday AM
• Place a logger in the cold room in anticipation of the vessel transfer – Wednesday AM
• Monitor live sensor reading until reading 55oC, and then allow a significant time delay to be
certain that the logger is also getting the same reading (cycling with the oven would indicate
being beyond equilibrium) – Wednesday AM
• Once temperature in the vessel is at 55oC, swiftly open the oven, close the lid, pick up the
package, remove it from the oven, read the barometer and make mental note for jotting
down later (if Terry doesn’t have one that can log ATM), and then transfer the package
swiftly to the cold room, opening and closing the cold room as quickly as possible to avoid a
significant variation in the cold room temperature, noting the time lapse the door is open to
jot down later – Wednesday AM (possibly an hour or so later)
• Leave the package in the cold room overnight (it can remain well beyond equilibrium, as any
subsequent readings should only show cycling with the cold room) – Wednesday AM
• Remove package and loggers from cold room and oven (oven logger can be removed after
oven portion of test is completed the day before), read the barometer and make mental
note for jotting down later (if Terry doesn’t have one that can log ATM), and download
information from loggers to computer and save files for analysis at a later stage – Thursday
AM
* Note: This Task Run may change as the method of controlling pressure is finalised between
the print date of this document and the scheduled time of carrying out this test.

92
E. Risk Assessment & Management
ERP2015TestPlanandRiskAssessment&ManagementInsulated Container Testing & Rating System Development
Risk Assessment & Management This table refers only to the risks associated with the tests defined about, to be carried out in Z Block at the Toowoomba Campus of The University of
Southern Queensland.
Risk Identification Risk Evaluation Risk Control
Sources Hazards Likelihood Justification Exposure Consequences Control Mechanism
Oven Burns Extremely
slight
Planned temperature not
to exceed approximately
55oC.
Briefly when loading
vessels in the oven. Minor Injury
Instruct all operators of hot surfaces to
avoid, and do not linger next to oven.
Cold Room Chills very slight
Although planned
temperature to reduce to
5oC, exposure is not
planned to be very long.
Briefly when loading
vessels in the cold
room.
Minor Injury
Instruct all operators of cold surfaces to
avoid, and do not linger in the cold
room.
Hot Wet
Towel Scalding slight
Hot water from taps is
tempered to avoid scalds.
Only when first
soaking and wringing
out towel.
Minor Injury Ensure operator checks temperature of
towel before picking it up.
Loads Strains/sprains slight
Vessels are not intended
to be filled, so only those
operators already
suffering are likely to
sustain an injury or
exacerbate a pre-existing
condition.
Briefly when loading
vessels in the
chambers.
Minor Injury
Survey operators for any back/arm/leg
joint injuries, and use only competent
operators. Instruct correct procedure
for lifting (bend knees, not back),
recommending 2 operators for large,
heavy vessels.

93
Risk Identification Risk Evaluation Risk Control
Sources Hazards Likelihood Justification Exposure Consequences Control Mechanism
Electricity Electrocution very slight
Although electrical faults
occur, most equipment is
designed to shut down
before electrocution.
Only when
connecting or
disconnecting
equipment.
Possible
Death
Rubber souled shoes to be worn when
connecting equipment. Use only
recently tested equipment. Minimise
connection/disconnection tasks.
Refrigerant
Gas Poisoning
Extremely
slight
Although a gas leak could
occur, it will be within a
large environment, and
personnel are not
required to stay in the
space throughout the
duration of the tests.
Only if testers stay in
the test area, and
there is no
ventilation or pump-
down mechanism for
the equipment.
Major Illness
Ensure adequate ventilation for
refrigerant gas system. Check for
pump-down mechanism, or have open
windows. Operators to monitor from a
different space.
Plastic Bag
Compression Pinching slight
The operator is likely to
be conscious of pinching
as the motor takes up the
plastic bag, and be
vigilant to keep fingers
clear.
Only when first
attaching the motor
and gear to the bag.
Minor Injury
Ensure an observer is present to
remind the operator to be careful to
avoid a pinch injury.

94
F. Work Permit

95
G. Induction Checklist

96
H. Standard Operating Procedure

97
I. ELG Logger Graphs
The following graphs are from the ELG software showing the remainder of the logger graphs
that were not shown in the body of the report.
a. Test 2
These are the ELG logger graphs for Test 2.
Figure I.1 – ELG graph of the logger from the vessel for Test 2

98
Figure I.2 – ELG graph of the logger from the cold room for Test 2
Figure I.3 – ELG graph of the logger from the oven for Test 2
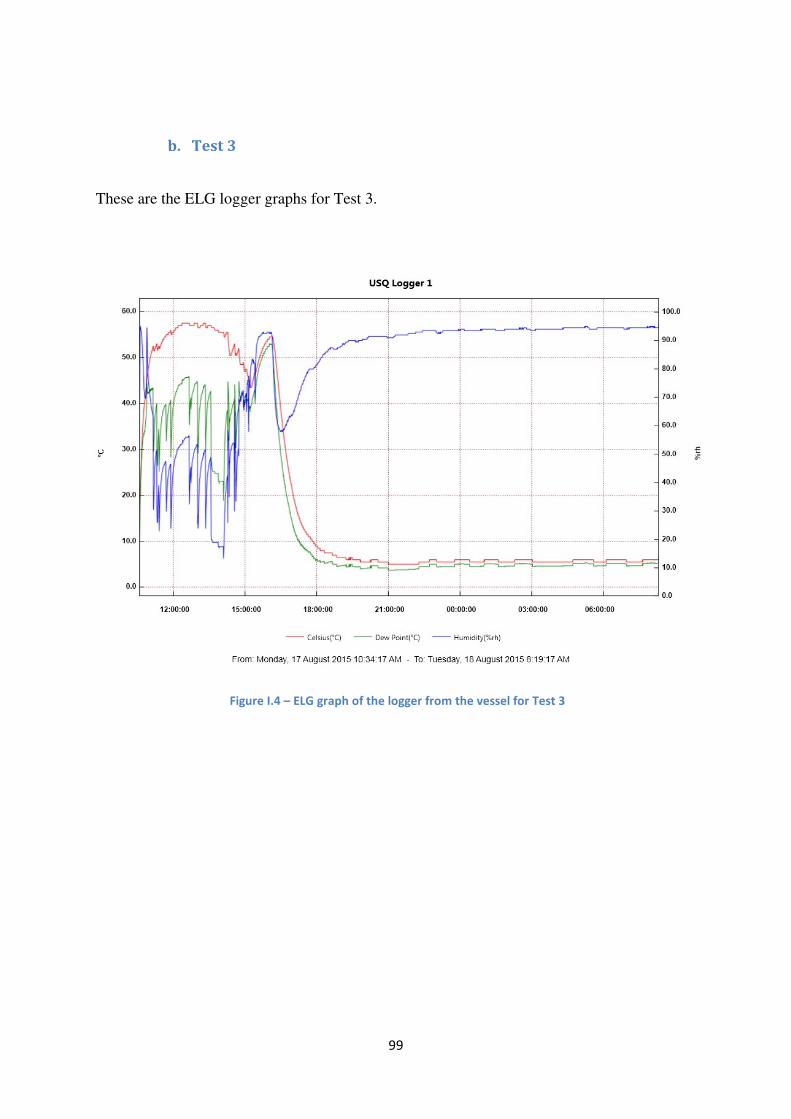
99
b. Test 3
These are the ELG logger graphs for Test 3.
Figure I.4 – ELG graph of the logger from the vessel for Test 3

100
Figure I.5 – ELG graph of the logger from the cold room for Test 3
Figure I.6 – ELG graph of the logger from the oven for Test 3

101
c. Test 4
These are the ELG logger graphs for Test 4.
Figure I.7 – ELG graph of the logger from the vessel for Test 4

102
Figure I.8 – ELG graph of the logger from the cold room for Test 4
Figure I.9 – ELG graph of the logger from the oven for Test 4

103
J. Excel Temperature Graphs
The following graphs are from MS Excel showing the remainder of the temperature graphs
(including those showing greater clarity) that were not shown in the body of the report.
d. Test 2
These are the Excel temperature graphs for Test 2. It is interesting to note the oscillations in
the red line of Figure J.10 which represents the oven logger which was left on in the
laboratory. This effectively tracks the diurnal swing in that vented, unconditioned space in
winter.
Figure J.10 – Excel temperature graphs of the loggers for Test 2 showing the heat egress
process
0
10
20
30
40
50
60
Vessel
Coldroom
Oven

104
Figure J.11 – Excel temperature graphs of the loggers for Test 2 showing the heat egress with
greater clarity
0
10
20
30
40
50
60
Vessel
Coldroom
Oven

105
e. Test 4
These are the Excel temperature graphs for Test 4.
Figure J.12 – Excel temperature graphs of the loggers for Test 4 showing both the heat ingress
and egress processes
0
10
20
30
40
50
60
Vessel
Coldroom
Oven

106
Figure J.13 – Excel temperature graphs of the loggers for Test 4 showing the heat ingress with
greater clarity
Figure J.14 – Excel temperature graphs of the loggers for Test 4 showing the heat egress with
greater clarity
0
10
20
30
40
50
60
Vessel
Coldroom
Oven
0
10
20
30
40
50
60
Vessel
Coldroom
Oven