insulin-regulatedglut4translocation - the … membraneproteintraffickingwithsixdistinctivesteps* s...
TRANSCRIPT

Insulin-regulated Glut4 TranslocationMEMBRANE PROTEIN TRAFFICKING WITH SIX DISTINCTIVE STEPS*□S
Received for publication, February 5, 2014, and in revised form, April 16, 2014 Published, JBC Papers in Press, April 28, 2014, DOI 10.1074/jbc.M114.555714
Paul Duffield Brewer‡1, Estifanos N. Habtemichael§1, Irina Romenskaia‡, Cynthia Corley Mastick‡2,and Adelle C. F. Coster¶
From the ‡Department of Biochemistry and Molecular Biology, University of Nevada School of Medicine, Reno, Nevada 89557,the §Section of Endocrinology and Metabolism, Department of Internal Medicine, Yale University School of Medicine,New Haven, Connecticut 06520, and the ¶School of Mathematics and Statistics, University of New South Wales,Sydney, New South Wales 2052, Australia
Background: Cell surface levels of glucose transporter Glut4 are tightly controlled in adipocytes.Results: The effects of insulin and differentiation on the trafficking kinetics of Glut4, the transferrin receptor, and LRP1 weremeasured to identify regulatory steps.Conclusion: Six independent steps determine cell surface Glut4; insulin stimulates three of these.Significance: These results provide a framework for functionally mapping treatments/proteins that affect Glut4 translocation.
The trafficking kinetics of Glut4, the transferrin (Tf) receptor,and LRP1 were quantified in adipocytes and undifferentiatedfibroblasts. Six steps were identified that determine steady statecell surface Glut4: (i) endocytosis, (ii) degradation, (iii) sorting,(iv) sequestration, (v) release, and (vi) tethering/docking/fusion.Endocytosis of Glut4 is 3 times slower than the Tf receptor infibroblasts (ken � 0.2 min�1 versus 0.6 min�1). Differentiationdecreases Glut4 ken 40% (ken � 0.12 min�1). Differentiation alsodecreases Glut4 degradation, increasing total and cell surfaceGlut4 3-fold. In fibroblasts, Glut4 is recycled from endosomesthrough a slow constitutive pathway (kex � 0.025– 0.038 min�1),not through the fast Tf receptor pathway (kex � 0.2 min�1). Thekex measured in adipocytes after insulin stimulation is similar(kex � 0.027 min�1). Differentiation decreases the rate constantfor sorting into the Glut4 recycling pathway (ksort) 3-fold. Inadipocytes, Glut4 is also sorted from endosomes into a secondexocytic pathway through Glut4 storage vesicles (GSVs). Sur-prisingly, transfer from endosomes into GSVs is highly regu-lated; insulin increases the rate constant for sequestration (kseq)8-fold. Release from sequestration in GSVs is rate-limiting forGlut4 exocytosis in basal adipocytes. AS160 regulates this step.Tethering/docking/fusion of GSVs to the plasma membrane isregulated through an AS160-independent process. Insulinincreases the rate of release and fusion of GSVs (kfuseG) 40-fold.LRP1 cycles with the Tf receptor and Glut4 in fibroblasts butpredominantly with Glut4 after differentiation. Surprisingly,AS160 knockdown accelerated LRP1 exocytosis in basal andinsulin-stimulated adipocytes. These data indicate that AS160may regulate trafficking into as well as release from GSVs.
Insulin stimulation of glucose uptake in muscle and adiposetissue is crucial for the regulation of blood glucose homeostasis.In adipocytes, very little glucose is taken up into the cells underbasal/fasting conditions. Insulin stimulates glucose transport10 – 40-fold in these cells. Glucose uptake is rate-limited by thenumber of facilitative glucose transporters present in plasmamembranes. Insulin stimulates glucose uptake by altering thesubcellular distribution of glucose transporter 4 (Glut4)from intracellular stores to the plasma membrane, a processknown as Glut4 translocation (1, 2). Defects in this processare observed in insulin resistance, type II diabetes mellitus,and metabolic syndrome.
Glut4 traffics through the general endocytic recycling path-way as well as through specialized compartments unique to itsfunction (3– 6). Under basal conditions, less than 5% of Glut4 isfound in the plasma membrane of primary adipocytes (7). Inter-nal Glut4 is found predominantly in small tubulo-vesicular ele-ments and vesicles that lack endosomal markers. However, 12%of the Glut4 is co-localized with endocytosed albumin in “early”and “late” endosomes under these conditions. Consistent withthis steady state subcellular distribution, Glut4 is found in twokinetically distinct pools in basal 3T3-L1 adipocytes: 70 –90% ofthe Glut4 is in a sequestered non-cycling/very slowly cyclingpool known as Glut4 storage vesicles (GSVs3; also referred to asinsulin-responsive vesicles), whereas 10 –30% remains in anactively cycling pool. Insulin increases the amount of Glut4 inthe plasma membrane by as much as 40-fold through twoeffects on Glut4 trafficking: 1) insulin decreases the proportionof Glut4 sequestered in the GSVs, and 2) insulin increases the
* Research supported by grants from the American Diabetes Association(7-08-RA-100, 1-12-BS-132, and 1-12-BS-16) and from the National Insti-tutes of Health (Grant T32 DK007058 to E. N. H.)
□S This article contains supplemental Figs. 1–3 and Tables 1–3.1 Both authors contributed equally to this work.2 To whom correspondence should be addressed: Dept. of Biochemistry and
Molecular Biology, Mailstop 330, University of Nevada School of Medicine,Reno, NV 89557. Tel.: 775-784-1155; Fax: 775-784-1419; E-mail: [email protected].
3 The abbreviations used are: GSV, Glut4 storage vesicle; �2-M, �2-macroglob-ulin; �-HA, anti-HA antibody; AF647, AlexaFluor 647; ERC, endosomal recy-cling intermediate compartment(s); IN/SUR, internal/surface; ken, kex, andkobs, endocytic, exocytic, and observed relaxation rate constant, respec-tively; ksort, kseq, kfuseE, and kfuseG, rate constant for sorting from endosomesinto ERC, sorting from endosomes into GSVs (sequestration), and transportto the plasma membrane from either ERC or GSVs (fusion), respectively;LSM, low serum medium; LYi, PI3K inhibitor LY294002; MFR, mean fluores-cence ratio (AF647/GFP; labeled Glut4/total cellular Glut4); Tf, transferrin;KD, knockdown; PM, plasma membrane; SE, sorting or “early” endo-some(s); FSC-H and SSC-H, forward and side scatter height, respectively.
THE JOURNAL OF BIOLOGICAL CHEMISTRY VOL. 289, NO. 25, pp. 17280 –17298, June 20, 2014© 2014 by The American Society for Biochemistry and Molecular Biology, Inc. Published in the U.S.A.
17280 JOURNAL OF BIOLOGICAL CHEMISTRY VOLUME 289 • NUMBER 25 • JUNE 20, 2014
by guest on October 29, 2018
http://ww
w.jbc.org/
Dow
nloaded from

overall rate constant of exocytosis (kex) of the cycling Glut4(8 –15). Insulin has little or no effect on Glut4 endocytosis (16,17).
In adipocytes, intracellular Glut4 partially co-localizes withthe transferrin (Tf) receptor, a marker for the early endosomes.However, under basal conditions, the intracellular Tf receptortraffics 5–15 times more rapidly than Glut4 (16). The rate con-stant of endocytosis of the Tf receptor is also 5 times faster thanGlut4. These data indicate that although Glut4 and the Tfreceptor show some overlap, they are largely trafficked via dif-ferent pathways/mechanisms in adipocytes. Intracellular Glut4also co-localizes with LRP1 (low density lipoprotein receptor-related protein 1), the receptor for �2-macroglobulin (�2-M)expressed in adipocytes. Like Glut4, there are two kineticallydistinct pools of LRP1 in adipocytes, a rapidly cycling pool, anda slowly cycling/non-cycling pool (16). Immunoprecipitationstudies showed that LRP1 is enriched with Glut4 and insulin-regulated aminopeptidase in the insulin-responsive GSVs (18).However, LRP1 is less efficiently packaged into the sequesteredGSV pool than Glut4 (40% LRP1 versus 70 –90% Glut4) (16). Incontrast, only a small percentage of the Tf receptor is detectedin these compartments (4).
Glut4 is not expressed in 3T3-L1 fibroblast cells prior toinduction of adipocyte differentiation (12). When Glut4 isexogenously expressed in these cells, it cycles constitutively andis not directed into highly regulated GSV compartments. Thereis only a modest 1.5–3-fold increase of exogenously expressedGlut4 at the plasma membrane in 3T3-L1 fibroblast cells (12).In contrast, insulin increases cell surface Glut4 10 –20-fold indifferentiated 3T3-L1 adipocytes. Although other cargo pro-teins found in the insulin-responsive GSVs, such as insulin-regulated aminopeptidase and LRP1, are normally expressed infibroblasts, these proteins are also not trafficked to highly insu-lin-responsive compartments until differentiation inducesexpression of adipocyte-specific factors (12, 19). Thus, compar-isons of trafficking and localization of proteins in 3T3-L1 cellsbefore and after differentiation can yield important insightsinto the proteins and pathways that contribute to the special-ized, highly regulated trafficking of Glut4 observed in adi-pocytes. For example, two proteins that play important roles inGlut4 trafficking, sortilin (20) and AS160 (21), are expressed athigh levels only in adipocytes, not in fibroblasts. Co-expressionof sortilin with exogenous Glut4 in fibroblasts is sufficient toreconstitute the effects of this protein on Glut4 stability andsorting that were observed in adipocytes (20) (data not shown).Expression of AS160 with sortilin in fibroblasts further altersGlut4 trafficking (21). However, trafficking of Glut4 to highlyinsulin-responsive GSV compartments has not yet been fullyreconstituted in fibroblast cells.
Many proteins have been identified that affect the plasmamembrane levels of Glut4 in adipocytes (5, 6). For some pro-teins, their function in Glut4 trafficking remains unclear. Wehave developed high throughput quantitative flow cytometricassays to measure the trafficking kinetics of Glut4, the Tf recep-tor, and LRP1 (15, 16). We are using these assays to functionallymap proteins to specific steps in Glut4 trafficking. For example,these assays were used to examine the specific effects of knock-down of AS160 (a negative regulator of Glut4 translocation) on
Glut4 trafficking in adipocytes (22). Careful analysis of theeffect of AS160 knockdown on Glut4 trafficking kineticsrevealed that release of Glut4 from sequestration in GSVsinvolves two sequential insulin-regulated rate-limiting steps.AS160 regulates the first of these; in the AS160 knockdowncells, Glut4 accumulated at a second insulin- and Akt-regulatedrate-limiting step that lies downstream of AS160 but upstreamof fusion with the plasma membrane. Thus, our kinetics assaysallowed for the identification of a novel insulin-regulated stepin the pathway.
The purpose of this study was to identify additional novelsites of regulation of Glut4 trafficking. We have identified sixsteps that contribute to the unique trafficking of Glut4 relativeto the constitutively recycling Tf receptor. Mathematical mod-eling and simulations were used to estimate the rate constantsfor flux through these steps. Interestingly, these models werealso able to accurately simulate the trafficking kinetics and rel-ative subcellular distribution of Glut4 previously measured inprimary adipocytes (7, 9, 23, 24). These analyses revealed thatthree steps in the Glut4 trafficking itinerary are highly regulatedby insulin. They also underscore the importance of non-insu-lin-regulated steps, such as endocytosis and degradation, incontrolling the total amount of Glut4 at the cells surface andhence in regulation of overall glucose homeostasis.
EXPERIMENTAL PROCEDURES
Tissue Culture—3T3-L1 cells were obtained from ATCC andpassaged as fibroblasts in 10% calf serum in DMEM completemedium (high glucose DMEM supplemented with 2 mM L-glu-tamine, 50 units/ml penicillin, and 50 �g/ml streptomycin).Fibroblasts were plated at just subconfluence (they reachedconfluence with 24 h). They were then refed in completemedium with 10% calf serum and used for experiments 1–2days postconfluence. Cells were differentiated into adipocytesfor use in experiments as described previously (15).
Viral Infections—The lentiviral HA-Glut4/GFP reporter pro-tein was prepared and transduced into fibroblasts as describedpreviously (15). Cells were infected at a viral titer that resultedin �50% of the cells expressing the construct. At this titer, themajority of infected cells contained only one virion, and nocytopathic effects were detectable (15, 22). The uninfected cellsserve as internal controls to correct for cellular autofluores-cence and nonspecific antibody binding/uptake. This reporterhas been carefully characterized; when expressed at the lowlevels observed in our infected cells, the HA-Glut4/GFPreporter traffics with endogenous Glut4 (14, 15, 25, 26).
Antibodies and Reagents—HA.11 monoclonal antibody(�-HA; Covance) was purchased as ascites and purified usinga 1-ml rProteinA-FF column (GE Healthcare) as describedpreviously (15). Purified antibody was labeled with anAlexaFluor647 (AF647) protein labeling kit according to themanufacturer’s instructions (Invitrogen), and free dye wasremoved by desalting twice into PBS using 10-ml Zeba spincolumns (7000 molecular weight cut-off, ThermoScientific)(16). Human �2-M was purchased from AssayPro and labeledusing an AF647 monoclonal antibody labeling kit according themanufacturer’s instructions (Invitrogen) (16). �2-M was acti-vated using methylamine as described previously (27). Free dye
Trafficking of Glut4 and LRP1 in Fibroblasts and Adipocytes
JUNE 20, 2014 • VOLUME 289 • NUMBER 25 JOURNAL OF BIOLOGICAL CHEMISTRY 17281
by guest on October 29, 2018
http://ww
w.jbc.org/
Dow
nloaded from
and excess methylamine were removed from labeled and acti-vated �2-M using a 5-ml HiTrap desalting column (GE Health-care). Protein concentrations and labeling efficiency weredetermined by absorption spectroscopy (15).
Glut4 Translocation Assay/Surface Glut4 Labeling—Cellsexpressing HA-Glut4/GFP were incubated for 2 h in low serummedium (LSM; DMEM complete medium and 0.5% fetalbovine serum). Cells were then incubated with or without 100nM insulin for 45 min. To label surface Glut4, cells were rapidlychilled on an ice-water slurry and labeled with LSM containing50 �g/ml AF647-�-HA for 1 h on ice. Antibody was removed,and cells were washed, collagenase-digested, and analyzed byflow cytometry as described below (16, 22).
Steady-state Anti-HA Antibody (�-HA) Uptake Assay—Cellswere serum-starved in LSM as described above. For insulin-stimulated uptake, some cells were incubated with 100 nM insu-lin for the last 45 min of starvation. At various times, the incu-bation medium was replaced with 30 �l of warm LSMcontaining 50 �g/ml AF647-�-HA with or without 100 nM
insulin, and incubation continued. At the end of the timecourse, cells were chilled, washed, collagenase-digested, andanalyzed by flow cytometry (16, 22). The data show an increasein AF647-�-HA labeling from an initial level to a maximumplateau. Under the conditions of this assay, cell surface HA-Glut4 is nearly instantaneously labeled, and the antibodyremains bound throughout the assay. Thus, at t � 0 (extrapo-lated), the labeling is equal to the steady state level of Glut4at the cell surface, and the increase in labeling with time measuresthe exocytosis of intracellular Glut4 at a rate corresponding tothe overall exocytosis due to all exocytic processes (13). Theplateau level measures the size of the total pool of Glut4 that iscycling between the cell surface and the intracellular pools. Thesize of this pool is dependent on both the total amount ofHA-Glut4/GFP expressed in the cell and the proportion of thetotal that is in actively cycling pools versus non-cycling pools.To correct for differences in the level of expression of thereporter construct in different cell types, mean fluorescenceratio (MFR) values were calculated for each sample (mean fluo-rescence of AF647/mean fluorescence of GFP). A difference inthe maximum value of MFR (MFRmax) between cell types orexperimental conditions indicates that there are differences inthe proportion of the total cellular Glut4 that is cycling. Thenon-cycling pools include both Glut4 that can be mobilized (i.e.in the sequestered GSV pool) and Glut4 that cannot be mobi-lized with insulin (in the biosynthetic or degradative compart-ments). The �-HA data are expressed as the proportion of thetotal Glut4 that can be labeled in insulin-stimulated cells that islabeled at each time point (MFR/MFRmax insulin). The exocyto-sis rate constants, kex, were determined from fits of mathemat-ical models to these data.
Glut4 Transition Experiments—Cells were serum-starved for2 h as described above. For the basal to insulin transition, 100nM insulin was added to cells for increasing amounts of time.For the transition from the insulin-stimulated to the phosphati-dylinositol 3-kinase (PI3K)-inhibited state, insulin was addedfor the final 45 min of preincubation in LSM, and then the PI3Kinhibitor LY294002 (LYi, 50 �M; EMD Biochemicals) wasadded for increasing amounts of time. Cells were placed on ice;
surface Glut4 was labeled as described above; and then cellswere washed, collagenase-digested, and analyzed by flowcytometry. In this protocol, the data indicate the level of Glut4present in the plasma membrane at each time point and mea-sure the rate of transition from one steady state to a new steadystate. The kinetics of these transitions are determined by a com-bination of both exocytotic and endocytotic processes acting inthe cells (e.g. kobs � kex � ken, for a two-rate/two-compartmentmodel of the process). However, PI3K inhibitors inhibit Glut4exocytosis �90% with no effect on endocytosis (16). Thus, inthe insulin � LYi transition experiments, the rate of transitionobserved is largely determined by endocytosis alone, and fits ofsingle exponential decay functions to this data yield estimatesof the endocytic rate constant, ken. This method for measuringken has been validated using two independent measures (16).Mathematical models were fit to the data as described below.
Transferrin Efflux—Uninfected cells were labeled with 5�g/ml AF647-holo-Tf for 30 min at 37 °C. Cells were quicklywashed and then incubated at 37 °C in LSM with 500 �g/mlunlabeled holo-Tf for increasing amounts of time. Sampleswere then rapidly chilled in an ice-water slurry, collagenase-treated at 4 °C, and analyzed. Incubation of cells in excess unla-beled holo-Tf was sufficient to remove all surface label. In theseexperiments, iron-loaded Tf (holo-Tf) binds with high affinityto its receptor at the cell surface. Once it is internalized, the Tfloses its bound iron in the low pH of the endosomes, but theiron-depleted Tf (apo-Tf) remains bound to its receptor as it isrecycled from the endosomes back to the plasma membrane.Once it reaches the cell surface, the apo-Tf dissociates from itsreceptor and is displaced by unlabeled holo-Tf. Thus, the loss ofAF647 labeling measures the rate of exocytosis of a bolus oflabeled Tf. Data were fitted using a single exponential decayfunction, the rate of which was the exocytosis rate constant, kex(16). The endocytic rate constant, ken, was calculated from themeasured kex and the partition coefficient, P (P � kex/ken �PM/(1 � PM)) as described previously (10, 16).
�2-M Uptake and Surface Labeling—Cells were incubated inserum-free DMEM (DMEM complete medium and 0.5% BSA)for 2 h and then incubated with or without 100 nM insulin for 30min. Cells were then incubated in 4 �g/ml AF647-�2-M forincreasing amounts of time. Cells were placed on ice, and addi-tional wells on the same plate were incubated with 4 �g/mlAF647-�2-M for 90 min to label surface LRP1. Cells were gentlywashed with 200 �l of cold PBS and collagenase-digested for 10min at 37 °C, allowing surface-bound AF647-�2-M to be inter-nalized to prevent loss during analysis. Cells were analyzed byflow cytometry as described below. In these experiments, �2-Mbinds with high affinity to its receptor (LRP1) at the cell surfacebut dissociates from its receptor when it reaches the low pH ofthe endosomes. LRP1 recycles back to the plasma membrane,where it binds additional ligand and is reinternalized. Thelabeled �2-M is retained within the cell and delivered to thelysosomes for degradation. Thus, the linear increase of AF647with time measures the rate of endocytosis of LRP1. The rateconstant of LRP1 endocytosis (ken) was determined accordingto the method of Wiley and Cunningham (28). The internal tosurface (IN/SUR) ratio for each time point was determined; theslope of the IN/SUR versus time plot is equal to ken. Data were
Trafficking of Glut4 and LRP1 in Fibroblasts and Adipocytes
17282 JOURNAL OF BIOLOGICAL CHEMISTRY VOLUME 289 • NUMBER 25 • JUNE 20, 2014
by guest on October 29, 2018
http://ww
w.jbc.org/
Dow
nloaded from

fit using linear equations. The exocytic rate constant, kex, wascalculated from ken and the partition coefficient, P, as describedpreviously (16). Relative surface levels of �2-M binding/LRP1receptor were verified in independent samples by labeling withbiotin-conjugated anti-LRP1 antibody (clone 8G1, FitzgeraldIndustries International), followed by AF647 streptavidin(Invitrogen).
Flow Cytometry—Flow cytometry, gating, and analysis wereperformed essentially as described (15, 16, 22). Labeled cells in96-well plates on ice were washed three times with 200 �l ofice-cold PBS. Adipocytes were incubated with 20 �l of collagen-ase (Type III; 1 mg/ml in PBS with 2% BSA; Worthington) at 37or 4 °C for 10 min and then resuspended in 180 �l of PBS. Forexperiments with fibroblasts, cells were resuspended in 180 �lof PBS, 0.5 mM EDTA (after incubation for an additional 10 minat 37 °C). Resuspended cells were gently filtered through a100-�m cell strainer to remove clumps of cells and analyzed onan Accuri C6 cytometer. Detection thresholds for adipocyteswere set at 1,000,000 for forward scatter height (FSC-H) and500,000 for side scatter height (SSC-H). For fibroblast analysis,the sole threshold was 750,000 for FSC-H. Log intensities ofscattered light (forward and side scatter) and fluorescence (FL1,488 nm excitation/533 nm emission; FL2, 488 nm excitation/585 nm emission; FL3, 488 nm excitation/�670 nm emission;FL4, 640 nm excitation/675 nm emission) were collected foreach cell. For analysis of adipocytes, selective gating usingCFlow Plus software (Accuri) was used to analyze only the adi-pocytes in the sample, excluding any residual fibroblasts andcellular debris as described previously (15). For analysis offibroblasts, cells were gated in the two-dimensional histogramof FSC-H versus SSC-H. For either cell type, cells infected withHA-Glut4/GFP could be distinguished from uninfected cells ina two-dimensional histogram of FL1-H (GFP) versus FL3-H(autofluorescence). The geometric mean fluorescence of gatedpopulations was determined using FCS Express (De Novo Soft-ware). The mean fluorescence values of uninfected cells are ameasure of cellular autofluorescence (FL1) and nonspecificantibody labeling (FL4) and were subtracted from the meanvalues of FL1 and FL4 measured for the infected cells in thesame sample, before the MFR values were calculated (22). Foranalysis of �2-M or Tf uptake or binding, adipocytes or fibro-blasts were gated as described above, and fluorescence levelswere quantified as the geometric mean of FL4 (AF647); themean autofluorescence measured in unlabeled cells was sub-tracted from these values.
Data Analysis—Fits of models to the data were performedusing GraphPad Prism version 5.0 for Windows/Mac(GraphPad Software, San Diego, CA) as well as custom codeimplemented in Matlab (MATLAB and Statistics ToolboxRelease 2013a, The MathWorks, Inc., Natick, MA). All fits weredone on combined data sets, including the data points fromeach of n � 5–19 individual experiments. The rate constantsobtained from the fits of the combined data were comparedwith the average of the rate constants obtained from fits of eachindependent experiment and were always in good agreement.The statistical significance of observed differences betweensteady state distributions under different experimental condi-tions was assessed by either t test or two-way analysis of vari-
ance (Figs. 1, 5A, and 6A), whereas differences between exper-imental conditions for the kinetics data were assessed bycomparing fits of the data sets using either single exponents(Figs. 2 and 3) or lines (Figs. 5 (C and D) and 6 (C and D)) andcalculating the p value for the null hypothesis that both sets ofdata were best fit by the same function (***, p � 0.0001; **, p �0.001; *, p � 0.01).
Three simple mathematical models of Glut4 exocytosis werecompared for each cell type (fibroblasts versus adipocytes) andexperimental condition (basal versus insulin-stimulated) (sup-plemental Fig. 1): 1) dynamic equilibrium, single exponent to 1(a single exocytic pathway with a single intracellular pool ofGlut4) (11, 14); 2) static retention, single exponent to MFRmax(a single exocytic pathway with two pools of Glut4, an activelycycling pool and a sequestered (non-cycling) pool) (12, 13); and3) two exocytic pathways, two exponents to 1 (two intracellularpools of Glut4 with independent exocytic pathways). Indynamic equilibrium, the total amount of Glut4 that is cycling isinsulin-independent, whereas in static retention, the totalamount of Glut4 that is cycling is insulin-dependent. In thetwo-exocytic pathway model, the distribution of Glut4 betweenthe two intracellular pools is insulin-dependent, but the total isinsulin-independent. To compare the models, the �-HA uptakedata in Fig. 3 were fit in PRISM using the following mathemat-ical functions: dynamic equilibrium, a single exponent con-strained to a reach a plateau of 1 (but not constrained to start at0); static retention, a single exponent with a variable plateau(not constrained to start at 0); and two exocytic pathways, twoexponents constrained to reach a combined plateau of 1 (notconstrained to start at 0). For these fits, the Akaike informationcriterion method was used to select the model most likely tohave generated the data.
To compare the ability of more complicated models to sim-ulate the behavior of Glut4, simultaneous fits of four data setswere done. The data sets included two �-HA uptake experi-ments (basal and insulin; Fig. 3) and two transition experiments(basal to insulin and insulin � LYi; Figs. 2 and 4) for each celltype. Systems of coupled ordinary differential equations wereidentified for each model explicitly representing the output ofeach type of experiment (see supplemental material and sup-plemental Tables 1 and 2). These were then fitted using a com-bination of numerical integration and nonlinear least squaresregression to optimize the parameter values simultaneouslyover the entire range of experiments and experimental data.
The coupled ordinary differential equation systems weresolved using a one-step explicit Dormand-Prince (Runge-Kutta) method (29), and the nonlinear regression fitting theseto the data employed a reflective trust region least-squares algo-rithm (30 –34) implemented in Matlab. From this, both esti-mates of the parameter values and the 95% confidence intervalscould be determined. In performing a nonlinear regression todata, the width of the confidence interval in S.E. values is relatedto the percentage of observations falling within the confidenceinterval. To estimate the S.E., Student’s t inverse cumulativedistribution function was used to calculate the number of S.E.values spanned by the confidence interval (35). Finally, the con-fidence interval was divided by the number of S.E. values
Trafficking of Glut4 and LRP1 in Fibroblasts and Adipocytes
JUNE 20, 2014 • VOLUME 289 • NUMBER 25 JOURNAL OF BIOLOGICAL CHEMISTRY 17283
by guest on October 29, 2018
http://ww
w.jbc.org/
Dow
nloaded from

spanned by the confidence interval to find the S.E. for theparameter.
RESULTS
Differentiation Increases Glut4 Protein Stability and Alters ItsSubcellular Distribution—Glut4 is not expressed in undifferen-tiated 3T3-L1 fibroblasts. Differentiation induces the expres-sion of not only Glut4 but also the proteins required for itsspecialized insulin-dependent trafficking (12, 20, 21). This isclear when an exogenously expressed HA-Glut4/GFP reporterconstruct is expressed in both cell types (Fig. 1). In fibroblasts,insulin has only a modest effect on the distribution of HA-Glut4/GFP (a transient 1.8-fold increase, which decreases to a stable1.5-fold increase; Figs. 1A and 4). In contrast, insulin increasescell surface HA-Glut4/GFP 26-fold in adipocytes.
Whereas -fold stimulation shows insulin responsiveness, thetotal amount of Glut4 at the plasma membrane controls therate of glucose transport in adipocytes and muscle. As expected,differentiation decreased total Glut4 at the plasma membrane4.2-fold in basal adipocytes compared with fibroblasts (Fig. 1B).Unexpectedly, differentiation increased Glut4 at the plasmamembrane 4-fold after insulin stimulation.
The increase in cell surface Glut4 in insulin-stimulated adi-pocytes relative to fibroblasts is largely due to an increase in Glut4expression. Differentiation increased the total amount of theHA-Glut4/GFP reporter in cells 3.2-fold (Fig. 1C). This is due to anincrease in the stability of the Glut4 protein and not due to tran-scriptional regulation. The phosphoglycerate kinase 1 promoterused to express the exogenous reporter does not show differenti-ation dependence when used to express GFP alone (data notshown). In contrast, the widely used CMV promoter is highly sup-pressed in adipocytes relative to the fibroblasts when used for thestable expression of proteins in the lentiviral vector (data notshown). An increase in Glut4 protein will lead to a proportionalincrease in cell surface Glut4, independent of effects on trafficking.
In 3T3-L1 fibroblasts, 10% of the total Glut4 is at the plasmamembrane in basal cells, and 14.6% is at the plasma membraneafter insulin stimulation (Fig. 1D and Table 1). After adipocytedifferentiation, 0.7% of the total is at the plasma membranein basal cells, whereas 18.4% is at the plasma membrane afterinsulin stimulation. Thus, differentiation caused a 13.5-folddecrease in the percentage of total Glut4 in the plasma mem-brane in basal adipocytes relative to fibroblasts and a 26%increase in the percentage of total Glut4 in the plasma mem-brane after insulin stimulation (Fig. 1D). A change in the rela-tive distribution of Glut4 between the cell surface and intracel-lular pools requires effects on Glut4 trafficking. Therefore,differentiation affects Glut4 trafficking under both basal andinsulin-stimulated conditions.
Differentiation Slows the Rate of Glut4 Endocytosis in bothBasal and Insulin-stimulated Cells—Glut4 is actively cyclingbetween the plasma membrane and intracellular pools underboth basal and insulin-stimulated conditions. The percentageof Glut4 at the plasma membrane is dependent on the rate ofinsertion into the plasma membrane (exocytosis) and rate ofretrieval from the plasma membrane (endocytosis) as well as
the size of the actively cycling pool.4 Therefore, if the propor-tion of the total Glut4 at the plasma membrane changes afterdifferentiation, then differentiation must be affecting one ofthese elements. The rates of endocytosis and exocytosis aredependent on the intrinsic rate constants of endocytosis (ken)and exocytosis (kex) as well as the amount of Glut4 in the plasmamembrane and intracellular cycling pool. The distribution ofGlut4 in the plasma membrane versus the intracellular cyclingpool as well as the overall rate constants of endocytosis andexocytosis can be estimated via two independent assays (16).
To measure Glut4 endocytosis, cells were treated with thePI3K inhibitor LYi to inhibit exocytosis, and the loss of cellsurface Glut4 with time was measured (Fig. 2A). In this assay,the rate constant for the relaxation to the new steady state dis-tribution of surface Glut4, kobs, is approximately equal to theendocytosis rate constant, ken. Differentiation caused a 40%decrease in ken, from 0.2 min�1 in fibroblasts to 0.12 min�1 inadipocytes (Table 1). Insulin had no effect on this rate constantin either cell type (Fig. 2A) (16). Thus, Glut4 is internalizedsignificantly more slowly in adipocytes than in fibroblasts. Adecrease in ken, with no effect on kex, will increase the amount ofGlut4 on the cell surface. Interestingly, using similar assays, theendocytic rate constant measured in primary adipocytes wasvery slow, �0.053 min�1 (0.047– 0.059 min�1) (9, 23, 24).
In adipocytes and muscle, Glut4 is internalized via two dif-ferent routes: one that is nystatin-sensitive and one that is nys-tatin-insensitive and AP2- and clathrin-dependent (5, 17, 36,37). We therefore examined whether Glut4 is internalized via anystatin-sensitive endocytic pathway in fibroblasts as well as inadipocytes. Nystatin transiently increased cell surface Glut41.5-fold in basal fibroblasts and 3-fold in basal adipocytes (Fig.2B). This increase is due to a transient 40% inhibition of ken inbasal fibroblasts and a more sustained 70% inhibition in basaladipocytes. Thus, Glut4 is internalized via a nystatin-depen-dent pathway in fibroblasts as well as in adipocytes. Therefore,the difference in endocytosis between fibroblasts and adi-pocytes is not due to differential expression of the nystatin-de-pendent pathway. In addition, the nystatin-sensitive pathway isthe major pathway in basal cells, whereas the nystatin-insensi-tive pathway is the predominant pathway after insulin stimula-tion in both cell types. Despite this shift in mechanism of inter-nalization, however, insulin has little to no effect on the ken forGlut4 in either cell type, indicating that the two pathways havesimilar rate constants (16, 17).
Differentiation Slows the Rate of Glut4 Exocytosis, but Onlyunder Basal Conditions—To measure Glut4 exocytosis, basalor insulin-stimulated cells were incubated at 37 °C with AF647-labeled �-HA, and the accumulation of labeled antibody wasmeasured with time (Fig. 3) (16, 22). Within the time resolu-tion in these experiments, Glut4 is instantly labeled. BecauseGlut4 remains labeled as it cycles through the cell, the rateconstant for antibody uptake, kobs, is the overall exocytosisrate constant, kex, due to all processes bringing Glut4 to theplasma membrane.
4 Glut4 that is not cycling (i.e. that is accumulated in biosynthetic or degrada-tive compartments) or that is sequestered in non-cycling GSVs does nottraffic to the plasma membrane or contribute to cell surface Glut4.
Trafficking of Glut4 and LRP1 in Fibroblasts and Adipocytes
17284 JOURNAL OF BIOLOGICAL CHEMISTRY VOLUME 289 • NUMBER 25 • JUNE 20, 2014
by guest on October 29, 2018
http://ww
w.jbc.org/
Dow
nloaded from

In fibroblasts, �-HA uptake rapidly approached a plateauvalue, with a t1⁄2 � 30 min in basal cells and t1⁄2 � 20 min afterinsulin stimulation. The proportion of the total that is labeleddid not change after insulin stimulation in these cells (theMFRmax did not change with insulin stimulation in fibroblasts;MFR � AF647-�-HA/GFP). In insulin-stimulated adipocytes,�-HA uptake also rapidly approached a plateau value, with at1⁄2 � 25 min. Thus, differentiation had little effect on exocytosisof Glut4 after insulin stimulation. Differentiation also had littleeffect on the proportion of the total cellular Glut4 that is labeledafter insulin stimulation (MFRmax was not statistically differentin fibroblasts and insulin-stimulated adipocytes; data notshown). Therefore, there is not a significant difference in thetwo cell types in the proportion of Glut4 accumulated innon-cycling pools (i.e. in the biosynthetic or degradativepathways). The major effect of differentiation on Glut4 traf-ficking was a large decrease in the rate of exocytosis of Glut4in basal adipocytes. Less than 25% of the total HA-Glut4/GFP in the cell that can be labeled after insulin stimulationwas labeled in basal adipocytes after a 5-h incubation. �-HAuptake had not reached a plateau value by the end of theexperiment in basal cells.
Two Kinetically Distinct Pathways Are Required to AccuratelySimulate the Basal Trafficking of Glut4 after Differentiation—The�-HA uptake data for fibroblasts and for adipocytes after insu-lin stimulation is well fitted using a single exponent (dynamicequilibrium, single exponent to 1; Supplemental Fig. 1A). Usingsingle exponential fits, the estimated values for kex for Glut4were 0.025 min�1 in basal fibroblasts, 0.038 min�1 in insulin-stimulated fibroblasts, and 0.027 min�1 in insulin-stimulatedadipocytes (Table 1). These values are similar to the estimatedvalue for kex for Glut4 in primary adipocytes after insulin stim-ulation (0.032 min�1), when measured at steady state underconditions similar to our assays (cells maintained at 37 °C in thecontinuous presence of insulin) (9).
In contrast, the �-HA uptake data in basal 3T3-L1 adipocytescan only be well fit by a single exponent if the model includes anon-cycling (static) sequestered pool (static retention, singleexponent to MFRmax; supplemental Figs. 1B and 2B) (12, 13, 15,16). In this model, the total amount of Glut4 that is cycling isinsulin-dependent. Fits of the basal data with this model yieldkex � 0.006 min�1 and MFRmax � 0.31 (�70% of the Glut4 issequestered in non-cycling GSVs; Table 1). The basal adipocyteuptake data are not well fit if the model is forced to reach aplateau of 1 (supplemental Fig. 2A) (12, 13, 15, 16). Comparingthe two models using the Akaike information criterion,dynamic equilibrium was rejected in favor of static retention(86.5% probability that static retention is the model that gener-
FIGURE 1. Differentiation increases Glut4 stability, promotes basal intra-cellular retention, and enhances Glut4 translocation after insulin stimu-lation. 3T3-L1 fibroblasts (Fib; gray) or adipocytes (Adip, white) expressingHA-Glut4/GFP were incubated with or without 100 nM insulin and placed onice, surface Glut4 was labeled with AlexaFluor647-conjugated �-HA antibody(AF647-�-HA), and cells were analyzed by flow cytometry. Data are the
means � S.D. (error bars) of n � 4 –10 independent experiments. A, -foldincrease of surface Glut4 (insulin/basal for each cell type). B, surface Glut4.Data are mean AF647-�-HA, standardized to fibroblast basal values. Fibro-blasts: basal, 1 � 0.13; insulin, 1.5 � 0.002. Adipocytes: basal, 0.24 � 0.1;insulin, 5.9 � 0.23. C, total HA-Glut4/GFP. Data are mean GFP, standardized tothe average fibroblast value. Fibroblasts, 1.0 � 0.22; adipocytes, 3.2 � 0.6. D,surface/total Glut4; surface AF647-�-HA/total maximum AF647-�-HA uptakeafter insulin stimulation (Fig. 3). Fibroblasts: basal, 0.1 � 0.01; insulin, 0.146 �0.002. Adipocytes: basal, 0.0074 � 0.003; insulin, 0.184 � 0.007. A, ***, p �0.0001, basal versus insulin. B–D, **, p 0.001; ***, p � 0.0001, fibroblastsversus adipocytes.
Trafficking of Glut4 and LRP1 in Fibroblasts and Adipocytes
JUNE 20, 2014 • VOLUME 289 • NUMBER 25 JOURNAL OF BIOLOGICAL CHEMISTRY 17285
by guest on October 29, 2018
http://ww
w.jbc.org/
Dow
nloaded from

ated the observed data, with a ratio of probabilities � 6.4). Thetwo models yield nearly identical fits of the fibroblast data andthe adipocyte data after insulin stimulation.
The data in Figs. 1–3 were analyzed using the static retentionmodel to describe the trafficking of the actively cycling Glut4.Mathematically, this is a two-step/two-compartment modelwith two rate constants: ken (plasma membrane to endosomes)and kex (endosomes to plasma membrane), with the totalamount of Glut4 dependent on insulin. The ratio of Glut4 in theplasma membrane (PM) versus sorting endosomes (SE) is thepartition coefficient, P, which is equal to the ratio of the rateconstants for exocytosis and endocytosis (P � kex/ken �PM/SE) (10, 22). The amount of Glut4 at the plasma membraneis also dependent on the size of the cycling pool, MFRmax. Thus,PMcalc � MFRmax (P/(1 � P)).
As previously observed (16, 22), there is good agreementbetween the measured values and the calculated expected val-ues of Glut4 in the plasma membrane in 3T3-L1 fibroblasts andadipocytes after insulin stimulation (Table 1). Application ofthis same analysis to the data from primary adipocytes afterinsulin stimulation also shows excellent agreement betweencalculated and measured values (P � 0.032/0.053; PMcalc �38%, PMmeasured � 39 – 42%) (7, 9, 10, 22). In contrast, the cal-culated value for surface Glut4 in basal adipocytes is twice ashigh as the observed value (PMcalc � 0.015; PMmeasured � 0.007;Table 1). Therefore, the static retention model is insufficient tofully account for the basal data.
Alternatively, the basal �-HA uptake data can be fit using twoexponents. In this model, the intracellular Glut4 is present intwo separate intracellular pools with different exocytic rateconstants. Two-exponent fits of the basal data yield a small poolthat is exocytosed rapidly (Total1 � 0.09, kex1 � 0.032 min�1)and a large pool that is exocytosed very slowly (Total2 � 0.91,kex2 � 0.0007 min�1). This model is the preferred model rela-tive to static retention for the basal uptake data (80% probabilitythat observed data were generated by a process with two poolswith different exocytic rate constants rather than a cycling pooland a non-cycling static pool; ratio of probabilities � 4). Incontrast, the two-exponent model is rejected for the uptakedata from the fibroblasts and from adipocytes after insulinstimulation (�99.99% probability that the one-exponent modelis correct). Thus, in basal adipocytes, the data can be best fit bya model with two pathways for exocytosis: a constitutive path-way with kinetics similar to the pathway observed in fibroblasts(the endosomal recycling pathway through endosomal recy-cling intermediate compartments (ERC) (kfuseE � 0.032 min�1,
total in ERC � 9%) and a specialized pathway through GSVsthat is very highly regulated by insulin (kfuseG � 0.0007 min�1,total in GSVs � 91%; supplemental Figs. 1C and 2C). Incontrast, in fibroblasts and in adipocytes after insulin stimulation,Glut4 is either predominantly exocytosed via a single pathway orthrough multiple pathways with similar rate constants.
Although the exocytic rate constants and relative amounts ofGlut4 in each pathway can be determined from two-exponen-tial fits of the basal �-HA uptake data, the expected level ofGlut4 at the plasma membrane cannot be calculated from thesefits. A more complicated mathematical model that includespathways for delivery of Glut4 into the two pools from theplasma membrane was needed to simulate the Glut4 traffickingdata. In order to help build this model, the kinetics of traffickingof Glut4 in fibroblasts and adipocytes was examined in moredetail.
Three Sequential Steps Are Required to Accurately Simulatethe Trafficking of Glut4 in Fibroblasts and AS160 Knockdown(KD) Adipocytes—The cell surface, �-HA uptake, and insulin �LYi transition data yield information about the rates of inser-tion and retrieval of Glut4 from the plasma membrane. How-ever, these assays cannot resolve individual steps in the intra-cellular trafficking pathways; the measured rate constants, kenand kex, are the net result of all steps in multiple traffickingpathways. In contrast, measuring the kinetics of the transitionfrom the basal to insulin-stimulated state can resolve interme-diate steps in the intracellular pathways (10, 22). For example,previous work using cells in which AS160 was knocked downshowed that there are at least two sequential insulin-regulatedsteps in the Glut4 exocytic pathway in adipocytes (22). There isan overshoot in the basal to insulin transition experiment inadipocytes after AS160 knockdown that cannot be simulatedusing a model with a single rate-limiting step in the exocyticpathway.
There is also an overshoot observed in fibroblasts in the basalto insulin transition experiment (Fig. 4). Glut4 transientlyincreases at the plasma membrane 1.8-fold within 5 min afterinsulin stimulation. This increase then gradually decays to only1.5-fold by 30 – 40 min. A mathematical model with a singlerate-limiting step in exocytosis is insufficient to account for thisovershoot (dotted line). Thus, the basal to insulin transitiondata show that Glut4 traffics through multiple kinetically dis-tinct sequential steps in fibroblasts.
To determine the minimal model that accurately describesthe observed fibroblast data, simultaneous fits to a three-stepmodel (supplemental Fig. 1D) were done for the fibroblast data
TABLE 1Summary of rate constants (k) and distribution of proteins (fraction of total) in the PM and sequestered/noncycling GSVsRate constants and distributions were measured or calculated (calc) from the following equations as described (Figs. 1–5): GSV � 1 � MFRmax; P � kex/ken; PMcalc �MFRmax (P/1 � P); ken(calc) � kex ((1 � PM)/PM); kex(calc) � ken (PM/(1 � PM)).
GLUT4 Tf receptor �2-MR (LRP1)PM ken kex GSV PMcalc PM ken(calc) kex PM ken kex(calc)
min�1 min�1 min�1 min�1 min�1 min�1
FibroblastsBasal 0.10 0.2 0.025 0.11 0.25 0.6 0.2 0.22 0.41 0.10Insulin 0.146 0.2 0.038 0.16 0.25 0.6 0.2 0.24 0.41 0.11
AdipocytesBasal 0.007 0.12 0.006 0.69 0.015 0.17 0.6 0.12 0.069 0.28 0.021Insulin 0.184 0.12 0.027 0.18 0.25 0.6 0.2 0.112 0.34 0.043
Trafficking of Glut4 and LRP1 in Fibroblasts and Adipocytes
17286 JOURNAL OF BIOLOGICAL CHEMISTRY VOLUME 289 • NUMBER 25 • JUNE 20, 2014
by guest on October 29, 2018
http://ww
w.jbc.org/
Dow
nloaded from

in Figs. 2– 4 (four different experiments: two �-HA uptakeexperiments, basal and insulin, and two transition experiments,insulin � LYi and basal to insulin). The three-step modelincludes three sequential rate constants: ken (PM to SE), ksort(SE to ERC), and kfuseE (ERC to PM). The overall exocytic rateconstant, kex, is a function of both ksort and kfuseE. Threehypotheses were utilized to model the effect of insulin on thesystem: ksort regulated by insulin (�ksort); kfuseE regulated by
FIGURE 2. Differentiation decreases the rate constant of Glut4 endo-cytosis (ken) by 40%. A, 3T3-L1 fibroblasts (gray) or adipocytes (white)expressing HA-Glut4/GFP were incubated with (Ins; squares) or without(Bas; circles) 100 nM insulin for 45 min, and then either the PI3K inhibitorLYi (50 �M) (A) or nystatin (50 �g/ml) (B) was added for the indicated times(LYi inhibits exocytosis, and nystatin inhibits endocytosis of Glut4). Cellswere placed on ice, labeled with AF647-�-HA, and analyzed by flowcytometry. A, data points are the average surface/total Glut4 � S.E. (errorbars) for n � 3– 6 (fibroblast) or 16 (adipocyte) independent experiments.Lines, single exponential fits (kobs � ken) (16) Fibroblasts: basal, ken �0.22 � 0.01 min�1; insulin, ken � 0.21 � 0.03 min�1; adipocytes: insulin,ken � 0.12 � 0.005 min�1). **, p 0.001, fibroblasts versus adipocytes. B,data are the average of means � S.E. of surface Glut4, standardized tocontrol insulin, from two independent experiments. p 0.001 controlversus �nystatin in both basal fibroblasts and adipocytes at the maximaleffect of nystatin treatment (5–10 min fibroblasts, 20 – 60 min adipocytes;n � 4 –12 samples).
FIGURE 3. Differentiation decreases the rate constant of Glut4 exocytosis(kex) and sequesters Glut4 in basal adipocytes. 3T3-L1 fibroblasts (gray) oradipocytes (white) expressing HA-Glut4/GFP were incubated with (squares) orwithout (circles) insulin (100 nM) for 45 min and then incubated with AF647-�-HA (with or without insulin) at 37 °C for the times indicated. Individual datapoints from n � 6 (fibroblasts) or n � 9 (adipocytes) independent experi-ments are shown. Data points are the average MFR (AF647/GFP) of n � 2–3samples, �1000 cells/sample, standardized to MFRmax insulin for each inde-pendent experiment (Labeled/Total Glut4). Lines, single exponent to MFRmaxfits of the combined data sets (kobs � kex; MFRmax � cycling pool). Fibroblasts:basal, kex � 0.025 � 0.003 min�1, MFRmax � 0.98 � 0.02; insulin, kex � 0.038 �0.005 min�1, MFRmax � 0.98 � .014. Adipocytes: basal, kex � 0.006 � 0.002min�1, MFRmax � 0.31 � 0.05; insulin, kex � 0.027 � 0.002 min�1, MFRmax �1.0 � 0.02. ***, p 0.0001 basal adipocytes versus insulin-stimulated adi-pocytes or fibroblasts. Error bars, S.D.
Trafficking of Glut4 and LRP1 in Fibroblasts and Adipocytes
JUNE 20, 2014 • VOLUME 289 • NUMBER 25 JOURNAL OF BIOLOGICAL CHEMISTRY 17287
by guest on October 29, 2018
http://ww
w.jbc.org/
Dow
nloaded from

insulin (�kfuseE); and both ksort and kfuseE regulated by insulin(�ksort and �kfuseE), with the other rates held constant (insulin-independent; Table 2 and supplemental Table 3, a and b). Tomodel the transitions, the system is assumed to instantly
change to the new rate constants upon application of insulinor LYi. The total recycling pool was constrained to beinsulin-independent.
In order to simulate the observed overshoot in fibroblasts,the third rate constant, kfuseE, must be rate-limiting in basalcells, whereas the second rate constant, ksort, must be rate-lim-iting after insulin stimulation. The fibroblast data can be wellsimulated using a three-step model with only kfuseE regulated byinsulin (Fig. 4A, solid line). This fit yielded well defined rateconstants (with S.E. values 10%) for all three steps and anexcellent goodness of fit (R2 � 0.95; supplemental Table 3a). Anunconstrained free fit of the data, allowing both kfuseE and ksortto change with insulin, gave nearly the same fit as allowing onlykfuseE to change, except that both basal and insulin ksort werepoorly defined (they had very large S.E. values; see supplemen-tal Table 3b). This analysis indicates that there are two rate-lim-iting steps in Glut4 trafficking through the constitutive pathway infibroblasts and that insulin increases the rate of transit through thesecond step, with little or no effect on the first.
In contrast to fibroblasts, there was no overshoot observed inthe basal to insulin transitions in adipocytes. In an uncon-strained simultaneous fit of the adipocyte data, the three-stepmodel is essentially reduced to a two-step model, with ksort ��kfuse (Table 2). In contrast to the fits from fibroblast data, ksortremained poorly defined (supplemental Table 3c). Althoughthis model yields a good fit of the transition data (Fig. 4B, solidline), it is not a good fit of the basal �-HA uptake data in adi-pocytes (supplemental Fig. 2D). This model requires an addi-tional non-cycling (static) pool to accurately simulate the kinet-ics data in adipocytes.
As observed in fibroblasts, the three-step model yields anexcellent fit of the transition experiment in AS160 KD adi-pocytes (Fig. 4C, solid line). The fusion step is rate-limiting inbasal AS160 KD cells, whereas the trafficking step is rate-limit-ing after insulin stimulation (Table 2). However, the fusion stepis much slower in the basal AS160 KD adipocytes than in fibro-blasts, and it is more highly regulated by insulin. In these fits,the three rate constants were well defined, and there was anexcellent goodness of fit (R2 � 0.96; see supplemental Table 3d).However, although the Three-Step model can also simulatebasal �-HA uptake in AS160 KD cells (data not shown), a modelwith two exocytic pathways is preferred relative to the singleexponent, three-step model (80% probability that the observedbasal uptake data were generated by a process with two separatepools with different exocytic rate constants rather than a singlecycling pool; ratio of probabilities � 4). Two exponent fits of thebasal AS160 KD �-HA uptake data indicate that AS160 knock-down has two effects; it accelerates the rate of cycling of theGSV pool and also expands the size of the “constitutive” cyclingpool of Glut4 (kfuseG � 0.004 min�1, total in GSV � 65%; kfuseE �0.032 min�1, total in ERC � 35%). However, the majority of theGlut4 continues to cycle through the specialized GSV pathway inbasal AS160 KD cells. Thus, the transition data indicate that theGSV pathway also has multiple rate-limiting steps (22).
Dynamic Retention, a Mathematical Model with Two Exo-cytic Pathways, Accurately Simulates the Trafficking of Glut4 inAdipocytes—Our mathematical analysis and simulations sug-gest that Glut4 traffics through two kinetically distinct cycling
FIGURE 4. The kinetics of the transition from basal to insulin-stimulatedlevels of surface Glut4 are different in adipocytes and fibroblasts. 3T3-L1fibroblasts (A), control adipocytes (B), or AS160 KD adipocytes expressingHA-Glut4/GFP (C) were stimulated with insulin for the indicated times andthen placed on ice and labeled with AF647-�-HA. Data are the averagemean � S.E. (error bars) of surface/total Glut4 from n � 10 (fibroblasts), n � 19(adipocytes), or n � 5 (AS160 KD) independent experiments. Lines, simula-tions using different models. Dotted lines, static retention; solid lines, three-step model; dashed lines, dynamic retention, constrained (fibroblast) fits; dot-ted/dashed lines, dynamic retention, alternate (primary adipocyte) fits (Table 2and supplemental material).
Trafficking of Glut4 and LRP1 in Fibroblasts and Adipocytes
17288 JOURNAL OF BIOLOGICAL CHEMISTRY VOLUME 289 • NUMBER 25 • JUNE 20, 2014
by guest on October 29, 2018
http://ww
w.jbc.org/
Dow
nloaded from

pools in basal adipocytes: a constitutive (fibroblast-like) endo-somal pathway and a very slowly cycling specialized GSV pool.Furthermore, they suggest that both of these pathways have atleast two sequential rate-limiting steps. Based on this, we cre-ated a mathematical model that combines the best fits from thefibroblast data while incorporating a second exocytic route viathe GSVs (dynamic retention; supplemental Fig. 1E). In thismodel, Glut4 is internalized via a single pathway with a singlerate constant, ken, and is delivered to an SE. This rate constant isinsulin-independent. Sorting endosomes are defined as thecompartments where Glut4 is either sorted into constitutiveERC with a single rate constant (ksort) or sequestered into GSVsthrough an independent process with a second rate constant(kseq). Glut4 in the ERC is delivered to the PM with a single rateconstant, kfuseE, that is insulin-dependent. The release of GSVsfrom sequestration and fusion to the plasma membrane is alsocontrolled by a single rate constant, kfuseG, that is regulated byinsulin. Although similar models have been proposed in previ-ous studies (4 – 6, 11, 26), neither mathematical simulations norfits of kinetics data using this model have been reportedpreviously.
To determine if dynamic retention can accurately describethe observed kinetics data, simultaneous fits to this five-step/four-compartment model were done for the adipocytedata in Figs. 2– 4. Data from four different experiments wereanalyzed: two �-HA uptake experiments (basal and insulin),and two transition experiments (the insulin � LYi transitionand the basal to insulin transition), utilizing various hypoth-eses for the effects of insulin on the system (supplementalTable 3e) (data not shown). The rate constants determinedfrom the simultaneous fits of the adipocyte data (Table 2,dynamic retention, 3T3-L1 adipocytes, constrained fit) yieldan excellent simulation of the basal to insulin transitionexperiment (Fig. 4B, dashed line) and both the basal andinsulin �-HA uptake experiments in control adipocytes (sup-plemental Fig. 2E, solid lines), with an excellent goodness of fit(R2 � 0.99; supplemental Table 3e). Thus, the kinetics data inadipocytes can be very well represented using a model in whicha small amount of the Glut4 continues to traffic through itsdefault (fibroblast) pathway in adipocytes, whereas the majorityof the Glut4 is redirected into a highly regulated specialized
pathway after differentiation. In this model, differentiation hasno effect on the constitutive pathway (Table 2). The majoreffect of differentiation is the formation of the highly regulatedGSV pathway. The GSV pathway is rate-limited by the fusion ofGSVs, kfuseG, which increases 38-fold with insulin. The twopathways diverge in sorting endosomes and converge at theplasma membrane.
One of the main goals of this study was to develop a modelthat would allow us to test hypotheses about where proteins/treatments affect Glut4 trafficking. We have a good idea ofthe overall structure of the trafficking pathways from ourassay conditions and data fitting to different mathematicalmodels. However, in fits of the data with the dynamic reten-tion model, the rate constants for trafficking from the sort-ing endosomes into the two exocytic pathways, ksort and kseq,remain poorly defined, as evidenced by the large S.E. values(supplemental Table 3e). These steps are not rate-limitingunder the conditions of our experiments, so they can varywidely in the simulations with little effect on the overall rateconstants of exocytosis. However, the ratio of these two rateconstants is important; kseq must be slow relative to ksort
under basal conditions to avoid overaccumulation of Glut4in GSVs and fast after insulin to maintain flux through theGSV pathway.
We independently verified our estimates for the rate con-stants of endocytosis, ken, and overall exocytosis, kex, bycomparing the measured values for the relative amounts ofGlut4 in the plasma membrane with the expected values cal-culated from these rate constants based on the partitioncoefficients (Table 1). Likewise, if the relative distribution ofGlut4 between the PM, SE, ERC, and GSVs were known, itwould be possible to independently verify the estimates forksort, kseq, kfuseE, and kfuseG that were derived from the fitsusing the measured value for ken. The inferred steady statevalues of Glut4 in each compartment can be calculated as afunction of the rate constants (supplemental Table 1). Rear-ranging these equations, we find that although the relativeamounts of Glut4 in each compartment do not give definitivevalues for each of the rate constants, they do place con-straints on what these rate constants can be.
TABLE 2Rate constants used for simulationsRate constants were generated for models from simultaneous fits of basal and insulin anti-HA uptake, � LYi transition, and basal to insulin transition data for 3T3-L1fibroblasts and adipocytes (Figs. 2– 4) or from steady state subcellular distribution data in primary adipocytes (7). See supplemental Table 3 for 95% confidence bounds, S.E.values, and data on the goodness of fit.
ken ksort
kfuseE kseq kfuseG
Basal Insulin Basal Insulin Basal Insulin
Three-step: �kfuse3T3-L1 fibroblasts, free fita 0.18 0.053 0.033 0.0803T3-L1 adipocytes, free fita 0.11 0.350 0.001 0.027AS160 KD adipocytes, free fita 0.12 0.055 0.006 0.032
Dynamic retention: two exocytic pathways, GSV and ERC3T3-L1 adipocytes, constrained fita 0.12 0.042 0.025 0.088 0.021 0.059 0.0007 0.025Primary adipocytes, calculatedb 0.05 0.013 0.018 0.078 0.006 0.143 0.0005 0.053T3-L1 adipocytes, alternate fitc 0.11 0.013 0.018 0.078 0.006 0.143 0.0006 0.028AS160 KD adipocytes, alternate fitc 0.12 0.013 0.018 0.078 0.018 0.030 0.005 0.028
a Determined from free fits or constrained fits (ksort and kfuseE from fibroblasts) of the kinetics data.b Calculated from the steady state distributions using Equations 1–3.c Determined from constrained fits using ksort, kfuseE, and kseq from primary adipocytes instead of fibroblasts. For AS160 KD, kseq was estimated from LRP1 surface data
(Table 3) as described.
Trafficking of Glut4 and LRP1 in Fibroblasts and Adipocytes
JUNE 20, 2014 • VOLUME 289 • NUMBER 25 JOURNAL OF BIOLOGICAL CHEMISTRY 17289
by guest on October 29, 2018
http://ww
w.jbc.org/
Dow
nloaded from

ksort � kseq � ken�PM
SE � (Eq. 1)
kfuseE
ksort�
SE
ERC(Eq. 2)
kfuseG
kseq�
SE
GSV(Eq. 3)
The relative distribution of Glut4 in these functionally definedcompartments in 3T3-L1 adipocytes is unknown. However, thesteady state subcellular distribution of Glut4 has been carefullyexamined and quantified in primary adipocytes using electronmicroscopy (7). Based on the electron microscopy data and theknown functions of these morphological compartments frommany studies, the steady state data in primary adipocytes wereused to estimate the amounts of Glut4 in our kinetically definedcompartments: PM, 2.3% basal, 42.1% insulin; SE, 6.5% basal,14.3% insulin; GSV, 86% basal, 41% insulin; and ERC, 5.2% basal,2.4% insulin.5 Based on this distribution, we obtained estimatedvalues for ksort, kseq, kfuseE, and kfuseG in primary adipocytes(Table 2). The inferred values for kfuseE and kfuseG from thesteady state distributions in primary adipocytes were similar tothose obtained in the optimized fits of the 3T3-L1 adipocytedata. The values for ksort and kseq were quite different, however.The primary adipocyte data show that the overall rate constantfor exit of Glut4 from early/sorting endosomes must be slowerin basal adipocytes (ksort � kseq � 0.019 min�1; Equation 1)than in fibroblasts (ksort � 0.053 min�1). This suggests thatdifferentiation inhibits transport of Glut4 out of endosomes.
Strikingly, the distribution of Glut4 in primary adipocytesshows that insulin must increase the overall rate constant forexit of Glut4 from “early endosomes” 8-fold in the primary adi-pocytes (ksort � kseq � 0.156 min�1 after insulin stimulation;Equation 1).6 The 20-fold increase in Glut4 at the plasma mem-brane after insulin stimulation is expected to cause a 20-foldincrease in the amount of Glut4 in the next downstream com-partment (early/sorting endosomes) unless there is also achange in the rate constant for exit from the compartment. Theamount of Glut4 in the early/sorting endosomes increases only2.2-fold, however. Thus, the exit of Glut4 from early/sortingendosomes is a newly identified insulin-regulated step in Glut4
trafficking in adipocytes. Using the calculated values for ksort,kseq, and kfuseE from primary adipocytes in simulations of traf-ficking in 3T3-L1 adipocytes (Table 2, dynamic retention,3T3-L1 adipocytes, alternate fit) yields excellent fits of the basalto insulin transition data and the �-HA uptake data in bothbasal and insulin-stimulated cells (Fig. 4B and supplementalFig. 2E, dotted /dashed lines). In fact, these rate constants gavethe same goodness of fit (R2 � 0.99) as the fits where kseq wasunconstrained (supplemental Table 3, e and f).
Glut4 Cycles through a Different Pathway than the Transfer-rin Receptor in Fibroblasts—What is the nature of the constitu-tive pathway that Glut4 cycles through in fibroblasts? Previouswork had shown that in adipocytes, Glut4 predominantly traf-ficked through compartments that were kinetically distinctfrom the rapid recycling pathway followed by the Tf receptor(16). However, based on co-localization studies, it has been sug-gested that Glut4 might be following the same pathways as theTf receptor in fibroblasts (38). If this were true, it is expectedthat the rate constants of endocytosis and exocytosis would besimilar for these two proteins in fibroblasts but would differafter differentiation. Inconsistent with this hypothesis, how-ever, the rates of both endocytosis and exocytosis of Glut4 aresignificantly slower than the Tf receptor in fibroblasts as well asin adipocytes (Table 1). The rate constant of endocytosis of theTf receptor was 3-fold higher than Glut4 in fibroblasts (ken �0.6 min�1 versus 0.2 min�1). The rate constant of exocytosiswas 5– 8-fold higher for the Tf receptor than for Glut4 in fibro-blasts (kex � 0.2 min�1 versus 0.025– 0.04 min�1). Differentia-tion had very little effect on the rate of cycling of the Tf recep-tor. Therefore, even in fibroblast cells, a cell type that normallydoes not express Glut4, Glut4 exhibits specialized traffickingrelative to constitutive endosomal proteins. Thus, the constitu-tive cycling pathway for Glut4 in both fibroblasts and adi-pocytes is different than the fast Tf cycling pathway, despite theoverlap in distribution of these proteins. These data show thatfibroblasts have both a slow and a fast recycling pathway andthat Glut4 has intrinsic sorting sequences that target it to theslow pathway in fibroblasts. This is consistent with microscopystudies showing that although these two proteins overlap, theyare largely exocytosed via different vesicles (26, 39, 40).
It is interesting that there is a 5-fold difference in the rateconstants of endocytosis of the Tf receptor and Glut4, evenunder conditions where both proteins are internalized predom-inantly via clathrin-coated pits (i.e. in adipocytes after insulinstimulation). This difference indicates that there are differencesin the mechanisms or possibly in the efficiency of packaging ofthese two proteins into clathrin-dependent pathways at the cellsurface. The differences in the mechanisms of internalizationbetween Glut4 and the Tf receptor (nystatin-sensitive versusnystatin-insensitive, slow clathrin-dependent versus fast clath-rin-dependent) are observed in cells that normally do notexpress Glut4. Therefore, both the adipocytes and the non-differentiated cells have multiple pathways for endocytosis, andGlut4 has intrinsic sorting sequences that target it to the slowinternalization pathways.
Differentiation Slows Both Endocytosis and Exocytosis ofLRP1—LRP1, an �2-M receptor expressed in adipocytes, ishighly co-localized with Glut4 and is sequestered with Glut4 in
5 PM, plasma membrane and clathrin-coated pits/coated vesicles associatedwith the PM; SE, sorting endosomes, “early endosomes” (vacuolar struc-tures containing the endocytic marker albumin but no cathepsin D) withan associated network of recycling tubules; GSV, the trans-Golgi region(TGR) and three classes of small tubular-vesicular elements not associatedwith other organelles; ERC, endosomal recycling intermediate compart-ments, “late endosomes” (multivesicular vacuoles containing albumin andcathepsin D, with an associated network of recycling tubules) and non-coated invaginations of the plasma membrane. In primary adipocytes,insulin increased Glut4 in the plasma membrane, clathrin-coated pits/ves-icles, non-coated plasma membrane invaginations, and “early endo-somes.” Insulin decreased Glut4 in the “late endosomes,” the TGR, and allthree classes of small tubular-vesicular compartments (7).
6 In a unidirectional cycling membrane system with one compartment feed-ing into the next one, changes in the Glut4 levels in the compartments arecaused by changes in the rate of delivery of Glut4 to the compartmentand/or rate of exit from the compartment. The rates of entry into and exitfrom a compartment are function of both the amount/concentration ofGlut4 in each compartment as well as the rate constants for each step.
Trafficking of Glut4 and LRP1 in Fibroblasts and Adipocytes
17290 JOURNAL OF BIOLOGICAL CHEMISTRY VOLUME 289 • NUMBER 25 • JUNE 20, 2014
by guest on October 29, 2018
http://ww
w.jbc.org/
Dow
nloaded from
GSVs (18). Consistent with this, we have previously reportedthat both Glut4 and LRP1 cycle significantly more slowly thanthe Tf receptor in adipocytes (16). LRP1 has a trafficking itin-erary different from that of the Tf receptor. Unlike the Tf recep-tor, which releases its cargo (iron) in mildly acidic early endo-somes, LRP1 carries its cargo into the more acidic laterendosomal compartments for delivery to lysosomes and is recy-cled from a later compartment (41). Therefore, we hypothe-
sized that the default pathway for Glut4 exocytosis in fibro-blasts might be through this alternative recycling pathway.
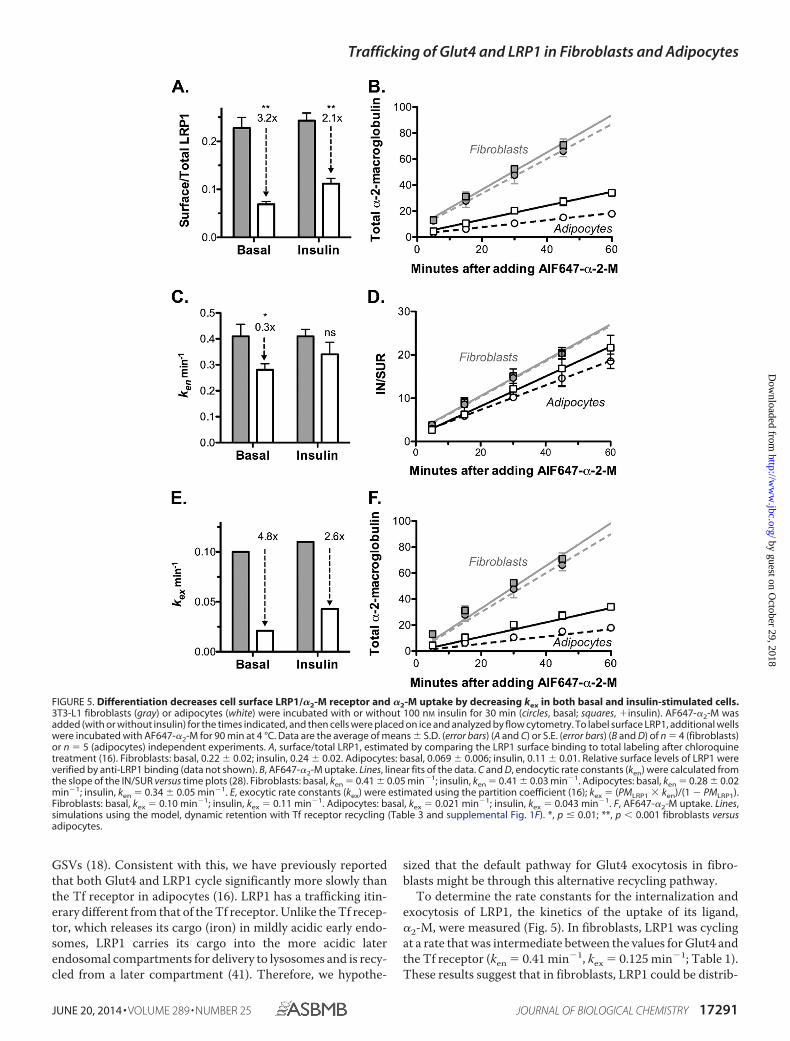
To determine the rate constants for the internalization andexocytosis of LRP1, the kinetics of the uptake of its ligand,�2-M, were measured (Fig. 5). In fibroblasts, LRP1 was cyclingat a rate that was intermediate between the values for Glut4 andthe Tf receptor (ken � 0.41 min�1, kex � 0.125 min�1; Table 1).These results suggest that in fibroblasts, LRP1 could be distrib-
FIGURE 5. Differentiation decreases cell surface LRP1/�2-M receptor and �2-M uptake by decreasing kex in both basal and insulin-stimulated cells.3T3-L1 fibroblasts (gray) or adipocytes (white) were incubated with or without 100 nM insulin for 30 min (circles, basal; squares, �insulin). AF647-�2-M wasadded (with or without insulin) for the times indicated, and then cells were placed on ice and analyzed by flow cytometry. To label surface LRP1, additional wellswere incubated with AF647-�2-M for 90 min at 4 °C. Data are the average of means � S.D. (error bars) (A and C) or S.E. (error bars) (B and D) of n � 4 (fibroblasts)or n � 5 (adipocytes) independent experiments. A, surface/total LRP1, estimated by comparing the LRP1 surface binding to total labeling after chloroquinetreatment (16). Fibroblasts: basal, 0.22 � 0.02; insulin, 0.24 � 0.02. Adipocytes: basal, 0.069 � 0.006; insulin, 0.11 � 0.01. Relative surface levels of LRP1 wereverified by anti-LRP1 binding (data not shown). B, AF647-�2-M uptake. Lines, linear fits of the data. C and D, endocytic rate constants (ken) were calculated fromthe slope of the IN/SUR versus time plots (28). Fibroblasts: basal, ken � 0.41 � 0.05 min�1; insulin, ken � 0.41 � 0.03 min�1. Adipocytes: basal, ken � 0.28 � 0.02min�1; insulin, ken � 0.34 � 0.05 min�1. E, exocytic rate constants (kex) were estimated using the partition coefficient (16); kex � (PMLRP1 ken)/(1 � PMLRP1).Fibroblasts: basal, kex � 0.10 min�1; insulin, kex � 0.11 min�1. Adipocytes: basal, kex � 0.021 min�1; insulin, kex � 0.043 min�1. F, AF647-�2-M uptake. Lines,simulations using the model, dynamic retention with Tf receptor recycling (Table 3 and supplemental Fig. 1F). *, p � 0.01; **, p 0.001 fibroblasts versusadipocytes.
Trafficking of Glut4 and LRP1 in Fibroblasts and Adipocytes
JUNE 20, 2014 • VOLUME 289 • NUMBER 25 JOURNAL OF BIOLOGICAL CHEMISTRY 17291
by guest on October 29, 2018
http://ww
w.jbc.org/
Dow
nloaded from

uted in two cycles: the fast (Tf receptor) and slow (Glut4) endo-cytic and recycling pathways. The overall observed endocytic orexocytic rate constants, kobs LRP1, would be a weighted averageof the individual rate constants for the two different pathways(kobs � XkTf � (1 � X)kGlut4, where X is the proportion of LRP1internalized and recycled via the fast Tf receptor pathways). Ifthis model is correct, then 60 – 65% of the LRP1 is internalizedand recycled with the Tf receptor in fibroblasts, whereas35– 40% is internalized and recycled through the slower Glut4pathway in these cells (Table 3).
Differentiation decreased cell surface LRP1 in both basal andinsulin-stimulated cells 2–3-fold (Fig. 5A). Differentiation alsoled to a 3–5-fold decrease in the rate of uptake of labeled �2-Min adipocytes versus fibroblasts (Fig. 5B). As with Glut4, therewas a small (30%) decrease in the rate constant of endocytosis ofLRP1 with differentiation (Fig. 5, C and D). However, this smalldecrease in ken is insufficient to account for the 3–5-folddecrease in �2-M uptake that is observed between fibroblastsand adipocytes. The decrease is due primarily to the decrease inthe amount of LRP1 at the cell surface. A decrease in ken wouldincrease cell surface LRP1, not decrease it. Therefore, differen-tiation must also be decreasing the overall rate constant ofLRP1 exocytosis 3–5-fold, decreasing the number of cell sur-face receptors (Fig. 5E).
LRP1 is highly co-localized with Glut4 in adipocytes, includ-ing in the specialized GSVs (18). However, it is less efficientlysequestered than Glut4 in these cells. We hypothesized that thisis due to the fact that LRP1 can be recycled from the endosomeseither through the fast Tf receptor pathway or through theslow, regulated Glut4 pathways. To test this hypothesis, a math-ematical model was built with an additional fast recycling path-way from the sorting endosomes to the plasma membrane, witha single rate constant, krec (dynamic retention with Tf receptorrecycling; supplemental Fig. 1F). Using our estimates for theother rate constants (Table 2), the values of krec required togenerate the observed cell surface levels of LRP1 in each celltype under basal and insulin-stimulated conditions were deter-mined (Table 3). krec ranged between 0.12 and 0.24 min�1 inboth adipocytes and fibroblasts, very close to the exocytic rateconstants measured for the Tf receptor in these cells (0.12– 0.2min�1). The model was then used to simulate �2-M uptake,yielding an excellent fit of the data (Fig. 5F). Thus, the differ-
ence in trafficking between LRP1 and Glut4 can be very welldescribed by a model with LRP1, but not Glut4, recycled to thecell surface with the Tf receptor from sorting endosomes. Inthis model, the sorting endosome is the compartment wherethree exocytic pathways diverge.
AS160 Knockdown in Adipocytes Accelerated Exocytosis ofLRP1 under Both Basal and Insulin-stimulated Conditions—Toverify that LRP1 traffics with Glut4 through both the constitu-tive and the highly regulated GSV pathways, the effects ofAS160 knockdown on �2-M uptake and LRP1 subcellulardistribution were determined (Fig. 6). AS160 knockdownincreases cell surface Glut4 in basal adipocytes 3–5-fold (Table3) (22, 42– 44). This increase is due to an increase in the exocy-tosis of GSVs, with little effect on Glut4 endocytosis (supple-mental Fig. 2F) (22, 43, 44). Therefore, release of LRP1 from theGSVs with Glut4 was expected to increase cell surface LRP1 inbasal AS160 KD cells, through an increase in LRP1 exocytosis.This was what was observed. AS160 KD increased cell surfaceLRP1 1.7-fold in basal adipocytes (Fig. 6A). As expected, therewas an increase in �2-M uptake in basal AS160 knockdowncells (Fig. 6B). This was due to the increase in cell surfaceLRP1, a small increase (30 – 40%) in the rate constant ofendocytosis of LRP1 (Fig. 6, C and D), and a 2.5-fold increasein LRP1 kex (Fig. 6E).
Unexpectedly, however, there was also a significant increasein �2-M uptake after insulin stimulation in AS160 knockdowncells relative to control cells, with a small (15%) increase in cellsurface Glut4 (Fig. 6, A and B). In contrast, AS160 knockdowninhibits Glut4 translocation 17–20% in insulin-stimulated cells(Table 3) (22, 43, 44). The increase in �2-M uptake was due inpart to the small increase in ken, but there was also a 1.6-foldincrease in kex for LRP1 in AS160 knockdown cells relative tocontrol cells after insulin stimulation (Fig. 6E). Thus, AS160knockdown accelerated the overall rate constant of exocytosisof LRP1 in insulin-stimulated cells. In contrast, AS160 knock-down inhibited Glut4 kex in insulin-stimulated adipocytes, withno effect on Glut4 endocytosis (22, 43, 44).
In previous studies, the inhibition of maximal translocationof Glut4 observed in AS160 KD cells after insulin stimulationwas assumed to be due to effects of AS160 knockdown on themaximal rate of fusion of GSVs to the plasma membrane. How-ever, this would decrease, not increase, LRP1 exocytosis. In our
TABLE 3Modeling LRP1 trafficking through fast (Tf receptor) and slow (Glut4) cycling pathways
ken(obs)
Endocytic pathwaya Basal/InsulinFast (Tf receptor) Slow (Glut4) PMobs PMsim krec
% %Fibroblasts
LRP1 0.4 65 35 0.22/0.24 0.22/0.24 0.24/0.15Glut4 0.2 30 70 0.10/0.15 0.10/0.16
AdipocytesLRP1 0.3 40 60 0.06/0.13 0.06/0.13 0.20/0.12Glut4 0.12 10 90 0.007/0.18 0.01/0.18
AS160 KD adipocytesLRP1 0.4 65 35 0.10/0.15 0.10/0.15 0.20/0.12Glut4 0.12 10 90 0.03/0.15 0.046/0.14
a Percentage of the total internalized through each pathway. Xfast � (kobs � kslow)/kfast � kslow), Xslow � 1 � Xfast. ken(fast) � 0.6 min�1, ken(slow) � 0.053 min�1. ken(obs),PMobs, measured values from Figs. 1, 2, and 5 (fibroblasts) and Fig. 6 (adipocytes and AS160 KD adipocytes). PMsim, simulations of the three-step model: �kfuse (fibroblasts)or dynamic retention, alternate fit (control and AS160 KD adipocytes) models (Table 2) with an additional fast direct recycling step from sorting endosomes to the PMwith a single rate constant, krec, added to the models (supplemental Fig. 1F). krec(TfR) � 0.12 min�1 basal, 0.2 min�1 insulin; ksort(TfR) and kseq(TfR) � 0.
Trafficking of Glut4 and LRP1 in Fibroblasts and Adipocytes
17292 JOURNAL OF BIOLOGICAL CHEMISTRY VOLUME 289 • NUMBER 25 • JUNE 20, 2014
by guest on October 29, 2018
http://ww
w.jbc.org/
Dow
nloaded from

mathematical model, any treatments that increase the amountof Glut4 and LRP1 in the sorting endosomes would be expectedto increase the rate constant of exocytosis of LRP1, but notGlut4. An increase in the residency time of LRP1 in endosomeswould allow for greater efflux of LRP1 through the fast Tfreceptor pathway, accounting for the acceleration of LRP1 exo-cytosis. In contrast, Glut4 cannot exit through the fast Tf recep-tor pathway and would remain rate limited by the slow Glut4pathways. Therefore, we hypothesized that AS160 knockdownaffected the rate constant of trafficking of Glut4 from sortingendosomes into sequestered GSVs (kseq) as well as the rate con-
stant of fusion of GSVs to the plasma membrane (kfuseG). Wetested this hypothesis using mathematical simulations.
The effect of AS160 knockdown in basal adipocytes wasmodeled as a partial increase in the rate of release and fusion ofGSVs, kfuseG (Table 2, dynamic retention, AS160 KD adi-pocytes, alternative fit), as described previously (22). This wassufficient to account for the increase in basal �-HA uptakeobserved in these cells (supplemental Fig. 2E) (22). An addi-tional small increase in kseq was required in basal AS160 KDcells to prevent overaccumulation of LRP1 at the cell surface(Table 3). To account for both the decrease in the exocytic rate
FIGURE 6. AS160 knockdown in adipocytes increases surface LRP1/�2-M receptor and �2-M uptake by increasing kex in both basal and insulin-stimulated cells. Control adipocytes expressing a nonspecific shRNA (white) or AS160 knockdown adipocytes (black) were treated and analyzed as describedin Fig. 5. Data are the average means � S.D. (error bars) (A and C) or S.E. (error bars) (B) of n � 7 independent experiments. A, surface/total LRP1. Control: basal,0.06 � 0.005; insulin, 0.13 � 0.01. AS160 KD: basal, 0.10 � 0.009; insulin, 0.15 � 0.02. B, AF647-�2-M uptake. Lines, linear fits of the data. C and D, endocytic rateconstants (ken) were calculated from the slope of the IN/SUR versus time plots (28). Control: basal, ken � 0.27 � 0.01 min�1; insulin, ken � 0.31 � 0.02 min�1.AS160 KD: basal, ken � 0.39 � 0.03 min�1; insulin, ken � 0.41 � 0.03 min�1. E, estimated exocytic rate constants (kex). Control: basal, kex � 0.017 min�1; insulin,kex � 0.046 min�1. AS160 KD: basal, kex � 0.043 min�1; insulin, kex � 0.072 min�1. F, AF647-�2-M uptake. Lines, simulations (Table 3 and supplemental Fig. 1F).*, p � 0.01; **, p 0.001, control versus AS160 KD.
Trafficking of Glut4 and LRP1 in Fibroblasts and Adipocytes
JUNE 20, 2014 • VOLUME 289 • NUMBER 25 JOURNAL OF BIOLOGICAL CHEMISTRY 17293
by guest on October 29, 2018
http://ww
w.jbc.org/
Dow
nloaded from

constant for Glut4 and in the increase for LRP1, the effect ofAS160 knockdown in insulin-stimulated cells was modeled asan inhibition of kseq, with all other rate constants held the sameas in control adipocytes. Inhibition of sequestration was suffi-cient to account for both the elevated surface levels of LRP1 andthe decreased surface levels of Glut4 observed in the AS160 KDcells after insulin stimulation (Table 3). Simulations of traffick-ing using these rate constants yielded excellent fits of the �-HAuptake data (supplemental Fig. 2E) and the �2-M uptake data(Fig. 6F) in both basal and insulin-stimulated AS160 KD adi-pocytes. Furthermore, they yielded an excellent fit of the com-plex basal to insulin transition observed in AS160 KD cells (Fig.4C, dotted/dashed line). There was no significant difference inthe goodness of fit to the Glut4 data in AS160 KD cells betweena model with both kseq and kfuseG affected by knockdown andthe previously used model with effects on only kfuseG (supple-mental Table 3, g and h; R2 � 0.96). Therefore, the data andsimulations suggest not only that AS160 regulates the release ofGlut4 and LRP1 from sequestration in GSVs but that it may alsoregulate the efficient packaging of Glut4 and LRP1 into theGSVs from the endosomes.
DISCUSSION
Differentiation of 3T3-L1 fibroblasts into adipocytes inducesthe expression of both Glut4 and proteins that regulate thesubcellular distribution of Glut4. Differentiation affects surfaceGlut4 in both basal and insulin-stimulated cells. In basal adi-pocytes, there is 4.2-fold less total Glut4 at the plasma mem-brane than in basal fibroblasts, whereas in insulin-stimulatedadipocytes, there is 4-fold more Glut4 at the plasma membranethan in insulin-stimulated fibroblasts (Fig. 1B). There are fourpossible independent ways of affecting the amount of Glut4 atthe plasma membrane: 1) change the rate constant of endocy-tosis; 2) change the overall rate constant of exocytosis; 3)change the total amount of Glut4 expressed in the cells; or 4)change the distribution of Glut4 in actively cycling versussequestered non-cycling/very slowly cycling compartments.Using kinetics assays that allow each of these to be measured, itwas determined that differentiation affects all of these pro-cesses. In fact, six steps were identified that account for thedistinctive trafficking of Glut4 relative to the constitutive, rapidrecycling of the Tf receptor in adipocytes (Fig. 7).
Endocytosis—In 3T3-L1 adipocytes, the rate constant forendocytosis of Glut4 (ken � 0.12 min�1) is slow relative to theTf receptor (ken � 0.6 min�1) (9, 23, 24). This rate constant iseven slower in primary adipocytes (ken � 0.053 min�1). This5–11-fold difference in the rate constants of endocytosis is con-sistent with the difference in the function of these two proteins.Due to this slow endocytic rate constant, Glut4 will tend toremain at the cell surface, which is where it is active, onceinserted into the plasma membrane. In contrast, the Tf receptoris rapidly internalized and recycled to deliver its cargo. Inter-estingly, chronic insulin stimulation of primary adipocytesinhibits Glut4 translocation by increasing ken, with little effecton kex (ken � 0.1 min�1, kex � 0.03 min�1, PM � 23%) (24).Thus, possible effects on ken should be considered for treat-ments that affect Glut4 translocation, despite the fact that acuteinsulin stimulation has little effect on this process.
Further supporting an important role for endocytosis in theregulation of glucose homeostasis, differentiation of 3T3-L1cells causes a 40% decrease in the rate constant of endocytosisof Glut4 (from 0.2 to 0.12 min�1; Fig. 2 and Table 1). We do notknow the basis of this decrease in ken. A simple explanation forthe observed difference would be that there are two pathwaysfor endocytosis, a fast one (ken(fast) � 0.6 min�1) and a slow one(ken(slow) � 0.053 min�1), and that differentiation shifts the dis-tribution of Glut4 between these two pathways (30% fast in3T3-L1 fibroblasts, 10% fast in 3T3-L1 adipocytes, 0% fast inprimary adipocytes; Table 3). This mechanism can also explainthe change in endocytic rate constants measured for LRP1. Per-haps differentiation changes the expression or function ofadaptor proteins that target Glut4 and LRP1 into the fast versusslow pathways. Likewise, any treatments (e.g. mutations inGlut4) that change the amount of Glut4 internalized via the fastpathway versus the slow pathway will affect cell surface Glut4levels, despite the fact that the fast endocytic pathway has littlerole in normal Glut4 trafficking in adipocytes (45– 47).
FIGURE 7. Dynamic retention. Six steps account for the unique trafficking ofGlut4 compared with the constitutively cycling Tf receptor. *, three of thesesteps are highly insulin-regulated in adipocytes, increasing 10 –30-fold withinsulin. i, endocytosis; there are multiple pathways for endocytosis in bothfibroblasts and adipocytes, the fast (Tf receptor) pathway, and a slower(Glut4) pathway. ii, degradation; differentiation induces the expression ofproteins, including sortilin, that redirect Glut4 from lysosomal degradationpathways. iii, sorting; there are two pathways for constitutive recycling fromsorting endosomes in both in fibroblasts and adipocytes, the fast (Tf receptor)pathway and a slower (Glut4) recycling pathway. *iv, sequestration; differen-tiation induces a second recycling pathway for Glut4 in basal adipocytes, ahighly regulated non-cycling/very slowly cycling pathway through GSVs(GSVseq, sequestered GSVs). Unexpectedly, insulin increases the rate constantfor transfer from sorting endosomes into GSVs. *v, release; the GSVs are rap-idly mobilized in response to insulin (GSVrel, released GSVs), through a processregulated by AS160. Our data and modeling suggest that AS160 may also berequired for formation of GSVs. *vi, tethering/docking/fusion; GSV exocytosisis regulated by a second, AS160-independent, Akt- and PI3K-dependentmechanism.
Trafficking of Glut4 and LRP1 in Fibroblasts and Adipocytes
17294 JOURNAL OF BIOLOGICAL CHEMISTRY VOLUME 289 • NUMBER 25 • JUNE 20, 2014
by guest on October 29, 2018
http://ww
w.jbc.org/
Dow
nloaded from

Retrieval of Glut4 from the Degradative Lysosomal Pathway—The 4-fold increase in total surface Glut4 observed after insulinstimulation in adipocytes compared with fibroblasts can belargely accounted for by an increase in total Glut4 protein. Dif-ferentiation increased the total amount of the Glut4 reporter3.2-fold (Fig. 1C). This increase is due to an increase in proteinstability and not a change in protein expression. Therefore, dif-ferentiation induces the expression of proteins that protectGlut4 from degradation in lysosomes. The increase in Glut4stability can be phenocopied in fibroblasts by the expression ofsortilin, a protein whose expression increases significantly dur-ing differentiation (20). Co-expression of sortilin with a Glut4reporter protein in fibroblasts increased Glut4 levels 3-fold,whereas shRNA-mediated knockdown of sortilin in adipocytesdecreased HA-Glut4/GFP levels 30% (20) (data not shown).Although sortilin expression affected the total amount of Glut4in the cell and thus the total amount of Glut4 at the cell surface,it had little effect on the kinetics of Glut4 trafficking or therelative distribution of Glut4 between the intracellular com-partments and the cell surface (data not shown). Similarly, anytreatments that affect Glut4 stability will affect the total amountof Glut4 protein at the cell surface, even if they have no effect onGlut4 trafficking kinetics. Thus, it is important to measure theeffects of treatments on both the total amount of Glut4expressed in cells and the proportion of the total Glut4 that is atthe cell surface.
The total amount of surface Glut4 controls the rate of glu-cose transport into adipocytes and muscle. The amount ofGlut4 at the plasma membrane is directly proportional to thetotal amount of Glut4. Therefore, retrieval of Glut4 from deg-radation is another trafficking step important in overall glucosehomeostasis that is not acutely regulated by insulin.
Sorting into Intermediate Compartments (ERC) for Recyclingfrom Endosomes—In fibroblasts, Glut4 is exocytosed 5– 8 timesmore slowly than the Tf receptor. Therefore, even in non-spe-cialized cells, there are multiple routes for recycling from theendocytic pathway, and there are intrinsic signals in Glut4 thattarget it to the slow recycling pathway. In our model, we desig-nate this as the ERC, but the exact nature of the kinetic inter-mediate between the early/sorting endosomes and the plasmamembrane that represents the rate-limiting step observed inour kinetics data is unclear. The fact that LRP1 also cyclesthrough this slow pathway indicates that it may be a recyclingintermediate on the late endosome/lysosome degradative path-way. This is consistent with electron microscopy data (7, 48).The fact that there are both fast and slow exocytic pathwaysmeans that a possible mechanism to increase cell surface Glut4(or LRP1) would be to redirect Glut4 from the slow constitutiverecycling pathway through the ERC into the more rapidly recy-cling Tf receptor pathway. Therefore, although the fast Tf recy-cling pathway is not part of normal Glut4 trafficking, any treat-ments (including mutations in Glut4) that redirect Glut4 fromthe slow recycling pathway into the fast recycling pathwaywould increase cell surface Glut4. Thus, this mechanism shouldbe considered when evaluating treatments/mutations thataffect “sequestration” of Glut4. Treatments/mutations thatincrease Glut4 exocytosis through the Tf receptor pathway willaffect Glut4 surface levels in both fibroblasts and adipocytes.
They are also expected to accelerate Glut4 exocytosis (andincrease cell surface Glut4) in both basal and insulin-stimulatedcells.
Sequestration of Glut4 into the Specialized, Highly RegulatedGSVs—In basal adipocytes, Glut4 cycles through two kineti-cally distinct pools, the endosomal cycling pool and a highlyregulated sequestered pool in GSVs (15, 22). Thus, differentia-tion induces expression of proteins that redirect Glut4 from itsconstitutive recycling pathway into the highly regulated GSVs.There are two models that can fit the observed data. The first isthat the Glut4 in GSVs is static, not cycling (static retention;supplemental Fig. 1B) (12, 13). In this model, the rate of exocy-tosis in the constitutive cycling pool is also affected by differen-tiation. It is inhibited in basal cells (kex � 0.006 min�1, t1⁄2 � 2 h)so that it is 4 times slower than the kinetics of exocytosis of thecycling pool in fibroblasts (kex � 0.025 min�1). Insulin stimu-lates the quantal release of Glut4 from GSVs, and it alsoincreases the rate constant of exocytosis from the constitutivepathway. This is the model used to analyze the �-HA uptakedata (Fig. 3 and Table 1) and yields an excellent fit of the kineticsdata in both control and AS160 knockdown adipocytes (22).
An alternative model that fits the data equally well is that inbasal adipocytes, the GSVs are cycling at a very slow rate (kex �0.0007, t1⁄2 � 16 h), and there is a small pool (�10%) of Glut4that is cycling through a compartment with kinetics similar tothe fibroblast pathway (dynamic retention; supplemental Fig.1E). The observed exocytic rate constant measured in the �-HAuptake assay would be a weighted average from these two path-ways. This model gives an excellent fit of the basal to insulintransitions and uptake data in both control and AS160 KD adi-pocytes (Fig. 4, B and C, dotted/dashed lines, and supplementalFig. 2E). The major difference between these two models iswhether differentiation affects the endosomal ERC recyclingpathway as well as the GSV pathway (in “static retention,” bothmust be affected, whereas in dynamic retention, only the GSVpathway is highly regulated).
Interestingly, when either model is used to analyze the steadystate distribution of Glut4 in primary adipocytes, it is revealedthat the movement of Glut4 into GSVs must be regulated byinsulin. It must be slow (or 0) in basal cells, to allow some Glut4to remain cycling through the endosomal pathway, and it mustincrease at least 8-fold after insulin stimulation to clear Glut4from the endosomes and to repopulate the GSVs. Any treat-ments that inhibit the increase in the rate constant of traffickingof Glut4 from the early/sorting endosomes into the GSVs (kseq)will decrease Glut4 at the cell surface in insulin-stimulated cellsbut only in adipocytes.
In contrast to Glut4, it is expected that treatments thatdecrease trafficking of Glut4 and LRP1 into the GSV pathway(increase their concentration in the endosomal cycling path-way) will accelerate the exocytosis rate of LRP1 in insulin-stim-ulated cells. We have also observed that treatments that inhibitGlut4 sequestration in GSVs (increase its concentration inendosomes) increase the degradation of Glut4 in lysosomes (e.g.AS160 knockdown decreases total Glut4 protein levels by 25%)(22).
Release of the Sequestered GSVs—AS160 is required forsequestration of Glut4; shRNA-mediated knockdown of AS160
Trafficking of Glut4 and LRP1 in Fibroblasts and Adipocytes
JUNE 20, 2014 • VOLUME 289 • NUMBER 25 JOURNAL OF BIOLOGICAL CHEMISTRY 17295
by guest on October 29, 2018
http://ww
w.jbc.org/
Dow
nloaded from

in adipocytes causes the redistribution of the Glut4 from GSVsinto the constitutive cycling pool (22). However, exogenousexpression of AS160 in fibroblasts is insufficient to cause Glut4sequestration (data not shown). Co-expression of AS160 andsortilin is also not sufficient to induce sequestration (data notshown). As observed for AS160 knockdown, any treatmentsthat affect packaging and retention of Glut4 in GSVs will affectGlut4 levels at the plasma membrane. Consistent with this,knockdown of the AS160 substrates Rab10 and Rab14 affectsequestration of Glut4 and decrease cell surface Glut4 in adi-pocytes.7 Modeling and simulations of this data indicate thatRab10 is required for release of Glut4 from sequestration inGSVs, whereas Rab14 is required in packaging/sorting of pro-teins from endosomes into GSVs, consistent with recentmicroscopy studies (40, 48). Interestingly, although Glut4 traf-fics through specialized GSVs in muscle cells, kinetics studiesshow that this compartment is not as tightly regulated as inadipocytes (49, 50). It remains to be determined whether thedifference between adipocytes and muscle is due to differentpathways for trafficking of Glut4 in the two cell types or todifferent signal transduction pathways with different strin-gency of regulation of the trafficking through the same path-ways in both cell types.
Tethering/Docking/Fusion—AS160 knockdown releasesGlut4 from the GSVs, but there is an additional step that regu-lates the rate of fusion of the released vesicles (22). The proteinsthat control this step remain unidentified but are regulated byinsulin in part through Akt and phosphatidylinositol 3-phos-phates (22). This step affects GSVs downstream from AS160.Therefore, the minimal mathematical model that can accountfor all of the kinetics data is a six-step, five-pool model, with twoinsulin-regulated steps in the GSV pathway: the AS160-depen-dent priming step and the AS160-independent tethering/dock-ing/fusion step (supplemental Fig. 3). This step is implicitly, notexplicitly, represented in our four-pool model (supplementalFig. 1, E and F). Release and fusion affect a single rate constant,kfuseG. In a simultaneous free fit of the adipocyte data, the six-step/five-pool model is reduced to a five-step/four-pool model,with the fusion step much faster than the release step (kfuseG ��krel; supplemental Table 3, f and i). Additional data are requiredto estimate krel and kfuseG. Likewise, it is likely that other steps inthe kinetics model are actually multiple independent steps (e.g.“GSVs” are a collection of four different morphological com-partments) (7).5 Additional data will be required to resolvethese steps.
The rate constant of tethering/docking/fusion of GSVs to theplasma membrane (kfuseG) is very highly regulated in adi-pocytes, whereas transport to the plasma membrane from theERC is less highly regulated. However, treatments that inhibitthe exocytosis from either pathway will decrease cell surfaceGlut4. Treatments that affect exocytosis from the ERC willaffect trafficking in both fibroblasts and adipocytes, whereastreatments that affect exocytosis of GSVs will only reduce sur-face Glut4 levels in adipocytes. In addition, inhibition of thetethering/docking/fusion step is expected to slow down the
basal to insulin transition (22). Thus, inhibition of the basal toinsulin transition in adipocytes, with no effect in fibroblasts, is adefining phenotype for treatments that inhibit the final fusionof GSVs.
In the “dynamic retention” model, differentiation changesthe expression or function of proteins that inhibit GSV but notERC exocytosis. Therefore, it is expected that affecting theseregulatory proteins would affect trafficking only in adipocytes,not in fibroblasts. In contrast, the “static retention” model pre-dicts that differentiation must change the expression/functionof proteins that regulate exocytosis from the constitutive ERCas well as GSVs. These proteins would effect Glut4 trafficking inboth fibroblasts and adipocytes. It remains to be determinedwhich model is correct.
Conclusions—These observations support the dynamicretention model depicted in Fig. 7. Six steps account for theunique trafficking of Glut4 compared with the Tf receptor:endocytosis, degradation, sorting, sequestration, release, andtethering/docking/fusion (numbered i–vi in Fig. 7). Three ofthese steps are highly regulated by insulin. There are two path-ways of endocytosis in both fibroblasts and adipocytes, the fast(Tf receptor) pathway and a much slower (Glut4) pathway.LRP1 is internalized through both pathways in both cell types.Differentiation induces the expression of proteins, includingsortilin, that redirect Glut4 from lysosomal degradation,increasing its stability. In fibroblasts, there are two pathways forprotein recycling from endosomes to the plasma membrane, afast pathway utilized by the Tf receptor and a slower pathwayutilized by Glut4. LRP1 recycles through both pathways infibroblasts. Differentiation redistributes LRP1 into the slowGlut4 cycling pathways. Differentiation induces a second kinet-ically distinct recycling pathway for Glut4 in basal adipocytes,the sequestered non-cycling/very slowly cycling GSV pathway.LRP1 is also sorted into the GSV compartments. Unexpectedly,we found that the rate constant for trafficking into the GSVs inadipocytes is a novel regulatory step in Glut4 traffic; insulinincreases kseq �8-fold. The GSVs are rapidly mobilized inresponse to insulin. AS160 is essential for sequestration ofGlut4 in the GSVs; shRNA knockdown of AS160 releases Glut4from sequestration. Our data and simulations suggest thatAS160 inhibits the release of GSVs from sequestration and alsoregulates GSV formation. Differentiation induces the expres-sion of proteins that regulate vesicle fusion independently ofAS160. These proteins are regulated in part through Akt andPI3K.
This model provides a framework for mapping the sites ofaction of proteins/treatments on Glut4 trafficking. In addition,we have described the phenotypes observed or expected wheneach of these six steps is perturbed. These phenotypes are beingused to identify additional proteins required for each of thesesteps and to help interpret the effects of treatments/proteins onGlut4 translocation in adipocytes.
REFERENCES1. Karnieli, E., Zarnowski, M. J., Hissin, P. J., Simpson, I. A., Salans, L. B., and
Cushman, S. W. (1981) Insulin-stimulated translocation of glucose trans-port systems in the isolated rat adipose cell. Time course, reversal, insulinconcentration dependency, and relationship to glucose transport activity.J. Biol. Chem. 256, 4772– 4777
7 P. D. Brewer, E. N. Habtemichael, I. Romenskaia, C. C. Mastick, and A. C. F.Coster, submitted for publication.
Trafficking of Glut4 and LRP1 in Fibroblasts and Adipocytes
17296 JOURNAL OF BIOLOGICAL CHEMISTRY VOLUME 289 • NUMBER 25 • JUNE 20, 2014
by guest on October 29, 2018
http://ww
w.jbc.org/
Dow
nloaded from

2. Kono, T., Suzuki, K., Dansey, L. E., Robinson, F. W., and Blevins, T. L.(1981) Energy-dependent and protein synthesis-independent recycling ofthe insulin-sensitive glucose transport mechanism in fat cells. J. Biol.Chem. 256, 6400 – 6407
3. Muretta, J. M., and Mastick, C. C. (2009) How insulin regulates glucosetransport in adipocytes. Vitam. Horm. 80, 245–286
4. Kandror, K. V., and Pilch, P. F. (2011) The sugar is sIRVed: sorting Glut4and its fellow travelers. Traffic 12, 665– 671
5. Foley, K., Boguslavsky, S., and Klip, A. (2011) Endocytosis, recycling,and regulated exocytosis of glucose transporter 4. Biochemistry 50,3048 –3061
6. Stockli, J., Fazakerley, D. J., and James, D. E. (2011) GLUT4 exocytosis.J. Cell Sci. 124, 4147– 4159
7. Slot, J. W., Geuze, H. J., Gigengack, S., Lienhard, G. E., and James, D. E.(1991) Immuno-localization of the insulin regulatable glucose transporterin brown adipose tissue of the rat. J. Cell Biol. 113, 123–135
8. Yang, J., and Holman, G. D. (1993) Comparison of GLUT4 and GLUT1subcellular trafficking in basal and insulin-stimulated 3T3-L1 cells. J. Biol.Chem. 268, 4600 – 4603
9. Satoh, S., Nishimura, H., Clark, A. E., Kozka, I. J., Vannucci, S. J., Simpson,I. A., Quon, M. J., Cushman, S. W., and Holman, G. D. (1993) Use ofbismannose photolabel to elucidate insulin-regulated GLUT4 subcellulartrafficking kinetics in rat adipose cells. Evidence that exocytosis is a criticalsite of hormone action. J. Biol. Chem. 268, 17820 –17829
10. Holman, G. D., Lo Leggio, L., and Cushman, S. W. (1994) Insulin-stimu-lated GLUT4 glucose transporter recycling. A problem in membrane pro-tein subcellular trafficking through multiple pools. J. Biol. Chem. 269,17516 –17524
11. Karylowski, O., Zeigerer, A., Cohen, A., and McGraw, T. E. (2004) GLUT4is retained by an intracellular cycle of vesicle formation and fusion withendosomes. Mol. Biol. Cell 15, 870 – 882
12. Govers, R., Coster, A. C., and James, D. E. (2004) Insulin increases cellsurface GLUT4 levels by dose dependently discharging GLUT4 into a cellsurface recycling pathway. Mol. Cell Biol. 24, 6456 – 6466
13. Coster, A. C., Govers, R., and James, D. E. (2004) Insulin stimulates theentry of GLUT4 into the endosomal recycling pathway by a quantal mech-anism. Traffic 5, 763–771
14. Martin, O. J., Lee, A., and McGraw, T. E. (2006) GLUT4 distributionbetween the plasma membrane and the intracellular compartments ismaintained by an insulin-modulated bipartite dynamic mechanism.J. Biol. Chem. 281, 484 – 490
15. Muretta, J. M., Romenskaia, I., and Mastick, C. C. (2008) Insulin releasesGlut4 from static storage compartments into cycling endosomes and in-creases the rate constant for Glut4 exocytosis. J. Biol. Chem. 283, 311–323
16. Habtemichael, E. N., Brewer, P. D., Romenskaia, I., and Mastick, C. C.(2011) Kinetic evidence that Glut4 follows different endocytic pathwaysthan the receptors for transferrin and �2-macroglobulin. J. Biol. Chem.286, 10115–10125
17. Antonescu, C. N., Foti, M., Sauvonnet, N., and Klip, A. (2009) Ready, set,internalize: mechanisms and regulation of GLUT4 endocytosis. Biosci.Rep. 29, 1–11
18. Jedrychowski, M. P., Gartner, C. A., Gygi, S. P., Zhou, L., Herz, J., Kandror,K. V., and Pilch, P. F. (2010) Proteomic analysis of GLUT4 storage vesiclesreveals LRP1 to be an important vesicle component and target of insulinsignaling. J. Biol. Chem. 285, 104 –114
19. Shi, J., Huang, G., and Kandror, K. V. (2008) Self-assembly of Glut4 storagevesicles during differentiation of 3T3-L1 adipocytes. J. Biol. Chem. 283,30311–30321
20. Shi, J., and Kandror, K. V. (2005) Sortilin is essential and sufficient for theformation of Glut4 storage vesicles in 3T3-L1 adipocytes. Dev. Cell 9,99 –108
21. Hatakeyama, H., and Kanzaki, M. (2011) Molecular basis of insulin-re-sponsive GLUT4 trafficking systems revealed by single molecule imaging.Traffic 12, 1805–1820
22. Brewer, P. D., Romenskaia, I., Kanow, M. A., and Mastick, C. C. (2011)Loss of AS160 Akt substrate causes Glut4 protein to accumulate in com-partments that are primed for fusion in basal adipocytes. J. Biol. Chem.286, 26287–26297
23. Clark, A. E., Holman, G. D., and Kozka, I. J. (1991) Determination of therates of appearance and loss of glucose transporters at the cell surface ofrat adipose cells. Biochem. J. 278, 235–241
24. Pryor, P. R., Liu, S. C., Clark, A. E., Yang, J., Holman, G. D., and Tosh, D.(2000) Chronic insulin effects on insulin signalling and GLUT4 endocy-tosis are reversed by metformin. Biochem. J. 348, 83–91
25. Dawson, K., Aviles-Hernandez, A., Cushman, S. W., and Malide, D. (2001)Insulin-regulated trafficking of dual-labeled glucose transporter 4 in pri-mary rat adipose cells. Biochem. Biophys. Res. Commun. 287, 445– 454
26. Lampson, M. A., Schmoranzer, J., Zeigerer, A., Simon, S. M., and McGraw,T. E. (2001) Insulin-regulated release from the endosomal recycling com-partment is regulated by budding of specialized vesicles. Mol. Biol. Cell 12,3489 –3501
27. Gonias, S. L., Reynolds, J. A., and Pizzo, S. V. (1982) Physical properties ofhuman �2-macroglobulin following reaction with methylamine and tryp-sin. Biochim. Biophys. Acta 705, 306 –314
28. Wiley, H. S., and Cunningham, D. D. (1982) The endocytotic rate con-stant. A cellular parameter for quantitating receptor-mediated endocyto-sis. J. Biol. Chem. 257, 4222– 4229
29. Dormand, J. R., and Prince, P. J. (1980) A family of embedded Runge-Kuttaformulae. J. Comp. Appl. Math. 6, 19 –26
30. More, J. J., and Sorensen, D. C. (1983) Computing a trust region step.SIAM J. Sci. Stat. Comput. 3, 553–572
31. Branch, M. A., Coleman, T. F., and Li, Y. (1999) A subspace, interior, andconjugate gradient method for large-scale bound-constrained minimiza-tion problems. SIAM J. Sci. Stat. Comput. 21, 1–23
32. Byrd, R. H., Schnabel, R. B., and Shultz, G. A. (1988) Approximate solutionof the trust region problem by minimization over two-dimensional sub-spaces. Math. Progam. 40, 247–263
33. Coleman, T. F., and Verma, A. (2001) A preconditioned conjugate gradi-ent approach to linear equality constrained minimization. Comput. Op-tim. Appl. 20, 61–72
34. Sorensen, D. C. (1997) Minimization of a large-scale quadratic functionsubject to a spherical constraint. SIAM J. Optim. 7, 141–161
35. Student (Gosset, W. S.) (1908) On the probable error of the mean. Bi-ometrika 6, 1–25
36. Ros-Baro, A., Lopez-Iglesias, C., Peiro, S., Bellido, D., Palacin, M., Zorzano,A., and Camps, M. (2001) Lipid rafts are required for GLUT4 internaliza-tion in adipose cells. Proc. Natl. Acad. Sci. U.S.A. 98, 12050 –12055
37. Blot, V., and McGraw, T. E. (2006) GLUT4 is internalized by a cholesterol-dependent nystatin-sensitive mechanism inhibited by insulin. EMBO J.25, 5648 –5658
38. Zeigerer, A., Lampson, M. A., Karylowski, O., Sabatini, D. D., Adesnik, M.,Ren, M., and McGraw, T. E. (2002) GLUT4 retention in adipocytes re-quires two intracellular insulin-regulated transport steps. Mol. Biol. Cell13, 2421–2435
39. Wang, Y., Zhang, J., Chen, Y., Jiang, L., Ji, W., and Xu, T. (2009) Charac-terization of GLUT4-containing vesicles in 3T3-L1 adipocytes by totalinternal reflection fluorescence microscopy. Sci. China C Life Sci. 52,665– 671
40. Chen, Y., Wang, Y., Zhang, J., Deng, Y., Jiang, L., Song, E., Wu, X. S.,Hammer, J. A., Xu, T., and Lippincott-Schwartz, J. (2012) Rab10 and my-osin-Va mediate insulin-stimulated GLUT4 storage vesicle translocationin adipocytes. J. Cell Biol. 198, 545–560
41. Taguchi, T. (2013) Emerging roles of recycling endosomes. J. Biochem.153, 505–510
42. Larance, M., Ramm, G., Stockli, J., van Dam, E. M., Winata, S., Wasinger,V., Simpson, F., Graham, M., Junutula, J. R., Guilhaus, M., and James, D. E.(2005) Characterization of the role of the Rab GTPase-activating proteinAS160 in insulin-regulated GLUT4 trafficking. J. Biol. Chem. 280,37803–37813
43. Eguez, L., Lee, A., Chavez, J. A., Miinea, C. P., Kane, S., Lienhard, G. E.,and McGraw, T. E. (2005) Full intracellular retention of GLUT4requires AS160 Rab GTPase activating protein. Cell Metab. 2,263–272
44. Zeigerer, A., McBrayer, M. K., and McGraw, T. E. (2004) Insulin stimula-tion of GLUT4 exocytosis, but not its inhibition of endocytosis, is depen-dent on RabGAP AS160. Mol. Biol. Cell 15, 4406 – 4415
Trafficking of Glut4 and LRP1 in Fibroblasts and Adipocytes
JUNE 20, 2014 • VOLUME 289 • NUMBER 25 JOURNAL OF BIOLOGICAL CHEMISTRY 17297
by guest on October 29, 2018
http://ww
w.jbc.org/
Dow
nloaded from
45. Piper, R. C., Tai, C., Kulesza, P., Pang, S., Warnock, D., Baenziger, J., Slot,J. W., Geuze, H. J., Puri, C., and James, D. E. (1993) GLUT-4 NH2 terminuscontains a phenylalanine-based targeting motif that regulates intracellularsequestration. J. Cell Biol. 121, 1221–1232
46. Blot, V., and McGraw, T. E. (2008) Molecular mechanisms controllingGLUT4 intracellular retention. Mol. Biol. Cell 19, 3477–3487
47. Corvera, S., Chawla, A., Chakrabarti, R., Joly, M., Buxton, J., and Czech, M. P.(1994) A double leucine within the GLUT4 glucose transporter COOH-ter-minal domain functions as an endocytosis signal. J. Cell Biol. 126, 1625
48. Reed, S. E., Hodgson, L. R., Song, S., May, M. T., Kelly, E. E., McCaffrey,
M. W., Mastick, C. C., Verkade, P., and Tavare, J. M. (2013) A role forRab14 in the endocytic trafficking of GLUT4 in 3T3-L1 adipocytes. J. CellSci. 126, 1931–1941
49. Fazakerley, D. J., Holman, G. D., Marley, A., James, D. E., Stockli, J., andCoster, A. C. (2010) Kinetic evidence for unique regulation of GLUT4trafficking by insulin and AMP-activated protein kinase activators in L6myotubes. J. Biol. Chem. 285, 1653–1660
50. Foster, L. J., Li, D., Randhawa, V. K., and Klip, A. (2001) Insulin acceleratesinter-endosomal GLUT4 traffic via phosphatidylinositol 3-kinase andprotein kinase B. J. Biol. Chem. 276, 44212– 44221
Trafficking of Glut4 and LRP1 in Fibroblasts and Adipocytes
17298 JOURNAL OF BIOLOGICAL CHEMISTRY VOLUME 289 • NUMBER 25 • JUNE 20, 2014
by guest on October 29, 2018
http://ww
w.jbc.org/
Dow
nloaded from

Mastick and Adelle C. F. CosterPaul Duffield Brewer, Estifanos N. Habtemichael, Irina Romenskaia, Cynthia Corley
WITH SIX DISTINCTIVE STEPSInsulin-regulated Glut4 Translocation: MEMBRANE PROTEIN TRAFFICKING
doi: 10.1074/jbc.M114.555714 originally published online April 28, 20142014, 289:17280-17298.J. Biol. Chem.
10.1074/jbc.M114.555714Access the most updated version of this article at doi:
Alerts:
When a correction for this article is posted•
When this article is cited•
to choose from all of JBC's e-mail alertsClick here
Supplemental material:
http://www.jbc.org/content/suppl/2014/04/28/M114.555714.DC1
http://www.jbc.org/content/289/25/17280.full.html#ref-list-1
This article cites 50 references, 32 of which can be accessed free at
by guest on October 29, 2018
http://ww
w.jbc.org/
Dow
nloaded from