insulin resistance in cancer cachexia and metabolic ... · rodolfo gonzalez camargo insulin...
TRANSCRIPT
RODOLFO GONZALEZ CAMARGO
Insulin resistance in Cancer cachexia and
Metabolic Syndrome: Role of insulin activated
macrophages and miRNA-21-5p
Thesis presented to the Post-Graduate Program in Cell and Tissue Biology, Instituto de Ciências Biomédicas, Universidade de São Paulo and to the Post-Graduate Program in Nutritional Biochemistry, Institüt für Ernährungswissenschaft, Universität Potsdam, to obtain the Ph.D. title.
São Paulo 2016
RODOLFO GONZALEZ CAMARGO
Insulin resistance in Cancer cachexia and
Metabolic Syndrome: Role of insulin activated
macrophages and miRNA-21-5p
Thesis presented to the Post-Graduate Program in Cell and Tissue Biology, Instituto de Ciências Biomédicas, Universidade de São Paulo and to the Post-Graduate Program in Nutritional Biochemistry, Institüt für Ernährungswissenschaft, Universität Potsdam, to obtain the Ph.D. title. Area: Cell and Tissue Biology and Nutritional Biochemistry Advisors: Dr. Marília Cerqueira Leite Seelaender and Dr. Gerhard Paul Püschel Original Version
São Paulo 2016

RODOLFO GONZALEZ CAMARGO
Resistência à Insulina na Caquexia Associada ao
Câncer e na Síndrome Metabólica: Papel dos
Macrófagos ativados pela Insulina e do miRNA-
21-5p
Tese apresentada ao Departamento de Biologia Celular e do Desenvolvimento do Instituto de Ciências Biomédicas da Universidade de São Paulo e ao programa de Pós-Graduação em Bioquímica dos Alimentos do Instituto de Ciências dos Alimentos da Universidade de Potsdam para obtenção do título de doutor em Ciências. Área: Biologia Celular e do Desenvolvimento e Bioquímica dos Alimentos Orientadores: Dra. Marília Cerqueira Leite Seelaender e Dr. Gerhard Paul Püschel Versão original
São Paulo 2016
This work is licensed under a Creative Commons License: Attribution 4.0 International To view a copy of this license visit http://creativecommons.org/licenses/by/4.0/ Published online at the Institutional Repository of the University of Potsdam: URN urn:nbn:de:kobv:517-opus4-100973 http://nbn-resolving.de/urn:nbn:de:kobv:517-opus4-100973


To my family, the reason for my existence and to the hope that we can change the reality
of our country through education.

ACKNOWLEDGEMENTS
To all my laboratory colleagues, in special to the labmates Reinaldo Bassit, Marcelo
Semiatzh, Daniela Caetano, Silvio Pires Gomes, Rodrigo Xavier, Daniela Riccardi, Katrin
Radloff, Emídio Matos, Joanna Carola, Raquel Figueredo, Bruna Rio Branco and Michele
Alves and also to my German labmates, Dr. Andrea Pathe-Neuschäfer-Rube, Dominic
Coleman, Stefanie Lieske, Anne Schraplau, Katja Dieckow, Jenny Gawehn and Julia
Manowsky, for the friendship and for the valuable help. To Marco Amadeu, Emilia Ribeiro,
Manuela Kuna and Ines Kahnt for the excellent technical support provided. To all the library
professionals, with whom I could always count on. To the patients who agreed to participate
in the study and without whom this Thesis would not be possible. To Dr. José Piñata Otoch,
Dr. Linda Ferreira Maximiano and Dr. Paulo Sérgio Martins de Alcântara, who were involved
in the project with a high level of competence and efficiency. To Dr. Frank Neuschäfer-Rube
and Dr. Janin Henkel, who assisted me during the german phase of the project in Germany
and made it happen with every day support. Finaly, to both my supervisors Dr. Marilia
Cerqueira Leite Seelaender and Dr. Gerhard Paul Püschel, who trusted in me and offered
constant support during the whole process, not only professionally, but also personally. Your
help was of great value for my personal life and the planning of my career. To all of the
secretariates, particularly Ms. Regina, Ms. Mahler, Ms. Marilia Oliveira and Ms. Pester, who
always guided me on the necessary steps and helped me with the burocracy involved in the
co-tutelle program and University demands. I thank CAPES and PROBRAL, for the financial
support. To all my family and friends, especially my parents Fabio Luis Prioli Camargo and
Daisy Ligia Gonzalez Camargo, my brother Rafael Gonzalez Camargo and my former-wife
Renata Brionízio Lemos, who were able to advise me at difficult times and helped me turning
this dream true. This work and degree are also for you and to you!

“The most powerful force in the universe is faith”.

ABSTRACT
Camargo, RG. Insulin resistance in Cancer Cachexia and Metabolic Syndrome: Role of insulin activated macrophages and miRNA-21-5p. [Ph.D. Thesis (Celular and Tissue biology)]. São Paulo: Instituto de Ciências Biomédicas, Universidade de São Paulo; 2016. Potsdam: Institüt für Ernährungswissenschaft, Universität Potsdam; 2016.
The ever-increasing fat content in Western diet, combined with decreased levels of physical activity, greatly enhance the incidence of metabolic-related diseases. Cancer cachexia (CC) and Metabolic syndrome (MetS) are both multifactorial highly complex metabolism related syndromes, whose etiology is not fully understood, as the mechanisms underlying their development are not completely unveiled. Nevertheless, despite being considered “opposite sides”, MetS and CC share several common issues such as insulin resistance and low-grade inflammation. In these scenarios, tissue macrophages act as key players, due to their capacity to produce and release inflammatory mediators. One of the main features of MetS is hyperinsulinemia, which is generally associated with an attempt of the β-cell to compensate for diminished insulin sensitivity (insulin resistance). There is growing evidence that hyperinsulinemia per se may contribute to the development of insulin resistance, through the establishment of low grade inflammation in insulin responsive tissues, especially in the liver (as insulin is secreted by the pancreas into the portal circulation). The hypothesis of the present study was that insulin may itself provoke an inflammatory response culminating in diminished hepatic insulin sensitivity. To address this premise, firstly, human cell line U937 differentiated macrophages were exposed to insulin, LPS and PGE2. In these cells, insulin significantly augmented the gene expression of the pro-inflammatory mediators IL-1β, IL-8, CCL2, Oncostatin M (OSM) and microsomal prostaglandin E2 synthase (mPGES1), and of the anti-inflammatory mediator IL-10. Moreover, the synergism between insulin and LPS enhanced the induction provoked by LPS in IL-1β, IL-8, IL-6, CCL2 and TNF-α gene. When combined with PGE2, insulin enhanced the induction provoked by PGE2 in IL-1β, mPGES1 and COX2, and attenuated the inhibition induced by PGE2 in CCL2 and TNF-α gene expression contributing to an enhanced inflammatory response by both mechanisms. Supernatants of insulin-treated U937 macrophages reduced the insulin-dependent induction of glucokinase in hepatocytes by 50%. Cytokines contained in the supernatant of insulin-treated U937 macrophages also activated hepatocytes ERK1/2, resulting in inhibitory serine phosphorylation of the insulin receptor substrate. Additionally, the transcription factor STAT3 was activated by phosphorylation resulting in the induction of SOCS3, which is capable of interrupting the insulin receptor signal chain. MicroRNAs, non-coding RNAs linked to protein expression regulation, nowadays recognized as active players in the generation of several inflammatory disorders such as cancer and type II diabetes are also of interest. Considering that in cancer cachexia, patients are highly affected by insulin resistance and inflammation, control, non-cachectic and cachectic cancer patients were selected and the respective circulating levels of pro-inflammatory mediators and microRNA-21-5p, a posttranscriptional regulator of STAT3 expression, assessed and correlated. Cachectic patients circulating cytokines IL-6 and IL-8 levels were significantly higher than those of non-cachectic and controls, and the expression of microRNA-21-5p was significantly lower. Additionally, microRNA-21-5p reduced expression correlated negatively with IL-6 plasma levels. These results indicate that hyperinsulinemia per se might contribute to the low grade inflammation prevailing in MetS patients and thereby promote the development

of insulin resistance particularly in the liver. Diminished MicroRNA-21-5p expression may enhance inflammation and STAT3 expression in cachectic patients, contributing to the development of insulin resistance. Keywords: Cachexia. Metabolic Syndrome. Inflammation. Insulin Resistance. MicroRNAs. Insulin. Liver. Macrophages.

RESUMO
Camargo, RG. Resistência à Insulina na Caquexia Associada ao Câncer e na Síndrome Metabólica: Papel dos Macrófagos ativados pela Insulina e do miRNA-21-5p. [Tese (Doutorado em biologia celular e tecidual)]. São Paulo: Instituto de Ciências Biomédicas, Universidade de São Paulo; 2016. Potsdam: Institüt für Ernährungswissenschaft, Universität Potsdam; 2016. O teor de gordura cada vez maior na dieta ocidental, combinada com a diminuição dos níveis de atividade física têm marcadamente aumentado à incidência de doenças relacionas ao metabolismo. A caquexia associada ao câncer (CC) e a síndrome metabólica (SM) são síndromes de etiologia complexa e multifatorial, não totalmente compreendida, e com mecanismos subjacentes ao seu desenvolvimento não completamente revelados. No entanto, apesar de serem consideradas "lados opostos", a CC e a MetS apresentam várias características em comum, tais como resistência à insulina e inflamação de baixo grau, com macrófagos teciduais como importantes coadjuvantes, devido à sua capacidade de produzir e liberar mediadores inflamatórios, e microRNAs, descritos como RNAs não-codificantes ligados à regulação da expressão de proteínas e reconhecidos como participantes ativos na geração de várias doenças inflamatórias, tais como o câncer e diabetes tipo II. Uma das principais características da MetS é a hiperinsulinemia, que está geralmente associada com uma tentativa da célula β do pâncreas de compensar a diminuição da sensibilidade à insulina (resistência à insulina). Um número crescente de evidências sugere que a hiperinsulinemia “por si só”, pode contribuir com o desenvolvimento de resistência à insulina através do estabelecimento de um quadro inflamatório de baixo grau, em tecidos sensíveis a insulina, e em particular no fígado, devido ao fato da insulina ser secretada pelo pâncreas na circulação portal. A hipótese do presente estudo foi que a insulina pode induzir uma resposta inflamatória em macrófagos e culminar em diminuição da sensibilidade hepática à insulina. Para confirmar esta hipótese, primeiramente, macrófagos diferenciados da linhagem de células humanas U937 foram expostos à insulina, LPS e PGE2. Nestas células, a insulina aumentou significativamente a expressão gênica dos mediadores pró-inflamatórios IL-1β, IL-8, CCL2, oncostatina M (OSM) e prostaglandina E2 sintase microssomal (mPGES1), e do mediador anti-inflamatório IL-10. Além disso, o sinergismo entre insulina e LPS aumentou a indução provocada por LPS nos genes da IL-1β, IL-8, IL-6, CCL2 e TNF-α. Quando combinado com PGE2, a insulina aumentou a indução provocada pela PGE2 nos genes da IL-1β, mPGES1 e COX2, e restaurou a inibição induzida pela PGE2 no gene CCL2 e TNF-α. Subsequentemente, sobrenadantes dos macrófagos U937 tratados com insulina modulou negativamente a sinalização da insulina em culturas primárias de hepatócitos de rato, como observado pela atenuação de 50% da indução dependente de insulina da enzima glicoquinase. Citocinas contidas no sobrenadante de macrófagos U937 tratados com insulina também ativaram em hepatócitos ERK1/2, resultando na fosforilação do resíduo de serina inibitório do substrato do receptor de insulina. Adicionalmente, o fator de transcrição STAT3 foi ativado por um elevado grau de fosforilação e a proteína SOCS3, capaz de interromper a via de sinalização do receptor de insulina, foi induzida. Considerando que na caquexia associada ao câncer, pacientes são altamente afetados pela resistência à insulina e inflamação, pacientes controle, não caquéticos e caquéticos foram seleccionados e os respectivos níveis circulantes de mediadores pró-inflamatórios e microRNA-21-5p, um regulador pós-transcricional da expressão de STAT3, avaliados e correlacionados. Pacientes
caquéticos exibiram citocinas circulantes IL-6 e IL-8 significativamente maiores do que pacientes não caquéticos e controles, assim como a expressão de microRNA-21-5p significativamente diminuida. Além disso, a reduzida expressão de microRNA-21-5p correlaciona-se negativamente com níveis de IL-6 no plasma. Estes resultados indicam que a hiperinsulinemia pode, por si só contribuir para o desenvolvimento da inflamação de baixo grau prevalente em pacientes com excesso de peso e obesos e, assim, promover o desenvolvimento de resistência à insulina especialmente no fígado e o nível reduzido de miRNA-21-5p pode modular a inflamação e expressão de STAT3 em pacientes caquéticos, contribuindo para o desenvolvimento da resistência à insulina. Palavras-chave: Caquexia. Síndrome Metabólica. Inflamação. Resistência à Insulina. MicroRNAs. Insulina. Fígado. Macrófagos.

ZUSAMMENFASSUNG
Camargo, RG. Insulinresistenz in Tumorkachexie und Metabolischem Syndrom: Die Rolle von insulin-aktivierten Makrophagen und miRNA-21-5p. [Thesis (Doctoral degree in Celular and Tissue biology)]. São Paulo: Instituto de Ciências Biomédicas, Universidade de São Paulo; 2016. Potsdam: Institüt für Ernährungswissenschaft, Universität Potsdam; 2016.
Der stetig steigende Fettgehalt in westlicher Ernährung in Kombination mit reduzierter körperlicher Aktivität hat zu einem dramatischen Anstieg der Inzidenz metabolischer Erkrankungen geführt. Tumorkachexie (Cancer cachexia, CC) und Metabolisches Syndrom (MetS) sind sehr komplexe, multifaktorielle metabolische Erkrankungen, deren Ätiologie nicht vollständig verstanden ist. Die molekularen Ursachen, die zu diesen Symptomkomplexen führen, sind noch unzureichend aufgeklärt. Obwohl ihr äußeres Erscheinungsbild stark gegensätzlich ist, haben MetS und CC etliche Gemeinsamkeiten wie zum Beispiel Insulinresistenz und eine chronische unterschwellige Entzündung. Sowohl bei der Entstehung der Insulinresistenz als auch bei der chronischen Entzündung spielen Makrophagen eine Schlüsselrolle, weil sie in der Lage sind pro-inflammatorische Mediatoren zu produzieren und freizusetzen. Eine der hervorstechendsten Auffälligkeiten des MetS ist die Hyperinsulinämie, die durch den Versuch der β-Zelle, die verminderte Insulinsensitivität (Insulinresistenz) zu kompensieren, zustande kommt. Es gibt zunehmend Hinweise darauf, dass die Hyperinsulinämie selber an der Entzündungsentstehung in Insulin-abhängigen Geweben beteiligt ist und dadurch zur Entwicklung und Verstärkung der Insulinresistenz beitragen kann. Dies trifft besonders auf die Leber zu, weil hier die Insulinspiegel besonders hoch sind, da Insulin vom Pankreas direkt in den Pfortaderkeislauf gelangt. Daher wurde in dieser Arbeit die Hypothese geprüft, ob Insulin selber eine Entzündungsantwort auslösen und dadurch die hepatische Insulinsensitivität senken kann. Zu diesem Zweck wurde die humane Zelllinie U937 durch PMA-Behandlung zu Makrophagen differenziert und diese Makrophagen mit Insulin, LPS und PGE2 inkubiert. In diesen Zellen steigerte Insulin die Expression der pro-inflammatorischen Mediatoren IL-1β, IL-8, CCL2, Oncostatin M (OSM) signifikant und induzierte die mikrosomale PGE-Synthase 1 (mPGES1) ebenso wie das anti-inflammatorische Cytokin IL-10. Ferner verstärkte Insulin die LPS-abhängige Induktion des IL-1β-, IL-8-, IL-6-, CCL2- und TNFα-Gens. Ebenso verstärkte Insulin die PGE2-abhängige Induktion von IL-1β, mPGES1 und COX2. Im Gegensatz dazu schwächte es die Hemmende Wirkung von PGE2 auf Expression von TNFα und CCL2 ab und trug so auf beide Weisen zu einer Verstärkung der Entzündungsantwort bei. Überstände von Insulin-behandelten U937 Makrophagen reduzierten die Insulin-abhängige Induktion der Glukokinase in Hepatocyten um 50%. Die Cytokine, die im Überstand Insulin-behandelter Makrophagen enthalten waren, aktivierten in Hepatocyten ERK1/2, was zu einer inhibitorischen Serin-Phosphorylierung der Insulin Rezeptor Substrats (IRS) führte. Zusätzlich führten die Cytokine zu einer Phosphorylierung und Aktivierung von STAT3 und einer dadurch bedingten Induktion von SOCS3, das seinerseits die Insulinrezeptor-Signalkette unterbrechen kann. MicroRNAs, nicht-codierende RNAs, die an der Regulation der Proteinexpression beteiligt sind und deren Beteiligung an der Regulation der Entzündungsantwort bei zahlreichen Erkrankungen, unter anderem Tumorerkrankungen und Typ II Diabetes gezeigt wurde, sind auch von Interesse. Unter dem Blickwinkel, dass Tumor-Kachexie Patienten sich durch eine

Insulinresistenz und eine systemische Entzündung auszeichnen, wurden in nicht-kachektische und tumorkachektische Patienten Plasmaspiegel von pro-inflammatorischen Mediatoren und der microRNA-21-5p bestimmt, von der bekannt ist, dass sie ein posttranskriptioneller Regulator der STAT3 Expression ist. Die Spiegel der pro-inflammatorischen Mediatoren und der miRNA-21-5p wurden korreliert. In kachektischen Patienten waren die Spiegel der Cytokine IL-6 und IL-8 signifikant höher, die der miRNA-21-5p signifikant niedriger als in nicht-kachektischen Patienten. Die Plasma IL-6-Spiegel korrelierten negativ mit den miRNA21-5p Spiegeln. Insgesamt zeigen die Ergebnisse, dass eine Hyperinsulinämie selber zu der Entwicklung einer unterschwellingen Entzündung, wie sie in Patienten mit einem MetS vorherrscht, beitragen, und dadurch besonders in der Leber eine Insulinresistenz auslösen oder verstärken kann. Eine verringerte Expression der MicroRNA-21-5p kann in kachektischen Patienten die Entzündungsantwort, im Speziellen die STAT3 Expression, verstärken und dadurch zur Entwicklung einer Insulinresistenz beitragen
Schlüsselwörter: Kachexie. Metabolisches Syndrom. Entzündung. Insulinresistenz. MicroRNAs . Insulin. Leber. Makrophagen.
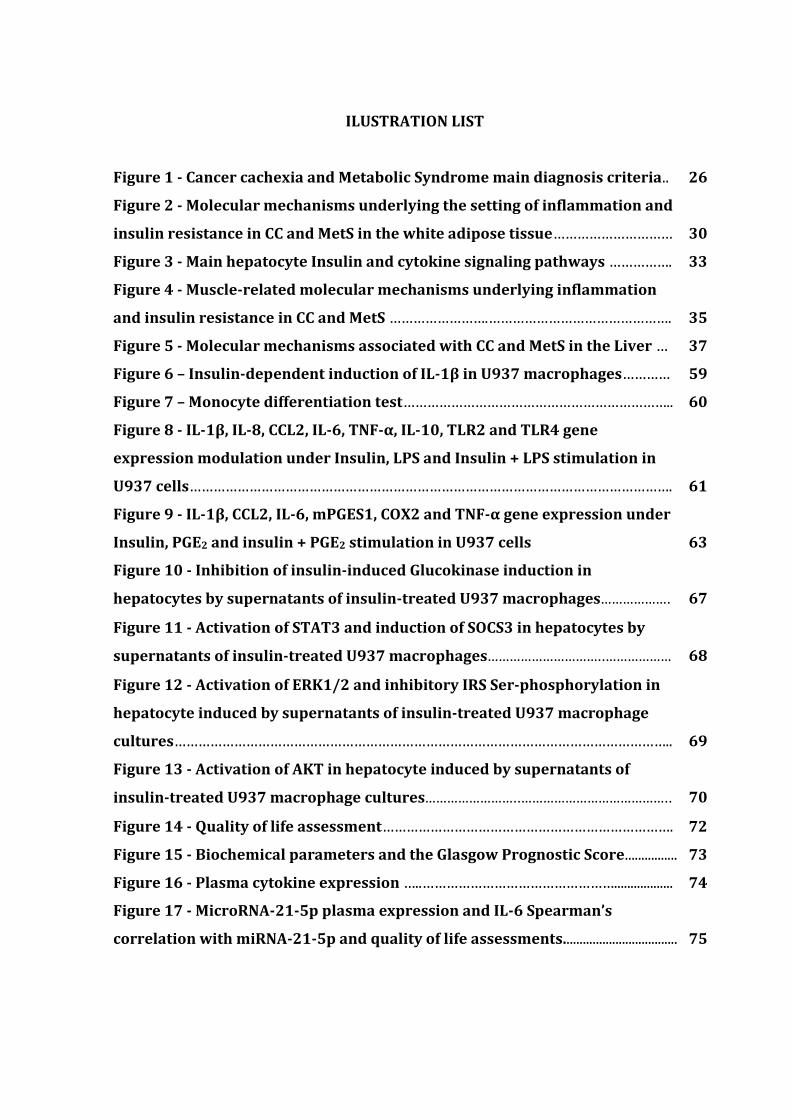
ILUSTRATION LIST
Figure 1 - Cancer cachexia and Metabolic Syndrome main diagnosis criteria.. 26
Figure 2 - Molecular mechanisms underlying the setting of inflammation and
insulin resistance in CC and MetS in the white adipose tissue…………………………
30
Figure 3 - Main hepatocyte Insulin and cytokine signaling pathways ……………. 33
Figure 4 - Muscle-related molecular mechanisms underlying inflammation
and insulin resistance in CC and MetS …………………….……………………………………….
35
Figure 5 - Molecular mechanisms associated with CC and MetS in the Liver … 37
Figure 6 – Insulin-dependent induction of IL-1β in U937 macrophages………… 59
Figure 7 – Monocyte differentiation test………………………………………………………….. 60
Figure 8 - IL-1β, IL-8, CCL2, IL-6, TNF-α, IL-10, TLR2 and TLR4 gene
expression modulation under Insulin, LPS and Insulin + LPS stimulation in
U937 cells………………………………………………………………………………………………………….
61
Figure 9 - IL-1β, CCL2, IL-6, mPGES1, COX2 and TNF-α gene expression under
Insulin, PGE2 and insulin + PGE2 stimulation in U937 cells
63
Figure 10 - Inhibition of insulin-induced Glucokinase induction in
hepatocytes by supernatants of insulin-treated U937 macrophages……………….
67
Figure 11 - Activation of STAT3 and induction of SOCS3 in hepatocytes by
supernatants of insulin-treated U937 macrophages…………………………..………………
68
Figure 12 - Activation of ERK1/2 and inhibitory IRS Ser-phosphorylation in
hepatocyte induced by supernatants of insulin-treated U937 macrophage
cultures……………………………………………………………………………………………………………..
69
Figure 13 - Activation of AKT in hepatocyte induced by supernatants of
insulin-treated U937 macrophage cultures……………………..…………………………………..
70
Figure 14 - Quality of life assessment………………………………………………………………. 72
Figure 15 - Biochemical parameters and the Glasgow Prognostic Score................ 73
Figure 16 - Plasma cytokine expression …..………………………………………….................. 74
Figure 17 - MicroRNA-21-5p plasma expression and IL-6 Spearman’s
correlation with miRNA-21-5p and quality of life assessments...................................
75

TABLE LIST
Table 1 - Main characteristics of Cancer cachexia and Metabolic Syndrome.. 27
Table 2 - Reference Range of Insulin Levels………………………………………………….. 38
Table 3 - Primary and secondary antibodies adopted in the Western blot
analysis………………………………………………………………………………………………………...
50
Table 4 - U937 Cell culture and rat primary hepatocytes study primer list….. 52
Table 5 - Large molecular weight RNA Primer List ……………………………………… 57
Table 6 - Pro-inflammatory mediator gene expression in insulin U937
stimulated cells.………………………………………………………………………………………………
64
Table 7 - Pro-inflammatory mediator gene expression in LPS and LPS +
insulin U937 stimulated cells.………………………………………………………………………...
64
Table 8 - Pro-inflammatory mediator gene expression in PGE2 and PGE2 +
insulin U937 stimulated cells.………………………………………………………………………...
65
Table 9 - General characteristics of patients in each group.…………………………. 72
ABBREVIATURE LIST
AA Amino acid;
AIDS Acquired Immune Deficiency Syndrome;
AKT Protein Kinase B;
ALB Albumin;
AMP Adenosine monophosphate;
ANOVA Analysis of variance;
AP1 Activator protein 1;
APS Ammonium Persulfate;
ATGL Adipose Triglyceride Lipase;
ATP III Adult Treatment Panel III;
BMI Body mass index;
CC Cancer Cachexia;
CCL2 ‘CC’-chemokine ligand 2 (monocyte chemoattractant protein
1);
CD68 Cluster of Differentiation 68;
cDNA Complementary DNA;
CHF Chronic Heart Failure;
COPD Chronic Obstructive Pulmonary Disease;
COX-2 Cyclooxygenase-2;
CRP C-Reactive protein;
Ct Cycle Threshold;
CVD Cardiovascular Disease;
DNA Deoxyribonucleic acid;
ERK1/2 Extracellular signal-regulated kinases 1 and 2;
FCS Fetal Calf serum;
FFA Free-fatty Acid;
FOXO1 Forkhead box protein O1;
FPG Fasting plasma glucose;
GAPDH Glyceraldehyde 3-phosphate dehydrogenase;
GK Glucokinase;
GLUT Glucose transporter;
GPS Glasgow prognostic Score;
HDL-C High density lipoprotein cholesterol;
HC Hepatocyte;
HRP Horseradish peroxidase;
HSL Hormone Sensitive Lipase;
IDF International Diabetes federation;
IκB Inhibitor of kappa B;
IKK Inhibitor of kappa B kinase;
IL-6-R Interleukin-6 receptor;
IL Interleukin;
INSR Insulin receptor;
IR Insulin resistance;
IRS Insulin receptor substrate;
JAK Janus kinase;
JNK c-Jun N-terminal kinase;
LPS Lipopolysaccharide;
LDL Low-density lipoprotein;
LDL-R Low-density lipoprotein receptor;
MAP Mitogen Activated Protein;
MetS Metabolic Syndrome;
miRNA MicroRNA;
miRISC MicroRNA-induced silencing complex;
mPGES1 Microsomal prostaglandin E2 synthase 1;
mRNA Messenger RNA;
NCS Neonatal Calf serum;
NFκB Nuclear factor kappa B;
nt Nucleotide;
OSM oncostatin M;
PCR Polymerase chain reaction;
PDK Phosphoinositide-dependent kinase;
PGE2 Prostaglandin E2;
PKC Protein Kinase C;
PI3K Phosphatidylinositol-4,5-bisphosphate 3-kinase;

PIF Proteolysis inducing factor;
PIP2 Phosphatidylinositol (4,5)-bisphosphate;
PIP3 Phosphatidylinositol (3,4,5)-trisphosphate;
PLIN Perilipin;
PMA Phorbol-myristate acetate;
pre-miRNA Precursor microRNA;
pri-miRNA Primary microRNA;
PTEN Phosphatase and tensin homolog;
PTP1B Protein-tyrosine phosphatase 1B;
PVDF Polyvinylidene difluoride;
TG Triglyceride;
TNF-α Tumor necrosis factor alpha;
TLR Toll-like receptor;
STAT3 Signal transducer and activator of transcription 3;
SOCS3 Suppressor of cytokine signaling 3;
RNA Ribonucleic acid;
SDS-PAGE sodium dodecylsulfate polyacrylamid electrophoresis;
SREBP Sterol regulatory element-binding protein;
VLDL Very-low-density lipoprotein;
TPCA-1 2-[(Aminocarbonyl)amino]-5-(4-fluorophenyl)-3-
thiophenecarboxamide;
TEMED Tetramethylethylenediamine;
UTR Untranslated region;
SUMMARY
1 INTRODUCTION………………………………………………………………………………… 23
1.1 Cancer cachexia and the Metabolic Syndrome………………………………… 23
1.2 Definitions and main symptoms…………………………………………………….... 24
1.2.1 Cachexia……………………………………………………………………………………………. 24
1.2.2 Metabolic Syndrome…………………………………………………………………............. 25
1.3 Inflammation………………………………………………………………………………….... 27
1.3.1 Inflammation in the adipose tissue………………………………………………...... 28
1.4 Insulin resistance…………………………………………………………………………….. 30
1.4.1 Effects of inflammation and insulin resistance on the Muscle……........... 33
1.4.2 Effects of hepatic inflammation and insulin resistance …………………… 35
1.4.3 Hyperinsulinemia……………………………………………………………………………... 37
1.5 MicroRNAs in inflammatory states and metabolic conditions……….. 38
1.5.1 MicroRNA-21-5p………………………………………………………………………………... 39
1.6 Integrated metabolism and main hypothesis…………………………………. 40
2 AIMS………………………………………………………………………………………………….. 42
2.1 General……………………………………………………………………………………………… 42
2.2 Specific……………………………………………………………………………………………… 42
3 MATERIAL E METHODS…………………………………………………………………...... 43
3.1 Part I – Insulin-induced insulin resistance: Cell culture and rat
primary hepatocyte study…………………………………………………………………………………
43
3.1.1 Materials…………………………………………………………………………………………... 43
3.1.2 Animals…………………………………………………………………………………………….. 43
3.1.3 U937 cell culture………………………………………………………………………………. 44
3.1.3.1 U937 cell culture differentiation experiment………………………………………… 44
3.1.3.2 U937 macrophages stimulation with Insulin and LPS……………….................... 44
3.1.4 Rat primary hepatocytes culture……………………………………………………… 44
3.1.4.1 Non-recirculating in situ perfusion of rat liver for hepatocyte
isolation……………………………………………………………………………………..………………………….
45
3.1.4.2 Preparation of rat hepatocytes…………………………………………………................. 45
3.1.4.3 Rat hepatocytes isolation by density gradient centrifugation………………… 46
3.1.4.4 Cell counting……………………………………………………………………….…………….. 46

3.1.4.5 Rat hepatocytes culture……………………………………………………………………… 46
3.1.4.6 U937 macrophages and rat primary hepatocytes protein expression
analysis by Western blot………………………………………………...........................................................
47
3.1.4.6.1 Preparation of cell lysates……………………………………………………………............ 47
3.1.4.6.2 Protein determination by the Bradford method…………………………………….. 47
3.1.4.6.3 Preparation of the samples for the SDS-polyacrylamide gel
electrophoresis (SDS-PAGE)…………………………………………………………………………………....
48
3.1.4.6.4 Protein separation by SDS-PAGE…………………………………………………………. 48
3.1.4.6.5 Protein transfer to PVDF membranes…………………………………………………... 48
3.1.4.6.6 Detection of the blotted proteins by Ponceau S staining…………………............ 49
3.1.4.6.7 Immunological detection of proteins by the peroxidase-mediated
chemiluminescent reaction…………………………………………………………………………………….
49
3.1.4.7 U937 Macrophage and rat primary hepatocyte gene expression analysis by
Real time PCR……………………………………………………………………………………………………
50
3.1.4.7.1 Total RNA extraction…………………………………………………………………………... 50
3.1.4.7.2 Complementary DNA synthesis…………………………………………………………….. 51
3.1.4.7.3 Real-time PCR amplification………………………………………………………………… 51
3.1.4.8 Statistics…………………………………………………………………………………………….. 52
3.2 Part II – Study with patients……………………………………………………………. 53
3.2.1 Patient recruitment………………………………………………………………………….. 53
3.2.1.1 Ethics Committee approval………………………………………………………….............. 53
3.2.1.2 Inclusion criteria…………………………………………………………………………............ 53
3.2.1.3 Consent term signature obtainment and clinical evaluation……....................... 53
3.2.2 Clinical and biochemical parameters assessment………………………......... 54
3.2.3 Real time PCR (RT-PCR) analysis……………………………………………………… 54
3.2.3.1 Total RNA extraction………………………………………………………………………….. 54
3.2.3.2 Complementary DNA synthesis……………………………………………………............. 55
3.2.3.3 Primer validation……………………………………………………………………………….. 55
3.2.3.4 Real-time PCR Amplification……………………………………………………………….. 56
3.2.4 Plasma pro and anti-inflammatory cytokine and chemokine content
measurement (IL-1β, IL-6, IFN-γ, TNF-α, IL-10, IL-8, CCL2)…………………………………
57
3.2.5 Statistics.......................................................................................................... ...................... 57
4 RESULTS…………………………………………………………………………………………... 58

4.1 Part I – Insulin-induced insulin resistance: Cell culture and rat
primary hepatocyte study……………………………………...………………………………………...
58
4.1.1 Insulin-dependent induction of IL-1β production in U937
macrophages……………………………………………………………………………………………………….
58
4.1.2 Exclusion of an insulin-dependent induction of U937 monocyte
differentiation into macrophages…………………..……………………………………………………
59
4.1.3 Insulin-dependent induction of cytokine production in U937
macrophages and synergism with pro-inflammatory mediators……………………….
60
4.1.4 Induction of insulin resistance in hepatocytes by supernatants of
insulin-treated U937 macrophages……………………………………………………………………..
65
4.2 Part II – Study with Humans……………………………………………………………. 71
4.2.1 Clinical findings………………………………………………………………………………... 71
4.2.2 Quality of life assessment………………………………………………………………… 71
4.2.3 Biochemical parameters……………………………………………………….................. 72
4.2.4 Cytokine expression assay…………………………………………………….................. 73
4.2.5 MicroRNA expression assay……………………………………………………………… 74
5 DISCUSSION…………………………………………………………………………………….... 76
6 CONCLUSION…………………………………………………………………………………….. 82
REFERENCES……………………………………………………………………………………. 83
APPENDIX………………………………………………………………………………………... 91
A - FREE AND INFORMED CONSENT FORM……………………………………... 91
SUPPLEMENTARY MATERIAL…………………………………………………………. 93
A - U937 cell culture experiment - buffers and Solutions……………… 93
B - Rat primary hepatocytes experiment - buffers and Solutions….. 95
C - U937 macrophages and rat primary hepatocytes protein
expression analysis by Western blot - Buffers and solutions………….
99


23
1 INTRODUCTION
1.1 Cancer cachexia and the Metabolic Syndrome
Cancer cachexia (CC) and Metabolic Syndrome (MetS) are both recognized as multifactorial
conditions with marked impairment of intermediate metabolism. Cachexia was described as
a wasting condition two thousand years ago and is frequently reported as a common
negative consequence of diseases such as cancer, Chronic Heart Failure (CHF), Chronic
Obstructive Pulmonary Disease (COPD), Acquired Immune Deficiency Syndrome (AIDS) and
sepsis, among other. MetS is a consequence of excessive calorie intake combined with
reduced energy expenditure due to a sedentary life style. It is considered a risk factor for
heart disease and other health problems, such as stroke and/or type II diabetes. Both
syndromes share several common issues, in spite of a major differences regarding the final
outcome: the excessive uptake and storage of energy substrates in MetS leading to
overweight or obesity, while in CC extensive catabolism of fat and lean mass is the most
prominent feature (1).
Cachexia is present in approximately half of all cancer patients, and in 15% of
patients with Chronic Heart Failure (CHF) (2). This scenario rises up to 80% in cancer patients
with advanced disease (3). In addition to markedly increasing cancer-associated morbidity,
leading to a gradual loss of peripheral organ function (1), cachexia is directly responsible for
the death of a large proportion of cancer patients, reaching up to 20% (3). Furthermore, the
quality of life of cachectic patients is compromised, implying in reduced effect of cancer
treatment (4). In spite of its clinical relevance, to the present date there is no nutritional (5)
or pharmacological treatment able to prevent, attenuate or to stop the progression of the
syndrome (6), frustrating physicians and patients.
The Metabolic syndrome (MetS), on the other hand, is one of the most intriguing and
complex conditions of modern life (7), and is associated with high morbidity and mortality
among adults. The prevalence of MetS is around 20-30% in developed countries (8), this
figure rises up to over 40% in adults over the age of 50 (9) and even more alarmingly, the
high fat content in Western diets, combined with low physical activity cause a significant
number of children to develop some of MetS symptoms (10). The definition for MetS, which
is also known as the “insulin resistance syndrome”, may be found below on the item 1.2.2,

24
and among its main features, lipid metabolism abnormalities and insulin resistance are the
most prominent. This disease is linked to a 2-fold increase in cardio-vascular disease risk and
to 1.5-fold augmented mortality, as well as to a 5-fold increase in the risk of developing type
II diabetes (11). The global epidemics of obesity and related outcomes, such as type II
diabetes and cardiovascular disease have raised the attention addressed to MetS, which has
thus become a major focus in clinical research. Dietary modification and lifestyle
intervention may prevent the development of MetS (12).
1.2 Definitions and main symptoms
1.2.1 Cachexia
Cachexia is still a sub-diagnosed syndrome, and the mechanisms underlying its development
are not fully understood. In order to better understand the syndrome and its mechanisms, in
December 2007 a group of researchers and clinicians combined efforts to discuss what
would be the best way to define cachexia. The definition that emerged was: ‘‘Cachexia is a
complex metabolic syndrome associated with underlying illness and characterized by loss of
muscle with or without loss of fat mass”. In this international meeting, the group additionally
discussed the possible diagnostic criteria. According to Evans and colleagues (13), the patient
should present involuntary weight loss > 5% in the past 12 months or Body Mass Index (BMI)
< 20 kg/m2, and additionally, three of five other symptoms: Decreased muscle strength,
Fatigue, Anorexia, Low fat-free mass index and Abnormal biochemistry as increased
inflammatory markers such as C-Reactive protein (CRP) and Interleukin-6 (IL-6), anemia or
low serum albumin. This was the first proposition in which clear criteria for diagnosis were
established. In the year 2011, cancer cachexia experts gathered in a formal consensus
process to update the definition and diagnosis criteria (14). The updated definition proposed
was: Cachexia is a “multifactorial syndrome defined by ongoing loss of skeletal muscle mass
(with or without loss of fat mass) that cannot be fully reversed by conventional nutritional
support and leads to progressive functional impairment. Its pathophysiology is characterized
by a negative protein and energy balance, driven by a variable combination of reduced food
intake and abnormal metabolism”. Additionally, a new and most relevant aspect was added
to cachexia clinical assessment; the concept of three different stages: pre-cachexia, in which

25
anorexia and metabolic changes may be observed before weight loss; cachexia itself,
including weight loss > 5% in the past six months or weight loss between 2% and 5% and BMI
< 22 in the past six months or, still the presence of sarcopenia with often reduced food
intake and systemic inflammation; and refractory cachexia, in which a low performance
score and poor responsiveness to cancer treatment is observed; usually, life expectancy does
not exceed three months (14).
1.2.2 Metabolic Syndrome
The definition of MetS has been proposed by the experts of the Adult Treatment Panel III
(ATP III, 2001-2005), and, by the International Diabetes Federation (IDF - 2005) (15). The best
way to define MetS is still frequently the focus of debate in the literature, and despite the
criteria may vary to some degree in all of them; in general, MetS definitions target a
population with increased risk for the development of type II diabetes mellitus and increased
risk for cardiovascular disease (CVD). A cluster of five factors was selected for MetS
diagnosis, in which three or more of these components confirm the presence of the
condition: Increased waist circumference or central obesity, dyslipidemia (high triglycerides
(TGs) and/or low high-density lipoprotein cholesterol (HDL-C), high fasting plasma glucose
(FPG) and high systolic blood pressure (9, 15). Besides that, additional features such as liver
steatosis or non-alcoholic steatohepatitis (NASH) and sarcopenia are frequently pointed out
as part of the syndrome. MetS is also known to be associated with a state of chronic low-
grade inflammation (10) and oxidative stress.

26
Figure 1 – Cancer cachexia and Metabolic Syndrome main diagnosis criteria
Adapted from Evans et. al., 2008 (13)
Adapted from Fearon et. al., 2011 (14)
C
Adapted from Grundy et. al., 2004 (16)
Cancer Cachexia (A and B) and Metabolic Syndrome (C) diagnosis criteria.
27
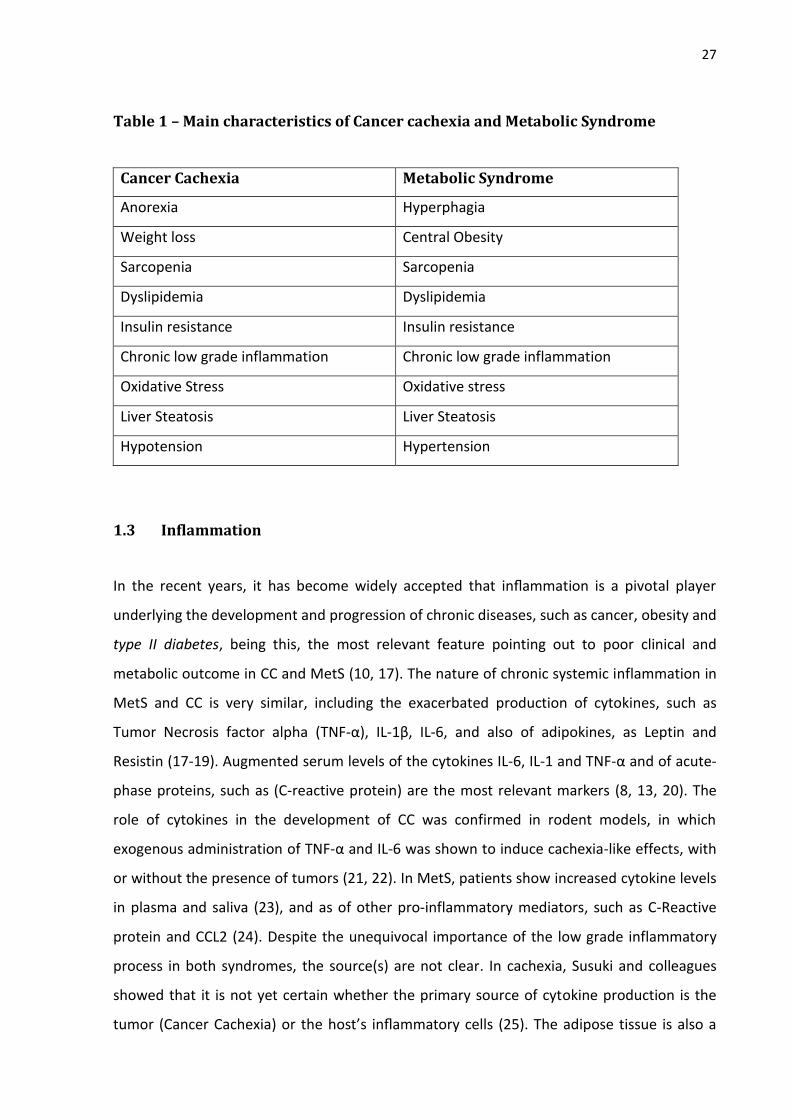
Table 1 – Main characteristics of Cancer cachexia and Metabolic Syndrome
Cancer Cachexia Metabolic Syndrome
Anorexia Hyperphagia
Weight loss Central Obesity
Sarcopenia Sarcopenia
Dyslipidemia Dyslipidemia
Insulin resistance Insulin resistance
Chronic low grade inflammation Chronic low grade inflammation
Oxidative Stress Oxidative stress
Liver Steatosis Liver Steatosis
Hypotension Hypertension
1.3 Inflammation
In the recent years, it has become widely accepted that inflammation is a pivotal player
underlying the development and progression of chronic diseases, such as cancer, obesity and
type II diabetes, being this, the most relevant feature pointing out to poor clinical and
metabolic outcome in CC and MetS (10, 17). The nature of chronic systemic inflammation in
MetS and CC is very similar, including the exacerbated production of cytokines, such as
Tumor Necrosis factor alpha (TNF-α), IL-1β, IL-6, and also of adipokines, as Leptin and
Resistin (17-19). Augmented serum levels of the cytokines IL-6, IL-1 and TNF-α and of acute-
phase proteins, such as (C-reactive protein) are the most relevant markers (8, 13, 20). The
role of cytokines in the development of CC was confirmed in rodent models, in which
exogenous administration of TNF-α and IL-6 was shown to induce cachexia-like effects, with
or without the presence of tumors (21, 22). In MetS, patients show increased cytokine levels
in plasma and saliva (23), and as of other pro-inflammatory mediators, such as C-Reactive
protein and CCL2 (24). Despite the unequivocal importance of the low grade inflammatory
process in both syndromes, the source(s) are not clear. In cachexia, Susuki and colleagues
showed that it is not yet certain whether the primary source of cytokine production is the
tumor (Cancer Cachexia) or the host’s inflammatory cells (25). The adipose tissue is also a

28
candidate tissue due to its altered pro-inflammatory secretion and conspicuous
mononuclear cell infiltration during cachexia (26). In MetS, the most accepted hypothesis is
linked to the broad expansion of the adipose tissue. This would trigger adipocyte apoptosis
and culminate in the development of local low-grade inflammation that would later affect
other tissues. Despite some evidence supporting this hypothesis, it is believed that both in
MetS and CC, an orchestrated response of the organism involving several different organs
and tissues is contributing for a sustained inflammatory state (27). The adipose tissue,
muscle and liver, in this scenario, are often infiltrated with inflammatory cells, with great
capacity to produce and release pro-inflammatory mediators (28).
1.3.1 Inflammation in the adipose tissue
Alterations in lipid metabolism are a very frequent metabolic abnormality described in both
CC and MetS (19, 29, 30 2013). This tissue is nowadays recognized as more than just as an
energy storage compartment. It is indeed an endocrine organ, capable of expressing and
secreting several peptides with paracrine, autocrine and endocrine functions (31). In MetS,
the expansion of the adipose tissue beyond healthy limits due to a constant positive caloric
balance, leads to lipid accumulation and consequently, to adipocyte hypertrophy,
culminating in metabolic stress and consequently, immune system cell recruitment and
infiltration, which triggers cytokine expression and release, along with chemokines and
adipokines. In CC, the adipose tissue is an active player in the development and maintenance
of the inflammatory state. The metabolism of this tissue is altered under the influence of
cytokines, while this compartment responds to the inflammation by modifying the secretion
of adipokines, cytokines and chemokines (26). In both syndromes, chemokines play a most
relevant role, as these molecules signal to and recruit monocytes from the bloodstream to
the adipose depots, increasing monocyte infiltration (28, 29, 32). The molecular mechanisms
and consequences of adipose tissue inflammation are described for MetS and CC (8, 26, 33),
and share several common characteristics. Initially, the inflammatory scenario provokes
augmented lipolysis, which is partly explained by the stimulus provided by cytokines such as
TNF-α through the activation of MAP kinases (34). This leads subsequently, to the activation
of other signaling cascades, what culminates in the phosphorylation and decreased
production of perilipin (PLIN), an essential protein in the process of lipid storage (35). The

29
lower the synthesis of PLINs, the more profound the lipolysis induced by enhanced
accessibility of lypolitic enzymes (ATGL) to the surface of the triglyceride (36) droplet. This,
results in augmented triglyceride hydrolysis and release of free fatty acids (FFA) and glycerol
(37). Other cytokines, such as IL-6, IL-1β and TNF-alpha also enhance the activation of pro-
inflammatory transcription factors in the adipose tissue, among which NFκB (38), causing
another relevant effect in the adipose pads: Down-regulation and decreased activation of
insulin signaling proteins (GLUT4 and IRS), impairing insulin action and establishing a state of
insulin resistance (39). This, in turn also dysregulates the secretion of adipokines such as
leptin, adiponectin and resistin, all of which, in combination with cytokines, act in a
paracrine or autocrine way, exacerbating adipose tissue inflammation (40), and the state of
insulin resistance, in a vicious cycle.

30
Figure 2 - Molecular mechanisms underlying the setting of inflammation and insulin resistance in CC and MetS in the white adipose tissue
Pro-inflammatory mediators, including IL-6, IL-1β and TNF-α bind to specific membrane receptors and trigger
several signaling cascades, such as those of as the NFκB and MAP kinases. Perilipins (PLIN) expression is
decreased, elevating the levels of free-fatty acids (FFA) and glycerol. These FFA bind to Toll-like receptor 4
(TLR-4) and maintain the state of local inflammation. Macrophages are part of the process, as cells that are
sensitive to pro-inflammatory mediators, responding with further release of several pro-inflammatory
mediators such as CCL2, adding to the recruitment of monocytes from the bloodstream and maintaining local
inflammation in the adipose tissue. Release of adipokines involved in the regulation of inflammation
amplifies the process.
1.4 Insulin resistance
Insulin is a peptide hormone composed of fifty one amino acids, which signalizes through
binding to membrane receptors, modulating diverse cellular functions, including energy
storage and nutrient uptake (41). Insulin signals via a receptor that belongs to the class of

31
receptor tyrosine kinases (Figure 3). Upon ligand binding the receptor is auto
phosphorylated on tyrosine residues. This results in the recruitment of SH2-domain
containing downstream signaling proteins, in particular the insulin receptor substrates (IRS),
which in turn also get phosphorylated at tyrosine residues. The trypsin phosphorylated IRS
then activates two downstream signal cascades, one of which results in the activation of the
protein kinase B (Akt), part of the insulin signaling pathway and the protein responsible for
the signal that triggers cell glucose uptake via the stimulation of glucose transporter IV
vesicles translocation to the plasma membrane and subsequently glucose transport (42) in
skeletal muscle and adipose tissue. Insulin is regarded as the primary anabolic hormone (43).
In order to re-synthesize ATP to maintain cell homeostasis, glucose is one of the main
substrates, although, if the demand for energy in the cell is low and the availability of
glucose is high over an extended period, signals that impair the function of the insulin
related cascade may be triggered within the cell or, still by extracellular signals. When insulin
signaling pathway is inhibited, binding of insulin to its receptor no longer transduces into
downstream signaling and thus the cell is considered to be in a state of insulin resistance
(IR). One such state is defined as a significant decrease in insulin sensitivity (30). It occurs
when tissues that normally are sensitive to the hormone lose the ability to respond properly
to stimulation (32). This will provoke impaired tissue glucose uptake and impaired inhibition
of hepatic glucose production (44). IR is considered a metabolic component of cachexia (27,
44), and one of the most prominent features of MetS pathogenesis (18, 45, 46).
Interestingly, a similar degree of IR in CC patients and in obese and type II diabetes patients
may be found (44).
Diverse molecular mechanisms have been proposed to explain the development of
insulin resistance. One of them is related to the augmented synthesis of triglycerides, once
this process is dependent on an intermediate product, diacylglycerol, capable of activating
specific protein kinases, such as those of the PKC family (47). Once activated, protein kinase
C interrupts intracellular insulin receptor signal chain by direct phosphorylation of the insulin
receptor substrate in inhibitory serine residues (IRS). In contrast to the insulin receptor-
dependent phosphorylation of tyrosine residues, the serine phosphorylation of the IRS leads
to uncoupling from the downstream signal chain and IRS degradation (48). Recent studies
(49-51) also link the development of insulin resistance to low-grade and chronic state of
local inflammation in insulin responsive tissues such as the adipose tissue, liver and muscle.

32
The precise mechanisms, as well as the mediators involved in this interaction are not
completely unveiled yet (19, 32, 44, 52), although inflammatory cytokines as IL-1β or TNFα
bind to receptors on insulin target cell membrane and culminate in kinase activation, (e.g.
NFκB inhibitor kinase, IKKβ). This protein is also capable of provoking the inhibitory serine
phosphorylation of the IRS (53), impairing the insulin signaling chain. Other cytokines as
those of the IL-6 cytokines family through canonic signaling chains trigger the synthesis of
suppressors of cytokine signaling (SOCS) that act as feed-back inhibitors of their proper
signaling chains. However, SOCS can also bind unspecifically to the tyrosine phosphorylated
insulin receptor or IRS reduce insulin signaling by uncoupling the tyrosine-phosphorylated
insulin receptor from its downstream signaling chain and enhancing the degradation of the
IRS (54). Other mediators are also described as capable of impairing insulin signaling,
including prostaglandin E2 (55). Its mechanism of action in insulin target-tissues involves the
direct phosphorylation of IRS-inactivating serine kinases such as the Extracellular signal-
regulated kinases 1 and 2 (ERK1/2) (56). In addition, PGE2 may also induce cytokine
production by resident or recruited immune cells such as macrophages (56), which in turn,
will release inflammatory mediators, decreasing insulin sensitivity.

33
Figure 3 – Main hepatocyte Insulin and cytokine signaling pathways
Insulin binds to its receptor in hepatocytes (HC) inducing recruitment of insulin receptor substrates (IRS), which when phosphorylated in tyrosine residues, will activate protein PI3K and subsequently, the conversion of PIP2 into PIP3, activating PDK and subsequently, Akt, by phosphorylation. These stimuli culminate in elevated glucokinase (GK) expression. Cytokines bind to specific membrane receptors and trigger the phosphorylation of MAP kinases such as ERK 1/2 and the NFκB inhibitor kinase (IKK). These kinases are capable of phosphorylating the IRS inhibitory residue, impairing the insulin signaling pathway. Interleukin-6 family cytokines bind to membrane receptors (IL-6-R) and activate the transcription factor STAT3, which induces the suppressor of cytokine signaling (SOCS3). This suppressor binds directly to the insulin receptor, impairing the signaling cascade.
1.4.1 Effects of inflammation and insulin resistance on the Muscle
Skeletal muscle is the primary tissue in which insulin-mediated glucose uptake occurs. The
most prominent clinical characteristic of CC is accentuated loss of lean mass, and in special,
of skeletal muscle mass, inducing fatigue, impairment of muscle function, and marked
consequences upon quality of life and survival. In MetS, the expression “obesity–related
sarcopenia” is frequently employed to describe patients that, despite augmented body mass,
show reduced lean mass, due to proteolysis and diminished protein synthesis (57). As in
cachexia, these symptoms are also associated with poor prognosis and decreased quality of
life. The mechanisms involved in the loss of skeletal muscle mass comprise several pathways
at the molecular level, giving rise to imbalance between the processes of protein synthesis

34
and degradation (58). The utilization of muscle amino acids as carbon skeletons for
gluconeogenesis and as a source of energy (Krebs cycle intermediates) is frequently
observed in cachectic patients (59). Argiles (17), pointed out that cytokines per se are
capable of modulating muscle catabolism, causing wasting and consequently, weight loss.
Tumor-derived factors, such as the proteolysis-inducing factor (PIF) may as well provoke
muscle loss (60). Nuclear factor κB (NFκB) and the Mitogen-activated protein kinases
(MAPKs) are the main modulators of skeletal muscle metabolism in response to
inflammatory stimulus. The chronic activation of these signaling pathways is directly
involved in the development and maintenance of wasting conditions such as Cachexia and
Diabetes (61). Protein degradation occurs in the skeletal muscle through different
mechanisms: a) The lysosomal system, b) The Calcium-activated calpains I and II, and c) The
ubiquitin–proteasome pathway and the augmented expression of the ubiquitin–proteasome
pathway proteins (60). Insulin resistance contributes to sarcopenia because insulin increases
amino acid uptake into skeletal muscle cells, increases translation of mRNA by activating
eukaryotic translation initiation factors, among others and inhibits both autophagy and
proteasomal protein degradation (62, 63).
In MetS, excessive circulating free-fatty acids are a common finding (64). These FFA
reach and are taken up by the muscle, which, in order to compensate for this increased
levels of FFA, enhances fatty acid uptake and re-esterification (65). During triglyceride
synthesis, the intermediate metabolite diacylglycerol is formed and activates proteins, which
directly impair insulin signaling, compromising sensitivity to the hormone and exacerbating
the state of insulin resistance. This will lead to increased glucose plasma levels and
characterize a state of hyperglycemia (65).

35
Figure 4 - Muscle-related molecular mechanisms underlying inflammation and insulin resistance in CC and MetS
Pro-inflammatory mediators as TNF-α, IL-6, IL-1β and proteolysis inducing factor (PIF) bind to membrane receptors in myocytes and activate several signaling pathways as those of MAP kinases, JNK and NFκB, which are capable of impairing insulin signaling cascade and inducing the expression of several proteins involved in proteolysis such as Atrogin-1, MURF-1 and FoxO. Diminished insulin signaling enhances proteolysis, while augmented influx of FFA and its binding to receptors such as TLR-4 contributes to insulin signaling impairment.
1.4.2 Effects of hepatic inflammation and insulin resistance
The liver is a central organ responsible for the coordination of intermediate metabolism and
is highly affected by MetS and CC, both in terms of its microstructure and function (66, 67).
Carbohydrate metabolism is precisely regulated by the liver, as excess of glucose will be
stored in the form of glycogen. Conversely, when glycaemia falls, the liver releases glucose
by breakdown of glycogen. Under conditions in which excessive adipose tissue lipolysis is
present as in CC and MetS, the liver increases the uptake of adipose tissue-derived free fatty
acid (68). Increased TG accumulation impairs liver metabolism and may evolve to the
condition known as fatty liver or steatosis (1). In fact, there is often relationship between
increased accumulated intracellular fat is associated with different degrees of inflammation
(66), which reflects into a propitious scenario for the establishment of insulin resistance in
36
hepatocytes and results in impaired glycogen synthesis, failed suppression of
gluconeogenesis, enhanced lipid accumulation and increased synthesis of acute phase
proteins, such as C-Reactive protein (CRP) (18). In both MetS and CC, insulin resistance is
highly associated with hepatic steatosis (69), confirming the role of increased flux of free
fatty acid and triglyceride-rich lipoprotein remnants in its development. The organ per se
may contribute for higher intracellular content by presenting abnormal glucose uptake in
combination with reduced gluconeogenesis-related protein gene expression (70) and despite
insulin resistance, conversion of glucose to fatty acids and triglycerides in the liver may be
high because (1) ChREBP-dependent induction of enzymes of fatty acid synthesis and
triglyceride synthesis and (2) the excessive "substrate load" in hyperglycemic patients.
Adipose tissue dysfunction may also impair insulin signaling in the liver, through the
diminished secretion of adiponectin, which contributes for glucose uptake in the liver (71).
As triglyceride stores in adipocytes increase, the production of adiponectin falls (72). The
lower the circulating content of this hormone, the lower sensitivity to insulin stimulated
glucose uptake and utilization and, consequently, more glucose is mobilized and released
from the liver, despite the stimulation by insulin (71). This scenario contributes to the
development of insulin resistance not only locally, but also systemically. As sustained
inflammation is considered a pivotal feature in the development of hepatic insulin
resistance, cytokines play a major role in impaired hepatic metabolism. Interleukin-6 is the
main mediator of hepatic acute phase response in cancer cachexia (22). It inhibits albumin
production and induces the synthesis of acute phase protein such as CRP. TNF-α and other
cytokines are able to impair insulin signaling pathway (73, 74). This will result in decreased
insulin sensitivity, and insulin will no longer stimulate feeding-associated glucose storage in
the liver, neither effectively diminishes excess glucose production between meals (75). Thus,
constant hyperglycemia is observed. Acute-phase proteins are induced by pro-inflammatory
stimuli. The concentration of CRP and Albumin has been suggested (76) as a marker of
inflammation in conditions such as cancer and other inflammatory diseases. Interleukin-6
correlates positively with serum levels of CRP in CC (17). This scenario of chronic
inflammation also associates positively with high levels of circulating FFA and insulin
resistance in the liver. In summary, the molecular mechanisms underlying insulin resistance
are composed of several pro-inflammatory factors, which will inhibit insulin signaling in
hepatocytes by the activation of gene and protein expression of a plethora of proteins as the

37
suppressor of cytokine signaling (SOCS) and also of different kinases as JNK, IKK-β and of
PKC, as of protein tyrosine phosphatases such as the protein-tyrosine phosphatase 1B
(PTP1B) and the phosphatase and tensin homolog (PTEN), which in turn, may impair insulin
signaling directly at the receptor or receptor substrate (IRS) level (18).
Figure 5 - Molecular mechanisms associated with CC and MetS in the Liver
Interleukin-6, TNF-α, IL-1β, Resistin and leptin induce several pro-inflammatory signaling pathways that impair insulin signaling. Free-fatty acid enhanced uptake similarly induces insulin impairment and augmented acute-phase protein synthesis. Gluconeogenesis is also induced due to insulin signaling impairment.
1.4.3 Hyperinsulinemia
Either as a consequence of the insulin resistance or, in the case of patients in early stages of
the metabolic syndrome, as a consequence of the repeated intake of processed
carbohydrates from which glucose is rapidly available, these patients experience repeated
episodes not only of hyperglycemia but in particular of hyperinsulinemia . Insulin levels may
rise above the normal range (Table 2), and may remain elevated for prolonged periods
extending beyond the normal transient peaks. Because insulin resistance does not affect all
intracellular signaling chains to the same extent (77), this may result in the activation of
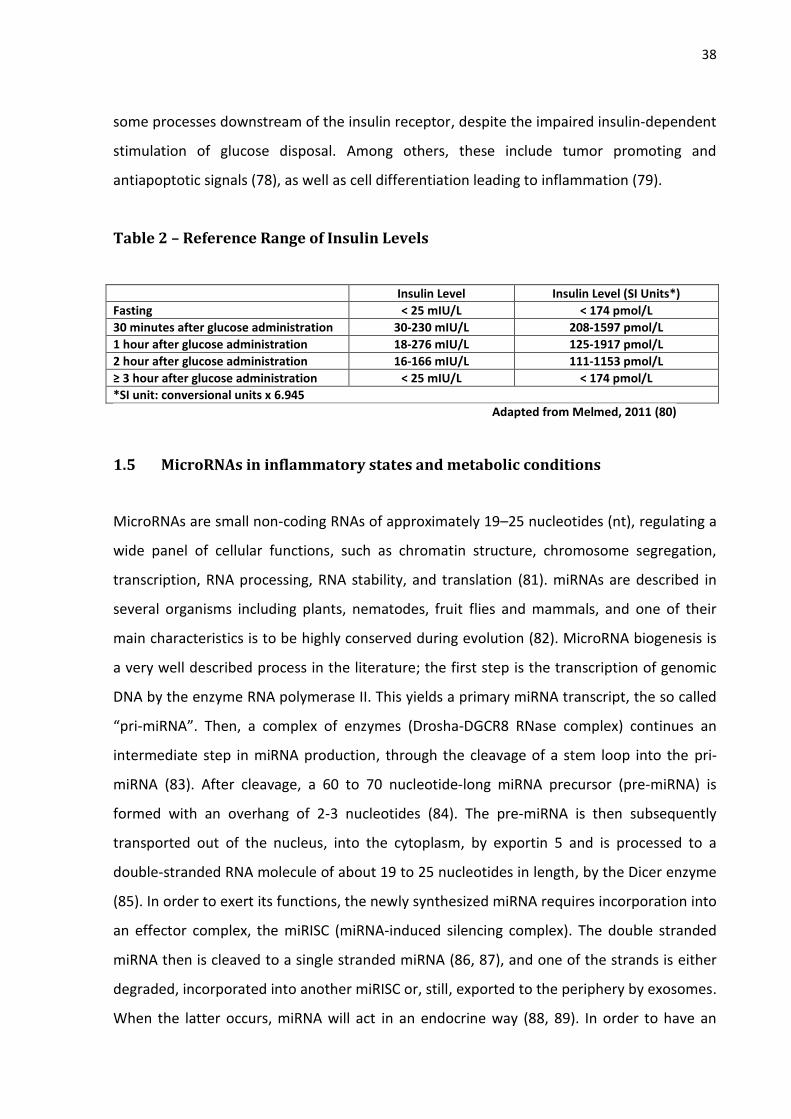
38
some processes downstream of the insulin receptor, despite the impaired insulin-dependent
stimulation of glucose disposal. Among others, these include tumor promoting and
antiapoptotic signals (78), as well as cell differentiation leading to inflammation (79).
Table 2 – Reference Range of Insulin Levels
Insulin Level Insulin Level (SI Units*)
Fasting < 25 mIU/L < 174 pmol/L
30 minutes after glucose administration 30-230 mIU/L 208-1597 pmol/L
1 hour after glucose administration 18-276 mIU/L 125-1917 pmol/L
2 hour after glucose administration 16-166 mIU/L 111-1153 pmol/L
≥ 3 hour after glucose administration < 25 mIU/L < 174 pmol/L
*SI unit: conversional units x 6.945
Adapted from Melmed, 2011 (80)
1.5 MicroRNAs in inflammatory states and metabolic conditions
MicroRNAs are small non-coding RNAs of approximately 19–25 nucleotides (nt), regulating a
wide panel of cellular functions, such as chromatin structure, chromosome segregation,
transcription, RNA processing, RNA stability, and translation (81). miRNAs are described in
several organisms including plants, nematodes, fruit flies and mammals, and one of their
main characteristics is to be highly conserved during evolution (82). MicroRNA biogenesis is
a very well described process in the literature; the first step is the transcription of genomic
DNA by the enzyme RNA polymerase II. This yields a primary miRNA transcript, the so called
“pri-miRNA”. Then, a complex of enzymes (Drosha-DGCR8 RNase complex) continues an
intermediate step in miRNA production, through the cleavage of a stem loop into the pri-
miRNA (83). After cleavage, a 60 to 70 nucleotide-long miRNA precursor (pre-miRNA) is
formed with an overhang of 2-3 nucleotides (84). The pre-miRNA is then subsequently
transported out of the nucleus, into the cytoplasm, by exportin 5 and is processed to a
double-stranded RNA molecule of about 19 to 25 nucleotides in length, by the Dicer enzyme
(85). In order to exert its functions, the newly synthesized miRNA requires incorporation into
an effector complex, the miRISC (miRNA-induced silencing complex). The double stranded
miRNA then is cleaved to a single stranded miRNA (86, 87), and one of the strands is either
degraded, incorporated into another miRISC or, still, exported to the periphery by exosomes.
When the latter occurs, miRNA will act in an endocrine way (88, 89). In order to have an

39
effect and regulate protein expression, the complex miRISC binds directly to the mRNA as to
repress the translation of target genes by cleavage (perfect or near-perfect binding) or by
forming a “hairpin” in the 3’UTR, through imperfect base pairing (90). Base-pairing of
approximately 7 nucleotides must be complementary to provoke effects in the target mRNA
(91). These base-pairing complementary nucleotides sequences are known as the “seed
region” and consist on the most important pre requisite to the miRISC action. The binding
site of the miRISC may also not correspond to the 3’UTR, but the ORF or 5’UTR region of the
target, causing target gene repression or when binding to the 5’UTR, even stimulating the
translation of target genes (92).
More than half of all described human genes are susceptible to modulation by
miRNAs (93). MicroRNAs expression depends on to the local of synthesis, metabolic status
and presence of disrupt states as diseases (94). Several studies point out a role for miRNAs
as important regulators of diverse biological processes as cellular differentiation,
proliferation, tissue development and cell-type specific function and homeostasis.
Moreover, several inflammatory conditions have been linked in the past years to altered
miRNAs expression (95, 96). MicroRNAs apparently modulate the magnitude of
inflammatory responses (97) and act as pivotal players in the maintenance of inflammatory
conditions such as cachexia and MetS.
1.5.1 MicroRNA-21-5p
Among over the six thousand described microRNAs on the international database for
microRNAs (www.mirbase.org), some are known to interfere with the regulation of
inflammatory processes. microRNA-21-5p is one of the most highly expressed members in
several mammalian cell types (98) and was one of the first microRNAs to be identified in
mammalians. MicroRNA-21-5p mature sequence is highly conserved throughout evolution
and its coding gene is located at the plus strand of chromosome 17q23.2 (55273409–
55273480). This is an intronic region, and despite that, miRNA-21-5p shows particular
promoter sites and when transcripted, originates an approximately 3433 nucleotides long
primary transcript (pri-miR-21), and stem–loop precursor (pre-miR-21) located between
nucleotides 2445 and 2516 of the pri-miR-21 (99). MicroRNA-21-5p dysregulated expression
is frequently linked to the development of inflammation and consequently, of diseases, as

40
cancer (100-102) and obesity (103, 104). Specifically in regard to cachexia, one study
showed that dysregulated miRNA-21-5p expression was linked to the wasting condition
prevalent in patients and rodents (105). Among the specific types of cancer, including
colorectal cancer, up-regulation of microRNA-21-5p is the most frequent observation,
despite some of the studies not identifying differences in the expression in cancer patients,
compared to non-cancer patients (11). In obesity, the opposite is observed, diminished
microRNA-21-5p expression is linked to inflammation and obesity (103, 104). According to
mirbase, microRNA-21-5p targets several essential proteins in the development of
inflammation, such as PTEN and STAT3. A link between STAT3 activation and microRNA-21-
5p is described (101, 102), as well as a negative correlation between miRNA-21-5p and pro-
inflammatory mediators (102). Due to a high relevance in inflammatory processes, immune
system cells were also focus of various studies in which the modulation by miRNA-21-5p was
evaluated. Curiously, miRNA-21-5p is induced by STAT3 activation (106), but inhibits STAT3
through two sites of interaction in the 3’UTR region of STAT3 mRNA (101). Whether this
represents a feedback mechanism is not fully clear. Since MetS and CC are inflammatory
conditions, miRNA-21-5p appears as good candidate for the modulation of imbalanced
inflammatory response.
1.6 Integrated metabolism and main hypothesis
Insulin resistance develops with inflammation as background (32, 107). Due to diminished
insulin sensitivity in responsive tissues, the pancreas β cells produce and release more
insulin, in order to maintain normal blood glucose levels even for long periods (108).
However, as a consequence of the increased insulin release a hyperinsulinaemic condition
develops. Hyperinsulinemia in turn, might further impact on insulin sensitivity even before
hyperglycemia is established. The liver is an organ in which this is most likely to happen,
because pancreatic hormones are secreted into the portal vein (109) and liver is exposed to
much higher insulin concentrations than any other organ of the body, which the exception of
the endocrine pancreas itself. The mechanisms behind such an insulin-induced insulin
resistance are still poorly understood. Apart from desensitization on the receptor level,
inflammation might play a role (110). In equines, a disease related with the sterile
inflammation of the hoof corium, laminitis, develops after carbohydrate overload or after a

41
prolonged hyperinsulinaemic, euglycaemic clamp (111). This suggests that hyperinsulinemia
itself might trigger local inflammation and subsequently, provoke insulin resistance. Once
immune system cells are known to be active players in tissue local inflammation due to their
capacity of secreting pro-inflammatory mediators, the main hypothesis of this study was to
answer the question: Does hyperinsulinemia “per se” in some way contribute to the
development or progression of insulin resistance, through the induction of inflammation?
Therefore we chose to examine whether insulin might elicit an inflammatory
response in macrophages that could on its turn contribute to the development of insulin
resistance. Moreover, although cachectic patients have lower insulin levels than patients
with MetS, they present inflammation and insulin resistance. Among other mechanisms,
miRNA-21-5p appears to be important to keep the inflammatory response in check.
Therefore, the hypothesis was addressed that this miRNA might be diminished in cachectic
patients resulting in an unrestrained inflammatory response.

42
2 AIMS
2.1 General
To test the hypothesis whether insulin might elicit an inflammatory response in
macrophages that could in turn contribute to the development of hepatic insulin
resistance.
To verify whether cachectic patients present difference in circulating microRNA
expression, as compared to non-cachectic and control patients.
2.2 Specific
To assess specific gene and protein expression of pro-inflammatory mediators and
insulin signaling pathway proteins in cultured differentiated macrophages and
primary rat hepatocytes;
To assess specific circulating microRNA-21-5p and cytokine expression in cachectic
patients, as compared to non-cachectic and control patients; and to correlate these
results.

43
3 MATERIAL E METHODS
3.1 Part I – Insulin-induced insulin resistance: Cell culture and rat primary hepatocyte study
3.1.1 Materials
The antibiotics, fetal calf serum (FCS), calf serum and M199 culture medium were obtained
from Biochrom AG (Berlin, Germany). The RPMI1640 medium was purchased from Gibco
(Eggenstein, Germany). Dexamethasone, phorbol 12-myristate 13-acetate (PMA), Insulin and
lipopolysaccharide (LPS) were obtained from Sigma-Aldrich (Deisenhofen, Germany).
Oligo(89)12-18 and acetone were obtained from Roth (Karlsruhe, Germany). The Maxima™
SYBR Green qPCR Master Mix and the RevertAid™ M-MuLV reverse transcriptase were
obtained from ThermoFisher Scientific (Darmstadt, Germany). The antibodies against
phospho-Ser306-IRS1, phospho-Ser636/639-IRS1, IRS1, p44/42 MAPK, phospho-p44/42
MAPK (Thr202/Tyr204), STAT3, phospho-STAT3 (Tyr705), phosphor-Akt (Ser473), Akt and IL-
1β were purchased from Cell Signaling Technology (Frankfurt, Germany). The antibody
against GAPDH was purchased from Santa Cruz Biotechnology (Heidelberg, Germany). All
oligonucleotides were customized by Biolegio (Nijmegen, The Netherlands) or Eurofins
Genomics (Ebersberg, Germany).
3.1.2 Animals
Male Wistar rats (200-300 g, Charles River, Sulzfeld, Germany) were maintained on a 12-
hour light/dark cycle with free access to standard rat diet #1320 (Altromin, Lage, Germany)
and water. The principles of laboratory animal care were followed. Treatment of the animals
followed the German animal protection laws and was performed with permission of the
State Animal Welfare Committee (LUGV Brandenburg, V3-2347).
44
3.1.3 U937 cell culture
The buffers and solutions detailed preparation protocols are described in the supplementary
material.
3.1.3.1 U937 cell culture differentiation experiment
The human monocytic cell line U937 was cultivated in medium RPMI1640 with 10% heat-
inactivated FCS and 1% antibiotics (cell culture medium I). Cells were seeded in 35-mm
diameter culture plates (1 x 10⁶ cells per plate). Monocytes were tested for differentiation
capacity into macrophages by the addition of 100 ng/ml Phorbol-myristate acetate (PMA) or
100 nM insulin for 24 h. The control cells were cultivated in cell culture medium I under no
stimulation. After removal of the medium, macrophages were washed with RPMI1640, at
room temperature and the number of differentiated cells estimated by counting under a
microscope at 10 times magnification.
3.1.3.2 U937 macrophages stimulation with Insulin and LPS
The human monocytic cell line U937 was cultivated as described previously (3.1.3.1).
Monocytes were differentiated into macrophages by addition of 100 ng/ml PMA for 24 h.
After removal of the medium, macrophages were washed with RPMI1640 medium at room
temperature and incubated in RPMI1640 medium with 0.5% heat-inactivated FCS and 1%
antibiotics (cell culture medium II), in the absence of PMA for 24 h. Macrophages were then
stimulated for another 24 h, with 100 nM insulin and/or 100 ng/ml LPS from Escherichia coli
Serotype 0127:B8 to evaluate the effect of insulin, LPS and the possible synergism. Cells
were shock-frozen in liquid nitrogen and stored at -70 °C for further analysis and the
supernatant collected and centrifuged (10,000 x g, 15 min, and 4 °C).
3.1.4 Rat primary hepatocytes culture
Buffers and solutions detailed preparation protocols are described in the supplementary
material. The experiments involving rat hepatocytes followed three initial steps: Isolation,

45
purification and culture. The hepatocytes isolation and purification was performed following
the protocol of Meredith, 1988 (112). Hepatocytes were released from the cell structure of
the liver by perfusion with an EDTA-containing buffer without calcium. This leads to cell
separation once calcium is needed for cell-cell contacts. After perfusion, cells were purified
by centrifugation, separated from non-parenchymal cells and debris with continuous Percoll
density gradient and cultured in the appropriate culture medium.
3.1.4.1 Non-recirculating in situ perfusion of rat liver for hepatocyte isolation
One male Wistar rat (200-350 g body weight) was anesthetized by intraperitoneal injection
of 100 µl Narcoren/100 g body weight. After removing the skin of the abdomen, a
longitudinal incision along the linea alba to the processus xyphoideus was made. The hepatic
portal vein was exposed by shifting the intestinal miscellany. The portal vein was then
cannulated and the liver was perfused with Perfusion buffer (140 mM NaCl, 5 mM KCl, 0.8
mM MgCl2 x 6 H2O, 1.6 mM Na2HPO4 x 2 H2O, 0.4 mM KH2PO4, 25 mM NaHCO3, 2 mM EDTA,
1.5 mM Glucose, 0.2 mM Lactate, 0.02 mM Pyruvate – pH 7.4) at a flow rate of 40 ml / min
at 37 °C (2l per 45 - 60 min). After opening the inferior vena cava, the cannula in the portal
vein was attached at the desired position, while the liver was flushed bloodless and the
thorax was opened by extending the clavicle paramedian through a longitudinal incision
(112).
3.1.4.2 Preparation of rat hepatocytes
After perfusion, the liver was dissected from the abdomen and placed on a glass plate filled
with wash buffer (140 mM NaCl, 5 mM KCl, 0.8 mM MgCl2 x 6 H20, 1.6 mM Na2HPO4 x 2 H2O,
0.4 mM KH2PO4, 0.1 mM CaCl2 x H20). The liver was torn and completely separated from the
hepatic portal vein, and the cells detached. In order to remove any remaining connective
tissue and larger cell aggregates, the cell suspension was filtered with washing buffer
through a moistened cloth nylon sieve (pore size 80-100 microns). The cell suspension was
centrifuged for 2 min at 20 x g (300 rpm, Heraeus Biofuge Primo), at room temperature. The
supernatant was then aspirated and the cell sediment resuspended twice in 50 ml of wash
buffer and centrifuged for 2 min at 20 x g.
46
3.1.4.3 Rat hepatocytes isolation by density gradient centrifugation
After the third centrifugation, the cell sediment was resuspended in wash buffer to a volume
of 16ml and mixed with 32ml of Percoll gradient medium (27.8 ml Percoll and 4.2 ml
Perfusion solution 10 X (1400 mM NaCl, 50 mM KCl, 8 mM MgCl2 x 6 H20, 16 mM Na2HPO4 x
2 H2O, 4 mM KH2PO4). Percoll final concentration was 58% (v/v). The suspension was
centrifuged for 5 min at 800 x g (2100 rpm, Hettich centrifuge Rotina 35), at room
temperature. Non-parenchymal cells, dead hepatocytes and cell debris were aspirated,
along with the excess of buffer.
3.1.4.4 Cell counting
The counting of hepatocytes was performed in a Neubauer chamber (0.0025 mm2 / 0.1 mm)
by pipetting 96 µl of M199 cell culture medium mixed with 4 µl of Hepatocyte suspension
(1:25 dilution), under a microscope at 10 times magnification.
3.1.4.5 Rat hepatocyte culture
Hepatocytes were plated and immediately treated with M199 cell culture medium with 4%
(v/v) neonatal calf serum for optimal attachment to the bottom of the polystyrene trays,
with 1% (v/v) penicillin/streptomycin, 0.1 mM Dexamethasone and 0.5 nM insulin (= M199
cell culture medium I). The hepatocytes were cultured in 35 mm cell culture plates at a
density of 1.0 x 10⁶ cells (1.5 ml). After an initial period of 4 hours, the medium was changed
to 1.5 ml M199 culture medium II, in the absence of neonatal calf serum (NCS). Another
Medium change with M199 culture medium II was carried out after 24 h. The cell culture
experiments occurred after a period of 40 hours from seeding. The incubation of
hepatocytes was performed in a steam saturated atmosphere with 5% (v/v) CO2, at 37 °C.
Experimental treatments were performed after 44 h of culture, in M199 cell culture medium
containing 1% antibiotics and 100 nM Dexamethasone for 4 h. Subsequently, hepatocytes
were incubated with medium containing 50% of the supernatants obtained from U937
macrophages incubation with or without 100 nM insulin for 15 or 120 minutes. Cells were
shock-frozen in liquid nitrogen and stored at -70 °C for further analysis.
47
3.1.4.6 U937 macrophages and rat primary hepatocytes protein expression analysis by Western blotting
The Western Blot experiment was performed following in three steps: protein separation by
molecular size, protein transfer from a gel to the membrane, and target protein labeling,
with a proper primary and secondary antibodies as to allow detection (113).
3.1.4.6.1 Preparation of cell lysates
Rat primary hepatocytes and U937 macrophages were ruptured in 100ul of lysis buffer with
protease inhibitors and Sodium orthovanadate [20 mM Tris / HCl (pH 7.5), 150 mM NaCl, 1
mM EDTA, 1 mM EGTA, 1% Triton X-100 (v/v), 2.5 mM Sodium pyrophosphate, 1 mM β-
Glycerol phosphate, 50 mM NaF, 200 µM Pefablock, 10 µg/ml Leupeptin, 10 µg/ml Trypsin
inhibitor, 1 mM Na3VO4] to each cell culture plate. Subsequently, the cells were scraped off
and transferred to the lysates in 1.5 ml reaction tubes. For optimal cell disruption, the cell
suspension was homogenized for 10 seconds under ultrasound (Ultrasound Wand Bandelin
UW 2070 Power 55%, Cycle 5). Then, cell homogenates were centrifuged for 15 min at
10,000 x g (Sigma 3K30 centrifuge rotor 1215/4-H), and the supernatant transferred to 1.5
ml reaction tubes. The cell lysates were stored at -20 °C. Determination of the protein
content was performed by the method described by Bradford (114).
3.1.4.6.2 Measurement of sample protein content
The samples were diluted 1:100 by adding into 3 µl of the lysate, 27 µl H2O, and then 10 µl of
the prediluted lysate to 90 µl H2O (duplicates). The Standard series consisted of decreasing
concentration dilutions of a BSA (1 mg/ml) stock solution ranging from 0.0 mg/ml to 0.01
mg/ml, 0.02 mg/ml, 0.04 mg/ml, 0.06 mg/ml, 0.08 mg/ml and 0.1 mg/ml. The measurement
was performed in a 96-well plate by adding (duplicates) 20 µl per sample / standard series to
180 µl of the Bradford reagent. The absorbance (570 nm) was determined after 10 minutes
with the MRX II Microplate Reader (Dynex Technologies, Denkendorf, Germany).
48
3.1.4.6.3 Preparation of the samples for SDS-polyacrylamide gel electrophoresis (SDS-PAGE)
The protein content of cell lysates was determined as described in item 3.1.4.10.4 and all the
samples were diluted with lysis buffer to 40 µg of protein, in a maximum volume of 45 µl.
The samples were then mixed with 1/3 volume of sample buffer [80 mM Tris / HCl (pH 7.5),
2% SDS (w/v), 5% Glycerol (w/v), 0.0025% Bromophenol blue (w/v), 20% β-
mercaptoethanol], briefly centrifuged (spin) and then denaturated on heating block for 5
min at 95 °C, followed by another centrifugation for 5 min at 13,000 rpm (16,050 x g, Biofuge
Pico). For the detection of IL-1β in the supernatants of the U937 macrophage culture, the
medium was mixed with 1:5 acetone, stored over night at -20 °C, and centrifuged (4696 x g,
5 min, 4 °C). The pellet was resuspended in 55 µl of the sample buffer.
3.1.4.6.4 Protein separation by SDS-PAGE
For the analytical separation of proteins by molecular weight, discontinuous polyacrylamide
gels were used according to Laemmli (115). Gels were set and run in the electrophoresis
system Mini Protean II (BIO-RAD). The resolving gels were cast with 10% polyacrylamide
[30% Acrylamide (30% w/v), 22.5% Resolving gel buffer (1.5 M TRIS, 0.4% SDS (w/v), pH 8.8),
0.15% TEMED and 0.75% APS (10% w/v)] for the detection ERK 1/2, STAT3 and 6%
acrylamide [18% Acrylamide (30% w/v), 22.5% Resolving gel buffer (1.5 M TRIS, 0.4% SDS
(w/v), pH 8.8), 0.15% TEMED and 0.75% APS 10% (w/v)]for IRS1. The stacking gel was cast
with 4.45% polyacrylamide [25% Acrylamide (30% w/v), 30% Stacking gel buffer (0.5 M TRIS,
0.4% SDS (w/v), pH 6.8), 2% TEMED and 10% Ammonium persulfate (APS, 10% w/v)].
Samples (45 µl) and the protein standard were pipetted to the gels. Electrophoresis was set
at 15 mA / gel for the stacking gel and 20 mA / gel for the resolving gel.
3.1.4.6.5 Protein transfer to PVDF membranes
After gel electrophoresis, the stacking gel was carefully separated, removed from the upper
left corner of the separating gel and equilibrated for 15 minutes in Transferbuffer C [25 mM
TRIS, 0.1% SDS (w/v), 20% Methanol (v/v), pH 9.0]. Then, the PVDF membrane was briefly
dropped in pure methanol for activation and equilibrated in Transferbuffer B [2 mM TRIS,
49
0.1% SDS (w/v), 20% Methanol (v/v), pH 10.5] for about 15 minutes. The transfer took place
at a constant current of 1.2 mA / cm2 gel area (= 56 mA / gel), over a period of 45 minutes
(Akt, ERK 1/2, STAT3, IL-1β) or 120 minutes (IRS1, IRS2).
3.1.4.6.6 Detection of transferred proteins by Ponceau S staining
The PVDF membrane rested briefly in a bowl with Ponceau S staining solution [0.25%
Ponceau S, 40% Methanol (v/v), 15% Acetic acid (v/v)] and the protein bands were reversibly
stained. The membrane was then washed with TBS / Tween buffer [TRIS 0.02 M, NaCl 0.136
M, 20% TWEEN (0.1% v/v)], three times for 5 minutes.
3.1.4.6.7 Immunological detection of proteins by the peroxidase-mediated chemiluminescent reaction
For the saturation of nonspecific binding sites, the membrane was incubated in blocking
solution (5% non-fat milk powder (w/v) in TBS / Tween Buffer) for 60 minutes at room
temperature. Thereafter, it was washed three times for 10 min with TBS / Tween buffer and
incubated overnight at 4 °C with the primary antibody incubation (Table 3). On the next day,
the primary antibody was removed, and the membrane washed again three times for 10
minutes each with TBS / Tween buffer. The incubation with the peroxidase-coupled
secondary antibody (1:4000) was performed for 2 h at room temperature in blocking
solution. Depending on the primary antibody, the secondary antibody was conjugated with a
goat anti-mouse or goat anti-rabbit-HRP (see Table 7). After incubation, the membrane was
again washed three times for 10 min with TBS / Tween buffer. The experiment was
completed through a chemiluminescent reaction with the SuperSignal® West Pico
Chemiluminescent Substrate (Thermofisher Scientific Inc., Waltham, MA, USA), by mixing
solutions 1 and 2 of the kit in equal parts to a final volume of 2 ml / cm2 PVDF membrane.
After an incubation time of 5 minutes, the membrane was inserted in cling film and the
excess of chemiluminescent substrate removed by carefully rolling with a glass tube. The
resulting chemiluminescence was directly detected by the ChemiDocTM system (BIO-RAD)
and the stained bands were quantified with the software program Imagelab (BIO-RAD).

50
Table 3 - Primary and secondary antibodies adopted in the Western blot analysis
Primary antibody Dilution
in 5 % (w/v) BSA in TBS/Tween
Secondary antibody
pAkt(Ser473) 1:1500 Goat-anti-Mouse (1:4000)
Akt 1:1500 Goat-anti-Rabbit (1:4000)
pERK1/2 1:1500 Goat-anti-Mouse (1:4000)
ERK1/2 1:1500 Goat-anti-Rabbit (1:4000)
pSTAT3 1:1500 Goat-anti-Rabbit (1:4000)
STAT3 1:1500 Goat-anti-Mouse (1:4000)
pSerin636-IRS1 1:1000 Goat-anti-Rabbit (1:4000)
pTyrosin632-IRS1 1:500 Goat-anti-Rabbit (1:4000)
IRS1 1:1000 Goat-anti-Rabbit (1:4000)
IRS2 1:1000 Goat-anti-Rabbit (1:4000)
3.1.4.7 U937 Macrophage and rat primary hepatocyte gene expression analysis by Real time PCR
The PCR experiments were preceded by the synthesis of complementary DNA through
reverse transcription reaction from isolated RNA, followed by polymerase chain reaction.
This technic has been proven to be an adequate and powerful method to quantify gene
expression (36).
3.1.4.7.1 Total RNA extraction
Total RNA was isolated from frozen rat hepatocytes and U937 macrophages adopting the
peqGold Total RNA Kit (Peqlab, Erlangen, Germany), according to the manufactures protocol.
Briefly, after culture medium aspiration, 400 µl RNA lysis buffer was applied directly to the
cells. The lysate was transferred to a DNA removing column, placed in a 2.0 ml collection
tube. A centrifugation step was performed (12,000 x g, 1 minute at room temperature).
Then, 400 µl of a 70% ethanol solution was added and mixed by vortexing and the mixture
transferred to a RNA binding column, followed by another centrifugation step (10,000 x g, 1
min at room temperature). The column was then washed two times with the supplied wash
buffer and the elution step performed with RNAse-free water. The quantification was
performed by measuring the absorption rate at 260/280 nm. One A260-unit is about 40 μg
RNA/ml. The RNA concentration was calculated as follows:

51
RNA concentration (μg/ml) = Absorption 260 × 40 × Dilution Factor.
The samples were stored at -70 oC.
3.1.4.7.2 Complementary DNA synthesis
Complementary DNA was synthesized from 600 – 1500 ng purified RNA and 500 ng
Oligo(89)12-18 in DEPC treated water (13.0 µl), 5X reaction buffer (250 mM Tris-HCl pH 8.3,
250 mM KCl, 20 mM MgCl2, 50 mM DTT) (4 µl), 200 U of RevertAid™ M-MuLV reverse
transcriptase (1 µl) and 10 mM dNTP Mix (2 µl), in a total volume of 20 µl. The reaction was
incubated for 60 min at 42 oC in a T3000 Thermocycler (Biometra GmbH, Göttingen, Germany).
3.1.4.7.3 Real-time PCR amplification
Real-time PCR for the quantification of each transcript was performed in triplicates in a
reaction mixture of 2x SybrGreen qPCR Master Mix®, 250 nM of forward and reverse
oligonucleotides (table 4), and 0.3 µl cDNA, in a total volume of 10 µl. qPCR was performed
with an initial enzyme activation step at 95 °C for 10 min, followed by fifty cycles of
denaturation at 95 °C for 20 sec, annealing at 57-60 °C for 30 sec and extension at 72 °C for
20 sec, and subsequent melting curve analysis in a CFX96™ Thermal Cycler (Bio-Rad, Munich,
Germany). The expression level was calculated as the n-fold induction of the gene of interest
in treated versus control cells with β-actin as a reference gene. The calculation was based on
the differences in the threshold cycles between control (c) and treated (treat) groups
according to the formula: 2 (c-treat) interest gene / 2 (c-treat) reference gene (36).

52
Table 4 - U937 Cell culture and rat primary hepatocytes study primer list
Gene Species Forward (5'-3') Reverse (5'-3') Acc. No.
β-Actin human CCCCAAGGCCAACCGCGAGAAGATG AGGTCCCGGCCAGCCAGGTCCAG NM_001101.3
β-Actin rat CCCTAAGGCCAACCGTGAAAAGATG AGGTCCCGGCCAGCCAGGTCCAG NM_031144.2
CCL2 human TCAGCCAGATGCAATCAATG AGCTTCTTTGGGACACTTGC NM_002982.3
COX2 human TGTGCCTGATGATTGCCCGACTCC TGTTGTGTTCCCGCAGCCAGATTG NM_000963.2
Glucokinase rat GCCGTGCCTGTGAAAGCGTGTC CCAGGGGTAGCAGCAGAATAGGTC NM_012565.1
IL-1β human CCAGCTACGAATCTCCGACC AGAACACCACTTGTTGCTCCA NM_000576.2
IL-6 human CATCCTCGACGGCATCTCAG TCACCAGGCAAGTCTCCTCA NM_000600.3
IL-8 human CAGTTTTGCCAAGGAGTGCTAA AACTTCTCCACAACCCTCTHC NM_000584.2
mPGES1 human GAAGAAGGCCTTTGCCAACCC GTGCATCCAGGCGACAAAAG NM_004878.4
OSM human CACCCAGCATGGGGGTACT GCACGCGGTACTCTTTCGAG NM_020530.3
SOCS3 rat GACCTTCAGCTCCAAGAGCGAGTA CGCCCCCAGAATAGATGTAGTAAGC NM_053565.1
TNF-α human GGCTCCAGGCGGTGCTTGTT GTAGGAGACGGCGATGCGGC NM_000594.2
IL-10 human CGAGATGCCTTCAGCAGAGT AATCGATGACAGCGCCGTAG NM_000572.2
TLR2 human GAGTTCTCCCAGTGTTTGGTG ATTGTCCAGTGCTTCAACCCA NM_003264.3
TLR4 human GGTGCCTCCATTTCAGCTCT ACTGCCAGGTCTGAGCAATC
NM_138554.4
NM_003266.3
NM_138557.2
3.1.4.8 Statistics
All data are expressed as means ± SE. Differences between the groups were analyzed by
Student’s unpaired T-test and considered statistically significant when p < 0.05.

53
3.2 Part II – Study with cachectic cancer patients
3.2.1 Patient recruitment
3.2.1.1 Ethics Committee Approval
The Project was approved by the University of São Paulo Biomedical Sciences Institute Ethics
Committee (1109/CEP) and the University Hospital Ethics Committee (HU/USP: 1387/14) and
registered on the Brazilian Platform for Human Studies (CAAE:13803213.0.0000.5467).
3.2.1.2 Inclusion criteria
Patients (n = 48) were recruited between August 2014 and July 2015 at the University
Hospital of the University of Sao Paulo. The recruitment was carried out by the Hospital
physicians and consisted in selecting patients engaged in the treatment of hernia (Control
group, n = 16) and cancer (weight stable group, n = 16; cachectic group, n = 16). The
inclusion criteria were not having received prior anticancer or anti-inflammatory treatment
(the hospital operates only with patients who will undergo surgery, but no adjuvant
treatment, as determined by the in-charge physicians, according to individual clinical
recommendations); and willingness to participate. The criterion for the diagnosis of gastric
cancer was the based on the TNM Classification of Malignant Tumors (116) (Esophagus,
Stomach, Small intestine, Colon and rectum, Anal canal, Liver, Gallbladder, Extra bile liver
pathways, Vater Ampoule and Pancreas). The exclusion criteria were liver failure, renal
failure, AIDS, inflammatory diseases of the bowel; autoimmune disorders and continuous
anti-inflammatory medication.
3.2.1.3 Consent term signature obtainment and clinical evaluation
After the selection, anthropometric measurements were obtained (height, weight, weight
loss delta) and the patients were interviewed with a cancer patient oriented Quality of life
questionnaire, EORTC QLC-C30 (117), validated for Portuguese (118), which evaluates three
parameters of quality of life: Global Health Status, Functional Scales and Symptoms scales. A

54
high score for Global Health Status and Functional Scales means better quality of life; a high
score for Symptoms scale means worsened quality of life. The patients under cancer
treatment were then divided into two groups, based on the answers and on the
anthropometric measurements. The cachectic group (TC) consisted of patients with a self-
declared weight loss > 5% in the past six months on weight loss between 2% and 5% in the
past six months, with concomitant presence of sarcopenia; reduced food intake and/or
systemic inflammation (14). The cancer weight stable group (WSC) consisted of patients in
treatment for cancer without declared weight loss > 5% in the past 12 months. Full written
consent form was obtained from each patient (Supplementary material). All procedures
were carried out in the hospital premises.
3.2.2 Assessment of Clinical and biochemical parameters
Height and weight were assessed and, approximately 20 mL of blood, collected prior to the
surgical procedure (by a certificated trained health professional). Blood was placed in tubes
with or without anticoagulant (EDTA) and then, centrifuged at 3000 rpm for 15 minutes, at
4°C to obtain plasma and serum, respectively. Then, plasma and serum were transferred to
plastic microtubes and stored at -80 °C for analysis. Serum concentration of hemoglobin was
determined by the University Hospital, while C-reactive protein and albumin were measured
with commercial kits (PCR Plus Ultra Turbiquest ref 335 – Labtest dignostica SA, Lagoa Santa,
MG, Brazil; range 0.5 – 10 mg/L) and Albumin - Diagnostic Labtest ref 19 - Labtest dignostica
SA, Lagoa Santa, MG, Brazil; range 0-6.0 g/dL), according to the manufacturer’s protocols.
3.2.3 Real time PCR analysis
3.2.3.1 Total RNA extraction
Total RNA was isolated from patients’ plasma employing the mirVana™ miRNA Isolation Kit
(Thermofisher Scientific Inc., Waltham, MA, USA), according to manufacturer’s instructions.
Briefly, the samples were first lysed in a denaturing lysis solution, which stabilize RNA and
inactivated RNAses. The lysate was then extracted with 50% Acid-Phenol:Chloroform (119),

55
which removed most of the other cellular components, leaving a semi-pure RNA sample.
This RNA was further purified over a glass-fiber filter to yield total RNA and 5 µl of total
extracted RNA was aliquot for further cDNA synthesis.
3.2.3.2 Complementary DNA synthesis
Complementary DNA (cDNA) was synthesized from 5 µl purified RNA with the TaqMan®
MicroRNA Reverse Transcription Kit (Thermofisher Scientific Inc., Waltham, MA, USA).
Specific cDNA was synthesized for the miRNA-21-5p and RNU6B by adding to the cDNA
Mastermix the miRNA-21-5p (Thermofisher Scientific Inc., Waltham, MA, USA, CAT#
4427975) or RNU6B specific primers (Thermofisher Scientific Inc., Waltham, MA, USA, CAT#
4427795). The reaction was setup in a mixture of 0.15 µl of 100nM dNTPs (with dTTP), 1 µl
MultiScribeTM Reverse transcriptase (50 U/µl), 1.50 µl 10X Reverse Transcription Buffer, 0.19
µl RNase Inhibitor (20 U/µl), 4.16 µl Nuclease-free Water in a volume of 7 µl. Then, 3 µl of 5X
RT specific primers and 5 µl of miRNA sample were added to the mixture, in a total of 15 µl
reaction volume. The reaction was performed in the 96 well VERITI termocycler
(Thermofisher Scientific Inc., Waltham, MA, USA), at the following parameters: Step I, 30
minutes at 16 oC; step II, 30 minutes at 42 oC; step III, 5 minutes at 85 oC. Complementary
DNA synthesis for large molecular weight RNAs was carried out using the high capacity cDNA
reverse transcription kit (Thermofisher Scientific Inc., Waltham, MA, USA), which consisted
of an assay mix containing 5 μl purified RNA, 2 μL 10× RT Buffer, 0.8 μL 25× dNTP mix (100
mM), 2 μL 10× Random primers, 1 μL MultiScribe™ Reverse Transcriptase and 9.2 μL of
nuclease-free water in a final volume of 20 μL. The thermal cycler conditions were: 25 °C for
10 min, then 37 °C for 120 min followed by 85 °C for 5 min.
3.2.3.3 Primer validation
The choice of the endogenous control for the quantification of miRNA-21-5p was based on a
microRNA array (Human miRNome miScript® miRNA PCR Array, Qiagen, Valencia, CA, USA),
in which six endogenous controls were tested in one pool per group of human plasma
samples: SNORD61, SNORD68, SNORD72, SNORD95, SNORD96A and RNU6B (supplementary
figure S1). The RNU6B was shown to be the least prone to variation gene in the samples.

56
However, when tested in each sample, RNU6B amplification presented cycle threshold (Ct)
for the vast majority of samples was over the value of 35 Cts. This way, large molecular
weights RNAs were also tested as endogenous controls to avoid possible misleading results.
Primers for 18S, HPRT and RPL-27 were tested in one pool per group of human plasma
samples (supplementary figure S2). The primer for 18S displayed good linearity (r2 = 0.999)
and was shown to be the least prone to variation. Then, gene expression results for miRNA-
21-5p were calculated with RNU6B or 18S as reference genes, and the results correlated by
the Spearman’s test (r = 0.5835; p = 0.0028), confirming a positive correlation, and validating
the results for both primers. The primer for 18S was chosen as reference gene, as it was the
most stable in samples.
3.2.3.4 Real-time PCR Amplification
Realtime PCR for the quantification of each miRNA-21-5p and RNU6B transcripts was
performed in samples duplicates by mixing 1.00 µl of TaqMan® Small RNA Assay (20✕), 1.33
µl of the specific synthesized cDNA for miRNA-21-5p or RNU6B, 10 µl of TaqMan® Universal
PCR Master Mix II (2✕), no UNG and 7.67 µl of nuclease-free water, in a total volume of 20
µl. The reaction was performed with an initial enzyme activation step at 95 °C for 10 min,
followed by 40 cycles of denaturation at 95 °C for 15 seconds, annealing and extension at 60
°C for 60 seconds, with a subsequent melt curve analysis in the Quantstudio 12K™ Thermal
Cycler (Thermofisher Scientific Inc., Waltham, MA, USA). Real-time PCR for the quantification
of each of the large molecular weight RNAs 18S, RPL-27 and HPRT transcripts was carried out
in duplicates in a reaction mixture of 2x SybrGreen® qPCR Master Mix, 400 nM forward and
reverse oligonucleotides (table 5), and 4.2 µl cDNA in a total volume of 10 µl qPCR was
performed with an initial enzyme activation step at 95°C for 10 min, followed by 40 cycles of
denaturation at 95 °C for 20 sec, annealing at 60 °C for 30 sec and extension at 72 °C for 20
sec with a subsequent melt curve analysis in a Quantstudio 12K™ Thermal Cycler
(Thermofisher Scientific Inc., Waltham, MA, USA). The expression level was calculated as the
n-fold induction of the gene of interest in treated versus control cells with 18S as reference
gene. The calculation is based on the differences in the threshold cycles between control (c)
and treated (treat) groups according to the formula: fold induction = 2 (c-treated)interest / 2 (c-
treated)reference (36).

57
Table 5 – Large molecular weight RNA Primer List
Gene Species Forward (5'-3') Reverse (5'-3') Acc. No.
18S Human CCTGCGGCTTAATTTGACTC ATGCCAGAGTCTCGTTCGTT NR_003286.2
RPL-27 Human CCGAAATGGGCAAGTTCAT CCATCATCAATGTTCTTCACGA NM_000988.3
HPRT Human TGGCGTCGTGATTAGTGATG CTTGAGCACACAGAGGGCTA NM_000194.2
3.2.4 Measurement of plasma cytokine and chemokine content (IL-1β, IL-6, IFN-γ, TNF-α, IL-10, IL-8, CCL2)
The protein measurement protocol consisted of incubating the samples (50 µl) with a
mixture of MagPlex® beads coated with different antibodies for 2 hours, followed by the
detection of target antigens bound to the microspheres with a mixture of biotinylated
capture antibody incubated for 1 hour; then followed by incubation with phycoerithrin
labeled streptavidin for 30 minutes. The identification of microspheres was performed with
the Luminex instrument MAGPIX (Thermofisher Scientific Inc., Waltham, MA, USA). After
reading, the value for each cytokine was analyzed with the Analyst 5.1 software, and
expressed as pg/ml.
3.2.5 Statistics
Data were expressed as mean ± standard error or median [1st. quartile; 3rd. quartile]. The
groups were compared using One-way ANOVA followed, as needed, for multiple
comparisons by Tukey’s post-test. Data with non-parametric distribution were compared
employing Kruskal-Wallis method, followed by Dunn’s post-test. The Spearman correlation
coefficient was obtained to evaluate the linear relationship between the variables of
interest. The significance level was set at p < 0.05. Human experiments data were also tested
and corrected for outliers. All Human data statistical procedures were performed with the
assistance of the Statistics Sector of the Institute of Biomedical Sciences, USP, under the
supervision of Mrs. Rosana Duarte Prisco. The statistical software Statgraphics® Centurion
XVI version 2.16.04 (Statpoint Technologies, Inc. Warrenton, Virginia, USA), and the
Graphpad Prism 5.0 (San Diego, California, USA) were employed in the calculation.

58
4 RESULTS
4.1 Part I – Insulin-induced insulin resistance: Cell culture and rat primary hepatocyte study
The experiments were performed in the laboratory of Nutritional Biochemistry at the
University of Potsdam, in collaboration with Ms. Julia Manowsky, who increased the number
of samples in several experiments and performed assays yielding complementary data. Part
of the results has been already published in the American Journal of Physiology,
Endocrinology and Metabolism (120), and are also included in this Thesis.
4.1.1 Insulin-dependent induction of IL-1β production in U937 macrophages
U937 cells were differentiated into macrophages by PMA treatment. Macrophage-
differentiated U937 cells were stimulated with insulin (100 nM) for 24 h. This stimulation
induced a significant increase in IL-1β expression (2 to 2.5-fold), both in terms of mRNA and
of protein expression (Figures 6a and 6b). Based on the experiments above a number of
experiments were performed in the laboratory (Julia Manowsky) to corroborate the
hypothesis that the increase in IL-1β formation was really a direct consequence of the
stimulation with insulin. Firstly, to exclude that a minor contamination of the insulin
preparation with LPS elicited the IL-1β induction, experiments were performed in which
polymyxine B (LPS inhibitor) was included in the cell culture medium. While an LPS-elicited
induction of IL-1β was completely abolished by polymyxine B, the insulin-dependent
induction was not affected. By contrast, the insulin-dependent induction was abrogated by
the insulin receptor antagonist (GSK1838705), which, however, did not attenuate the LPS-
dependent induction. Thus, the insulin-dependent induction of IL-1β most likely reflected a
specific effect of insulin that was mediated via its receptor. Once confirmed that insulin
stimulates IL-1β gene and protein expression in U937 cells, after differentiation with PMA,
U937 differentiated cells exposed to insulin (100 nM) for 24 h were tested for gene
expression of several other factors with pro-inflammatory and chemoattractant action, such
as IL-8, CCL2, IL-6, OSM, and TNF-α (Table 5). In addition of IL-1β, Insulin induced in a
significant manner the gene expression of IL-8, CCL2, OSM COX2 and mPGES1. This might

59
indicate that insulin in addition to increasing the production of cytokines and chemokines
increased the production of prostaglandin E2 in U937 macrophages. Thus, prostaglandin E2
might further modulate the function of the macrophages in an autocrine loop (see below).
Figure 6 – Insulin-dependent induction of IL-1β in U937 macrophages
Adapted from Manowsky and Camargo (120)
U937 macrophages were stimulated with 100 nM insulin for 24 h. (A) IL-1β mRNA was quantified by Real
time PCR with β-actin as reference gene. (B) IL-1β protein was measured in cell culture supernatants by
Western Blotting. Values are means ± SE of the number of independent experiments indicated. Student's T-
test for unpaired samples; *: p < 0.05. (A) Data generated in collaboration with Ms. Julia Manowsky, (B) Data
generated solely by Ms. Julia Manowsky.
4.1.2 Exclusion of an insulin-dependent induction of U937 monocyte differentiation into macrophages
Treatment of U937 monocytes with PMA for 24 h resulted in a transformation into
macrophages. While monocytes grew in suspension culture, the PMA-treated cells firmly
attached to the cell culture plates. Stimulation with insulin (100 nM) for 24 hours did not
provoke any significant increase in the number of U937 macrophage-differentiated attached
cells, and did not modulate the PMA-dependent attachment, rendering it very unlikely that
insulin could stimulate or modulate monocyte differentiation into macrophages (figure 7).

60
Figure 7 - U937 monocyte differentiation test
Control cells were kept in RPMI1640 medium with 10% heat-inactivated FCS and 1% antibiotics (cell culture medium I) for 24 h (Control) and stimulated cells were treated for 24 h with 100 nM insulin (INS 24 h) or PMA (PMA 24 h). The number of differentiated cells was estimated by counting under light microscope (10 x magnification). Values are means ± SE of three measurements of each number of independent experiments indicated. One-way ANOVA with Tukey’s post-test. *, **: p < 0.0001.
4.1.3 Insulin-dependent induction of cytokine production in U937 macrophages and synergism with pro-inflammatory mediators
Patients with metabolic syndrome often display slightly elevated plasma endotoxin levels
and Insulin induced key enzymes of PGE2 synthesis in U937 macrophages. Therefore, the
synergism among insulin, Lipopolysaccharide and PGE2 was also tested (table 6 and table 7).
Lipopolysaccharide stimulation provoked a significant increase in pro-inflammatory mediator
gene expression, as verified by the induction of IL-1β, IL-8, CCL2, IL-6, TNF-α and TLR2.
Insulin potentiated this induction in IL-1β, IL-8 and IL-6 genes. For CCL2 there is a similar
trend. As for TNF-α and IL-10 insulin caused an induction that, although not significant, was
larger than the LPS-dependent induction, highlighting that there is in some cases a synergism
between Insulin and LPS, which potentiates pro-inflammatory stimuli (figure 8).
Like insulin, PGE2 increased the expression of IL-1β. The induction by a combination of
insulin and PGE2 was larger than for either stimulus alone. Similarly, PGE2 induced IL-6
mRNA, however, this induction was not further enhanced by the presence of insulin. By
contrast, PGE2 reduced the basal expression of TNF-α and CCL2, while Insulin tended to
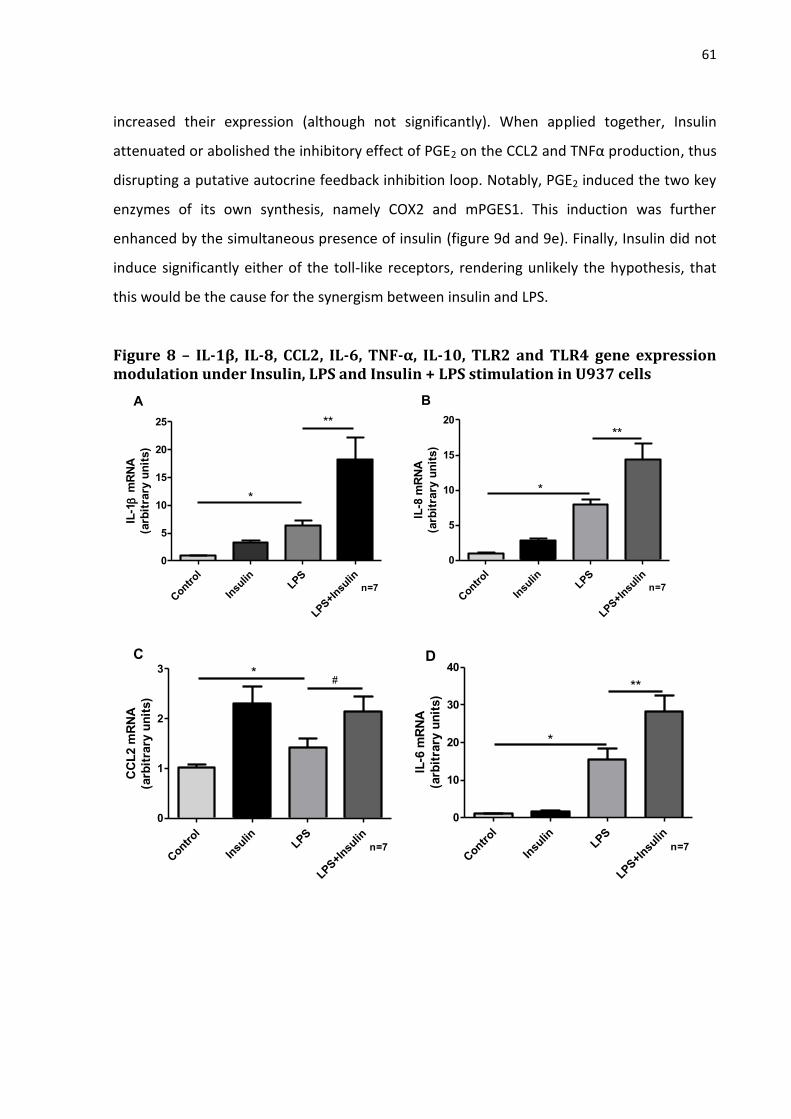
61
increased their expression (although not significantly). When applied together, Insulin
attenuated or abolished the inhibitory effect of PGE2 on the CCL2 and TNFα production, thus
disrupting a putative autocrine feedback inhibition loop. Notably, PGE2 induced the two key
enzymes of its own synthesis, namely COX2 and mPGES1. This induction was further
enhanced by the simultaneous presence of insulin (figure 9d and 9e). Finally, Insulin did not
induce significantly either of the toll-like receptors, rendering unlikely the hypothesis, that
this would be the cause for the synergism between insulin and LPS.
Figure 8 – IL-1β, IL-8, CCL2, IL-6, TNF-α, IL-10, TLR2 and TLR4 gene expression modulation under Insulin, LPS and Insulin + LPS stimulation in U937 cells
Contr
ol
Insu
linLPS
LPS+I
nsulin
0
5
10
15
20
25 **
*
n=7
IL-1
mR
NA
(arb
itra
ry u
nit
s)
A
Contr
ol
Insu
linLPS
LPS+I
nsulin
0
5
10
15
20
*
**
n=7
IL-8
mR
NA
(arb
itra
ry u
nit
s)
B
Contr
ol
Insu
linLPS
LPS+I
nsulin
0
1
2
3 *#
n=7
CC
L2 m
RN
A
(arb
itra
ry u
nit
s)
C
Contr
ol
Insu
linLPS
LPS+I
nsulin
0
10
20
30
40
*
**
n=7
IL-6
mR
NA
(arb
itra
ry u
nit
s)
D
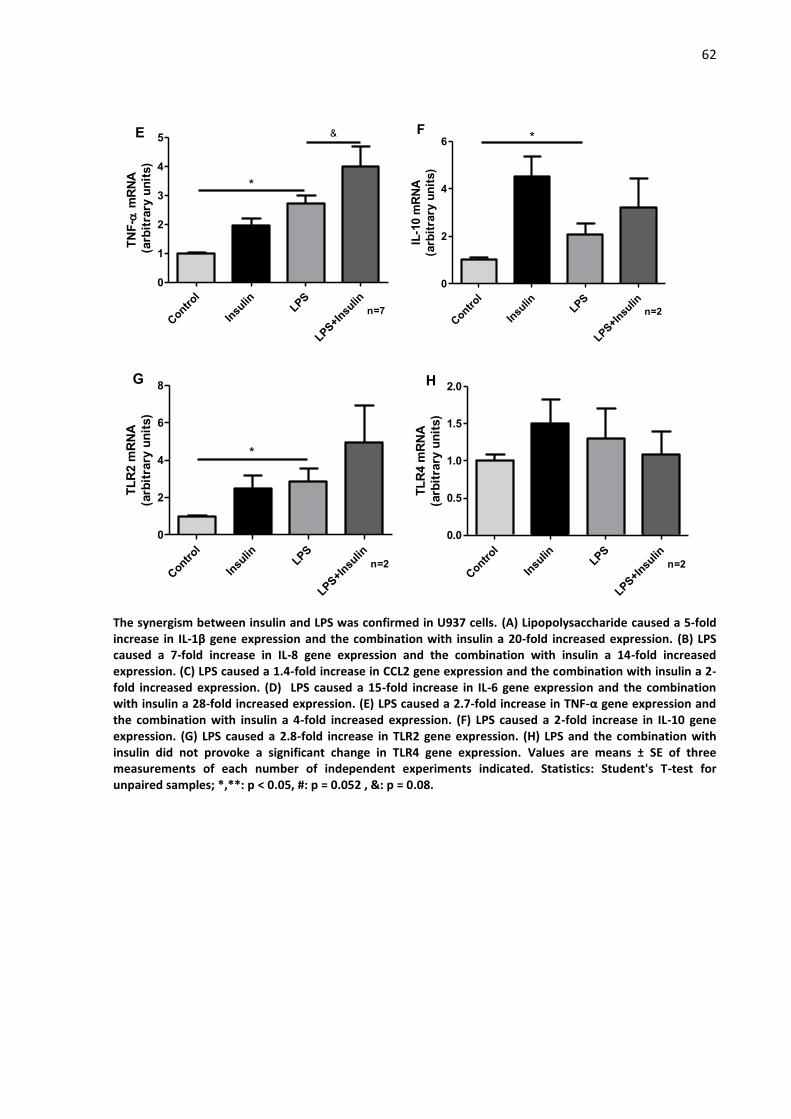
62
Contr
ol
Insu
linLPS
LPS+I
nsulin
0
1
2
3
4
5
*
&
n=7
TN
F-
mR
NA
(arb
itra
ry u
nit
s)
E
Contr
ol
Insu
linLPS
LPS+I
nsulin
0
2
4
6 *
n=2
IL-1
0 m
RN
A
(arb
itra
ry u
nit
s)
F
Contr
ol
Insu
linLPS
LPS+I
nsulin
0
2
4
6
8
*
n=2
TL
R2 m
RN
A
(arb
itra
ry u
nit
s)
G
Contr
ol
Insu
linLPS
LPS+I
nsulin
0.0
0.5
1.0
1.5
2.0
n=2
TL
R4 m
RN
A
(arb
itra
ry u
nit
s)
H
The synergism between insulin and LPS was confirmed in U937 cells. (A) Lipopolysaccharide caused a 5-fold increase in IL-1β gene expression and the combination with insulin a 20-fold increased expression. (B) LPS caused a 7-fold increase in IL-8 gene expression and the combination with insulin a 14-fold increased expression. (C) LPS caused a 1.4-fold increase in CCL2 gene expression and the combination with insulin a 2-fold increased expression. (D) LPS caused a 15-fold increase in IL-6 gene expression and the combination with insulin a 28-fold increased expression. (E) LPS caused a 2.7-fold increase in TNF-α gene expression and the combination with insulin a 4-fold increased expression. (F) LPS caused a 2-fold increase in IL-10 gene expression. (G) LPS caused a 2.8-fold increase in TLR2 gene expression. (H) LPS and the combination with insulin did not provoke a significant change in TLR4 gene expression. Values are means ± SE of three measurements of each number of independent experiments indicated. Statistics: Student's T-test for unpaired samples; *,**: p < 0.05, #: p = 0.052 , &: p = 0.08.

63
Figure 9 – IL-1β, CCL2, IL-6, mPGES1, COX2 and TNF-α gene expression under Insulin, PGE2 and insulin + PGE2 stimulation in U937 cells
Contr
ol
Insu
lin
PGE2
PGE2+
Insu
lin
0
5
10
15
20
25
*
**
n=3
IL-1
mR
NA
(arb
itra
ry u
nit
s)
A
Contr
ol
Insu
lin
PGE2
PGE2+
Insu
lin
0.0
0.5
1.0
1.5
2.0
2.5 *
#
n=3
CC
L2 m
RN
A
(arb
itra
ry u
nit
s)
B
Contr
ol
Insu
lin
PGE2
PGE2+
Insu
lin
0
1
2
3
4
*
n=3
IL-6
mR
NA
(arb
itra
ry u
nit
s)
C
Contr
ol
Insu
lin
PGE2
PGE2+
Insu
lin
0
50
100
150
*
**
n=3
mP
GE
S1 m
RN
A
(arb
itra
ry u
nit
s)
D
Contr
ol
Insu
lin
PGE2
PGE2+
Insu
lin
0
5
10
15
*
**
n=3
CO
X2 m
RN
A
(arb
itra
ry u
nit
s)
E
Contr
ol
Insu
lin
PGE2
PGE2
+ In
sulin
0.0
0.5
1.0
1.5
2.0 *
*
n=3
TN
F-
mR
NA
(arb
itra
ry u
nit
s)
F
The synergism between Insulin and PGE2 was confirmed in U937 cells. (A) PGE2 caused a 7-fold increase in IL-1β gene expression and the combination with insulin an 18-fold increased expression. (B) PGE2 caused a 1.6-fold decrease in CCL2 gene expression. (C) PGE2 caused a 2.6-fold increase in IL-6 gene expression. (D) PGE2 caused a 45-fold increase in mPGES1 gene expression and the combination with insulin a 91-fold increased expression. (E) PGE2 caused a 3.5-fold increase in COX2 gene expression and the combination with insulin a 9-fold increased expression. (F) PGE2 elicited a significant decrease (1.4-fold) in TNF-α expression and the combination with insulin caused reversion of one such inhibition. Values are means ± SE of three measurements of each of the number of independent experiments indicated. Statistics: Student's T-test for unpaired samples; *: p < 0.05; #: p = 0.08.

64
Table 6 - Pro-inflammatory mediator gene expression in insulin stimulated U937 cells
gene
mRNA expression level [arbitrary units]
significance
n control + 100 nM insulin
IL-1β 1.00 ± 0.11 2.29 ± 0.24 p < 0.001 31
IL-8 1.00 ± 0.11 2.16 ± 0.20 p < 0.001 12
CCL2 1.00 ± 0.09 1.92 ± 0.12 p < 0.001 13
IL-6 1.00 ± 0.22 1.73 ± 0.55 n.s. 10
OSM 1.00 ± 0.14 1.61 ± 0.13 p < 0.01 14
mPGES1 1.00 ± 0.08 1.53 ± 0.10 p < 0.001 9
COX2 1.00 ± 0.15 1.41 ± 0.20 n.s. 9
TNF-α 1.00 ± 0.12 1.25 ± 0.10 n.s. 16
IL-10 1.02 ± 0.09 4.53 ± 0.83 p = 0.0012 2
TLR2 1.00 ± 0.06 2.48 ± 0.71 p = 0.09 2
TLR4 1.01 ± 0.07 1.49 ± 0.32 n.s. 2
Adapted from Manowsky and Camargo (120)
IL-1β: Interleukin 1 Beta, IL-8: Interleukin 8, CCL2: Chemokine (C-C motif) ligand 2, IL-6: Interleukin 6, OSM: Oncostatin M, mPGES1: Microsomal prostaglandin E synthase-1, COX2: Cyclooxygenase-2, TNF-α: Tumor necrosis factor alpha. Values are means ± SE of the number of independent experiments indicated for IL-1β, IL-8, CCL2, IL-6, OSM, mPGES1, COX2 and TNF-α. Values are means ± SE of three measurements of each number of independent experiments indicated. Statistics: Student's T-test for unpaired samples. Data for IL-1β, IL-8, CCL2, IL-6, OSM, mPGES1, COX2 and TNF-α generated in collaboration with Ms. Julia Manowsky.
Table 7 - Pro-inflammatory mediator gene expression in LPS and LPS + insulin stimulated U937cells
gene
mRNA expression level [arbitrary units]
n control + 100 ng/ml LPS significance + 100ng/ml LPS +
100 nM Insulin
significance
IL-1β 1.01 ± 0.04 6.33 ± 0.88 p < 0.0001 18.31 ± 3.92 p < 0.0001 7
IL-8 1.01 ± 0.04 7.94 ± 0.79 p < 0.0001 14.38 ± 2.29 p < 0.0001 7
CCL2 1.02 ± 0.05 1.42 ± 0.18 p = 0.04 2.14 ± 0.31 p = 0.01 7
IL-6 1.03 ± 0.05 15.46 ± 3.04 p < 0.0001 28.29 ± 4.08 p < 0.0001 7
TNF-α 1.02 ± 0.04 2.74 ± 0.27 p < 0.0001 4.01 ± 0.69 p < 0.0001 7
IL-10 1.02 ± 0.09 4.54 ± 0.83 p = 0.0012 3.21 ± 1.23 n.s. 2
TLR2 1.00 ± 0.06 2.48 ± 0.71 p = 0.0951 4.98 ± 1.99 n.s. 2
TLR4 1.01 ± 0.07 1.49 ± 0.33 n.s. 1.09 ± 0.31 n.s. 2
IL-1β: Interleukin 1 Beta, IL-8: Interleukin 8, CCL2: Chemokine (C-C motif) ligand 2, IL-6: Interleukin 6, TNF-α: Tumor necrosis factor alpha, IL-10: Interleukin 10, TLR2: Toll-like receptor 2, TLR4: Toll-like receptor 4. Values are means ± SE of three measurements of each number of independent experiments indicated. Statistics: Student's T-test for unpaired samples.

65
Table 8 - Pro-inflammatory mediator gene expression in PGE2 and PGE2 + insulin U937 stimulated cells
gene
mRNA expression level [arbitrary units]
n control + 10µM PGE2 significance + 10µM PGE2 +
100 nM Insulin
significance
IL-1β 1.01 ± 0.04 7.33 ± 1.50 p =0.0007 18.48 ± 4.79 p = 0.0022 3
CCL2 1.00 ± 0.02 0.65 ± 0.04 p < 0.0001 0.77 ± 0.06 p = 0.04 3
IL-6 1.01 ± 0.05 2.64 ± 0.29 p < 0.0001 2.97 ± 0.18 p < 0.0001 3
mPGES1 1.10 ± 0.19 45.91 ± 6.33 p < 0.0001 91.91 ± 14.58 p < 0.0001 3
COX2 1.02 ± 0.07 3.54 ± 0.56 p = 0.0004 9.26 ± 1.70 p = 0.0002 3
TNF-α 1.01 ± 0.04 0.77 ± 0.01 p = 0.043 1.23 ± 0.06 p = 0.0049 3
IL-1β: Interleukin 1 Beta, IL-8: Interleukin 8, CCL2: Chemokine (C-C motif) ligand 2, IL-6: Interleukin 6, mPGES1: Microsomal prostaglandin E2 synthase-1, COX2: Cyclooxygenase 2, TNF-α: Tumor necrosis factor alpha. Values are means ± SE of three measurements of each number of independent experiments indicated. Statistics: Student's T-test for unpaired samples.
4.1.4 Induction of insulin resistance in hepatocytes by supernatants of insulin-treated U937 macrophages
In order to test the hypothesis that insulin-induced cytokine production in U937
macrophages would have physiological relevance, insulin signaling pathway impairment in
rat hepatocytes was evaluated under stimulation with U937 supernatant. One of the most
sensitive enzymes in hepatocytes under insulin stimulation is glucokinase. This enzyme is
responsible for the phosphorylation of glucose in the first step of glycolysis, in which glucose
is converted to glucose-6-phosphate. Insulin stimulus in this study induced an increase of
glucokinase mRNA content up to nine-fold in control hepatocytes (no treatment with
supernatant of U937 macrophages, figure 10), and also in the hepatocytes treated with the
supernatant of non-stimulated U937 macrophages. Hepatocytes exposed to the supernatant
of insulin-treated U937 macrophages, exhibited as 5-fold increase in glucokinase induction
as compared to control hepatocytes, probably due to residual insulin content in the
supernatant of insulin-stimulated macrophages. However, when treated acutely with 100nM
insulin, these cells did not enhance glucokinase mRNA induction, showing an inhibition of
the insulin signaling pathway provoked by the supernatant of insulin-treated U937

66
macrophages, which even in high insulin concentrations provoked an induction in a
maximum range of only 5-fold (figure 10).
Subsequently, the JAK-STAT and MAPK kinases were addressed, since all of them may impair
insulin-mediated stimulation in hepatocytes and could be activated by the cytokines
contained in the supernatant of insulin-stimulated U937 cells. The transcription factor STAT3
was phosphorylated to a higher extent (5-fold) in hepatocytes treated with the supernatant
of insulin-stimulated U937 macrophages, compared to control hepatocytes (figure 11a). The
supernatant of non-stimulated U937 cells induced a 4-fold increase of SOCS3 mRNA, which
demonstrates that even non-stimulated U937 cells present basal IL-6 family cytokine
production at sufficient amount for STAT3 signaling chain activation. The U937 insulin-
stimulated macrophage supernatant elicited an 8-fold induction in SOCS3 mRNA (figure
11b). When acute insulin stimulation (100nM) was offered to hepatocytes, no further effect
was observed. MAP kinase activation by insulin was not found in a significant manner in
hepatocytes maintained in control medium. In hepatocytes treated with the supernatant of
non-stimulated U937 cells, the phosphorylation of ERK 1/2 was significantly higher, in a
similar way to that of hepatocytes treated with the supernatant of the insulin-treated U937
macrophages (2-fold). Moreover, phosphorylation was increased as additional insulin
(100nM) was provided (figure 12a). Serine residues (Ser306 and Ser636) of the insulin
receptor substrate (IRS) are susceptible to MAP kinases phosphorylation (48, 53). This causes
an inhibition in the IRS and resulted in impaired insulin signaling (48). The phosphorylation of
both residues was evaluated by Western Blotting (figure 12). In hepatocytes maintained in
the control medium, the phosphorylation of the Ser306/636 residues was enhanced by the
addition of insulin (2.5-fold, figure 12b), similarly to hepatocytes treated with the
supernatant of non-stimulated U937 macrophages. The acute insulin stimulus did not
further enhance phosphorylation. Nevertheless, phosphorylation of IRS induced in
hepatocytes treated with the supernatant of insulin treated U937 macrophages (2-fold),
compared to hepatocytes treated with the supernatant of non-treated U937 cells. The acute
insulin stimulus failed to further enhance phosphorylation. Finally, the protein Akt
phosphorylation was assessed. Insulin acutely induced a phosphorylation of Akt in control
hepatocytes and hepatocytes that were treated with supernatants of control U937 cells. In
hepatocytes incubated with supernatants of insulin-treated U937 cells Akt was
phosphorylated to a similar extent that in acutely stimulated control hepatocytes. In

67
contrast to what was observed with glucokinase, this phosphorylation was further enhanced
by the addition of fresh insulin to the hepatocytes exposed to the supernatants of insulin-
treated macrophages (figure 13).
Figure 10 - Inhibition of insulin-induced Glucokinase induction in hepatocytes by supernatants of insulin-treated U937 macrophages
Manowsky and Camargo (120)
Primary rat hepatocytes were stimulated with 100 nM insulin for 2h in control medium containing 50% RPMI or with medium containing 50% of U937 macrophage conditioned medium of control or insulin-stimulated U937 macrophages. Glucokinase mRNA expression was quantified by Realtime PCR with β-actin as reference gene. Values are means ± SE of the number of independent experiments indicated. Student's T-test for unpaired samples; *: p < 0.05. Data generated in collaboration with Ms. Julia Manowsky.

68
Figure 11 - Activation of STAT3 and induction of SOCS3 in hepatocytes by supernatants of insulin-treated U937 macrophages
Manowsky and Camargo (120)
Primary rat hepatocytes were stimulated as indicated for 15 min. (A) STAT3 phosphorylation non-phosphorylation ratio was quantified in hepatocyte lysates by Western Blot. (B) SOCS3 mRNA expression was quantified by Realtime PCR with β-actin as reference gene. Student's T-test for unpaired samples; *: p < 0.05; #: significant versus equal stimulus in control medium with p<0.05. Data generated in collaboration with Ms. Julia Manowsky.

69
Figure 12 - Activation of ERK1/2 and inhibitory IRS Ser-phosphorylation in hepatocyte induced by supernatants of insulin-treated U937 macrophage cultures
Adapted from Manowsky and Camargo (120)
Primary rat hepatocytes were cultured as detailed in the methods section. They were then stimulated for 15 min. (A) ERK1/2 and (B) IRS as well as their phosphorylation were quantified in hepatocyte lysates by Western Blotting. Values are means ± SE of the number of independent experiments indicated. Statistics: Student's T-test for unpaired samples; *: p < 0.05; #: significant versus equal stimulus in control medium with p<0.05.
Data generated in collaboration with Ms. Julia Manowsky.

70
Figure 13 - Activation of AKT in hepatocyte induced by supernatants of insulin-treated U937 macrophage cultures
Primary rat hepatocytes were cultured as detailed in the methods section. They were then stimulated for 15 min. (A) Akt (Ser473) as well as its phosphorylation counterpart was quantified in hepatocyte lysates by Western Blotting. Values are means ± SE of the number of independent experiments indicated. Statistics: Student's T-test for unpaired samples; *: p < 0.05.

71
4.2 Part II – Study with Humans
4.2.1 Clinical findings
Patients’ characteristics are shown in Table 8. The individuals of the three groups did not
present significant differences in age, height and/or previously declared body mass. The
Current body mass (p < 0.0003), Body mass loss (%) (p < 0.0001) and Body Mass Index (BMI)
(p = 0.0018) were significantly different among the groups. Tumor staging was similar
between non-cachectic and cachectic patients.
Table 8 - General characteristics of patients in each group.
N WSC TC p Significance
n 16 16 16
Male/Female (n) 9/7 10/6 5/11
Age (years) 60.19 ± 9.71 66.25 ± 8.20 62.94 ± 14.37 0.3102
Height (m) 1.65 ± 0.09 1.63 ± 0.09 1.59 ± 0.10 0.1984
Previous body mass (Kg) 71.39 ± 7.97 73.18 ± 14.87 68.91 ± 12.59 0.6111
Current body mass (Kg) 71.39 ± 7.97 72.78 ± 14.80 56.82 ± 10.09 < 0.0003* N vs TC; WSC vs TC
Δ Body mass (%) 0.00 ± 0.00 0.50± 1.40 -17.10 ± 7.70 < 0.0001* N vs TC; WSC vs TC
BMI (kg/m2) 26.27 ± 2.36 26.03 ± 8.87 22.37 ± 2.99 0.0018* N vs TC; WSC vs TC
Tumor stage
I - 12.5% 6.3% -
IIA/IIB/IIC - 31.3% 37.5% -
IIIA/IIIB/IIIC - 25.0% 31.3% -
IVA/IVB - 6.3% 5.0% -
Not determined - 25.0% - -
Primary tumor site
Colon and rectum - 100% 81.3% -
Other - 0% 18.8% -
Data are expressed as mean ± standard deviation. Δ: Difference between declared previously body mass and current body mass. One-way ANOVA followed by Tukey’s post-test for parametric data or Kruskal Wallis followed by Dunn’s post-test for non-parametric data.
4.2.2 Quality of life assessment
Cachectic patients were evaluated through three different quality of life Scales: Functional
Scales, which evaluate physical, emotional, cognitive and social functioning, Symptom
Scales, which include fatigue, nausea, pain, dyspnea, sleep, appetite loss, constipation,

72
diarrhea and financial difficulties and Global Health Status. Cachectic patients exhibited
differences in comparison to WSC and N in regard to the Functional and Symptom Scales
(figure 14).
Figure 14 - Quality of life assessment
The quality of life of patients was evaluated in Control patients (N), non-cachectic cancer patients (WSC) and cachectic cancer patients (TC) by the QLC-C30 questionnaire, which assessed three different quality of life parameters: Global Health Status (A), Functional Scales (B) and Symptoms Scales (C). One-way ANOVA followed by Tukey’s post-test for parametric data or Kruskal Wallis followed by Dunn’s post-test for non-parametric data; * p < 0.05.
4.2.3 Biochemical parameters
The analysis of the biochemical parameters show that cachectic cancer patients present a
higher degree of inflammation, as compared to non-cachectic cancer and control patients,
reflected by plasma C-Reactive protein concentration (Figure 15a). These patients present
other characteristics of cachexia such as anemia, with significantly diminished hemoglobin
concentration (Figure 15b) and malnutrition, as indicated by the significantly lower albumin
concentration in regard to the WSC and Control groups (Figure 15c). The Glasgow Prognostic
Score (GPS) evaluates the ratio between C-Reactive protein and albumin, and the higher the
Score, the higher the degree of inflammation (76). In this study, the GPS was confirmed as an
efficient tool to evaluate the degrees of inflammation, demonstrating that differences could
be assessed among the groups (figure 15d).

73
Figure 15 – Biochemical parameters and the Glasgow Prognostic Score
The concentration of serum C-Reactive protein (A), Hemoglobin (B), Albumin (C) and the Glasgow Prognostic Score (D) were evaluated in Control patients (N), non-cachectic cancer patients (WSC) and cachectic cancer patients (TC). Data expressed as mean ± standard error. One-way ANOVA followed by Tukey’s post-test for parametric data or Kruskal Wallis followed by Dunn’s post-test for non-parametric data; * p < 0.05.
4.2.4 Cytokine expression assay
The plasma content of six cytokines was evaluated (figure 16). From these, two
cytokines were significantly up-regulated in the cachectic patients compared to control
patients (IL-6 and IL-8). Additionally, TNF-α presented a tendency (p = 0.08) for up-regulation
in the cachectic patients.

74
Figure 16 – Plasma cytokine expression
The concentration of CCL2 (A), TNF-α (B), IL-6 (C), INF-γ (D), IL-10 (E) and IL-8 (F) were determined by Multiplex analysis in Control patients (N), non-cachectic cancer patients (WSC) and cachectic cancer patients (TC). Data are expressed as mean ± standard error. One-way ANOVA followed by Tukey’s post-test for parametric data or Kruskal Wallis followed by Dunn’s post-test for non-parametric data; * p < 0.05.
4.2.5 MicroRNA expression assay
The microRNA expression assay showed miRNA-21-5p to be significantly diminished
in the cachectic patients, compared to the non-cachectic counterparts. Moreover, IL-6
correlated negatively with microRNA-21-5p expression in patient plasma (figure 17).

75
Figure 17 – MicroRNA-21-5p plasma expression and IL-6 Spearman’s correlation with miRNA-21-5p and quality of life assessments
The expression of microRNA-21-5p was evaluated in the plasma of human samples in control patients (N), non-cachectic cancer patients (WSC) and cachectic cancer patients (TC). The results are shown for all samples (A) and after correction for outliers (B). The results were then correlated (Spearman correlation) with the pro-inflammatory cytokine IL-6 (C) and the Scores of the quality of life assessment: Global Health Status (D), Functional Scales (E) and Symptoms Scales (F). MicroRNA-21-5p data expressed as mean ± standard error. One-way ANOVA followed by Tukey’s post-test for parametric data or Kruskal Wallis followed by Dunn’s post-test for non-parametric data; * p < 0.05.
76
5 DISCUSSION
Cachexia and Metabolic Syndrome are both clinically relevant multifactorial
syndromes in which metabolism is disrupted. Obesity and related diseases are considered
nowadays a worldwide epidemy (9), while cachexia reaches up to 80% of cancer patients in
treatment of advanced stages of the disease (3). Despite being considered for a long time
opposite sides of the coin, these two syndromes interestingly share several common
features, as low-grade inflammation and insulin resistance appearing as key players
underlying the etiology and progression of the diseases (10, 11, 14).
Insulin resistance is defined as diminished insulin sensitivity and is highly present in
Cachexia and Metabolic Syndrome (44, 45). In MetS, IR is accompanied by hyperglycemia
(16), while in cachexia, by hypoglycemia. Insulin resistance is considered the most important
feature in MetS, being also-called “the insulin resistance syndrome” (121). In cachexia, the
importance of insulin resistance was also reinforced by a recent publication, in which it was
stated that “impaired insulin signaling is itself a direct cause of cancer cachexia devel-
opment” (122), and anti-diabetic drugs were suggested as possible treatments for CC (123).
Insulin resistance may develop through different mechanisms, such as augmented free fatty
acids in the interstitium and in the circulation, impairing insulin signaling through the
activation of proteins by triglyceride synthesis intermediate diacylglyceride, or by several
inflammatory mediators, such as PGE2 and cytokines, which will directly or indirectly impair
insulin signaling and cause insulin resistance (56). Inflammation is a pivotal feature in insulin
resistance development.
MicroRNAs are small non-coding RNAs, which modulate a wide range of cellular
functions, including RNA transcription, processing, stability, and translation (81). More than
half of human genes are modulate by miRNAs (93), which expression vary depending on
metabolic status and presence of disrupt states as diseases (94). MicroRNAs have a role in
diverse biological processes as cellular differentiation, proliferation, tissue development and
cell-type specific function and homeostasis, and altered miRNAs expression have been linked
to dysregulated magnitude of inflammatory responses (97) and to the development and
maintenance of inflammatory conditions as cancer and type II diabetes.
One of the main characteristics of type II diabetes and MetS is hyperinsulinemia,
which for many years, was thought to be a consequence of insulin resistance; however,

77
studies (108) show that hyperinsulinemia may actually precede hyperglycemia and insulin
resistance, with a high impact on the liver, since insulin is secreted by the pancreas in the
portal vein (109). This raised the first question of the study: Does hyperinsulinemia induce
per se inflammation through macrophage stimulation and, consequently, insulin resistance
in hepatocytes?
The role of insulin in inducing pro-inflammatory mediator expression in cultured
macrophages has been the focus of some studies in the literature, where conflicting results
can be found (124, 125). In this study we show that insulin augmented in a significant
manner the expression of several pro-inflammatory mediators in U937 cultured
differentiated macrophages. Despite that, insulin was not able to elicited monocyte
differentiation into macrophages, indicating that the possible pro-inflammatory role of
insulin does not relate to differentiation, but rather to inducing the production and release
of pro-inflammatory mediators by immune cells. However, differentiation into M1
macrophages may probably be a prerequisite for insulin-dependent induction of cytokine
gene expression, once this phenotype is recognized as pro-inflammatory due to its role in
producing and releasing pro-inflammatory mediators.
Another feature of cachexia and of the Metabolic Syndrome is impaired intestinal
permeability, which causes endotoxemia (126-128). Lipopolysaccharide, a component of
gram-negative bacteria cell wall is a lipid derivative that contributes to the inflammation by
the activation of pro-inflammatory signaling pathways by binding to Toll-like receptor 4 (127,
129, 130). U937 macrophages stimulated with insulin and LPS induced higher levels of key
cytokine expression such as IL-1β, IL-6 and TNF-α than either stimulus alone. Given that in
both in MetS and CC a gut barrier dysfunction with increased LPS permeability is observed
(126, 129), this study suggest a role of a synergism between insulin and LPS in the induction
of pro-inflammatory cytokines that might drive the chronic low level inflammation observed
in patients with MetS. Another molecule described to be overexpressed in MetS and CC is
prostaglandin E2 (131, 132), which, interestingly has two facets. It can be considered a pro-
inflammatory factor, since it enhanced IL-1β, IL-6, mPGES1 and COX2 expression. In the case
of IL-1β and the two prostaglandin synthesizing enzymes, this induction was further
enhanced by the simultaneous presence of insulin. Thus, the hyperinsulinemia that
accompanies MetS to cope with the insulin resistance may further aggravate the induction
of an inflammatory response by other mediators like PGE2. PGE2, on the other hand could

78
also be considered an anti-inflammatory mediator, because it inhibited TNF-α and CCL2 gene
expression in macrophages (133). However, the interaction of PGE2 with insulin provoked a
reversion of the inhibition in regard to TNF-α gene, restoring gene expression to basal levels,
compared to cells treated with only PGE2. This could also contribute to the pro-inflammatory
role of insulin per se. Thus, insulin impaired anti-inflammatory PGE2-dependent feedback
inhibition loops and also elicited the release of pro-inflammatory mediators in synergism
with other molecules capable of provoking inflammation, such as LPS and PGE2.
The role of cytokines has been extensively studied both in CC and MetS (134-136). IL-
1β, TNFα, IL-6 and Interferon-γ have been named “classic cachexia cytokines” (38), as it has
been robustly demonstrated that these cytokines are part of the modulation of the
inflammation that accompanies cachexia (33, 137), and one or more is frequently altered in
cachectic and MetS patients (138). Insulin elicited the high levels of chemokines and
cytokines, such as IL-1β, IL-8, CCL2, OSM and mPGE2 in U937 macrophages and cachectic
patients presented elevated plasma levels of IL-6 and TNFα, as IL-8. The cytokine IL-1β is a
mediator of the inflammatory response in Cachexia and MetS (134). This molecule is
produced by a 30.6 kDa cytosolic precursor (pro-IL-1β) from which the mature 17.4 kDa
cytokine is cleaved by activated caspase I. The precursor is activated by the inflammasome
and released subsequently (139). Gene and protein expression of IL-1β was induced by
insulin, as its levels were significantly higher in the supernatant of insulin-treated U937
macrophages. Induction was likely to be mediated by the NFκB signaling pathway, since
further experiments performed based on the results presented here (120) demonstrated
that insulin activated the kinase upstream of the NFκB activation (IKKβ) by phosphorylation.
When U937 cells were treated with an inhibitor of NFκB, the insulin-dependent induction of
IL-1β was abolished (120). Inflammatory signaling pathways, such as the NFκB, have been
shown to be highly stimulated in peripheral tissues of cachectic and MetS patients (38, 140).
Cytokines as IL-1β, IL-6, TNF-α and IL-8 are all susceptible to NFκB induction, once the
promoter region of these pro-inflammatory mediators present sites for this transcription
factor (141), stressing the importance of this pathway as a mediator of inflammatory
conditions. The hypothesis that the AP1 transcription factor could also be part of the IL-1β
induction by insulin in macrophages was also assessed in a subsequent study, but rejected,
since despite an increased phosphorylation in its upstream protein ERK 1/2, the downstream
proteins c-Jun and c-Fos, essential components of AP1, were not altered (120).

79
The liver is an organ exposed to high insulin concentrations, as the pancreas releases
insulin into the portal vein. Insulin was capable of inducing not only the synthesis and
release of inflammatory mediators by macrophages, but the supernatant obtained from the
culture of these macrophages caused impaired insulin signaling in hepatocytes. One of the
main insulin stimulus “sensors” in hepatocytes is the enzyme glucokinase, as its induction is
downstream to insulin signaling and this enzyme is highly regulated by insulin. Supernatant
of insulin-treated U937 cells caused an almost 50% lower induction of glucokinase in
hepatocytes, even when an acute insulin stimulus was provided, indicating that the
supernatant of U937 macrophages released under insulin stimulus impaired substantially
insulin signaling in hepatocytes. This is the same scenario found in CC and MetS, where
macrophages are known to be the main contributor to local inflammation in the liver and
peripheral organs (142, 143). The mechanisms behind the reduction in glucokinase
expression involve several proteins of the insulin signaling pathway, such as STAT3. This
protein transcription factor has a prominent role in the induction of pro-inflammatory
factors and, at the same time in a negative feedback loop, suppressor of cytokine signaling
(SOCS) molecules in different tissues as muscle, adipose and liver (22). This transcription
factor is activated by phosphorylation through IL-6 cytokine family proteins. Once activated,
STAT3 induces the expression of SOCS3, a protein that impairs directly the insulin signaling at
its receptor level by directing binding to its substrate (54, 74). Cachectic patients exhibited
higher IL-6 circulating levels compared to non-cachectic and controls, and the activation of
STAT3 through phosphorylation was higher in hepatocytes stimulated with supernatant of
insulin-treated macrophages, implying a possible role for the IL-6 cytokines family in the
inflammatory process that culminates in diminished insulin signaling in hepatocytes. In
cachexia, the role of STAT3 in systemic inflammation was reviewed by Zimmers and
colleagues (22), in which IL-6 is linked to poor prognosis, and STAT3, linked to IL-6 action in
several different compartments of the body. However, the link of STAT3 with poor prognosis
needs to be further investigated.
The miRNA-21-5p is a non-coding RNA with high importance in inflammatory
conditions, due to its capacity of modulating the magnitude of inflammatory responses. This
miRNA interacts and regulates the activity of several proteins, including the transcription
factor STAT3, which contains two binding sites in the 3’UTR for the miRNA-21-5p (101). A
study has already focused on the interaction between miRNA-21-5p and immune cells pro-
80
inflammatory mediators production (144). MicroRNA-21-5p negatively correlates with IL-6
and TNF-α expression, acting as an anti-inflammatory molecule in cultured macrophages.
Considering that plasma levels of miRNA-21-5p were diminished in the cachectic patients,
and correlated negatively with the expression of IL-6, this pathway is certainly a candidate as
contributor to the poor prognosis of both CC and MetS. Quality of life of cachectic patients
was highly affected in this study, as verified by the QLC-C30 questionnaire, and could be
partly derived from IL-6 modulation. Cachectic patients exhibited impaired Functional and
Symptoms scales, and a negative correlation was found between IL-6 plasma levels and
Global Health Status. Moreover, a positive correlation between IL-6 plasma levels and
Symptoms Scales was found, reinforcing the role of IL-6 as a mediator of poor outcomes in
CC, as published by Zimmers (22).
In this study, we not only confirm a role for the STAT3 pathway in hepatocytes, but
also propose linking this regulation to the diminished miRNA-21-5p expression. This result
was initially intriguing, as studies (100), correlate the high expression of plasma miRNA-21-
5p as a biomarker for different types of cancer. Despite this, an interesting observation is
that most of the studies, despite finding a significant increase in miRNA-21-5p expression in
cancer compared to non-cancer patients, do not present uniform results among patients.
Some of the patients actually present lower expression compared to control patients (145),
and despite a signifficant difference in miRNA-21-5p expression between control and cancer
patients, pratically half of the patients showed miRNA-21-5p expression to be equal or even
reduced in comparison to control patients. A review article (146), discussed this issue and
raised another question about conflicting results in the literature on human levels of plasma
miRNA-21-5p and cancer. Population ethnicity, choice of the endogenous controls, source of
miRNAs and methods of detection would all have a chance to affect the results, confirming
that studies with patients present several limitations that should be considered in the
analysis. Confirming the conflicting results in the literature due to the miRNA-21-5p role in
inflammatory conditions, a study by Zhang ad coalegues (101) proposed a dual role for the
miRNA-21-5p in cancer, once augmented expression is linked to its progression through
STAT3 modulation, but in the same study it was shown that augmented miRNA-21-5p
expression was linked to diminished STAT3 activation and phosphorylation, highlighting the
importance for the broadening in the understanding on the mechanisms behind the
interaction between miRNA-21-5p and its targets.

81
Liver insulin resistance is a common feature to Cancer cachexia and to the Metabolic
Syndrome. Insulin-induced insulin resistance might be brought about in part by an insulin-
dependent stimulation of cytokine production or enhancement of LPS-induced cytokine
production in macrophages. Among these cytokines, IL-6 can elicit insulin resistance via a
STAT-3-dependent induction of SOCS3. MicroRNA-21-5p is a posttranscriptional regulator of
STAT3 expression. Reduced levels of this miRNA go along with increased STAT3 levels and
consequently enhanced expression of STAT3 target genes like SOCS3. Thus, a reduction of
miRNA-21-5p might further enhance IL-6 dependent SOCS3 production and insulin
resistance. On the other hand, STAT3 mediated signaling pathway is also described as
important for cell growth and survival (147), being the reduced expression of miRNA-21-5p
in some cases possibly beneficial. Although, in specific metabolic disrupted conditions, in
which low-grade inflammation is highly present, such as cancer cachexia and Metabolic
Syndrome, miRNA-21-5p down-regulated expression exerts possibly detrimental effects.

82
6 CONCLUSION
Liver insulin resistance is a feature highly present in Cancer Cachexia and Metabolic
Syndrome, impairing substantially quality of life of patients. Inflammation, through
cytokines, appears as the common denominator in the development and maintenance of
insulin resistance, with hyperinsulinemia and microRNAs as part of its modulation. Therapies
that envisage counteracting the poor outcomes of insulin resistance in Cancer cachexia and
Metabolic Syndrome should essentially target inflammation.
83
REFERENCES1
1. Berriel Diaz M, Krones-Herzig A, Metzger D, Ziegler A, Vegiopoulos A, Klingenspor M, et al. Nuclear receptor cofactor receptor interacting protein 140 controls hepatic triglyceride metabolism during wasting in mice. Hepatology. 2008 Sep;48(3):782-91. PubMed PMID: 18712775. 2. Mangner N, Matsuo Y, Schuler G, Adams V. Cachexia in chronic heart failure: endocrine determinants and treatment perspectives. Endocrine. 2013 Apr;43(2):253-65. PubMed PMID: 22903414. 3. Tisdale MJ. Cancer cachexia. Current opinion in gastroenterology. 2010 Mar;26(2):146-51. PubMed PMID: 19918173. 4. Takayama K, Atagi S, Imamura F, Tanaka H, Minato K, Harada T, et al. Quality of life and survival survey of cancer cachexia in advanced non-small cell lung cancer patients-Japan nutrition and QOL survey in patients with advanced non-small cell lung cancer study. Supportive care in cancer : official journal of the Multinational Association of Supportive Care in Cancer. 2016 Mar 22. PubMed PMID: 27003901. 5. Porporato PE. Understanding cachexia as a cancer metabolism syndrome. Oncogenesis. 2016;5:e200. PubMed PMID: 26900952. 6. Aoyagi T, Terracina K, Raza A, Matsubara H, Takabe K. Cancer cachexia, mechanism and treatment. World J Gastrointest Oncol. 2015;7(4):17-29. 7. Hristova MG. Metabolic syndrome--from the neurotrophic hypothesis to a theory. Medical hypotheses. 2013 Oct;81(4):627-34. PubMed PMID: 23899630. 8. Bae YJ, Kim SH, Chung JH, Song SW, Kim KS, Kim MK, et al. Evaluation of adiposity-related biomarkers as metabolic syndrome indicators. Clinical nutrition research. 2013 Jul;2(2):91-9. PubMed PMID: 23908975. Pubmed Central PMCID: 3728468. 9. Bremer AA, Jialal I. Adipose tissue dysfunction in nascent metabolic syndrome. Journal of obesity. 2013;2013:393192. PubMed PMID: 23653857. Pubmed Central PMCID: 3638696. 10. Andersen CJ, Fernandez ML. Dietary strategies to reduce metabolic syndrome. Reviews in endocrine & metabolic disorders. 2013 Sep;14(3):241-54. PubMed PMID: 23943309. 11. Chen W, Guo J, Zhang Y, Zhang J. The beneficial effects of taurine in preventing metabolic syndrome. Food & function. 2016 Apr 20;7(4):1849-63. PubMed PMID: 26918249. 12. Alberti KGMM, Zimmet P, Shaw J. Metabolic syndrome—a new world-wide definition. A Consensus Statement from the International Diabetes Federation. Diabetic Medicine. 2006;23:469-80. 13. Evans WJ, Morley JE, Argiles J, Bales C, Baracos V, Guttridge D, et al. Cachexia: a new definition. Clinical nutrition. 2008 Dec;27(6):793-9. PubMed PMID: 18718696. 14. Fearon K, Strasser F, Anker S, Bosaeus I, Bruera E, Fainsinger R, et al. Defi nition and classifi cation of cancer cachexia: an international consensus. Lancet Oncol. 2011;12:489-95. 15. Rohla M, Weiss TW. Metabolic syndrome, inflammation and atherothrombosis. Hamostaseologie. 2013;33(4):283-94. PubMed PMID: 23979637. 16. Grundy SM, Brewer HB, Jr., Cleeman JI, Smith SC, Jr., Lenfant C, American Heart A, et al. Definition of metabolic syndrome: Report of the National Heart, Lung, and Blood Institute/American Heart Association conference on scientific issues related to definition. Circulation. 2004 Jan 27;109(3):433-8. PubMed PMID: 14744958. 17. Argiles JM, Busquets S, Lopez-Soriano FJ. Anti-inflammatory therapies in cancer cachexia. European journal of pharmacology. 2011 Sep;668 Suppl 1:S81-6. PubMed PMID: 21835173.
1 In accordance with:
International Committee of Medical Journal Editors. [Internet]. Uniform requirements for manuscripts submitted to Biomedical Journal: sample references. [updated 2011 Jul 15]. Avalilable from: http://www.icmje.org.
84
18. Meshkani R, Adeli K. Hepatic insulin resistance, metabolic syndrome and cardiovascular disease. Clinical biochemistry. 2009 Sep;42(13-14):1331-46. PubMed PMID: 19501581. 19. Rodriguez-Hernandez H, Simental-Mendia LE, Rodriguez-Ramirez G, Reyes-Romero MA. Obesity and inflammation: epidemiology, risk factors, and markers of inflammation. International journal of endocrinology. 2013;2013:678159. PubMed PMID: 23690772. Pubmed Central PMCID: 3652163. 20. Laviano A, Seelaender M, Rianda S, Silverio R, Fanelli F. Neuroinflammation: A Contributing Factor to the Pathogenesis of Cancer Cachexia. Critical Reviews™ in Oncogenesis,. 2012;17(3):247-52. 21. Vaughan VC, Martin P, Lewandowski PA. Cancer cachexia: impact, mechanisms and emerging treatments. Journal of cachexia, sarcopenia and muscle. 2013 Jun;4(2):95-109. PubMed PMID: 23097000. Pubmed Central PMCID: 3684701. 22. Zimmers TA, Fishel ML, Bonetto A. STAT3 in the systemic inflammation of cancer cachexia. Seminars in cell & developmental biology. 2016 Feb 6. PubMed PMID: 26860754. 23. Chauhan A, Yadav SS, Dwivedi P, Lal N, Usman K, Khattri S. Correlation of Serum and Salivary Cytokines Level With Clinical Parameters in Metabolic Syndrome With Periodontitis. Journal of clinical laboratory analysis. 2016 Feb 22. PubMed PMID: 26899213. 24. Berg G, Miksztowicz V, Schreier L. Metalloproteinases in metabolic syndrome. Clinica chimica acta; international journal of clinical chemistry. 2011 Sep 18;412(19-20):1731-9. PubMed PMID: 21703252. 25. Suzuki H, Asakawa A, Amitani H, Nakamura N, Inui A. Cancer cachexia--pathophysiology and management. Journal of gastroenterology. 2013 May;48(5):574-94. PubMed PMID: 23512346. Pubmed Central PMCID: 3698426. 26. Batista ML, Jr., Olivan M, Alcantara PS, Sandoval R, Peres SB, Neves RX, et al. Adipose tissue-derived factors as potential biomarkers in cachectic cancer patients. Cytokine. 2013 Feb;61(2):532-9. PubMed PMID: 23200412. 27. Fearon K, Arends J, Baracos V. Understanding the mechanisms and treatment options in cancer cachexia. Nature reviews Clinical oncology. 2013 Feb;10(2):90-9. PubMed PMID: 23207794. 28. Batista ML, Jr., Peres SB, McDonald ME, Alcantara PS, Olivan M, Otoch JP, et al. Adipose tissue inflammation and cancer cachexia: possible role of nuclear transcription factors. Cytokine. 2012 Jan;57(1):9-16. PubMed PMID: 22099872. 29. Machado AP, Costa Rosa LF, Seelaender MC. Adipose tissue in Walker 256 tumour-induced cachexia: possible association between decreased leptin concentration and mononuclear cell infiltration. Cell and tissue research. 2004 Dec;318(3):503-14. PubMed PMID: 15490241. 30. Honors MA, Kinzig KP. The role of insulin resistance in the development of muscle wasting during cancer cachexia. Journal of cachexia, sarcopenia and muscle. 2012 Mar;3(1):5-11. PubMed PMID: 22450024. Pubmed Central PMCID: 3302982. 31. Lago F, Dieguez C, Gomez-Reino J, Gualillo O. Adipokines as emerging mediators of immune response and inflammation. Nature clinical practice Rheumatology. 2007 Dec;3(12):716-24. PubMed PMID: 18037931. 32. Hirabara SM, Gorjao R, Vinolo MA, Rodrigues AC, Nachbar RT, Curi R. Molecular targets related to inflammation and insulin resistance and potential interventions. Journal of biomedicine & biotechnology. 2012;2012:379024. PubMed PMID: 23049242. Pubmed Central PMCID: 3463198. 33. Seelaender M, Batista M, Jr., Lira F, Silverio R, Rossi-Fanelli F. Inflammation in cancer cachexia: to resolve or not to resolve (is that the question?). Clinical nutrition. 2012 Aug;31(4):562-6. PubMed PMID: 22348869. 34. Bing C. Lipid mobilization in cachexia: mechanisms and mediators. Current opinion in supportive and palliative care. 2011 Dec;5(4):356-60. PubMed PMID: 21934502. 35. Khor V, Shen W, Kraemer F. Lipid Droplet Metabolism. Curr Opin Clin Nutr Metab Care. 2013;16(6):632–7.

85
36. Livak KJ, Schmittgen TD. Analysis of relative gene expression data using real-time quantitative PCR and the 2(-Delta Delta C(T)) Method. Methods. 2001 Dec;25(4):402-8. PubMed PMID: 11846609. 37. Ryden M, Agustsson T, Laurencikiene J, Britton T, Sjolin E, Isaksson B, et al. Lipolysis--not inflammation, cell death, or lipogenesis--is involved in adipose tissue loss in cancer cachexia. Cancer. 2008 Oct 1;113(7):1695-704. PubMed PMID: 18704987. 38. Camargo RG, Riccardi DM, Ribeiro HQ, Carnevali LC, Jr., de Matos-Neto EM, Enjiu L, et al. NF-kappaBp65 and Expression of Its Pro-Inflammatory Target Genes Are Upregulated in the Subcutaneous Adipose Tissue of Cachectic Cancer Patients. Nutrients. 2015 Jun;7(6):4465-79. PubMed PMID: 26053616. Pubmed Central PMCID: 4488796. 39. Oliver E, McGillicuddy F, Phillips C, Toomey S, Roche HM. The role of inflammation and macrophage accumulation in the development of obesity-induced type 2 diabetes mellitus and the possible therapeutic effects of long-chain n-3 PUFA. The Proceedings of the Nutrition Society. 2010 May;69(2):232-43. PubMed PMID: 20158940. 40. Coelho D, Gualano B, Artioli G, Roschel H, Amano M, Benatti F, et al. EXERCISE TRAINING ATTENUATES LIPECTOMY-INDUCED IMPAIRED GLUCOSE TOLERANCE IN RATS. ENDOCRINE REGULATIONS,. 2009;43:107-16. 41. Riehle C, Abel ED. Insulin Signaling and Heart Failure. Circulation research. 2016 Apr 1;118(7):1151-69. PubMed PMID: 27034277. Pubmed Central PMCID: 4833475. 42. Cartee G. Mechanisms for greater insulin-stimulated glucose uptake in normal and insulin-resistant skeletal muscle after acute exercise. Am J Physiol Endocrinol Metab. 2015;309:949-59. 43. Baumgard LH, Hausman GJ, Sanz Fernandez MV. Insulin: pancreatic secretion and adipocyte regulation. Domestic animal endocrinology. 2016 Jan;54:76-84. PubMed PMID: 26521203. 44. Winter A, MacAdams J, Chevalier S. Normal protein anabolic response to hyperaminoacidemia in insulin-resistant patients with lung cancer cachexia. Clinical nutrition. 2012 Oct;31(5):765-73. PubMed PMID: 22647419. 45. Park BS, Yoon JS. Relative skeletal muscle mass is associated with development of metabolic syndrome. Diabetes & metabolism journal. 2013 Dec;37(6):458-64. PubMed PMID: 24404517. Pubmed Central PMCID: 3881330. 46. Vonbank A, Saely CH, Rein P, Drexel H. Insulin resistance is significantly associated with the metabolic syndrome, but not with sonographically proven peripheral arterial disease. Cardiovascular diabetology. 2013;12:106. PubMed PMID: 23866050. Pubmed Central PMCID: 3720189. 47. Kaul K, Apostolopoulou M, Roden M. Insulin resistance in type 1 diabetes mellitus. Metabolism: clinical and experimental. 2015 Dec;64(12):1629-39. PubMed PMID: 26455399. 48. Birkenfeld AL, Shulman GI. Nonalcoholic fatty liver disease, hepatic insulin resistance, and type 2 diabetes. Hepatology. 2014 Feb;59(2):713-23. PubMed PMID: 23929732. Pubmed Central PMCID: 3946772. 49. Morettini M, Storm F, Sacchetti M, Cappozzo A, Mazza C. Effects of walking on low-grade inflammation and their implications for Type 2 Diabetes. Preventive medicine reports. 2015;2:538-47. PubMed PMID: 26844115. Pubmed Central PMCID: 4721345. 50. Ballak DB, Stienstra R, Tack CJ, Dinarello CA, van Diepen JA. IL-1 family members in the pathogenesis and treatment of metabolic disease: Focus on adipose tissue inflammation and insulin resistance. Cytokine. 2015 Oct;75(2):280-90. PubMed PMID: 26194067. Pubmed Central PMCID: 4553099. 51. Jager J, Aparicio-Vergara M, Aouadi M. Liver innate immune cells and insulin resistance: the multiple facets of Kupffer cells. Journal of internal medicine. 2016 Feb 11. PubMed PMID: 26864622. 52. De Luca C, Olefsky J. Inflammation and Insulin Resistance. FEBS Lett. 2008;582(1):97-105.

86
53. Nov O, Kohl A, Lewis EC, Bashan N, Dvir I, Ben-Shlomo S, et al. Interleukin-1beta may mediate insulin resistance in liver-derived cells in response to adipocyte inflammation. Endocrinology. 2010 Sep;151(9):4247-56. PubMed PMID: 20660063. 54. Senn JJ, Klover PJ, Nowak IA, Zimmers TA, Koniaris LG, Furlanetto RW, et al. Suppressor of cytokine signaling-3 (SOCS-3), a potential mediator of interleukin-6-dependent insulin resistance in hepatocytes. The Journal of biological chemistry. 2003 Apr 18;278(16):13740-6. PubMed PMID: 12560330. 55. Henkel J, Neuschafer-Rube F, Pathe-Neuschafer-Rube A, Puschel GP. Aggravation by prostaglandin E2 of interleukin-6-dependent insulin resistance in hepatocytes. Hepatology. 2009 Sep;50(3):781-90. PubMed PMID: 19575453. 56. Henkel J, Gartner D, Dorn C, Hellerbrand C, Schanze N, Elz SR, et al. Oncostatin M produced in Kupffer cells in response to PGE2: possible contributor to hepatic insulin resistance and steatosis. Laboratory investigation; a journal of technical methods and pathology. 2011 Jul;91(7):1107-17. PubMed PMID: 21519329. 57. Buch A, Carmeli E, Boker LK, Marcus Y, Shefer G, Kis O, et al. Muscle function and fat content in relation to sarcopenia, obesity and frailty of old age - An overview. Experimental gerontology. 2016 Apr;76:25-32. PubMed PMID: 26785313. 58. Drescher C, Konishi M, Ebner N, Springer J. Loss of muscle mass: current developments in cachexia and sarcopenia focused on biomarkers and treatment. Journal of cachexia, sarcopenia and muscle. 2015 Dec;6(4):303-11. PubMed PMID: 26676067. Pubmed Central PMCID: 4670737. 59. Tanada Y, Shioi T, Kato T, Kawamoto A, Okuda J, Kimura T. Branched-chain amino acids ameliorate heart failure with cardiac cachexia in rats. Life sciences. 2015 Sep 15;137:20-7. PubMed PMID: 26141987. 60. Tisdale MJ. Mechanisms of Cancer Cachexia. Physiol Rev. 2009;89:381-410. 61. Kramer HF, Goodyear LJ. Exercise, MAPK, and NF-kappaB signaling in skeletal muscle. Journal of applied physiology. 2007 Jul;103(1):388-95. PubMed PMID: 17303713. 62. Dimitriadis G, Mitrou P, Lambadiari V, Maratou E, Raptis SA. Insulin effects in muscle and adipose tissue. Diabetes Res Clin Pract. 2011;93(1). 63. Cleasby ME, Jamieson PM, Atherton PJ. Insulin resistance and sarcopenia: mechanistic links between common co-morbidities. J Endocrinol. 2016. Epub Mar 1. 64. Bermudez-Cardona J, Velasquez-Rodriguez C. Profile of Free Fatty Acids and Fractions of Phospholipids, Cholesterol Esters and Triglycerides in Serum of Obese Youth with and without Metabolic Syndrome. Nutrients. 2016;8(2). PubMed PMID: 26891317. Pubmed Central PMCID: 4772025. 65. Frayn K, Arner P, Yki-Järvinen H. Fatty acid metabolism in adipose tissue, muscle and liver in health and disease. Essays in Biochemistry. 2006;42:89-103. 66. Carbone F, Montecucco F, Mach F, Pontremoli R, Viazzi F. The liver and the kidney: two critical organs influencing the atherothrombotic risk in metabolic syndrome. Thrombosis and haemostasis. 2013 Nov;110(5):940-58. PubMed PMID: 23966104. 67. Martignoni. Liver macrophages contribute to pancreatic cancer-related cachexia. Oncology Reports. 1994. 68. Berk PD, Verna EC. Nonalcoholic Fatty Liver Disease: Lipids and Insulin Resistance. Clinics in liver disease. 2016 May;20(2):245-62. PubMed PMID: 27063267. Pubmed Central PMCID: 4830921. 69. Silverio R, Laviano A, Rossi Fanelli F, Seelaender M. L-Carnitine induces recovery of liver lipid metabolism in cancer cachexia. Amino acids. 2012 May;42(5):1783-92. PubMed PMID: 21465256. 70. Springer J, Haehling S, Anker S. Liver metabolism in cardiac cachexia. International Journal of Cardiology. 2013;162:71-2. 71. Esmaili S, Xu A, George J. The multifaceted and controversial immunometabolic actions of adiponectin. Trends in endocrinology and metabolism: TEM. 2014 Sep;25(9):444-51. PubMed PMID: 24997879.
87
72. Fasshauer M, Bluher M. Adipokines in health and disease. Trends in pharmacological sciences. 2015 Jul;36(7):461-70. PubMed PMID: 26022934. 73. Jiang Y, Biswas S, Steinle J. Serine 307 on insulin receptor substrate 1 is required for SOCS3 and TNF-α signaling in the rMC-1 cell line. Molecular Vision. 2014;20:1463-70. 74. Huang Z, Wang Y, Hu G, Zhou J, Mei L, Xiong WC. YAP Is a Critical Inducer of SOCS3, Preventing Reactive Astrogliosis. Cerebral cortex. 2016 May;26(5):2299-310. PubMed PMID: 26679195. Pubmed Central PMCID: 4830299. 75. Sharabi K, Tavares CD, Rines AK, Puigserver P. Molecular pathophysiology of hepatic glucose production. Molecular aspects of medicine. 2015 Dec;46:21-33. PubMed PMID: 26549348. Pubmed Central PMCID: 4674831. 76. McMillan DC. An inflammation-based prognostic score and its role in the nutrition-based management of patients with cancer. The Proceedings of the Nutrition Society. 2008 Aug;67(3):257-62. PubMed PMID: 18452641. 77. Paneni F, Costantino S, Cosentino F. Role of oxidative stress in endothelial insulin resistance. World journal of diabetes. 2015 Mar 15;6(2):326-32. PubMed PMID: 25789114. Pubmed Central PMCID: 4360426. 78. Misra UK, Pizzo SV. Upregulation of GRP78 and antiapoptotic signaling in murine peritoneal macrophages exposed to insulin. J Leukoc Biol. 2005;78(1):187-94. 79. Filgueiras LR, Capelozzi VL, Martins JO, Jancar S. Sepsis-induced lung inflammation is modulated by insulin. BMC Pulmonary Medicine. 2014;14(177):1-8. 80. Melmed S, Polonsky KS, Larsen PR, HM. K. Williams Textbook of Endocrinology. Philadelphia: Elsevier Saunders; 2011. 81. Carthew RW, Sontheimer EJ. Origins and Mechanisms of miRNAs and siRNAs. Cell. 2009 Feb 20;136(4):642-55. PubMed PMID: 19239886. Pubmed Central PMCID: 2675692. 82. Kim VN, Han J, Siomi MC. Biogenesis of small RNAs in animals. Nature reviews Molecular cell biology. 2009 Feb;10(2):126-39. PubMed PMID: 19165215. 83. Seitz H, Zamore PD. Rethinking the microprocessor. Cell. 2006 Jun 2;125(5):827-9. PubMed PMID: 16751089. 84. Han J, Lee Y, Yeom KH, Nam JW, Heo I, Rhee JK, et al. Molecular basis for the recognition of primary microRNAs by the Drosha-DGCR8 complex. Cell. 2006 Jun 2;125(5):887-901. PubMed PMID: 16751099. 85. Shen J, Hung MC. Signaling-mediated regulation of MicroRNA processing. Cancer research. 2015 Mar 1;75(5):783-91. PubMed PMID: 25660948. Pubmed Central PMCID: 4348149. 86. Khvorova A, Sumedha A, Jayasena D. Functional siRNAs and miRNAs Exhibit Strand Bias. Cell. 2003;115:209-16. 87. Schwarz D, Hutvagner G, Du T, Xu Z, Aronin N, Zamore PD. Asymmetry in the Assembly of the RNAi Enzyme Complex. Cell. 2003;115:199-208. 88. Kharaziha P, Ceder S, Li Q, Panaretakis T. Tumor cell-derived exosomes: a message in a bottle. Biochimica et biophysica acta. 2012 Aug;1826(1):103-11. PubMed PMID: 22503823. 89. Bang C, Batkai S, Dangwal S, Gupta S, Foinquinos A, Holzmann A, et al. Cardiac fibroblast–derived microRNA passenger strand-enriched exosomes mediate cardiomyocyte hypertrophy. The Journal of Clinical Investigation. 2014;124(5):2136–46. 90. Yin Y, Li J, Chen S, Zhou T, Si J. MicroRNAs as diagnostic biomarkers in gastric cancer. International journal of molecular sciences. 2012;13(10):12544-55. PubMed PMID: 23202912. Pubmed Central PMCID: 3497286. 91. Farazi TA, Hoell JI, Morozov P, Tuschl T. MicroRNAs in human cancer. Advances in experimental medicine and biology. 2013;774:1-20. PubMed PMID: 23377965. Pubmed Central PMCID: 3704221. 92. Orom UA, Nielsen FC, Lund AH. MicroRNA-10a binds the 5'UTR of ribosomal protein mRNAs and enhances their translation. Molecular cell. 2008 May 23;30(4):460-71. PubMed PMID: 18498749.

88
93. Lewis A, Redrup L. Genetic Imprinting: Conflict at the Callipyge Locus. Current Biology. 2005;15(8):291-3. 94. Camargo RG, Quintas Teixeira Ribeiro H, Geraldo MV, Matos-Neto E, Neves RX, Carnevali LC, Jr., et al. Cancer Cachexia and MicroRNAs. Mediators of inflammation. 2015;2015:367561. PubMed PMID: 26504359. Pubmed Central PMCID: 4609493. 95. Carta A, Chetcuti R, Ayers D. An Introspective Update on the Influence of miRNAs in Breast Carcinoma and Neuroblastoma Chemoresistance. Genetics research international. 2014;2014:743050. PubMed PMID: 25548681. Pubmed Central PMCID: 4273469. 96. Saba R, Sorensen DL, Booth SA. MicroRNA-146a: A Dominant, Negative Regulator of the Innate Immune Response. Frontiers in immunology. 2014;5:578. PubMed PMID: 25484882. Pubmed Central PMCID: 4240164. 97. Hu R, O’Connell R. MicroRNA control in the development of systemic autoimmunity. Arthritis Research & Therapy. 2013;15:1-9. 98. Sheedy FJ. Turning 21: Induction of miR-21 as a Key Switch in the Inflammatory Response. Frontiers in immunology. 2015;6:19. PubMed PMID: 25688245. Pubmed Central PMCID: 4310327. 99. Lagos-Quintana M, Rauhut R, Lendeckel W, Tuschl T. IdentiÞcation of Novel Genes Coding for Small Expressed RNAs. SCIENCE. 2001;294(5543):853-8. 100. Conev NV, Donev IS, Konsoulova-Kirova AA, Chervenkov TG, Kashlov JK, Ivanov KD. Serum expression levels of miR-17, miR-21, and miR-92 as potential biomarkers for recurrence after adjuvant chemotherapy in colon cancer patients. Bioscience trends. 2015 Dec;9(6):393-401. PubMed PMID: 26781797. 101. Zhang C, Liu K, Li T, Fang J, Ding Y, Sun L, et al. miR-21: A gene of dual regulation in breast cancer. International journal of oncology. 2016 Jan;48(1):161-72. PubMed PMID: 26549725. 102. Wang Z, Han J, Cui Y, Zhou X, Fan K. miRNA-21 inhibition enhances RANTES and IP-10 release in MCF-7 via PIAS3 and STAT3 signalling and causes increased lymphocyte migration. Biochemical and biophysical research communications. 2013 Sep 27;439(3):384-9. PubMed PMID: 23998932. 103. Murri M, Insenser M, Fernandez-Duran E, San-Millan JL, Escobar-Morreale HF. Effects of polycystic ovary syndrome (PCOS), sex hormones, and obesity on circulating miRNA-21, miRNA-27b, miRNA-103, and miRNA-155 expression. The Journal of clinical endocrinology and metabolism. 2013 Nov;98(11):E1835-44. PubMed PMID: 24037889. 104. Seeger T, Fischer A, Muhly-Reinholz M, Zeiher AM, Dimmeler S. Long-term inhibition of miR-21 leads to reduction of obesity in db/db mice. Obesity. 2014 Nov;22(11):2352-60. PubMed PMID: 25141837. 105. He WA, Calore F, Londhe P, Canella A, Guttridge DC, Croce CM. Microvesicles containing miRNAs promote muscle cell death in cancer cachexia via TLR7. Proceedings of the National Academy of Sciences of the United States of America. 2014 Mar 25;111(12):4525-9. PubMed PMID: 24616506. Pubmed Central PMCID: 3970508. 106. Loffler D, Brocke-Heidrich K, Pfeifer G, Stocsits C, Hackermuller J, Kretzschmar AK, et al. Interleukin-6 dependent survival of multiple myeloma cells involves the Stat3-mediated induction of microRNA-21 through a highly conserved enhancer. Blood. 2007 Aug 15;110(4):1330-3. PubMed PMID: 17496199. 107. Khodabandehloo H, Gorgani-Firuzjaee S, Panahi G, Meshkani R. Molecular and cellular mechanisms linking inflammation to insulin resistance and beta-cell dysfunction. Translational research : the journal of laboratory and clinical medicine. 2016 Jan;167(1):228-56. PubMed PMID: 26408801. 108. Shanik MH, Xu Y, Skrha J, Dankner R, Zick Y, Roth J. Insulin resistance and hyperinsulinemia: is hyperinsulinemia the cart or the horse? Diabetes care. 2008 Feb;31 Suppl 2:S262-8. PubMed PMID: 18227495. 109. Arbit E, Kidron M. Oral Insulin: The Rationale for This Approach and Current Developments. Journal of Diabetes Science and Technology. 2009;3(3):562-7.

89
110. Stevens J, R.L. A, Pohl SL. Insulin-induced insulin resistance of lipolysis in human adipocytes in organ culture. J Clin Endocrinol Metab. 1980;51(4):921-4. 111. de Laat MA, McGowan CM, Sillence MN, Pollitt CC. Hyperinsulinemic laminitis. The Veterinary clinics of North America Equine practice. 2010 Aug;26(2):257-64. PubMed PMID: 20699173. 112. Meredith M. Rat hepatocytes prepared without collagenase: prolonged retention of differentiated characteristics in culture. Cell Biology and Toxicology,. 1988;4(4):405-25. 113. Mahmood T, Yang PC. Western blot: technique, theory, and trouble shooting. North American journal of medical sciences. 2012 Sep;4(9):429-34. PubMed PMID: 23050259. Pubmed Central PMCID: 3456489. 114. Bradford M. A rapid and Sensitive Method for the Quantitation of Microgram Quantities of Protein Utilizing the Principle of Protein-Dye Binding. Analytical Biochemistry. 1976;72:248-54. 115. Laemmli U. Cleavage of Structural Proteins during the Assembly of the Head of Bacteriophage T4. Nature. 1970;227(5259):680-5. 116. TNM, Classification of Malignant Tumors. 7th ed. L.H. Sobin MKG, and, Wittekind. C, editors: Wiley-Blackwell; 2009. 117. Aaronson NK, Ahmedzai S, Bergman B, Bullinger M, Cull A, Duez NJ, et al. The European Organization for Research and Treatment of Cancer QLQ-C30: a quality-of-life instrument for use in international clinical trials in oncology. J Natl Cancer Inst. 1993;85(5):365-76. 118. Pais-Ribeiro J, Pinto C, Santos C. VALIDATION STUDY OF THE PORTUGUESE VERSION OF THE QLC-C30-V.3. PSICOLOGIA, SAÚDE & DOENÇAS. 2008;9(1):89-102. 119. Chomczynski P, Sacchi N. Single-Step Method of RNA Isolation by Acid Guanidinium Thiocyanate-Phenol-Chloroform Extraction. ANALYTICAL BIOCHEMISTRY. 1987;162:156-9. 120. Manowsky J, Camargo R, Kipp A, Henkel J, Püschel G. Insulin-induced cytokine production in macrophages causes insulin resistance in hepatocytes. Am J Physiol Endocrinol Metab. 2016. Epub Apr 19. 121. HAFFNER SM, VALDEZ RA, HAZUDA HP, MITCHELL BD, MORALES PA, STERN MP. Prospective Analysis of the Insulin-Resistance Syndrome (Syndrome X). Diabetes. 1992;41:715-22. 122. Wagner EF, Petruzzelli M. A waste of insulin interference. Nature. 2015;521:430-1. 123. Chevalier S, Farsijani S. Cancer cachexia and diabetes: similarities in metabolic alterations and possible treatment. Appl Physiol Nutr Metab. 2013;39(6):643-53. 124. Bunn RC, Cockrell GE, Ou Y, Thrailkill KM, Lumpkin CK, Jr., Fowlkes JL. Palmitate and insulin synergistically induce IL-6 expression in human monocytes. Cardiovascular diabetology. 2010;9:73. PubMed PMID: 21054880. Pubmed Central PMCID: 2988002. 125. Martins J, Ferracini M, Ravanelli N, Landgraf R, Jancar S. Insulin Suppresses LPS-induced iNOS and COX-2 Expression and NF-κB Activation in Alveolar Macrophages. Cell Physiol Biochem. 2008;22:279-86. 126. Klein GL, Petschow BW, Shaw AL, Weaver E. Gut barrier dysfunction and microbial translocation in cancer cachexia: a new therapeutic target. Current opinion in supportive and palliative care. 2013 Dec;7(4):361-7. PubMed PMID: 24157715. Pubmed Central PMCID: 3819310. 127. Mehta NN, McGillicuddy FC, Anderson PD, Hinkle CC, Shah R, Pruscino L, et al. Experimental endotoxemia induces adipose inflammation and insulin resistance in humans. Diabetes. 2010 Jan;59(1):172-81. PubMed PMID: 19794059. Pubmed Central PMCID: 2797919. 128. Cavalcante-Silva LH, Galvao JG, da Silva JS, de Sales-Neto JM, Rodrigues-Mascarenhas S. Obesity-Driven Gut Microbiota Inflammatory Pathways to Metabolic Syndrome. Frontiers in physiology. 2015;6:341. PubMed PMID: 26635627. Pubmed Central PMCID: 4652019. 129. Jialal I, Rajamani U, Adams-Huet B, Kaur H. Circulating pathogen-associated molecular pattern - binding proteins and High Mobility Group Box protein 1 in nascent metabolic syndrome: implications for cellular Toll-like receptor activity. Atherosclerosis. 2014 Sep;236(1):182-7. PubMed PMID: 25063948.

90
130. Hessle CC, Andersson B, Wold AE. Gram-positive and Gram-negative bacteria elicit different patterns of pro-inflammatory cytokines in human monocytes. Cytokine. 2005 Jun 21;30(6):311-8. PubMed PMID: 15935951. 131. Rebeca R, Bracht L, Noleto GR, Martinez GR, Cadena SM, Carnieri EG, et al. Production of cachexia mediators by Walker 256 cells from ascitic tumors. Cell Biochem Funct. 2008;26(6):731-8. 132. Faber J, Uitdehaag MJ, Spaander M, van Steenbergen-Langeveld S, Vos P, Berkhout M, et al. Improved body weight and performance status and reduced serum PGE2 levels after nutritional intervention with a specific medical food in newly diagnosed patients with esophageal cancer or adenocarcinoma of the gastro-esophageal junction. Journal of cachexia, sarcopenia and muscle. 2015 Mar;6(1):32-44. PubMed PMID: 26136410. Pubmed Central PMCID: 4435095. 133. Stafford JB, Marnett LJ. Prostaglandin E2 inhibits tumor necrosis factor-alpha RNA through PKA type I. Biochemical and biophysical research communications. 2008 Feb 1;366(1):104-9. PubMed PMID: 18060853. Pubmed Central PMCID: 2761429. 134. Argilés J, López-Soriano F, Busquets S. Counteracting Inflammation: A Promising Therapy in Cachexia. Critical Reviews™ in Oncogenesis. 2012;17(3):253–62. 135. Fujiwara Y, Kobayashi T, Chayahara N, Imamura Y, Toyoda M, Kiyota N, et al. Metabolomics evaluation of serum markers for cachexia and their intra-day variation in patients with advanced pancreatic cancer. PloS one. 2014;9(11):e113259. PubMed PMID: 25411961. Pubmed Central PMCID: 4239056. 136. Paragh G, Seres I, Harangi M, Fülöp P. Dynamic interplay between metabolic syndrome and immunity. Adv Exp Med Biol. 2014;824:171-90. 137. de Matos-Neto EM, Lima JD, de Pereira WO, Figueredo RG, Riccardi DM, Radloff K, et al. Systemic Inflammation in Cachexia - Is Tumor Cytokine Expression Profile the Culprit? Frontiers in immunology. 2015;6:629. PubMed PMID: 26732354. Pubmed Central PMCID: 4689790. 138. Srikanthan K, Feyh A, Visweshwar H, Shapiro JI, Sodhi K. Systematic Review of Metabolic Syndrome Biomarkers: A Panel for Early Detection, Management, and Risk Stratification in the West Virginian Population. International journal of medical sciences. 2016;13(1):25-38. PubMed PMID: 26816492. Pubmed Central PMCID: 4716817. 139. Schett G, Dayer JM, Manger B. Interleukin-1 function and role in rheumatic disease. Nature reviews Rheumatology. 2016 Jan;12(1):14-24. PubMed PMID: 26656658. 140. Sarvari AK, Doan-Xuan QM, Bacso Z, Csomos I, Balajthy Z, Fesus L. Interaction of differentiated human adipocytes with macrophages leads to trogocytosis and selective IL-6 secretion. Cell death & disease. 2015;6:e1613. PubMed PMID: 25611388. Pubmed Central PMCID: 4669775. 141. Pahl H. Activators and target genes of Rel/NF-kB transcription factors. Oncogene. 1999;18:6853-66. 142. Valentova M, von Haehling S, Doehner W, Murin J, Anker SD, Sandek A. Liver dysfunction and its nutritional implications in heart failure. Nutrition. 2013 Feb;29(2):370-8. PubMed PMID: 23022119. 143. Devisscher L, Verhelst X, Colle I, Van Vlierberghe H, Geerts A. The role of macrophages in obesity-driven chronic liver disease. Journal of leukocyte biology. 2016 May;99(5):693-8. PubMed PMID: 26936934. 144. Barnett RE, Conklin DJ, Ryan L, Keskey RC, Ramjee V, Sepulveda EA, et al. Anti-inflammatory effects of miR-21 in the macrophage response to peritonitis. Journal of leukocyte biology. 2016 Feb;99(2):361-71. PubMed PMID: 26382295. 145. Ferracin M, Lupini L, Salamon I, Saccenti E, Zanzi M, Rocchi A, et al. Absolute quantification of cell-free microRNAs in cancer patients. Oncotarget. 2015;6(16):14545-54. 146. Clancy C, Joyce MR, Kerin MJ. The use of circulating microRNAs as diagnostic biomarkers in colorectal cancer. Cancer biomarkers : section A of Disease markers. 2015;15(2):103-13. PubMed PMID: 25547322. 147. Deng J, Grande F, Neamati N. Small Molecule Inhibitors of Stat3 Signaling Pathway. Current Cancer Drug Targets. 2007;7:91-107.

91
APPENDIX
A - FREE AND INFORMED CONSENT FORM
Final Version 11.04.2014
FREE AND INFORMED CONSENT FORM (originally in portuguese)
Study: Role of adipose tissue microRNAs in the development and maintenance of cancer
cachexia
You are invited (a) to participate in the research project mentioned above. The document below contains all the necessary information about the research we are doing. Your cooperation in this study will be of great importance to us, and if you want to quit at any time, this will not cause any harm to you. I, (insert the name, sex, occupation, address and phone number) ____________________________________________________________________________________________________________________________________________________________________________________, Identity Card, nº ______________________, and CPF / MF ________________________________ born (a) on _____ / _____ / _______, agree to the free will to participate as a volunteer (a) of the study "Role of adipose tissue microRNAs in the development and maintenance of cancer cachexia. " I declare that I obtained all necessary information as well as all possible clarification to my questions and that I will receive an identical copy of this Free Consent form. I am aware that: I) The study is necessary to investigate the possible causes of cachexia, characterized by severe weight loss, muscle atrophy, fatigue, weakness and decreased appetite; we have to verify whether cachexia affects the microstructures of the liver and also checking the hepatic metabolism; II) If the patient agreed to participate in this research and depending on each surgical procedure performed, fragments may be removed about one gram per tissue, with a total collection time of about 5 minutes. This procedure has a minimum degree of risk and does not interfere with the standard operation procedures. But if there are complications with the research participant arising from the research, these will be treated at the HU / USP (secondary care hospital). The collected material is important for the understanding of the etiology of cachexia; Patient or legal responsible ________ Study responsible________
92
III) I agree that a collection of 20 mL of blood in control and cancer patients may be performed (except liver cancer), for plasma and serum parameters analysis. The collection will be performed by a qualified health professional. ( ) Yes or ( ) no IV) These samples (blood and tissue) will be held only for this study and or other projects (future research) and the procedures were authorized by the Ethics Committee of the Institute, with no influence on the treatment and not modifying the anesthetic and surgical procedure; V) The procedures will not heal me, will not cause me any trouble or pain at the time of collection; VI) Participation in this project has no order to submit me to any treatment and will not cause me any financial expenses in relation to medical, clinical and therapeutic procedures; VII) I have the free will to give up or stop the cooperation in this study when Iwant, without any explanation; VIII) The withdrawal will not cause any damage to my health or physical well-being and will not interfere with care or medical treatment; IX) The results obtained during this study will be kept confidential, but I agree that they may be published in scientific journals, since my personal data are not mentioned; X) I agree that the material and the data collected by me and the analysis results obtained by the researchers could be used in other projects (future research) as long as authorized by the Ethics Committee of the Institute; ( ) Yes or ( ) no XI) I agree that after the material is collected and stored in specific solutions for each technique, it will be packaged in freezer at -80 ° to maintain tissue integrity, for later use; ( ) Yes or ( ) no XII) I agree that after the material is used for research purposes and the objectives are achieved, the rest will be incinerated on adequate site for disposal of human biological material, as stated in the resolutions of the National Health Council (CNS); ( ) Yes or ( ) no XIII) If I want, I can personally take note of the results at the end of this research which will have a duration of 12-18 months; ( ) I wish to be aware of the results of this research. ( ) I Dd not wish to know the results of this research.
Patient or legal responsible ________ Study responsible________

93
XIV) Concerning the special thematic area of this project to be developed at the Institute of Biomedical Sciences - ICB / USP / São Paulo, it has been signed an agreement between the universities and their researchers: Giorgio Trinchieri and Romina Goldzmid (National Institute of Health - NIH); JOSEP Argilés and Silvia Busquets (University of Barcelona); Alessandro Laviano and Maurizio Muscaritoli (University La Sapienza UniRoma); Gerhard Püschel and Tiziana Magaria (University of Potsdam); Stephen Farmer (Boston University); Marilia Cerqueira Leite Seelaender, Alison Colquhoun and José Cezar Rosa Neto (ICB / USP); Paulo Sergio Alcantara, Linda Maximiniano, Oscar Fujita, Claudio Campi and Emerson Muller (HU / USP); José Piñata Otoch and Busatto Geraldo Filho (USP); Emerson Franchini (EEFE / USP); Renata Wassermann (IME / USP); Claudia Oller do Nascimento and Lila Missaie Oyama (UNIFESP); and Miguel Batista Junior (UMC - University of Mogi das Cruzes). "I DECLARE THAT, AFTER CONVENIENTLY ENLIGHTENED BY THE RESEARCHER AND UNDERSTANDING WHAT HAVE BEEN EXPLAINED TO ME, I AGREE TO PARTICIPATE IN THIS RESEARCH."
Sao Paulo, _______ of____________________of 20____
( ) Patient / ( ) responsible ........................................... .............................................
Witness 1: ___________________________________________________ Name / RG / Phone:
Witness 2: ___________________________________________________ Name / RG / Phone:
Responsible for the Project: ____________________________________________________ Prof. Dr. Marilia Cerqueira Leite Seelaender
Biomedical Sciences Institute Contact Phone: 3091-7225
ID CEP-HU: Address: Av. Lineu Prestes, 2565 - University City ZIP: 05508-000 - São Paulo - SP
Phone number: 3091-9457 - Fax: 3091-9479 - E-mail: [email protected]
94
SUPPLEMENTARY MATERIAL
A - U937 cell culture experiment - buffers and Solutions
The buffers and solutions were, unless otherwise specified, sterile filtered through a 0.2-
micron filter and stored in autoclaved glass bottles at 4°C. H2O always refers to autoclaved
ultrapure water.
Cell culture Medium I:
Inactivated FCS 10% 100 ml
Penicilin / Streptomicin 1% 1 ml
RPMI 1640 add to 1000 ml
Cell culture Medium II (“Serum free medium”)
Inactivated FCS 0.5% 5 ml
Penicilin / Streptomicin 1% 1 ml
RPMI 1640 add to 1000 ml
Penicillin / streptomycin
The solution was already obtained as a mixture of penicillin (10,000 U) and streptomycin
(10,000 ug/ml). It was then stored in 10 ml-aliquots at -20 °C. The cell culture media were
always prepared with 1% of this mixture, by adding 100 U penicillin and 100 ug/ml
streptomycin.
Insulin stock solution (10 µM)
Insulin 10 uM 2.9 mg
BSA 0.1% (w/v) 50 mg
0.9% (w / v) NaCl solution add to 50 ml
Insulin was dissolved at pH 3.0 in 20 ml of 0.9% (w/v) NaCl solution and the pH adjusted with
NaOH to pH 7.4 and then BSA was added. When filling the solution up to 50ml, the pH was
controlled. The solution was stored in aliquots at -20 °C.

95
LPS stock solution (5mg/ml)
E.coli Serotype 0127:B8
Stock 5 mg/ml in H2O
In medium diluted to 100 ng/ml
PMA stock solution (100 µg/ml in 100% ethanol)
In medium diluted to 100 ng/ml
B - Rat primary hepatocytes experiment - buffers and Solutions
The buffers and solutions were, unless otherwise specified, sterile filtered through a 0.2-
micron-filter and stored in autoclaved glass bottles at 4 °C. H2O always refers to autoclaved
ultrapure water.
Perfusion buffer stock solution (10x)
NaCl 1400 mM 81.820g
KCl 50 mM 3.728 g
MgCl2 x 6 H2O 8 mM 1.626 g
Na2HPO4 x 2 H2O 16 mM 2.848 g
KH2PO4 4 mM 0.544 g
add H2O 1000 ml
The pH of the solution was adjusted with HCl to pH 7.4.
NaHCO3 solution (1 M)
NaHCO3 1 M 8.4 g
add H2O to 100 ml
The solution was stored at room temperature.
EDTA solution (0.5 M)
EDTA 0.5 M 14.61 g

96
add H2O to 100 ml
The pH of the solution was adjusted with NaOH to pH 8.0.
Glucose stock solution (2 M)
D-glucose x H2O 2 M 39.63g
add H2O to 100ml
Lactate solution (0.5 M)
Lactate syrup (60% (w/w)) 0.5 M 7 ml
add H2O to 100 ml
Pyruvate stock solution (200 mM)
Pyruvate 200 mM 2.2 g
add H2O to 100 ml
Calcium chloride solution (2 M)
CaCl2 2 M 29.4 g
add H2O to 100 ml
Perfusion’s Buffer
Perfusion-Standard solution (Stocksol - 10x) 1x 100 ml
NaHCO3 25 mM 25 ml 1 M Stock
EDTA 2 mM 4 ml 0.5 M Stock
Glucose 15 mM 7.5 ml 2 M Stock
Lactate 2 mM 4 ml 0.5 M Stock
Pyruvate 0.2 mM 1 ml 200 mM Stock
add H2O 1000 ml
The medium was incubated at 37 °C for 45 min with carbogen [95% O2, 5% CO2, (19: 1)].
Then, the pH was adjusted with 1 N HCl to pH 7.4.
Wash buffer
Perfusion- Stdsol. (10x) 1x 50 ml
97
CaCl2 x H2O 1 mM 250 ul 2 M
add H2O to 500 ml
The medium was heated at 37 °C for 45 min. Then, the pH was adjusted with 1N HCl to pH
7.4.
Percoll density gradient
Perfusion-Standard solution (Stocksol - 10x) 1x 4.2 ml
Percoll 27.8 ml
The Percoll density gradient was heated to 37 °C.
Physiological sodium chloride solution
NaCl 0.9% (w/v) 9 g
add H2O to 1000 ml
The solution was not sterile filtered.
Medium 199 (M199)
Powder medium M199 with Earle's salts without NaHCO3 9.77 g
D-glucose x H2O 5.5 mM 1.10 g
HEPES 15 mM 3.57 g
NaHCO3 18 mM 1.51 g
BSA 0.2% (w/v) 2.00 g
add H2O to 1000 ml
The medium was equilibrated with carbogen [95% O2, 5% CO2, (19: 1)] and the pH adjusted
with HCl to pH 7.4. Medium 199 contained a total of 10 mM glucose.
Insulin stock solution (10 µM)
Insulin 10 µM 2.9 mg
BSA 0.1% (w/v) 50.0 mg
0.9% (w/v) NaCl solution add to 50 ml
Insulin was dissolved at pH 3.0 in 20 ml of 0.9% (w/v) NaCl solution and the pH adjusted with

98
NaOH to 7.4 and then BSA was added. When filling the solution up to 50 ml, the pH was
controlled. The solution was stored in aliquots at -20 °C.
Dexamethasone stock solution (100 µM)
Dexamethasone 100 µM 2.0 mg
Ethanol p.a. 0.3% (v/v) 150 µl
0.9% (w/v) NaCl solution add to 50 ml
Dexamethasone was initially dissolved in ethanol p.a. and then treated with 0.9% (w/v) NaCl
diluted solution. The solution was stored in aliquots at -20 °C.
Penicillin / streptomycin
The solution was already obtained as a mixture of penicillin (10,000 U) and streptomycin
(10,000 µg/ml). It was then stored in 10 ml-aliquots at -20 °C. The cell culture media were
always prepared with 1% of this mixture, by adding 100U penicillin and 100 ug/ml
streptomycin.
M199 culture medium I
NCS 4% (v/v) 4 ml
Penicillin / Streptomycin 1% (v/v) 1 ml
Dexamethasone 100 nM 100 µl 100 µM Stock
Insulin 0.5 nM 5 µl 10 µM Stock
Medium 199 add to 100 ml
The medium was heated to 37 °C.
M199 culture medium II
Penicillin / Streptomycin 1% (v/v) 1 ml
Dexamethasone 100 nM 100 µl 100 µM Stock
Insulin 0.5 nM 5 µl 10 µM Stock
Medium 199 add to 100 ml
The medium was heated to 37 °C.
99
C - U937 macrophages and rat primary hepatocytes protein expression analysis by Western blot - Buffers and solutions
If not otherwise stated, the solutions were stored at room temperature.
Protease inhibitors (x 1000)
Pefablock 200 mM 47.9 mg
Leupeptin 1% (w/v) 10 mg
Trypsin inhibitor 1% (w/v) 10 mg
Each protease inhibitor was dissolved in 1 ml H2O and aliquots stored at -20 °C.
Sodium orthovanadate (tyrosine phosphatase inhibitor)
Na3VO4 200 mM 36.8 mg
add H2O to 1 ml
The pH of the solution was adjusted with NaOH to pH 10.0. The activation was performed by
heating the solution to boiling temperature and cooled until its color changed from yellow to
colorless. The solution was aliquoted and stored at -20 °C.
Lysis buffer for Western Blot
Tris / HCl (pH 7.5) 20 mM 4 ml of 1 M Stock
NaCl 150 mM 1.752 g
EDTA 1 mM 400 µl 0.5 M Stock
EGTA 1 mM 76 mg
Triton X-100 1% (v/v) 2 ml
Sodium pyrophosphate 2.5 mM 233 mg
β-glycerol phosphate 1 mM 43 mg
NaF 50 mM 420 mg
add H2O to 200 ml
The pH of the solution was adjusted with 1 N HCl or 1 M NaOH to pH 7.5. The solution was
stored at 4 °C.
Immediately before use, per ml of lysis buffer was freshly added:

100
Pefablock 200 µM 1 µl 200 mM Stock
Leupeptin 10 µg/ml 1 µl 10 mg/ml Stock
Trypsin inhibitor 10 µg/ml 1 µl 10 mg/ml Stock
Na3VO4 1 mM 5 µl 200 mM Stock
Bradford reagent
Serva Blue (Nr.35050) 0.01% (w/v) 100 mg
Ethanol (95%) 4.75% (v/v) 50 ml
Phosphoric acid (85%) 8.5% (v/v) 100 ml
add H2O to 1000 ml
The solution was filtered through a filter and stored at room temperature.
BSA standard solution (1 mg/ml)
BSA 1 mg/ml 10 mg
add H2O to 10 ml
The solution was aliquoted and stored at -20 °C.
5x SDS sample buffer
Tris / HCl (pH 7.5) 400 mM 2.5 ml 1 M Stock
SDS 10% (w/v) 50 ml 20% (w/v) Stock
Glycerol 25% (w/v) 28.74 ml 87% (w/v) Stock
Bromophenol blue 0.0125% (w/v) 125 mg
add H2O to 100 ml
Sample buffer
5 x SDS sample buffer 4 x 800 µl
β-mercaptoethanol 20% 200 µl
The solution was freshly prepared.
Acrylamide solution (30% (w/v))
The solution was purchased ready-to-use by the company Roth and stored at 4 °C.

101
Resolving gel buffer
Tris 1.5 M 18.17 g
SDS 0.4% (w/v) 4 ml of 10% (w/v) Stock
H2O to 100 ml
The pH of the solution was adjusted with HCl to pH 8.8. The solution was stored at 4 °C.
Stacking gel buffer
Tris 0.5 M 50 ml 1 M Stock
SDS 0.4% (w/v) 4 ml of 10% (w/v) Stock
add H2O to 100 ml
The pH of the solution was adjusted with HCl to pH 6.8. The solution was stored at 4 °C.
APS solution (10% (w/v))
APS 10% (w/v) 10 g
add H2O to 100 ml
The solution was stored at 4°C.
10 x SDS electrophoresis running buffer
Tris 250 mM 30.3 g
Glycine 1.91 M 144.1 g
SDS 1% (w/v) 100 ml 10% (w/v) Stock
add H2O to 1000 ml
1x SDS electrophoresis running buffer
10x SDS electrophoresis running buffer 1x 100 ml
add H2O to 1000 ml
Transferbuffer A
Tris 300 mM 300 ml 1 M Stock
SDS 0.1% (w/v) 10 ml 10% (w/v) Stock
Methanol 20% (v/v) 200 ml
add H2O to 1000 ml
102
The pH of the solution was adjusted with NaOH to pH 11.5.
Transferbuffer B
Tris 2 mM 25 ml 1 M Stock
SDS 0.1% (w/v) 10 ml 10% (w/v) Stock
Methanol 20% (v/v) 200 ml
add H2O to 100 ml
The pH of the solution was adjusted with NaOH to pH 10.5.
Transferbuffer C
Tris 25 mM 25 ml 1 M Stock
SDS 0.1% (w/v) 10 ml 10% (w/v) Stock
Methanol 20% (v/v) 200 ml
add H2O to 1000 ml
The pH of the solution was adjusted with 1 M boric acid to pH 9.0.
10x TBS buffer
Tris 0.20 M 24.2 g
NaCl 1.36 M 80.0 g
add H2O to 1000 ml
The pH of the solution was adjusted with HCl to pH 7.6.
Tween-Stocksolution (20% (v/v))
Tween 20% (v/v) 20 ml
add H2O to 100 ml
TBS / Tween buffer
10x TBS buffer 1x 100 ml
Tween 0.1% (v/v) 5 ml 20% (v/v) Stock
add H2O to 1000 ml
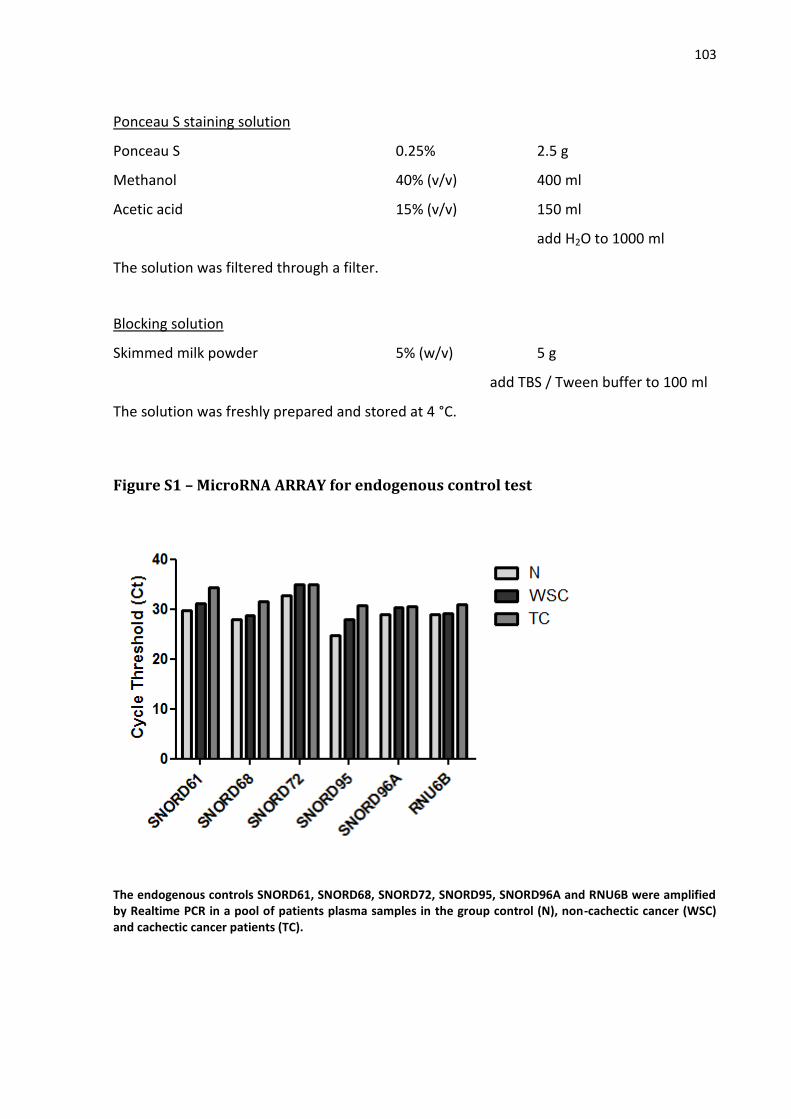
103
Ponceau S staining solution
Ponceau S 0.25% 2.5 g
Methanol 40% (v/v) 400 ml
Acetic acid 15% (v/v) 150 ml
add H2O to 1000 ml
The solution was filtered through a filter.
Blocking solution
Skimmed milk powder 5% (w/v) 5 g
add TBS / Tween buffer to 100 ml
The solution was freshly prepared and stored at 4 °C.
Figure S1 – MicroRNA ARRAY for endogenous control test
The endogenous controls SNORD61, SNORD68, SNORD72, SNORD95, SNORD96A and RNU6B were amplified by Realtime PCR in a pool of patients plasma samples in the group control (N), non-cachectic cancer (WSC) and cachectic cancer patients (TC).
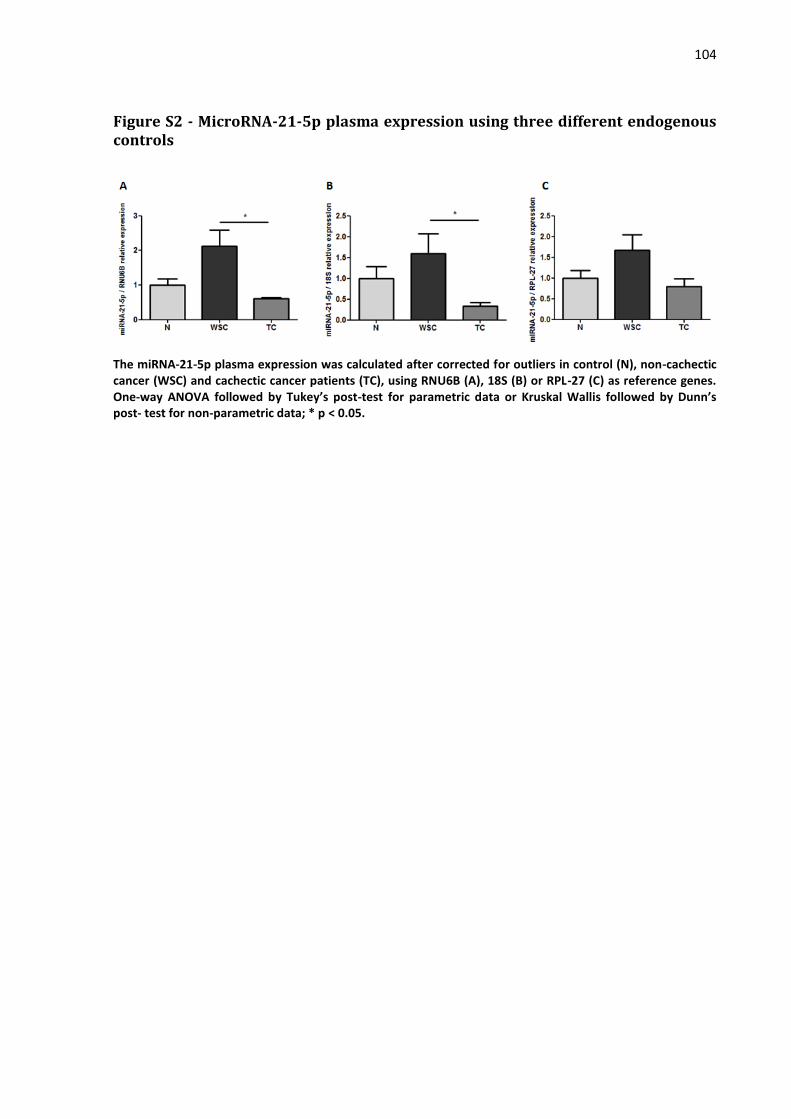
104
Figure S2 - MicroRNA-21-5p plasma expression using three different endogenous controls
The miRNA-21-5p plasma expression was calculated after corrected for outliers in control (N), non-cachectic cancer (WSC) and cachectic cancer patients (TC), using RNU6B (A), 18S (B) or RPL-27 (C) as reference genes. One-way ANOVA followed by Tukey’s post-test for parametric data or Kruskal Wallis followed by Dunn’s post- test for non-parametric data; * p < 0.05.