insulin therapy in type 2 diabetes - helsinki
TRANSCRIPT

INSULIN THERAPY IN TYPE 2 DIABETES
InItIatIon, Impact on lIver fat,role of combInatIon therapy wIth
glItazones or glInIdes
Leena Juurinen
ACADEMIC DISSERTATION
To be presented with the permission of the Faculty of Medicine of the University of Helsinki, for public examination in Lecture Hall 4,
University Hospital Helsinki, Haartmanninkatu 4, on May 16th 2014, at 12 o`clock.
Helsinki 2014
Minerva Foundation Institute for Medical Research
University of HelsinkiFaculty of Medicine
Department of MedicineDivision of Diabetes
Väitöskirja_Juurinen_sisustaitto.indd 1 21.4.2014 21:51:27
supervIsor Professor Hannele Yki-Järvinen, MD, FRCP Department of Medicine Division of Diabetes Helsinki University Hospital University of Helsinki Helsinki, Finland
revIewers Docent Saara Metso, MD, PhD Unit of Endocrinology, Department of Internal Medicine Tampere University Hospital and Medical School, University of Tampere Tampere, Finland
and
Professor Jussi Pihlajamäki, MD, PhD Department of Public Health and Clinical Nutrition University of Eastern Finland Department of Clinical Nutrition and Obesity Center Kuopio University Hospital Kuopio, Finland
offIcIal opponent Docent Kirsi A. Virtanen, MD, PhD Turku PET Centre Turku University Hospital University of Turku Turku, Finland
ISBN 978-952-10-9874-1ISBN 978-952-10-9875-8 (PDF)Http://ethesis.helsinki.fi
UnigrafiaHelsinki 2014
Väitöskirja_Juurinen_sisustaitto.indd 2 21.4.2014 21:51:27
3
ABSTRACT
aIms
The overall aims of the present studies were to understand the role of the liver in regulating the response to anti-hyperglycemic treatment, and to find ways to optimize basal insulin therapy in patients with type 2 diabetes. Specifically, we determined whether i) insulin therapy changes liver fat content (LFAT) or hepatic insulin sensitivity (I), ii) a peroxisome proliferator-activated receptor gamma (PPARγ) agonist decreases insulin requirements, hepatic insulin resistance and LFAT in patients using high doses of insulin (II), iii) adding nateglinide decreases postprandial glucose excursions (PPGEs) in patients treated with the combination of basal insulin and metformin (MET) (III), iv) insulin can be started in groups as well as individually (IV).
subject and methods
In study I, 14 patients with type 2 diabetes treated with MET alone received additional basal insulin for 7 months. Liver fat content (by proton magnetic resonance spectros-copy, 1H-MRS), fat distribution (magnetic resonance imaging, MRI), fat-free mass and fat mass, whole body and hepatic insulin sensitivity (6-h euglycemic hyperinsulinemic clamp combined with infusion of [3-3H]-glucose), and substrate oxidation rates (indi-rect calorimetry) were measured. In study II, we determined the effect of the PPARγ agonist rosiglitazone (8 mg/d) for 8 months on liver fat and directly measured hepatic insulin sensitivity in 14 patients with type 2 diabetes, who were poorly controlled, i.e. HbA1c (8.9 ± 0.4%) despite using high doses of insulin (1.98 ± 0.2 IU/kg) in combina-tion with MET. In study I and II, liver fat content (1H-MRS), hepatic insulin sensitivity [6 h hyperinsulinemic euglycemic clamp (insulin 0.3 mU/kg∙min) combined with infu-sion of [3-3H]-glucose], body composition (MRI), substrate oxidation rates (indirect calorimetry), clinical parameters, and liver enzymes were measured before and after additional basal insulin (I) and rosiglitazone treatment (II). Study III was an inves-tigator-initiated, double-blind, randomized, parallel-group study in the five centers. Patients with type 2 diabetes (n = 88, age 56.0 ± 0.9 years, duration of diabetes 9.4 ± 0.5 years, HbA1c 7.8 ± 0.1 %) treated with basal insulin and MET entered a 24-week period, during which basal insulin was titrated to optimize glucose control. Thereafter, the patients were randomized to receive either nateglinide (120 mg three times daily) or placebo for 24 weeks HbA1c, the episodes of hypoglycemia, diurnal glucose pro-files and postprandial glucose excursions were recorded. Study IV was a randomized (1:1), multicenter, two-arm, parallel design study with 3 to 14-week run-in phase and
Väitöskirja_Juurinen_sisustaitto.indd 3 21.4.2014 21:51:27
4
a 24-week treatment period. 121 insulin-naive type 2 diabetic patients with an HbA1c of 7.0–12.0 % were randomized to initiate bedtime insulin glargine either in groups of 4–8 or individually, using the same personnel and education program. The patients visited the treatment center before and at the time of insulin initiation and at 6, 12, and 24 weeks. Patients self-adjusted the insulin dose to achieve a fasting plasma glucose target of 4.0–5.5 mmol/l. Glycemic control, the episodes of hypoglycemia, treatment satisfaction, and time spent on patient education were measured.
resultsInsulin therapy decreased significantly LFAT (-20 %), and enhanced hepatic insulin sensitivity. Insulin requirements correlated with LFAT. The change in LFAT was sig-nificantly correlated with that in hepatic insulin sensitivity. Rosiglitazone significantly improved glycemic control, decreased liver fat (by 46 %) and insulin requirements (by 41 %), and enhanced hepatic insulin sensitivity. The change in liver fat correlated with the decrease in HbA1c, and improvement in hepatic insulin sensitivity. Nateglinide added to basal insulin and MET slightly but significantly decreased HbA1c due to a decrease in postprandial glucose as compared to placebo. In the study comparing methods to initiate basal insulin, HbA1c decreased from 8.7 ± 0.2 to 6.9 ± 0.1 % in those starting insulin therapy individually and from 8.8 ± 0.2 to 6.8 ± 0.1 % in those starting insulin in groups (not significant [NS]). Insulin doses averaged 62 ± 5 IU and 56 ± 5 IU at 24 weeks (NS), respectively. The frequency of hypoglycemia was similar in booth groups. The total time (visits and phone calls) spent in initiating insulin in groups was 48 % less than in those treated individually. Diabetes treatment satisfaction improved similarly in both groups.
conclusIonsIn conclusion, insulin therapy has favorable effects on the liver as it improves hepatic insulin sensitivity and significantly reduces liver fat content. Rosiglitazone decreases liver fat content and enhances hepatic insulin sensitivity. Addition of a short-acting insulin secretagogue slightly but significantly improves postprandial hyperglycemia during combination therapy with basal insulin and MET. Similar glycemic control and treatment satisfaction can be achieved by initiating insulin in groups and individually but initiation in groups takes half as much time as individual initiation.
Väitöskirja_Juurinen_sisustaitto.indd 4 21.4.2014 21:51:28

CoNTENTS
abstract .......................................................................................................................... 3
lIst of orIgInal publIcatIons ...…………………………….........……………... 7
abbrevIatIons …………………………………………………………………...................... 8
1. IntroductIon ........................................................................................................ 10
2. revIew of the lIterature ………………………………............................ 12
2.1. PATHOGENESIS OF TYPE 2 DIABETES ……………………………….......... 12
2.1.1. Insulin resistance, the MetS and NAFLD …………….............. 12 Definitions ...................................................................................... 12
Methods to measure insulin sensitivity ………………………. 12 Insulin resistance in the liver ……………………………………… 13
Regulation of liver fat in humans ……………………………………… 14 Insulin resistance in adipose tissue ............................... 15 Insulin resistance in skeletal muscle ............................... 16 Defects of insulin action in other tissues ……………………….. 16 2.1.2. Defects in insulin secretion ……………………………………… 17
2.2. TREATMENT OF HYPERGLYCEMIA IN TYPE 2 DIABETES ………... 17 Treatment targets and effects of insulin therapy on
micro- and macrovascular disease ……………………………………… 17 2.2.1. Weight loss and exercise …………………………………....... 17 2.2.2. Oral agents and GLP-1-analogues ................................................. 18
Metformin ……………………………………........................................ 18
Sulfonylureas ………………………………………………………………....... 18
Glinides …………………………………………................................. 19
Glitazones ………………………………………..................................... 19 DPP-4- inhibitors ................................................................... 20
GLP-1 - analogues ……………………………………………............ 20 SGLT-inhibitors …………………………………………………………….......... 21
2.2.3. Insulin ....................................................................................................... 22
Choice of the insulin regimen ……………………………………… 22
Practical aspects of initiation of insulin therapy .………. 24
3. aIms of the study …………………………………………………………….......... 25
Väitöskirja_Juurinen_sisustaitto.indd 5 21.4.2014 21:51:28

4. subjects and study desIgn ................................................................... 26
4.1 Subjects ..................................................................................... 26 4.2 Study designs ........................................................................................................ 27
5. methods ............................................................................................................ 31
5.1. Hepatic insulin sensitivity (I, II) ………………………...................................... 31
5.2. Liver fat content (I, II) ………………………………………………………….............. 32
5.3 Measures of body composition (I, II) ……………................................. 33 5.4 Measurements of substrate oxidation rates (I, II) …………………........ 33
5.5 Transthoracic echocardiography (II) ……………………….................... 34
5.6 Optimization of insulin therapy (III, IV) …………………………………....... 34
5.7. Analytical procedures …………………………………………….............................. 35 5.8. Statistical analyses ……………………………………........................................ 36
6. results ............................................................................................................ 38
6.1. Effect of insulin therapy on liver fat content and hepatic insulin sensitivity in patients with type 2 diabetes (I) …………………….... 38
6.2. Liver fat content and hepatic insulin sensitivity after combination of rosiglitazone to metformin and insulin therapy (II) ............................... 43
6.3. Postprandial hyperglycemia after combination of nateglinide to metformin and insulin therapy (III) ………………………………............................ 44
6.4. Initiation of insulin therapy individually or in groups (IV) ……...... 48
7. dIscussIon ……………………………………………………………………................... 51
8. summary and conclusIons ...................................…...………………...... 56
9. acKnowledgements ..................................................................................... 57
10. references …………………………………………………………................................ 59
orIgInal publIcatIons ..................................................................................... 74
Väitöskirja_Juurinen_sisustaitto.indd 6 21.4.2014 21:51:28

7
LIST oF oRIGINAL PUBLICATIoNS
thIs thesIs Is based on the followIng publIcatIons, whIch are referred to the text by theIr roman numerals.
I Juurinen Leena, Tiikkainen Mirja, Häkkinen Anna-Maija, Hakkarainen Antti, Yki-Järvinen Hannele effects of insulin therapy on liver fat content and hepatic insulin sensitivity in patients with type 2 diabetes. American Journal of Physiology, Endocrinology and Metabolism 292: E829–E835, 2007. II Juurinen Leena, Kotronen Anna, Granér Marit, Yki-Järvinen Hannele rosiglitazone reduces liver fat and insulin requirements and improves hepatic insulin sensitivity and glycemic control in patients with type 2 diabetes requiring high insulin doses. Journal of Clinical Endocrinology and Metabolism 93: 118–124, 2008. III Juurinen Leena, Tiikkainen Mirja, Saltevo Juha, Nikkilä Katriina, Lanki, Helena, Leppävuori Eeva, Kock Tuula, Teikari-Myyrä Tarja, Kauppinen-Mäkelin Ritva, Kotronen Anna, Yki-Järvinen Hannele nateglinide combination therapy with basal insulin and metformin in patients with type 2 diabetes. Diabetic Medicine 26: 409–415, 2009. Iv Yki-Järvinen Hannele, Juurinen Leena, Alvarsson Michael, Bystedt Tord, Caldwell Ian, Davies Melanie, Lahdenperä Sanni, Nijpels Gil, Vähätalo Markku Initiate Insulin by aggressive titration and education (InItIate): a randomized study to compare initiation of insulin combination therapy in type 2 diabetic patients individually and in groups. Diabetes Care 30: 1364–1369, 2007.
Publication II has also been included in the doctoral thesis of Anna Kotronen entitled
liver fat in the metabolic syndrome and type 2 diabetes, University of Helsinki, 2008.
Väitöskirja_Juurinen_sisustaitto.indd 7 21.4.2014 21:51:28
INSULIN THERAPY IN TYPE 2 DIABETES
8
ABBREVIATIoNS
ALP alkaline phosphataseALT alanine aminotransferaseAST aspartate aminotransferaseANOVA analysis of variance BMI body mass index CoA coenzyme A DAG diacylglycerol DNL de novo lipogenesis DPP-4 Dipeptidyl peptidase-4 DQTS diabetes treatment satisfaction questionnaire EGP endogenous glucose production FDG fluorodeoxyglucose FFA free fatty acids fm fat mass ffm fat free mass FPI fasting plasma insulin fP fasting plasma FPG fasting plasma glucose fS fasting serum GAD glutamic acid decarboxylase GLP-1 glucagon like peptide-1 GLUT4 glucose transporter 4 GCP good clinical practice HDL high density lipoprotein HbA1c glycosylated hemoglobin A1c HGP hepatic glucose production 1H-MRS proton magnetic resonance spectroscopy HOMA-IR homeostasis model assessment of insulin resistance IA intra-abdominal IFG impaired fasting glucose IGT impaired glucose tolerance IMCL intramyocellular lipid IR insulin resistance LDL low density lipoprotein LFAT liver fat LPL lipoprotein lipase MET metformin
Väitöskirja_Juurinen_sisustaitto.indd 8 21.4.2014 21:51:28

9
Mets metabolic syndrome MRI magnetic resonance imaging MRS magnetic resonance spectroscopy NAFLD non-alcoholic fatty liver disease NASH non-alcoholic steatohepatitis NEFA non-esterified fatty acid NPH neutral protamine Hagedorn NS not significant OAD oral antidiabetic drug(s) OGTT oral glucose tolerance test PAI-1 plasminogen activator inhibitor 1 PET positron emission tomography PKC protein kinase C PPGE postprandial glucose excursion ppm parts per million PPARγ peroxisome proliferator-activated receptor gamma QUICKI quantitative insulin sensitivity check index Ra rate of appearance Rd rate of disappearance S serum SA specific activity SAT subcutaneous adipose tissue SC subcutaneous SEM standard error of mean SU sulphonylurea TZD thiazolidinedione(s) TAG triacylglycerol(s) TG triglycerides VAT visceral adipose tissue VLDL very low density lipoprotein WHR waist to hip ratio wks weeks
Väitöskirja_Juurinen_sisustaitto.indd 9 21.4.2014 21:51:28

INSULIN THERAPY IN TYPE 2 DIABETES
10
1. INTRoDUCTIoN
Increased fat accumulation in the liver due to non-alcoholic fatty liver disease (NAFLD) is a key feature of the insulin resistance/metabolic syndrome and the most common cause of elevated liver enzymes (1). The liver is the source of glucose and triglycerides (TG), two of the key components of the metabolic syndrome (MetS). The liver, once fatty, becomes resistant to the normal actions of insulin to inhibit the production of glucose and VLDL (2), (3). This leads to hyperglycemia and stimulation of insulin secretion as well as hypertriglyceridemia (2), (4).
Achievement of good glycemic control is a major challenge in the clinic in patients with type 2 diabetes. In Finland it has been estimated that less than 25 % of type 2 diabetic patients achieve the average HbA1c target of 7.0 % often regarded as the goal in treating hyperglycemia (5), (6). This is also true even if insulin therapy is used to control glycemia. One possible reason for this failure is fat accumulation in the liver due to NAFLD. Consistent with the knowledge that the fatty liver is insulin resistant in type 2 diabetes, the amount of insulin needed depends on the amount of fat in the liver (7), (8). However, insulin also directly stimulates lipogenesis in the liver (9) raising the possibility that insulin therapy actually worsens hepatic insulin resistance by increasing liver fat content. Therefore we determined the effect of insulin therapy on hepatic insulin sensitivity and liver fat content.
PPARγ-agonists such as rosiglitazone and pioglitazone increase hepatic insulin sensitivity and lower liver fat content when given as monotherapy to patients with type 2 diabetes (10), (11). In the present study, we examined these drugs are helpful in improving glycemic control particularly in patients who have a high liver fat content and high insulin requirements.
Basal insulin combination therapy is recommended as the regimen of choice in initiating insulin therapy in patients with type 2 diabetes poorly controlled on oral agents alone (6). Although the treatment target of 7.0% can on the average be achieved with basal insulin (12), (13) some patients have residual postprandial hyperglycemia. A possible option is to treat postprandial hyperglycemia with short-acting insulin regimens, dipeptidyl peptidase-4 (DPP-4)-inhibitors, glucagon like peptide-1 (GLP-1)-analogues, or glinides. Nateglinide is a derivate of meglitinide, which stimulates insulin secretion (14). In the present study, we examined whether this drug improves postprandial hyperglycemia also when added to basal insulin therapy.
Although basal insulin therapy is a simple and effective way in initiating insulin therapy on an out-patient basis (15), it nevertheless requires a nurse to teach basic skills such as measurement of fasting glucose concentrations and injection of insulin. This is time-consuming and perhaps limits initiation of insulin therapy. There is thus a need to develop new ways to ease the transition from oral agents to insulin.
Väitöskirja_Juurinen_sisustaitto.indd 10 21.4.2014 21:51:28

11
The present series of studies were undertaken to improve treatment of type 2 diabetic patients. We examined the effect of insulin and rosiglitazone on hepatic insulin sensitivity and liver fat content and the effect of adding nateglinide on postprandial glycemia in patients treated with basal insulin combined with metformin. We also studied whether the patient education how to start basal insulin therapy can be carried out in patient groups as well as individually.
Väitöskirja_Juurinen_sisustaitto.indd 11 21.4.2014 21:51:28

INSULIN THERAPY IN TYPE 2 DIABETES
12
2. REVIEW oF THE LITERATURE
2.1. pathogenesIs of type 2 dIabetes
2.1.1. InsulIn resIstance, the mets and nafld
defInItIons
Insulin resistance is defined as the inability of insulin to produce its biological actions at circulating concentrations that are effective in normal subjects (16). Insulin resis-tance may involve any of the metabolic actions of insulin, a cluster of metabolic and cardiovascular risk factors. The most recent criteria for diagnosis of the MetS are as follows: the presence of any three of the following five risk factors: waist circumfer-ence ≥80 cm in women and ≥94 cm in men, fasting glucose ≥5.6 mmol/l or drug treatment for hyperglycemia, fS-TG ≥1.7 mmol/l or drug treatment for hypertriglyceri-demia, HDL-cholesterol <1.3 mmol/l, women and <1.0 mmol/l, men or drug treatment for low HDL-cholesterol, systolic blood pressure ≥130 mmHg and/or diastolic blood pressure ≥85 mmHg or antihypertensive drug treatment (17).
NAFLD is defined as excess fat in the liver in the absence of excess alcohol abuse (<20g/day) or other causes of liver disease (16). It covers conditions from simple st-eatosis to steatohepatitis (NASH) (18). In NAFLD, liver fat exceeds 10 % as determined by histology (19), and over 5.6 % measured by spectroscopy (20). Liver fat content have been shown to correlate significantly with all features of MetS independent of BMI (1), (21).
methods to measure InsulIn sensItIvIty
The golden standard for measurement of insulin sensitivity is the euglycemic hyper-insulinemic clamp technique (22). With this technique, whole body insulin sensitivity is measured as the amount of glucose required to maintain normoglycemia during intravenously induced hyperinsulinemia (22). Without isotopes, the glucose infusion rate corrected for changes in glucose concentrations, provides a measure of whole body insulin sensitivity but does not allow distinction between hepatic and peripheral insulin resistance (23), (24), (25). To determine the tissue localization of insulin resis-tance (liver vs. periphery), a glucose isotopes needs to be used (25). For the calcula-tion of glucose kinetics the Steele equation is used (26).
Insulin sensitivity in adipose tissue (insulin sensitivity of lipolysis) can be quantified by infusing a radioactive or stable glyserol or free FFA tracer (27), (28). In addition,
Väitöskirja_Juurinen_sisustaitto.indd 12 21.4.2014 21:51:28

13
PET with 18FDG (fluorodeoxyglucose) can be used to determine glucose uptake in adipose tissue (29), in skeletal muscle (30), (31), and the liver (32).
Other methods to measure insulin sensitivity and glucose metabolism include the intravenous insulin tolerance test (33), the insulin suppression test (34), (35), and the frequently sampled intravenous glucose tolerance test (FSIVGT) with minimal model assessment (36). Methods based on measurement of fasting insulin concentrations, such as fP-insulin, homeostatic model assessment [HOMAIR = (fasting insulin x fasting glucose)/22.5, qualitative insulin check index, [QUICKI = 1/(log fasting insulin+log fasting glucose)] cannot be used to reliably measure insulin sensitivity in type 2 diabetes since it is unclear how well these tests function in subjects with decreased β-cell secretion (37). Fasting insulin also increases because of impaired insulin clearance in subjects with a fatty liver (38). Thus, e.g. HOMA overestimates hepatic insulin resistance compared to insulin resistance in skeletal muscle. The HOMA method is, however used to measure insulin sensitivity in large epidemiologic studies (39).
InsulIn resIstance In the lIver
The liver is mainly responsible for glucose production in the postabsorptive phase (40), (41), (42). Approximately 50–64 % of total hepatic glucose production is due to gluconeogenesis. Insulin inhibits hepatic glucose production (HGP) (23). This occurs both via inhibition of glycogenolysis (43) and gluconeogenesis (44). Insulin also sup-presses HGP via a decrease in glucagon secretion (45). In addition, insulin inhibits the production of VLDL from the liver (46).
Hepatic insulin resistance
Hepatic insulin resistance of glucose production is characterized by a defect in the ability of insulin to suppress HGP (47), (2). A high LFAT content impairs insulin sup-pression of HGP in non-diabetic subjects (2) and in type 2 diabetic patients (7).This leads to an increase in basal HGP in the fasting state (2). Postprandial hyperglycemia is also characterized by persistent HPG after a meal (48). Patients with type 2 dia-betes have more LFAT than non-diabetic subjects for the same BMI (49). LFAT also correlates with insulin requirements in patients with type 2 diabetes (7).
Insulin resistance affects not only glucose but also lipid metabolism in the liver. The increase in LFAT has been shown to lead to overproduction of VLDL (4) due to a defect in insulin suppression of VLDL production (3). In addition, due to the defect in the antilipolytic effect of insulin, the suppression of FFA by insulin is blunted (2) contributing to increased hepatic uptake of FFA (50).
Väitöskirja_Juurinen_sisustaitto.indd 13 21.4.2014 21:51:28

INSULIN THERAPY IN TYPE 2 DIABETES
14
regulatIon of lIver fat In humans
Overfeeding and weight loss
Excessive energy intake (43 % fat, 45 % calories from carbohydrate, and 12 % from protein) increases liver fat content significantly within four weeks in healthy, nor-mal weight subjects (51). We recently showed that liver fat increased by 27 % in three months by carbohydrate overfeeding when body weight increased only by 2 % (52). Several studies have shown that weight loss markedly decreases LFAT in non-diabetic subjects (53), (54), (55) and in patients with type 2 diabetes (56), (57). Glitazones
TZDs are PPARγ (peroxisome-proliferator-activated receptor-gamma) agonists. TZDs bind to the transcription factor PPARγ, which regulates gene expression in response to ligand binding. PPARγ is mainly expressed in adipose tissue and slightly also in the liver, in skeletal muscle, in heart, and in endothelial cells and macrophages (58). PPARγ regulates the transcription of numerous genes involving carbohydrate and lipid metabolism (59) and inflammation (58). TZDs increase hepatic and peripheral insulin sensitivity (60), (61), (10) and have been shown to decrease liver fat content in several studies (60), (61), (62), (10).
The improvement in insulin sensitivity and decrease in LFAT by TZDs are accompanied by a marked increase in serum adiponectin concentrations (63), (10). In mice, adiponectin, which is produced exclusively in adipose tissue, decreases liver fat content and hepatic inflammation (64). Adiponectin is thus one possible mediator of the beneficial effects of TZDs on the liver. TZDs have reduced steatosis, inflammation, and ballooning necrosis in randomized controlled clinical trials addressing treatment of NASH (61), (65), (66), (67).
During insulin combination therapy in patients with type 2 diabetes, insulin doses vary at least 20-fold from 10 to 200 IU/d (8), (15), (68). In 2000, LFAT was shown to correlate with insulin requirements in type 2 diabetes (7). This suggests that especially patients with high insulin requirements could benefit from therapies such as TZDs, which lower LFAT. However, because of fear of hepatotoxicity after withdrawal of troglitazone due to liver reactions, patients with elevated liver enzymes were carefully excluded from insulin-TZD studies (69), (70), (71), (72), (73), (74). Use of rosiglitazone or pioglitazone has not been accompanied by hepatotoxicity but rather beneficial effects on LFAT, hepatic insulin sensitivity and liver histology (58).
Metformin We previously compared effects of rosiglitazone and MET on LFAT in patients with type 2 diabetes (10). In a previous study, MET had no effect on LFAT while rosiglitazone decreased LFAT by 51 % (10). The lack of an effect of MET on LFAT as measured by computed tomography in type 2 diabetes was confirmed by Gupta et al (75) and by
Väitöskirja_Juurinen_sisustaitto.indd 14 21.4.2014 21:51:28

15
Teranishi et al who used 1H-MRS to determine LFAT before and 6 months after MET in 20 Japanese type 2 diabetic patients (76).
Insulin
In patients with NAFLD, lipolysis and de novo lipogenesis are the main sources of excessive intrahepatocellular triglycerides (77). Insulin, even at low concentrations effectively lowers S-FFA and may therefore lower liver fat content (2). On the other hand, insulin stimulates fatty acid and VLDL synthesis in the liver, which could increase LFAT (78). Body weight also increases during insulin therapy in proportion to improved glycemic control (79), while weight loss reduces LFAT (53). There are no studies addressing effects of insulin therapy on liver fat content.
Genetic factors
Genetic factors have been shown to associate with NAFLD (80), (81), (82). The genetic variation in the gene patatin-like phospholipase domain-containing protein 3 (PLPNA3, adiponutrin gene) was found to associate with LFAT (83). The meta-analysis also showed that subjects with NALFD and the I148M variant (rs738409 C>G) in PNPLA3 gene not only were in risk for 73 % higher LFAT but also were predisposed to have 3.2-fold risk for NASH and the fibrosis in the liver (84).
InsulIn resIstance In adIpose tIssue
The main function of adipose tissue is to store excess energy in the form of triacylglycerols (TAG). On the other hand, under fasting conditions lipolysis of TAG-stores in adipose tissue releases glycerol and FFA into the circulation for use in other tissues (85). The main regulator of both processes is insulin. Insulin inhibits lipolysis via inhibition of hormone-sensitive lipase (HSL). It also inhibits intravascular lipolysis, i.e. hydrolysis of VLDL and chylomicrons via inhibition of lipoprotein lipase (LPL). Adipose tissue also acts as an endocrine organ. It secretes adipokines, peptide hormones, and cytokines such as adiponectin, leptin, tumor necrosis factor α (TNF-α) and interleukin 6 (IL-6) (86), (87). Adiponectin is produced exclusively by adipose tissue and appears to act mainly in the liver, where it enhances hepatic insulin sensitivity and decreases inflammation (88), (89). Adipose tissue insulin resistance is characterized by enhanced lipolysis (90). The increase in circulating FFA decreases insulin-stimulated glucose uptake and the ability of insulin to suppress HGP (91). Adipose tissue lipolysis has been shown to be insulin resistant in obese subjects (92) and patients with type 2 diabetes (49). Adipose tissue insulin resistance correlates with LFAT in obese subjects (93) and in type 2 diabetes (49). Adipose tissue in obese insulin resistant subjects is inflamed (89). This inflammation is characterized by an increase in the number of macrophages surrounding dead adipocytes (94). Plasma concentrations of adiponectin are low in obesity and in type 2 diabetes (95), in non-diabetic subjects with family history of type 2 diabetes (96),
Väitöskirja_Juurinen_sisustaitto.indd 15 21.4.2014 21:51:29

INSULIN THERAPY IN TYPE 2 DIABETES
16
and in NAFLD (97). The severity of whole body insulin resistance is inversely related to low serum adiponectin concentrations (95).
InsulIn resIstance In sKeletal muscle
After an overnight fast, when serum insulin concentration is low, only ~10 % (25), (98) of glucose utilization occurs in skeletal muscle. Most of glucose is used in the brain and other insulin-independent tissues (25). In healthy subjects insulin stimulates glucose uptake by skeletal muscle (23), (99).
The ability of insulin to increase glucose uptake is impaired in patients with type 2 diabetes (100), (101), (102). Both insulin-stimulated glucose oxidation and non-oxidative glucose metabolism are deteriorated in type 2 diabetes (103), (104). The defect in insulin stimulated glucose disposal is observed in type 2 diabetes when studied under normoglycemic conditions. However, glucose itself is a potent stimulator of glucose uptake (105).When glucose uptake is measured under hyperglycemic conditions mimicing those prevailing under everyday conditions, glucose uptake is similar in type 2 diabetic patients and matched normal subjects (105), (106). In the basal state, when glucose uptake is largely non-insulin-dependent, rates of absolute whole body and muscle glucose utilization are increased in patients with type 2 diabetes compared to normal subjects, in proportion to hyperglycemia (98).
Hyperglycemia (107), (108), or high S-FFA (91), (92), (30), (109) induce insulin resistance in human skeletal muscle. The rate of insulin-stimulated glucose uptake in type 2 diabetic patients is inversely proportional to the degree of chronic hyperglycemia (105). Increases in S-FFA within the physiological range have also been shown to decrease insulin-stimulated glucose uptake and impair insulin signaling (110).
defects of InsulIn actIon In other tIssues Insulin is known to cause vasodilatation and decrease the stiffness of large arteries (111). Normally insulin inhibits platelet aggregation (112). Insulin stimulates sympathetic nervous system (113) and regulates heart rate (114). Several defects of insulin action in cardiovascular system are found in insulin resistant state, such as the inability of insulin to decrease central aortic pressure in large arteries (111), (115), the defects in endothelium-dependent vasodilatation (116), (117), and in myocardial insulin resistance as measured by PET (118). Insulin action on platelets has shown to be blunted in insulin resistant subjects (112). The action of insulin in central nervous system has been studied using mouse models. Insulin action in brain is supposed to regulate glucose and fat metabolism, and central insulin resistance may lead to insulin resistance in other tissues (119).
Väitöskirja_Juurinen_sisustaitto.indd 16 21.4.2014 21:51:29

17
2.1.2. defects In InsulIn secretIon The insulin response to intravenous glucose is biphasic. An early first-phase burst is followed by a second, sustained phase. Glucose tolerance deterioration from normal to impaired means a progressive decrease in the acute insulin response to glucose (120), and an increase in the response of total insulin to oral glucose load (121). Despite this, most patients with type 2 diabetes are hyperinsulinemic (122).
The increase in total insulin concentrations is an attempt of β-cells to maintain normal glucose tolerance. Once the 2-h plasma glucose in an oral glucose tolerance test (OGTT) exceeds 11.0 mmol/l, insulin secretion starts to decrease relative to insulin resistance and hyperglycemia (122). This means the onset of type 2 diabetes. There is thus absolute hyperinsulinemia but relative deficiency of insulin in type 2 diabetic patients.
The defects in insulin secretion may be familial, inherited or acquired. Poly-morphisms in genes involved in insulin secretion seem to be more common in patients with type 2 diabetes than in non-diabetic subjects. Identification of these genetic markers has not, however, helped in identification of subjects at risk of developing type 2 diabetes (123). Acquired factors such as gluco- and lipotoxicity, and amyloid deposition may also contribute to β-cell exhaustion (124), (125), (126).
2.2. treatment of hyperglycemIa In type 2 dIabetes
Treatment targets and effects of therapy on micro-and macrovascular disease
Lowering of HbA1c below 7.0 % has been shown to decrease the risk of microvascular disease (6). This goal therefore has been recommended as an average HbA1c target for patients with type 2 diabetes. On the other hand, the treatment target should be defined individually after considering hypoglycemia, age, and the presence of complications. Long-term follow-up of patients in the UKPDS, where sulphonylureas, metformin and insulin were used as antihyperglycemic agents suggested that intensive glucose control may be beneficial also for the prevention of macrovascular disease (6), (127).
2.2.1 weIght loss and exercIse
Obesity and sedentary lifestyle together with genetic susceptibility are main reasons for deterioration of glucose metabolism. Lifestyle intervention such as weight reduction, healthy diet and increased physical activity have shown to decrease the risk of diabetes (128). In addition, the changes in lifestyle can reduce the risk of type 2 diabetes in subjects with impaired glucose tolerance (129). Several studies have shown that dietary changes resulting in weight loss decrease HbA1c (130), (131), (132), (133). Bariatric
Väitöskirja_Juurinen_sisustaitto.indd 17 21.4.2014 21:51:29

INSULIN THERAPY IN TYPE 2 DIABETES
18
surgery reverses type 2 diabetes in 36 % when assessed 10 years after gastric by-pass surgery (134).
Daily physical activity associates closely to insulin sensitivity in non-diabetic subjects (135). Whole body insulin sensitivity correlates closely with maximal aerobic power (VO2max). Aerobic exercise, already within one week, improves significantly peripheral insulin sensitivity in subjects with type 2 diabetes (136). Both diet and exercise have shown to decrease HbA1c similarly in patients with type 2 diabetes (137). Aerobic training together with high-intensity resistance training have decreased HbA1c by approximately 1.0–0.7% (138), (139), (140) in type 2 diabetes.
2.2.2 oral agents and glp-1 -analogues
Metformin
MET, a biguanide, the first-line therapy in type 2 diabetes (6) has been is used over 40 years. MET decreases the rate of HGP (141), (142), (10). This is mainly due to the decrease in gluconeogenesis (143). MET promotes weight loss (141) which may improve whole body insulin sensitivity. MET has been reported to decrease serum lipids, especially TG concentrations (144), (143). The risk of lactic acidosis, a serious adverse effect of MET, is very low (145). MET has shown to decrease HbA1c approximately 1.5% (144) without increasing the risk of hypoglycemia (146), (145).
MET has been shown to prevent type 2 diabetes (147) and to reduce the risk of cardiovascular diseases (146) (127). Furthermore, MET may decrease the risk of cancer in patients with type 2 diabetes (148), (149).
Sulfonylureas
Sulfonylureas (SUs) stimulate insulin secretion by closing ATP dependent K+-channels in beta cells (150). SUs bind to the β-cell sulphonylurea receptor -1, which forms a transmembrane complex together with Kir 6.2 potassium channels. Reduced potassium efflux leads to cascade of the membrane depolarisation, opening of Ca2+ channels, and the activation of calcium-dependent proteins controlling insulin release (151).
SUs have been shown to decrease HbA1c by ~1–2% (144). The efficacy depends on the adequacy of the beta-cell function (152). Within five years, however, the glycemic control has shown to deteriorate in patients treated with SU (153). Weight gain and hypoglycemia (153), concerning especially elderly individuals and patients with renal insufficiency (154) are the main adverse effects of SU. Since SU are bound to plasma proteins, interaction with other drugs, such as salicylates, warfarin, and sulphonamides, may lead to the increase in the risk of hypoglycemia (155).
Väitöskirja_Juurinen_sisustaitto.indd 18 21.4.2014 21:51:29

19
Glinides
Derivates of meglitinide, such as repaglinide (carbamoylmethyl benzoic acid derivate) and nateglide (D-phenylalanine derivate), stimulate the release of insulin from β-cells, and nateglide is eliminated primarily by kidney (156) and repaglinide via the biliary tract. The absorption and the elimination are rapid. Both of these short-acting insulin secretagogues have been shown to decrease postprandial hyperglycemia (157), (158). The meal-related dosing of repaglinide has been shown to decrease HbA1c by ~1 % (159). The effect of nateglinide vs. placebo on HbA1c in various studies in type 2 diabetic patients has been summarized in table 1. The geometric mean change by nateglinide vs. placebo in the studies in Table 1 has averaged 0.5 %.
Glinides increase the risk of hypoglycemia but less than long-acting sulphonylureas (14). The percentage of patients reporting hypoglycemia was 3 % for nateglinide compared to 14 % for glyburide (14). In a 24-week study performed in 675 type 2 diabetic patients confirmed hypoglycemia occurred in 5.3 % of the patients treated with nateglinide (160). Whether glinides are helpful in improving glycemic control in patients treated with basal insulin – MET combination therapy has not been examined. In study IV, we hypothesized that addition of nateglinide to basal insulin combined with MET might help in controlling postprandial hyperglycemia in type 2 diabetes.
table 1. The effect of nateglinide as compared to placebo on glucose control in drug-naïve patients with type 2 diabetes.
AuthorAuthorAuthorAuthor ReferenceReferenceReferenceReference nnnn
Study Study Study Study Duration Duration Duration Duration
(wks)(wks)(wks)(wks)
Basal Basal Basal Basal HbA1c HbA1c HbA1c HbA1c
(%)(%)(%)(%)
NateglinideNateglinideNateglinideNateglinide HbA1cHbA1cHbA1cHbA1c (%)(%)(%)(%)
PlaceboPlaceboPlaceboPlacebo HbA1cHbA1cHbA1cHbA1c (%)(%)(%)(%)
pppp----valuevaluevaluevalue
Horton ES 161 701 24 8.3 -0.5 0.5 <0.001
Hanefeld M 162 289 12 8.3 -0.55 0.07 <0.05
Rosenstock J 163 585 16 8.4 -0.6 0.5 <0.001
Saloranta C 160 334 24 6.6 -0.39 0.16 <0.001
Mari A 164 108 24 6.6 -0.31 -0.1 NS
Schwarz SL 165 52 12 7.6 -0.7 -0.2 0.004
Glitazones
TZDs are insulin-sensitizers enhancing whole body insulin sensitivity (166), (167), (142) hepatic insulin sensitivity (10) and adipose tissue insulin sensitivity (60). TZDs increase the suppression of HGP by insulin (166) and decrease HbA1c approximately 1 to 1.5%.
Väitöskirja_Juurinen_sisustaitto.indd 19 21.4.2014 21:51:30

INSULIN THERAPY IN TYPE 2 DIABETES
20
From three TZDs only pioglitazone is in clinical use. Troglitazone was withdrawn due to hepatotoxicity (168) and rosiglitazone due to increase in cardiovascular events, especially heart failure (169). TZDs decrease liver fat content approximately 50% (10), (11), (60). In the previous studies the combination therapy of insulin and TZDs decreased insulin requirements slightly. Glycemic control improved in spite of the increase in body weight. LFAT was not measured in these studies (69), (70), (71), (72), (73).
TZDs increase the incidence of congestive heart failure (170), (58), (70). In addition, TZDs are associated with weight gain, a small decrease in hemoglobin (171), (167), and fluid retention (58). The reason for fluid retention and peripheral edema may be due to reduction of renal extraction of sodium (172). Pioglitazone and placebo was shown to have similar congestive heart failure related mortality (170) but with rosiglitazone the increase in mortality due to heart failure was shown to be doubled compared to placebo (169). Use of TZDs also increases the risk of fractures (173).
DPP-4 inhibitors
Glucagon-like peptide 1 (GLP-1) is secreted from L-cells in response to a meal and stimulates insulin secretion as well as lowers glucagon secretion (174). Dipeptidyl peptidase-4 (DPP-4) is an aminopeptidase, which postprandially rapidly degrades the incretin hormones, glucose-dependent insulinotrophic polypeptide (GIP) and GLP-1. DPP-4 is expressed in many tissues, and on the surface of lymphocytes, macrophages, and endothelial cells (175). Inhibition of DPP-4 by DPP-4 inhibitors such as sitagliptin, vildagliptin, saxagliptin and linagliptin, increases the concentration of endogenous active plasma GLP-1 (176), (177).
DPP-4 inhibitors have been shown to decrease HbA1c by ~0.5% from the baseline HbA1c of 7.4% (178), (179), (180), (181). The elimination of DPP-4-inhibitors occurs mainly by the kidney with the exception of linagliptin, which is metabolized mainly by the liver (182). Vildagliptin had no effect on fasting TG or total cholesterol concentrations (183). DPP-4 inhibitors are well-tolerated, weight neutral and do not cause hypoglycemia (182).
DPP-4 inhibitor linagliptin when added to basal insulin therapy improved glycemic control and HbA1c decreased approximately 0.6 % (184). The frequency of hypoglycemia was low. Similar results are reported with other DPP-4 inhibitors combined to basal insulin therapy (185), (186).
GLP-1 analogues
Oral glucose induces a higher insulin response than intravenous glucose load has been attributed to incretin hormones, GLP-1 and GIP (187). Over 50 % of the glucose-stimulated insulin response is suggested to be due to incretin effect, which is blunted in patients with type 2 diabetes (174). The response of insulin to glucose is decreased due to a resistance of GIP-action and a deficiency of GLP-1 in patients with type 2
Väitöskirja_Juurinen_sisustaitto.indd 20 21.4.2014 21:51:30

21
diabetes (119). Thus, the lower GLP-1 levels after mixed meal contribute to increase in glucagon secretion leading hyperglycemia (174).
GIP is synthesised in K-cells of the proximal small intestine and GLP-1 in L-cells in the distal ileum and colon (174). They increase insulin secretion in a glucose-dependent manner. Incretins act by decreasing basal and postprandial glucagon secretion, delaying gastric emptying, and increasing satiety. Furthermore, incretins may have beneficial effects on beta cell function (188).
Endogenous GLP-1 has a short half-life due to quick enzymatic deactivation in the circulation by DPP-4. GLP-1 analogues such as exenatide, liraglutide and lixisenatide, are resistant to enzymatic deactivation by DPP-4 (189).
When used as monotherapy GLP-1-analogues decrease HbA1c by ~0.8% (190), (191), (178). Despite improved glycemic control, body weight decreases significantly by 2-4 kg (191). Gastrointestinal side-effects and nausea are common. A low risk of hypoglycemia, weight loss and the efficacy in the combination therapy with other OAD (192) and with basal insulin (193) are the advantages of these drugs for patients with type 2 diabetes.
SGLT-inhibitors
Sodium-glucose cotransporter (SGLT) 2 inhibitors have been recently introduced as antihyperglycemic agents for patients with type 2 diabetes. SGLT2 is expressed at the luminal membrane of proximal renal tubules. SGLT2 is the major transporter responsible for glucose reabsorption. SGLT1 reabsorbs the remaining 10% of the filtered glucose. The average of the daily amount of glucose reabsorbed by the kidney in healthy subjects is around 160 grams of glucose. No glucose normally appears in the urine (194).
Dapagliflozin is an SGLT2 inhibitor. It thereby inhibits reabsorption of glucose and increases urinary excretion, which lowers plasma glucose concentrations. The glucose-lowering effect in patients with type 2 results in approximately a 0.7 % decrease in HbA1c without increasing hypoglycemia when compared to placebo (195). Weight loss by dapagliflozin was approximately 3 kg in 24-week placebo-controlled study. The adverse events, such as signs and symptoms of urinary infections and genital infections, were more common in group treated with dapagliflozin as compared to placebo (195).
Väitöskirja_Juurinen_sisustaitto.indd 21 21.4.2014 21:51:30

INSULIN THERAPY IN TYPE 2 DIABETES
22
Author (Reference)Author (Reference)Author (Reference)Author (Reference) ComparatorComparatorComparatorComparator
with OADwith OADwith OADwith OAD
ENDHbAENDHbAENDHbAENDHbA1c1c1c1c
%%%%
HbAHbAHbAHbA1c1c1c1c %%%%
IDIDIDID IU/kg, IU/dayIU/kg, IU/dayIU/kg, IU/dayIU/kg, IU/day
WeightWeightWeightWeight kgkgkgkg
HypoglycemiaHypoglycemiaHypoglycemiaHypoglycemia
Kilo et al (196) NPH+MET, n=91 Bas.1c 9.5 %
MIX30 +MET 8.3 / 8.2 (NS) 1.2 / 1.3 (NS) 28 / 26 (ND) 0.1 / 0.7(NS)
0.55 / 1.04 13 % / 24 %
(ND)
Malone et al†(197) GLARGIN+MET, n=105 Bas.HbA1c 8.7 %
MIX25BID+MET 7.8 / 7.4** 0.9 / 1.3** 0.57 / 0.62*** 1.6 / 2.3** 4.75 / 8.27*
Raskin et al (198) GLARGIN+OAD, n=209 Bas.HbA1c 9.8 %
MIX30BID+OAD 7.41 / 6.91** 2.36 / 2.79** 51 / 79* 3.5 / 5.4** 0.7 / 3.4**
Jacober et al† (199) GLARGIN+OAD, n=60 Bas.HbA1c 9.2 %
MIX BID+OAD 7.34 / 7.08** 0.75 / 1.0** 0.28 / 0.35**
28 / 37**
1.52 / 1.98 (NS) 10.7 / 2.8*
Holman et al (200) DETEMIR+OAD, n=469 Bas.HbA1c 8.5 %
MIX30BID+ OAD 7.6 / 7.3*** 0.8 / 1.3*** 0.53 / 0.49
42 / 48 (NS) 1.9 / 4.7** 0 / 3.9**
ID=Insulin dose. Bas HbA1c, Baseline HbA1c (mean of both study groups).
*p<0.05; **p<0.01; *** p<0.001; NS, not significant; ND, not documented. OD, once daily; BID, twice daily; TID, three times a day.
† Cross-over study. Hypoglycemia: Events/patient-year (% of patients). OAD, oral antidiabetic drug
2.2.3 InsulIn Choice of the insulin regimen
Studies comparing basal insulin with OAD to mixed insulin with OAD are shown in Table 2 and studies comparing basal insulin with OAD to mixed insulin without OAD in Table 3. The comparison of studies using basal insulin with OAD and multiple injections with OAD is shown in table 4.
In the various comparisons there was no difference in glycemic control except in studies where the insulin doses differed significantly (table 2-4). Weight gain was significantly less with basal insulin and OAD than with mixed insulin with OAD (Table 2) or multiple injections with OAD (Table 4) in 5 out of 8 comparisons and not significantly different in the remaining 3 comparisons. Hypoglycemia was also significantly less in 5 out of 8 comparisons with basal insulin and OAD than with mixed or multiple insulin injections combined with OAD. These data support initiation of insulin therapy with the addition of basal insulin to OAD (6).
table 2. Studies comparing basal insulin with OAD to mixed insulin twice daily with similar OAD in insulin-naïve patients with type 2 diabetes. Studies after year 1990 with duration ≥ 3 months are included.
ID=Insulin dose. Bas HbA1c, Baseline HbA1c (mean of both study groups). *p<0.05; **p<0.01; *** p<0.001; NS, not significant; ND, not documented. OD, once daily; BID, twice daily; TID, three times a day.† Cross-over study. Hypoglycemia: Events/patient-year (% of patients). OAD, oral antidiabetic drug.
Väitöskirja_Juurinen_sisustaitto.indd 22 21.4.2014 21:51:30

23
table 3. Studies comparing basal insulin with OAD (oral antidiabetic drug) to mixed insulin without OAD in insulin-naïve patients with type 2 diabetes. Studies after year 1990 with duration ≥ 3 months are included.
ID, Insulin dose; Bas HbA1c, Baseline HbA1c (mean of both study groups); * p<0.05; **p<0.01; ***
p<0.001. NS, not significant. ND, not documented. OD, once daily; BID, twice daily; TID, three times a
day. Hypoglycemia: Events/patient-year (% of patients).
Author (Reference)Author (Reference)Author (Reference)Author (Reference) ComparatorComparatorComparatorComparator ENDHbAENDHbAENDHbAENDHbA1c1c1c1c HbAHbAHbAHbA1c1c1c1c IDIDIDID WeightWeightWeightWeight
HypoglyceHypoglyceHypoglyceHypoglycemmmmiaiaiaia
Yki-Jarvinen et al (68) NPHevening+OAD,
n=57 Bas. HbA1c 9.8 %
MIX 30 BID 8.0 / / / / 7.9
(NS) 1.9 / / / / 1.8
(NS) 20 / / / / 43
(ND) 1.2 //// 1.8* NS
Yki-Jarvinen et al (68) NPH morning+OAD,
n=61
Bas. HbA1c 9.6 %
MIX 30 BID 7.8 / / / / 7.9
(NS) 1.7 //// 1.8
(NS) 19 //// 43 (ND)
2.2 //// 1.8 (NS)
NS
Wolffenbuttel et al (201) NPH evening +SU, n=62
Bas.HbA1c 10.9 %
MIX 30 BID 8.1 / / / / 8.2
(NS) 2.4 / / / / 3.0
(NS) 24 / / / / 39*
4.4 / / / / 4.0 (NS)
ND
Wolffenbuttel et al (201) NPH morning+SU, n=67
Bas.HbA1c 11.2 %
MIX 30 BID 8.5 //// 8.2
(NS) 2.6 //// 3.0
(NS) 26 //// 39*
3.4 / 4.0 (NS)
ND
Janka et al (202) GLARGIN
evening+OAD, n=364
Bas.HbA1c 8.8 %
MIX 30 BID 7.15 ////
7.49*** 1.64 //// 1.31***
28.2 //// 64.5 (ND)
1.4 //// 2.1 (NS)
2.6 //// 5.7***
Väitöskirja_Juurinen_sisustaitto.indd 23 21.4.2014 21:51:30

INSULIN THERAPY IN TYPE 2 DIABETES
24
table 4. Studies comparing basal insulin and OAD to multiple preprandial injections with similar OAD in
insulin-naive patients with type 2 diabetes.
**p<0.01; *** p<0.001; NS, not significant; ND, not documented. OD, once daily; BID, twice daily; TID, three times a day. OAD, oral antidiabetic drug. BasHbA1c; Baseline Hba1c (mean of both groups). Hypoglycemia: events/patient-year.
Practical aspects of initiation of insulin therapy
Although insulin therapy has many beneficial effects, reluctance to initiate insulin is still common. This is in part because of lack of time and resources. There is thus a need to develop innovative strategies to facilitate the transition to insulin therapy. As discussed above, simple addition of basal insulin to existing oral agents is an attractive way to start insulin therapy as it involves only one injection of insulin, the dose of which can be adjusted based on self-monitoring of fasting plasma glucose (8), (12), (15), (68). Historically, insulin therapy has been started individually in patients with type 2 diabetes. Considering limited resources, the large numbers of patients, it would seem worthwhile to establish whether insulin can be started in groups. There are, however, no studies comparing initiation of insulin individually as compared to groups.
Author (Reference) Comparator ENDHbA1c
(%) HbA1c
(%) IU (IU/kg, IU/day)
Weight (kg)
Hypo-glycemia
Landstedt-Hallin et al (203)
NPH+SU, n=80
Bas. HbA1c 9.1 %
PREPRANDIAL TID+SU
7.5/7.1 (NS)
1.7/2.1 (NS)
26/29 (NS)
1.9/3.4 **
ND
Bastyr et al (204) NPH+SU, n=91
Bas. HbA1c 10.2 %
PREPRANDIAL TID+SU
8.5/7.7 **
1.89/2.33 (NS)
0.29/0.42 (ND)
2.3/3.4
(NS)
7.3/13.3
(NS)
Holman et al (200) DETEMIR+SU+MET,
n=475
Bas. HbA1c 8.5 %
PREPRANDIAL TID+SU+MET
7.6/7.2
***
0.9/1.3
***
0.49/0.61
**
1.9/5.7 ***
grade 2 ***
Bretzel et al (205) GLARGIN+OAD, n=418
Bas. HbA1c 8.7 %
PREPRANDIAL TID+OAD
7.0/6.8 (NS)
1.7/1.8 (NS)
42/45 (ND)
3.0/3.5 (NS)
4.2/13.5 ***
Väitöskirja_Juurinen_sisustaitto.indd 24 21.4.2014 21:51:30
25
3. AIMS oF THE STUDY
I. To determine the effect of insulin therapy on LFAT content and hepatic insulin sensitivity in patients with type 2 diabetes.
II. To determine the effects of addition of rosiglitazone to insulin on hepatic sensitivity to insulin, insulin requirements and glycemic control in patients with type 2 diabetes treated with high insulin doses.
III. To compare the effect of adding nateglinide or placebo on postprandial glucose excursions in patients treated with basal insulin and metformin.
Iv. To determine whether insulin can be started equally well individually and in groups.
Väitöskirja_Juurinen_sisustaitto.indd 25 21.4.2014 21:51:30

INSULIN THERAPY IN TYPE 2 DIABETES
26
4. SUBJECTS AND STUDY DESIGNS
4.1. subjects
Baseline characteristics of the study subjects are shown in Table 6. For studies I and IV, insulin-naive patients with type 2 diabetes who were poorly controlled with oral antidiabetic drugs, MET alone (I) and MET and/or SU (IV) were recruited. For study II, patients with type 2 diabetes who had been treated with stable doses of MET, and were poorly controlled despite of high insulin dose were recruited. For study III patients with type 2 diabetes treated with basal insulin therapy and MET were studied.
Subjects were included based on the following criteria: 1) age over 18 years, 2) HbA1c between 7.0 and 12 % (IV) or ≥ 6.5 % (III), 3) body mass index between 20–50 kg/m2 (III), less than 45 kg/m2 (IV) and stable body weight and glycemic control for at least 6 months prior to participation (I, II). Further inclusion criteria were willingness to perform self-monitoring of blood glucose (III, IV) and to share some health information with other members of the group (IV). In study III the inclusion criterion for entering the treatment period was an HbA1c between 6.5 and 9.0 %. Moreover, subjects with non-compliance as determined from failure to perform any diurnal glucose profiles during the optimization period were excluded from this study.
Exclusion criteria were clinical evidence of symptomatic cardiovascular or liver or other severe disease as determined by medical history, physical examination and standard laboratory tests (blood counts, electrolytes, creatinine, urine sample, electrocardiogram). Further exclusion criteria were treatment with drugs likely to interfere with glucose tolerance, macroalbuminuria, proliferative retinopathy, excessive alcohol consumption (>20 g/day), drug abuse and pregnancy (I-IV).
In addition, a history of ketoacidosis or positive GAD-antibodies or liver enzymes (S-ALT, S-AST; S-ALP) higher than 3 times the upper limit of normal or night shift work were exclusion criteria in studies III and IV.
For the study II subjects underwent transthoracic echocardiography and left ventricular ejection fraction equal or less than 50 % or any other clinically significant abnormality was an exclusion criteria.
Written informed consent was obtained from all subjects. The protocols were approved by Ethics Committee of Helsinki University Central Hospital (I-IV). Study III was also approved by local ethics committees of each participating center outside Helsinki.
Väitöskirja_Juurinen_sisustaitto.indd 26 21.4.2014 21:51:30

27
4.2. study desIgn
Effect of insulin therapy on LFAT and hepatic insulin sensitivity in patients with type 2 diabetes (I)
Fourteen patients with type 2 diabetes treated with MET (2 g/day) alone were recruited and metabolic studies were performed before and 7 months after the initiation of basal insulin. Metabolic studies included measurements of LFAT, whole body and hepatic insulin sensitivity (fig. 3), intra-abdominal (IA) and subcutaneous (SC) fat volumes, the percentage of body fat and glucose and lipid oxidation rates. Fasting blood samples were obtained for measurements of glucose, insulin, ALT, FFA, adiponectin, and blood lipid concentrations.
Effect of addition of rosiglitazone to insulin on LFAT and heptatic insulin sensitivity (II)
Fourteen patients with type 2 diabetes (9 men and 5 women) were enrolled by contacting specialists in Southern Finland. These patients had had a stable and high insulin dose in addition to 2 g of MET for at least 2 years. Despite of high-dose insulin therapy (range 115-400 IU/day) their glycemic control was unsatisfactory. LFAT, fat distribution, fat free and fat mass, whole body and hepatic insulin sensitivity (fig. 3) and rates of substrate oxidation were determined during insulin and MET treatment and 8 months after addition of rosiglitazone (8 mg/day).
Effect of adding nateglinide or placebo on postprandial glucose excursions in type 2 diabetic patients treated with basal insulin and MET (III)
Study III was an investigator-initiated multicenter, double-blind, randomized, parallel-group, fixed dose trial. The efficacy, safety and tolerability of nateglinide were compared to placebo in patients with type 2 diabetes treated with the combination of basal insulin and MET (2 g/day). Basal insulin was first titrated to optimize glucose control during a 24-week period (optimization period). The goal was to achieve a mean FPG of 4.0–5.5 mmol/l. Thereafter either nateglinide or placebo was added before main meals for 24 weeks (treatment period). Study was performed at five sites in Finland. During first 24-week period basal insulin (NPH or glargine) was titrated to optimize glucose control. At the beginning of the treatment phase eligible patients (n=81) were randomly assigned to treatment with nateglinide or placebo using minimization of differences between the treatment groups (206). The following variables (relative weight of each variable is given in parentheses) were considered: age (1x); gender (0.5x); body mass index (1.5x); HbA1c (1.5x), duration of diabetes (0.5x); duration of insulin therapy (1.0x); type of basal insulin (NPH or glargine) (1.5x) and use of diuretics or ß-blocking agents (0.25x) (206). Randomization was carried out at the Helsinki University Central Hospital.
Väitöskirja_Juurinen_sisustaitto.indd 27 21.4.2014 21:51:30

INSULIN THERAPY IN TYPE 2 DIABETES
28
Patients measured FPG every morning and performed a diurnal profile with plasma glucose measurements once during weeks –24, -12, -8, -4, -2 and 0, 2, 4, 8, 12, 16, 20, and 24. The visits and phone calls during the study weeks are shown in the fig. 1. At weeks -12, 0, 12 and 24 the measurements of HbA1c, blood count, electrolytes, and serum lipid concentrations were performed. Safety laboratory tests included measurement of S-ALT, creatinine and bilirubin at weeks -2, 0, 2, 24.
Figure 1. Design (III). Effect of adding nateglinide or placebo on postprandial glucose excursions in type 2 diabetic patients treated with basal insulin and MET. Visits at weeks -24, -12, -2, 0, 2, 12 and 24. Phone calls at weeks -22, -20, -16, -8, -6, -4, 4, 6, 8, 16, 20 and 22.
Initiation of insulin therapy individually or in groups (IV)
This study was an investigator-initiated, open, randomized, and parallel-group multi-center study. We compared the initiation of insulin in groups vs. individually in insulin-naive patients with type 2 diabetes. They were poorly controlled on OAD. The study consisted of a 3 to 14-week run-in phase and a 24-week treatment phase. Study groups were in Finland, Sweden, and U.K.
The participants (n= 121) were treated with combination of MET and SU or either drug alone for at least 6 months before the initiation of insulin therapy. The study was performed as the intent-to-treat basis. Week 0 visit the participants were taught how to inject insulin, use the insulin pen, and self-adjust insulin dose. Symptoms and signs of hypoglycemia were discussed. Treatment satisfaction was assessed by asking the patients to fill a Diabetes Treatment Satisfaction Questionnaire DTSQ form (207). This questionnaire was filled in the beginning and the end of the study.
The randomization to either group or individual education was performed centrally, using the method of minimization of differences (206). The group size was 4–8 subjects
Väitöskirja_Juurinen_sisustaitto.indd 28 21.4.2014 21:51:31

29
(mean 5.3 persons). Patients performed self-monitoring of FPG every morning and sent FPGs using a modem or by mail before calling the study center. During the call, the study nurse reviewed glucose measurements received at a website (www.prowellness.com), encouraged self-adjustment of the insulin dose, and asked for possible adverse events, incidents of hypoglycemia, and possible changes in medication. The educational content is shown in table 5. The study design is shown in the Fig. 2. HbA1c, FPG and body weight were measured at every visit. Time spent by a nurse on education, physician’s time, and number and duration of phone calls were recorded. The insulin dose, symptoms and signs of hypoglycemia were recorded at every contact during the study, and treatment satisfaction at week 0 and 24. Measurements of blood count, electrolytes, creatinine, and S-ALT were performed at screening visit -14 to -3, 24 weeks. Serum lipid concentrations were measured at weeks 0, 24.
figure 2. Design (IV). The initiation of insulin therapy individually or in groups. Visits at 0, 6, 12 and 24 weeks, phone calls at 1, 2, 4, 8, 16 and 20 weeks.
MET SU + insulin, individual
MET SU + insulin, group
Run-inperiod
METSU
1 248 16
Visit
Phone * * * * * * *
Väitöskirja_Juurinen_sisustaitto.indd 29 21.4.2014 21:51:31

INSULIN THERAPY IN TYPE 2 DIABETES
30
table 5. The educational content (IV).
Visit (wks)Visit (wks)Visit (wks)Visit (wks)
ContentContentContentContent
-2
Home-glucose monitoring.
Pathogenesis of type 2 diabetes
Treatment of type 2 diabetes
0
Why and when is insulin therapy needed
Injection of insulin
Self-adjustment of the insulin dose
Hypoglycemia (causes, symptoms, treatment)
+6
+12
Weight gain and insulin therapy
Targets of the glycemic control
Type 2 diabetes and complications
Why do insulin vary between patients
+24
Special situations and insulin therapy
(missed injection, acute illness, travel)
Encourage to self-adjustment of the insulin dose
Väitöskirja_Juurinen_sisustaitto.indd 30 21.4.2014 21:51:31

31
5. METHoDS
5.1. hepatIc InsulIn sensItIvIty (I, II)
Euglycemic, hyperinsulinemic clamp technique
Patients were admitted to the hospital on the evening before the study. At 6 PM, an indwelling 18-gauge catheter (Venflon, Viggo-Spectramed, Helsingborg, Sweden) equipped with an obturator was inserted in an antecubital vein. On this evening before
the study patients did not take their bedtime insulin injection. To determine total rates of glucose appearance (Ra) and disappearance (Rd), a primed continuous intravenous
infusion of [3-3H]-glucose was started at 4 AM and continued for a total of 660 min. The priming dose of [3-3H]-glucose was adjusted according to the fasting blood glucose concentration and calculated as follows: priming dose = [glucose (mmol/l) at 4 AM/5]
x 20 µCi/min. This dose was infused intravenously over 10 min and was followed by a continuous-rate infusion of [3-3H]-glucose at a rate of 0.2 µCi/min (7).
Before the start of the insulin infusion, a catheter was inserted in a retrograde position in a heated dorsal hand vein for withdrawal of arterialized venous blood. Baseline blood samples were taken for measurement of FPG, glucose specific activity (SA), HbA1c, triglycerides, total, HDL, and LDL cholesterol, adiponectin, FFA, and fasting insulin concentrations.
After a 300-min equilibrium period, a primed continuous (0.3 mU/kg∙min) infusion of insulin was started (22), (7). Because hepatic glucose production is sensitive to suppression by insulin (45), (24) we used a low insulin infusion rate to be able to accurately assess hepatic insulin sensitivity. Plasma glucose was adjusted to and maintained ~8 mmol/l (144 mg/dl) for 360 min. A variable-rate infusion of 20 % glucose based on plasma glucose measurements was used to keep plasma glucose stable. Plasma glucose measurements were made from arterialized venous blood every 5–10 min. Glucose specific activity (SA), serum free insulin concentrations and S-FFA were taken basally and during hyperinsulinemia as shown figure 3. Blood samples for measurement of glucose SA were taken basally at -30, -20, 0 min before the beginning of insulin infusion. Rates of glucose Ra and Rd were calculated using the Steele equation (26), assuming a pool fraction of 0.65 for glucose and distribution
volume of 200 ml/kg for glucose.Hepatic glucose Ra was calculated by subtracting the exogenous glucose infusion
rate required to maintain euglycemia during hyperinsulinemia (300–660 min in Study I and 0–360 min in Study II) from the rate of total glucose Ra. The percent suppression
of basal endogenous glucose Ra during the last 2 hours (540–660 min in Study I and 240–360 min in Study II) by insulin was used as a measure of HGP, i.e. the sensitivity of endogenous glucose production to insulin (percent suppression of endogenous Ra).
Väitöskirja_Juurinen_sisustaitto.indd 31 21.4.2014 21:51:31

INSULIN THERAPY IN TYPE 2 DIABETES
32
figure 3. Measurement of hepatic and peripheral insulin sensitivity in studies I and II. GSA; glucose specific activity. Blood samples for measurement of GSA were taken during insulin infusion at 420, 480, 540, 580, 600, 630 and 660 min. S-FFA was measured at 310 min and then every 5 min between 310 and 330 min and every 60 min between 360 and 660 min.
5.2. lIver fat content (I, II)
Proton magnetic resonance spectroscopy (1H-MRS)
LFAT was measured using 1H-MRS. Localized single-voxel (2 x 2 x 2 cm3) proton spectra were recorded using a 1.5-T whole body system (Magnetom Vision, Siemens, Erlangen, Germany) that consisted of the combination of whole-body and loop surface coils for radiofrequency transmitting and signal receiving (7). T1-weighted high-resolution MRI scans were used for localization of the voxel of interest within the right lobe of the liver. Magnetic resonance spectroscopy measurements of LFAT were performed in the middle of the right lobe of the liver at a location that was individually determined for each subject. Vascular structures and subcutaneous fat tissue were avoided when selecting the voxel. Subjects were required to lie on their stomach on the surface coil embedded in a mattress, in order to minimize movement artefact due to breathing. The single voxel spectra were recorded by using the stimulated-echo acquisition mode sequence with an echo time of 20 ms, a repetition time of 3000 ms, a mixing time of 30 ms, 1024 data points over 1000 kHz spectral width with 32 averages. Water-suppressed spectra with 128 averages were recorded to detect weak lipid signals. A short echo time and the long repetition time were chosen to ensure a fully relaxed water
20 % glucose
0.3 mU/kg ·min insulin infusion
[3-3H] glucose
Time (min)
0 660300
Indirect calorimetry
Serum FFA and GSA, fS-adiponectin
480
* Serum insulin
360 420 540 600 630580
* * * * * **
Väitöskirja_Juurinen_sisustaitto.indd 32 21.4.2014 21:51:31
33
signal, which was used as an internal standard. Chemical shifts were measured relative to water at 4.80 ppm. The methylene signal, which represents intracellular triglyceride, was measured at 1.4 ppm. Signal intensities were quantified by using the analysis program, VARO-MRUI (http://www.mrui.uab.es/mrui). Spectroscopic intrahepatocytic triglyceride content was expressed as a ratio of the area under the methylene peak to that under the methylene and water peaks (× 100 = liver fat %). All spectra were analyzed by a physicist who was unaware of other research data.
5.3. measures of body composItIon (I, II)
Intra-abdominal and abdominal subcutaneous fat volumes
Volumes of IA and abdominal SC fat were measured by analyzing 16 T1-weighted two-dimensional trans-axial MRI scans from a region extending from 8 cm above to 8 cm below the 4th and 5th lumbar interspace (16 slices, field of view 375 × 500 mm2, slice thickness 10 mm, breath-hold repetition time 138.9 ms, echo time 4.1 ms). Volumes of adipose tissue deposits were calculated using an image analysis program (Alice 3.0,
Parexel, Waltham, MA). A histogram of pixel intensity of each scan was displayed, and the intensity corresponding to the nadir between the lean and fat peaks was used as a cut-off point. Intra-abdominal adipose tissue was defined as the area of pixels in the intra-abdominal region above this cut point. For calculation of subcutaneous adipose tissue area, a region of interest was first manually drawn at the demarcation of subcutaneous adipose tissue and intra-abdominal adipose tissue (7) (fig. 4).
Whole-body fat % and waist-to-hip –ratio (I, II)
Body fat-free mass and fat mass were determined by bioelectrical impedance analysis (BioElectrical Impedance Analyzer System model no. BIA-101A, RJL Systems, Detroit, MI) (207). Waist circumference was measured midway between the lower rib margin and spina iliaca superior, and hip circumference at the level of the great trochanters (209).
5.4. measurements of substrate oxIdatIon rates (I, II)
Glucose and lipid oxidation rates were measured by indirect calorimetry using the Deltatrac Metabolic Monitor (Datex, Helsinki, Finland) (210), (211). The measurements
were performed for 40 min during the basal period and the last 2 hours of insulin clamp. Samples of inspired and expired air, which were suctioned at 40 l/min, were analyzed for O2 and CO2 concentration differences using paramagnetic O2 and CO2 analyzers, respectively. Urine was collected and the protein oxidation rate was estimated from urea nitrogen excretion (1 g nitrogen = 6.25 g protein). The constants used for the calculation of glucose and lipid oxidation rates from gas exchange data were as follows:
Väitöskirja_Juurinen_sisustaitto.indd 33 21.4.2014 21:51:32

INSULIN THERAPY IN TYPE 2 DIABETES
34
oxidation of 1 g of protein requires 966 ml of O2 and produces 782 ml of CO2, of 1 g of glucose requires 746 ml of O2 and produces 746 ml of CO2, and of 1 g of lipid requires
2.029 ml of O2 and produces 1.430 ml of CO2. The rate of nonoxidative glucose disposal was calculated by subtracting the rate of glucose oxidation from the rate of total glucose disposal. Energy production rates (J/kg∙ffm∙ min) were calculated assuming oxidation of 1 mg carbohydrate produces 15.65 J of energy; 1 mg lipid produces 39.75 J of energy; and 1 mg protein produces 17.15 J of energy (210).
5.5. transthoracIc echocardIography (II)
Transthoracic echocardiography was performed by using a Vivid 7 digital ultra-sonography system (GE Vingmed Ultrasound, Horton, Norway). The left ventricular ejection fraction was calculated by M-mode echocardiography from the parasternal long-axis view. Measurements were made while the subject was lying in the left lateral recumbent position from three consecutive beats. The average of three beats was used for analysis. Subjects with left ventricular ejection fraction less than 50 % were excluded from the study II. Transthoracic echocardiography was performed as a safety concern.
5.6. optImIzatIon of InsulIn therapy (III, Iv)
Patients had been doing home-glucose monitoring before (II, III) and the participants were taught how to inject insulin and to perform glucose self-monitoring (I, IV). The education was led by the same nurse in group and individual sessions (IV). Participants
figure 4. One of the 16 abdominal scans of the patient in Study II. Fat is shown in white.
Väitöskirja_Juurinen_sisustaitto.indd 34 21.4.2014 21:51:32
35
were asked to measure FPG every morning (I–IV) and to perform a diurnal profile with plasma glucose measurements before and 2.0 hrs after breakfast, lunch and dinner, at 10 p.m. and at 4 a.m (III). The patients were asked to increase the dose of insulin by 2–4 IU when FPG exceeded 5.5mmol/l for 3 consecutive days. The recommended increase was 4 IU/day if FPG exceeded 10mmol/l on 3 consecutive mornings. The goal was to achieve a mean FPG of 4.0-5.5 mmol/l (III, IV). Adjustment of the insulin dose and symptoms of hypoglycemia was monitored at visits and phone calls. Biochemical hypoglycemia was defined as a plasma glucose <4.0 mmol/L. Symptomatic confirmed hypoglycemia was defined as symptoms of hypoglycemia combined with a measured plasma glucose concentration of <4.0 mmol/l. Severe hypoglycemia was defined as an event with symptoms consistent with hypoglycemia during which the subject required the assistance of another person and which was associated with either a plasma glucose level below 3.1 mmol/l or with prompt recovery after oral carbohydrate, intravenous glucose or glucagon administration (8). The patients were instructed to measure plasma glucose whenever hypoglycemia occurred and to record the value and symptoms. If FPGs were <4.0 mmol/l and symptomatic hypoglycemia occurred without an identifiable reason, the patients were asked to decrease the insulin dose
by 2 IU/day. Treatment satisfaction was assessed by asking the patients to fill DTSQ - form (207) (IV).
5.7. analytIcal procedures
Plasma glucose concentrations were measured in duplicate with the glucose oxidase method using a Beckman Glucose Analyzer II (Beckman Instruments, Fullerton, CA) (I, II) (211). In order to determine [3-3H]-glucose SA plasma was deproteinized with barium hydroxide, Ba(OH)2 and zink suphate, ZnSO4 and evaporated (213) (I, II). Serum free insulin concentrations were measured with the Auto-DELFIA kit (Wallac, Turku, Finland) (I, II) and C-peptide concentrations by RIA (214). HbA1c was measured by high-pressure liquid chromatography using the Glycosylated Hemoglobin Analyzer System (Bio-Rad, Richmond, CA) (I–IV). Serum total cholesterol, HDL cholesterol, and triglyceride concentrations were measured with the enzymatic kits from Roche Diagnostics using an autoanalyzer (Roche Diagnostics Hitachi 917, Hitachi, Tokyo, Japan) (I, II). The concentrations of LDL cholesterol were calculated using the Friedewald formula (215) (I, II). Serum alanine aminotransferase (ALT) activity was determined as recommended by the European Committee for Clinical Laboratory Standards (I, II). Lipids, ALT, and other measurements were performed using methods in local laboratories (III, IV). Serum adiponectin concentrations were measured by an ELISA kit from B-Bridge International (San Jose, CA) (I), and S-FFA concentrations were measured by fluorometric assay (216) (I, II).
Väitöskirja_Juurinen_sisustaitto.indd 35 21.4.2014 21:51:32

INSULIN THERAPY IN TYPE 2 DIABETES
36
5.8. statIstIcal analyses
In all studies a p-value of less than 0.05 was considered statistically significant. Calculations were made using GraphPad Prism version 3.0 (Study I) or 4.0 (Studies II, III) for Windows (GraphPad, San Diego, CA), SysStat Statistical Package (Systat version 10; SysStat, Evanston, IL) (I, III) and SPSS 14.0 (II) for Windows (SPSS, Chigaco, IL). Data are shown as mean ≥SEM.
The paired t-test was used to compare changes before and after insulin (I) or additional rosiglitazone (II) treatment for normally distributed parameters. Logarithmic transformation was performed if necessary. Correlation analyses were performed using the Spearman`s nonparametric correlation coefficient for the comparison of two continuous variables.
In study III, all statistical analyses were performed on an intent-to-treat basis. The intention-to treat population was defined as all patients who were randomized to enter the 24-week treatment phase. The mean postprandial glucose excursion (PPGE) was defined as: ∑n (B-gluc2h pp- B-glucpremeal) measured during a diurnal glucose profile on one day at weeks 20, 24 / n, where 2-h pp is the postprandial glucose 2 hours after the meal (breakfast, lunch or dinner) and n the number of glucose measurements. To detect an 2 mmol/l difference in postprandial glucose, assuming 90 % power and a significance level of p=0.05, 50 patients per treatment group were required to observe a clinically significant decrease in postprandial glucose between the groups, assuming a 2.3 mmol/l standard deviation for 2-h glucose (162).
In study III, the change in HbA1c during 24 weeks between nateglinide and placebo groups was analyzed using two-way ANOVA for repeated measured followed by pairwise comparisons. Changes in body weight, insulin doses, S-ALT, fS-triglycerides, fS-LDL and fS-HDL cholesterol were analyzed similarly. For analysis of changes in diurnal glucose profiles, the mean diurnal profiles of -2 and 0 weeks, and of 20 and 24 weeks were calculated. The 8-point curves of changes in glucose concentrations and insulin doses were compared between the nateglinide and placebo groups using two-way ANOVA for repeated measurements. Pairwise comparisons between nateglinide and placebo groups at all time points were done using paired t-test corrected for the number of tests performed. For comparison of symptomatic hypoglycemic events/patient when the variance was not normally distributed, the Mann-Whitney test was used. The frequencies of hypoglycemia between the groups were analyzed using Fisher`s exact test. Data are given as mean±SEM for normally distributed, and as median followed by the interquartile range (25th and 75th percentiles) for non-normally distributed data.
In study IV, all statistical analyses were performed on an intent-to-treat basis, defined as randomized patients who received at least one injection of insulin and using a two-sided significance level of α=0.05. The primary endpoint, HbA1c change from baseline
Väitöskirja_Juurinen_sisustaitto.indd 36 21.4.2014 21:51:32
37
to the end of the study was evaluated using ANCOVA model as a response variable. The comparison of the two educational methods was evaluated using ANCOVA model. These secondary objectives were as follows: time spent by a nurse on education, physician’s time, number and duration of phone calls, change in the concentrations of S-HDL and S-LDL cholesterol and S-triglycerides, change in body weight, change in FPG, insulin dose at study end, and change in subject’s treatment satisfaction, and incidence of hypoglycemic episodes during the study.
The method of education and center were included as fixed effects, with the baseline value of HbA1c as a covariate in the ANCOVA model. Non-normally distributed data were used after logarithmic transformation. The change in the treatment satisfaction was compared between the groups using Mann-Whitney U test. The educational programs were defined as equally successful if HbA1c at the end of the study differed by < 0.5 % (8)
Väitöskirja_Juurinen_sisustaitto.indd 37 21.4.2014 21:51:32
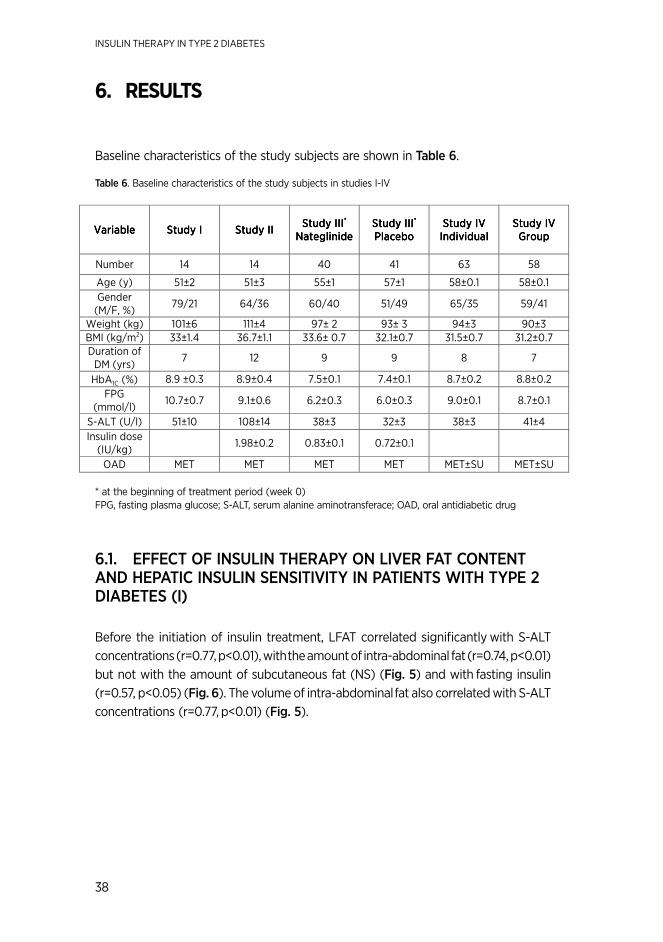
INSULIN THERAPY IN TYPE 2 DIABETES
38
6. RESULTS
Baseline characteristics of the study subjects are shown in table 6.
table 6. Baseline characteristics of the study subjects in studies I-IV
* at the beginning of treatment period (week 0) FPG, fasting plasma glucose; S-ALT, serum alanine aminotransferace; OAD, oral antidiabetic drug
6.1. effect of InsulIn therapy on lIver fat content and hepatIc InsulIn sensItIvIty In patIents wIth type 2 dIabetes (I)
Before the initiation of insulin treatment, LFAT correlated significantly with S-ALT concentrations (r=0.77, p<0.01), with the amount of intra-abdominal fat (r=0.74, p<0.01) but not with the amount of subcutaneous fat (NS) (fig. 5) and with fasting insulin (r=0.57, p<0.05) (fig. 6). The volume of intra-abdominal fat also correlated with S-ALT concentrations (r=0.77, p<0.01) (fig. 5).
VariableVariableVariableVariable Study IStudy IStudy IStudy I Study IIStudy IIStudy IIStudy II Study IIIStudy IIIStudy IIIStudy III****
NateglinideNateglinideNateglinideNateglinide Study IIIStudy IIIStudy IIIStudy III**** PlaceboPlaceboPlaceboPlacebo
Study IVStudy IVStudy IVStudy IV IndividualIndividualIndividualIndividual
Study IVStudy IVStudy IVStudy IV GroupGroupGroupGroup
Number 14 14 40 41 63 58
Age (y) 51±2 51±3 55±1 57±1 58±0.1 58±0.1
Gender (M/F, %)
79/21 64/36 60/40 51/49 65/35 59/41
Weight (kg) 101±6 111±4 97± 2 93± 3 94±3 90±3 BMI (kg/m2) 33±1.4 36.7±1.1 33.6± 0.7 32.1±0.7 31.5±0.7 31.2±0.7 Duration of
DM (yrs) 7 12 9 9 8 7
HbA1C (%) 8.9 ±0.3 8.9±0.4 7.5±0.1 7.4±0.1 8.7±0.2 8.8±0.2
FPG (mmol/l)
10.7±0.7 9.1±0.6 6.2±0.3 6.0±0.3 9.0±0.1 8.7±0.1
S-ALT (U/l) 51±10 108±14 38±3 32±3 38±3 41±4
Insulin dose (IU/kg)
1.98±0.2 0.83±0.1 0.72±0.1
OAD MET MET MET MET MET±SU MET±SU
Väitöskirja_Juurinen_sisustaitto.indd 38 21.4.2014 21:51:32

39
Figure 5. Left panels: The relationship between liver fat content, and intra-abdominal fat (p<0.001, r=0.76, top left) and subcutaneous fat (p=NS, bottom left). Right panels: The relationship between intra-abdominal fat and S-ALT (p<0.001, r=0.89, top right), and the relationship between liver fat and S-ALT (p<0.001, r=0.70, bottom right), before insulin therapy. Adapted from Juurinen et al. Am J Physiol Endocrinol Metab 292:E829-E853, 2007 (StudyI), reproduced with permission of the copyright holder.
Figure 6. Liver fat correlated with fasting insulin. Adapted from Juurinen et al. Am J Physiol Endocrinol Metab 292:E829-E853, 2007 (Study I), reproduced with permission of the copyright holder.
0 10 20 30 40
0
2500
5000
7500r=0.76p<0.001
Liver fat (%)
Intra
-ab
dom
ina
l fat
(cm
2)
0 10 20 30 400
5000
10000
15000
Liver fat (%)
Subcuta
neous fat
(cm
2)
0 2000 4000 6000 80000
25
50
75
100r=0.89,p<0.001
Intra-abdominal fat (cm 2)
S-A
LT
(m
U/l)
0 10 20 30 40
0
50
100r=0.70p<0.01
Liver fat (%)
S-A
LT
(U
/l)
Väitöskirja_Juurinen_sisustaitto.indd 39 21.4.2014 21:51:33

INSULIN THERAPY IN TYPE 2 DIABETES
40
Effects of insulin therapy on metabolic parameters and body composition are shown in table 3. The insulin dose averaged 75±10 IU/day (0.69±0.08 IU/kg, range 24–132 IU/day). HbA1c decreased from 8.9±0.3 % to 7.4±0.2 %, p=0.001. FPG decreased from 10.7±0.7 mmol/l to 8.4±0.6 mmol/l, p=0.001. Body weight increased by 3.0±1.1 kg (p<0.05) from 101±6 kg to 104±6 kg. This was mainly fat-free mass, which increased by 2.5±0.7 kg (table 7).
Table 7. Physical and biochemical characteristics of the patients with type 2 diabetes before and after 7 months of insulin therapy. Data are mean ± SEM. NS, not significant. Adapted from Juurinen et al. Am J Physiol Endocrinol Metab 292:E829-E853, 2007 (StudyI), reproduced with permission of the copyright holder.
LFAT decreased slightly but significantly by 20 % from 1 7±3 to 1 4±3 % (p=0.04) (fig. 7). LFAT and the insulin dose at 7 months were significantly correlated (r=0.63, p<0.05) (fig. 8). LFAT correlated significantly with S-ALT concentrations (r=0.77, p<0.01).
BeforeBeforeBeforeBefore AfterAfterAfterAfter PPPP----valuevaluevaluevalue
HbA1C (%) 8.9±0.3 7.4±0.2 0.001
S-ALT (U/l) 51±10 40±5 NS
Body mass index (kg/m2) 33.1±1.4 34.0±1.4 0.02
Waist-to-hip ratio 1.01±0.02 1.02±0.02 NS
Fat-free mass (kg) 69.5±3.8 72.0±4.0 0.004
Fat mass (kg) 31.8±2.6 32.3±2.6 NS
Intra-abdominal fat (dm3) 3.5±0.3 3.5±0.4 NS
Abdominal subcutaneous fat (dm3)
5.3±0.5 5.4±0.6 NS
S-adiponectin (mg/l) 4.6±0.5 4.2±0.4 NS
Väitöskirja_Juurinen_sisustaitto.indd 40 21.4.2014 21:51:33

41
figure 7. Liver fat content before and after 7 months insulin therapy. Adapted from Juurinen et al. Am J Physiol Endocrinol Metab 292:E829-E853, 2007 (Study I), reproduced with permission of the copyright holder.
figure 8. The relationship between insulin dose at 7 months and liver fat content Adapted from Juurinen et al Am J Physiol Endocrinol Metab 292:E829-E853, 2007 (Study I), copyright holder.
the changes in hepatic and peripheral insulin sensitivity, ffa concentrations, and substrate oxidation rates
Basal glucose appearance (Ra) as a measure of basal hepatic glucose production decreased from 3.42±0.20 to 2.66±0.33 mg/kg ffm∙min (p<0.05) and basal glucose disappearance (Rd) from 3.28±0.27 to 2.40±0.31 mg/kg ffm∙min (p<0.01) before and after insulin therapy.
Insulin-stimulated Rd remained unchanged (3.3±0.4 vs. 3.2±0.4 mg/kg ffm∙min,
NS), but the fraction of glucose Rd directed toward oxidation increased significantly from –7±6 % (–0.40±0.28 mg/kg ffm∙min) to 30±3 % (1.24±0.12 mg/kg ffm∙min,
p<0.001) (fig. 9).
0
10
20
30
17 %
14 %
p=0.04 %
Before After
Väitöskirja_Juurinen_sisustaitto.indd 41 21.4.2014 21:51:34
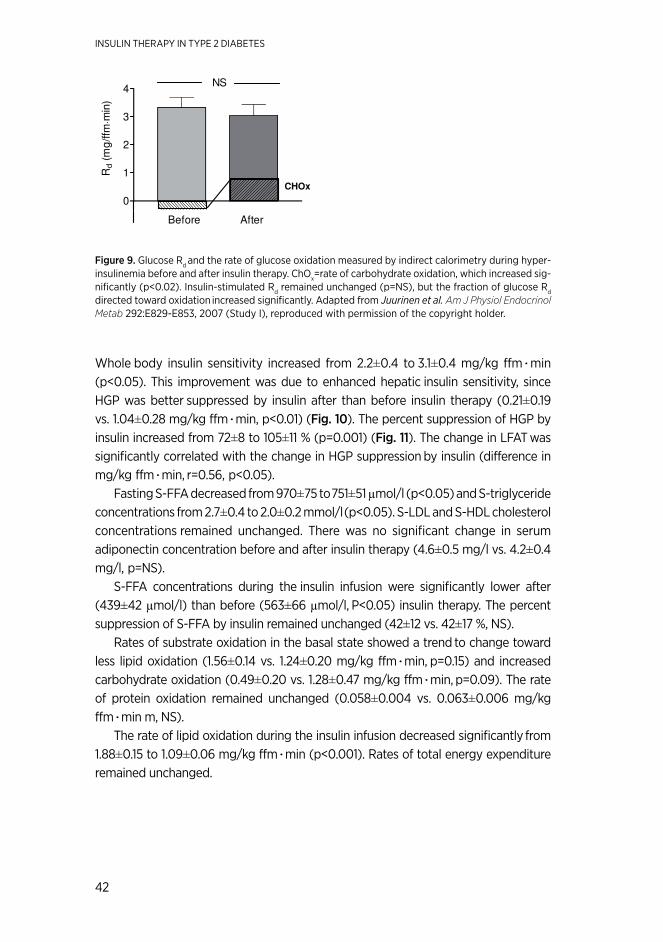
INSULIN THERAPY IN TYPE 2 DIABETES
42
figure 9. Glucose Rd and the rate of glucose oxidation measured by indirect calorimetry during hyper-insulinemia before and after insulin therapy. ChOx=rate of carbohydrate oxidation, which increased sig-nificantly (p<0.02). Insulin-stimulated Rd remained unchanged (p=NS), but the fraction of glucose Rd directed toward oxidation increased significantly. Adapted from Juurinen et al. Am J Physiol Endocrinol Metab 292:E829-E853, 2007 (Study I), reproduced with permission of the copyright holder.
Whole body insulin sensitivity increased from 2.2±0.4 to 3.1±0.4 mg/kg ffm∙min
(p<0.05). This improvement was due to enhanced hepatic insulin sensitivity, since HGP was better suppressed by insulin after than before insulin therapy (0.21±0.19 vs. 1.04±0.28 mg/kg ffm∙min, p<0.01) (fig. 10). The percent suppression of HGP by insulin increased from 72±8 to 105±11 % (p=0.001) (fig. 11). The change in LFAT was significantly correlated with the change in HGP suppression by insulin (difference in mg/kg ffm∙min, r=0.56, p<0.05).
Fasting S-FFA decreased from 970±75 to 751±51 µmol/l (p<0.05) and S-triglyceride
concentrations from 2.7±0.4 to 2.0±0.2 mmol/l (p<0.05). S-LDL and S-HDL cholesterol concentrations remained unchanged. There was no significant change in serum adiponectin concentration before and after insulin therapy (4.6±0.5 mg/l vs. 4.2±0.4 mg/l, p=NS).
S-FFA concentrations during the insulin infusion were significantly lower after (439±42 µmol/l) than before (563±66 µmol/l, P<0.05) insulin therapy. The percent suppression of S-FFA by insulin remained unchanged (42±12 vs. 42±17 %, NS).
Rates of substrate oxidation in the basal state showed a trend to change toward less lipid oxidation (1.56±0.14 vs. 1.24±0.20 mg/kg ffm∙min, p=0.15) and increased carbohydrate oxidation (0.49±0.20 vs. 1.28±0.47 mg/kg ffm∙min, p=0.09). The rate of protein oxidation remained unchanged (0.058±0.004 vs. 0.063±0.006 mg/kg ffm∙min m, NS).
The rate of lipid oxidation during the insulin infusion decreased significantly from 1.88±0.15 to 1.09±0.06 mg/kg ffm∙min (p<0.001). Rates of total energy expenditure remained unchanged.
0
1
2
3
4NS
CHOx
Before After
Rd (
mg
/ffm
⋅m
in)
Väitöskirja_Juurinen_sisustaitto.indd 42 21.4.2014 21:51:34

43
Figure 10. Endogenous hepatic glucose production during hyperinsulinemia before and after insulin thera-py. Adapted from Juurinen et al. Am J Physiol Endocrinol Metab 292:E829-E853, 2007 (Study I), reproduced with permission of the copyright holder.
Figure 11. The percent suppression of endogenous glucose Ra during the last 2 hours by insulin was used as a measure of HGP, i.e. the sensitivity of endogenous glucose production to insulin (percent suppression of endogenous Ra) before and after insulin therapy. Adapted from Juurinen et al. Am J Physiol Endocrinol Metab 292:E829-E853, 2007 (Study I), reproduced with permission of the copyright holder.
6.2. LIVER FAT CoNTENT AND HEPATIC INSULIN SENSITIVITY AFTER CoMBINATIoN oF RoSIGLITAzoNE To METFoRMIN AND INSULIN THERAPY (II)
Clinical and biochemical characteristics of the patients before and after 8 months of additional treatment with rosiglitazone are shown in table 8. HbA1c and insulin dose
decreased significantly. FPG decreased from 9.1±0.6 mmol/l to 7.9±0.5 mmol/l (P=NS). Fasting serum free insulin decreased by 48 % (table 8). Body weight increased by 3.2±0.9 kg, which was due to increases in fat-free (1.7±0.7 kg) and fat mass (1.6±0.7 kg). Subcutaneous but not intra-abdominal fat increased significantly when measured with MRI.
Liver fat content, S-ALT and S-ALP concentrations also decreased significantly (Table 8). The percent change in liver fat weakly correlated with the percent changes in S-AST (r=0.63, p=0.02) but not in S-ALT. The percent change in liver fat content
Väitöskirja_Juurinen_sisustaitto.indd 43 21.4.2014 21:51:35

INSULIN THERAPY IN TYPE 2 DIABETES
44
correlated positively with the percent change in insulin dose (r=0.66, p=0.014), and with the percent change in the suppression of endogenous glucose production (EGP) (r=0.76, p=0.003) as a direct measure of hepatic insulin sensitivity.
table 8. Clinical and biochemical characteristics of the patients with type 2 diabetes before and after 8 months of additional treatment with rosiglitazone (II).
All data are shown as mean ± SEM. Adapted from Juurinen et al. J Clin Endocrinol Metab 2008;93:118-124 (Study II), reproduced with permission of the copyright holder.
Measurements of substrate oxidation rates
Energy expenditure in the basal state decreased significantly by rosiglitazone from 83.2±3.2 J/kg ffm∙min to 78.2±2.1 J/kg ffm∙min (p=0.05) and energy expenditure in the insulin-stimulated state decreased significantly from 80.1±3.0 J/kg ffm∙min to 75.1±1.9 J/kg ffm∙min (p=0.017). The rate of lipid oxidation during insulin stimulation decreased significantly from 1.81±0.12 mg/kg ffm∙min to 1.51±0.12 mg/kg ffm∙min (p=0.04) by rosiglitazone treatment. There was no significant change in rates of carbohydrate and protein oxidation. 6.3. postprandIal hyperglycemIa after combInatIon of nateglInIde to metformIn and InsulIn therapy (III)
From total of 88 eligible patients were randomized and 81 continued to the treatment phase. Reasons for discontinuation during the optimization period included: acute myocardial infarction (n=1), unwillingness to continue within four weeks after screening visit (n=3), poor compliance, no home-monitoring data (n=2), and a too high HbA1c
BeforeBeforeBeforeBefore AfterAfterAfterAfter PPPP----valuevaluevaluevalue
Body weight 111±4 114±4 0.002
BMI (kg/m2) 36.7±1.1 37.8±1.1 0.002
Waist (cm) 120±3 125±3 NS
HbA1c (%) 8.9±0.4 7.8±0.3 0.007
Liver fat (%) 20±3 11±3 0.0002
IA fat (cm3) 3900±340 4200±360 NS
SC fat (cm3) 5500±540 6000±530 0.0002
Insulin dose (IU) 218±22 129±20 0.002
Insulin dose 1.98±0.2 1.11±0.15 0.001
fS-insulin (mU/l) 62±25 32±6 NS
fS-FFA (µmol/l) 716±52 597±50 0.04
S-ALT (U/l) 46±6 32±4 0.02
S-ALP (U/L) 108±14 67±7 0.02
Väitöskirja_Juurinen_sisustaitto.indd 44 21.4.2014 21:51:35
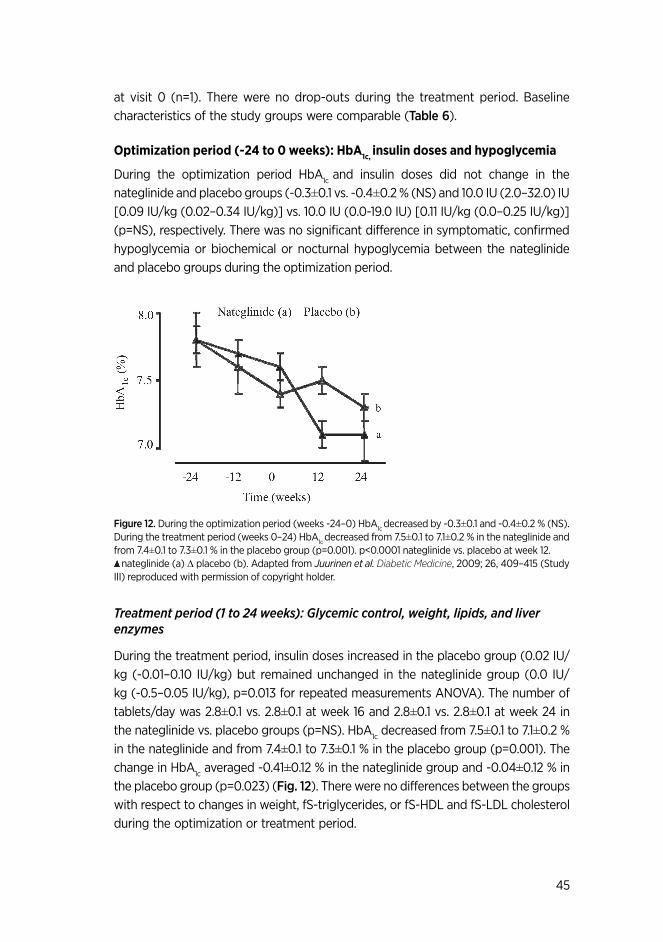
45
at visit 0 (n=1). There were no drop-outs during the treatment period. Baseline characteristics of the study groups were comparable (table 6).
optimization period (-24 to 0 weeks): HbA1c, insulin doses and hypoglycemia
During the optimization period HbA1c and insulin doses did not change in the nateglinide and placebo groups (-0.3±0.1 vs. -0.4±0.2 % (NS) and 10.0 IU (2.0–32.0) IU [0.09 IU/kg (0.02–0.34 IU/kg)] vs. 10.0 IU (0.0-19.0 IU) [0.11 IU/kg (0.0–0.25 IU/kg)] (p=NS), respectively. There was no significant difference in symptomatic, confirmed hypoglycemia or biochemical or nocturnal hypoglycemia between the nateglinide and placebo groups during the optimization period.
figure 12. During the optimization period (weeks -24–0) HbA1c decreased by -0.3±0.1 and -0.4±0.2 % (NS). During the treatment period (weeks 0–24) HbA1c decreased from 7.5±0.1 to 7.1±0.2 % in the nateglinide and from 7.4±0.1 to 7.3±0.1 % in the placebo group (p=0.001). p<0.0001 nateglinide vs. placebo at week 12. nateglinide (a) ∆ placebo (b). Adapted from Juurinen et al. Diabetic Medicine, 2009; 26, 409–415 (Study III) reproduced with permission of copyright holder.
Treatment period (1 to 24 weeks): Glycemic control, weight, lipids, and liver enzymes
During the treatment period, insulin doses increased in the placebo group (0.02 IU/kg (-0.01–0.10 IU/kg) but remained unchanged in the nateglinide group (0.0 IU/kg (-0.5–0.05 IU/kg), p=0.013 for repeated measurements ANOVA). The number of tablets/day was 2.8±0.1 vs. 2.8±0.1 at week 16 and 2.8±0.1 vs. 2.8±0.1 at week 24 in the nateglinide vs. placebo groups (p=NS). HbA1c decreased from 7.5±0.1 to 7.1±0.2 % in the nateglinide and from 7.4±0.1 to 7.3±0.1 % in the placebo group (p=0.001). The change in HbA1c averaged -0.41±0.12 % in the nateglinide group and -0.04±0.12 % in the placebo group (p=0.023) (fig. 12). There were no differences between the groups with respect to changes in weight, fS-triglycerides, or fS-HDL and fS-LDL cholesterol during the optimization or treatment period.
Väitöskirja_Juurinen_sisustaitto.indd 45 21.4.2014 21:51:36

INSULIN THERAPY IN TYPE 2 DIABETES
46
table 9. results after treatment phase.
Adapted from Juurinen et al. Diabetic Medicine, 2009; 26, 409–415 (Study III) reproduced with permission of copyright holder.
Postprandial glucose excursions and diurnal glucose profiles
The patients performed over 90 % of the recommended home-glucose measurements (91 % and 94 %, n=6126 and n=6484 for nateglinide and placebo groups, weeks 1–24). After the 24 week treatment phase, FPGs were similar between the the nateglinide and placebo groups and averaged 5.6 mmol/l [5.0–6.7 mmol/l] and 5.9 mmol/l [5.1–6.9 mmol/l], respectively (NS). PPGE, the primary endpoint, was lower in the nateglinide than in the placebo group (table 9).
Postprandial glucose (mean of all post-meal glucoses during weeks 20–24)decreased significantly from baseline (mean glucose during weeks -2 and 0) in the nateglinide group (fig. 13) and remained unchanged in the placebo group (10.6±0.4 to 9.0±0.3 mmol/l, and 10.1±0.3 to 10.0±0.3 mmol/l, p=0.001). Plasma glucose concentrations after dinner and at 10 p.m. and 4 a.m. also decreased significantly by nateglinide as compared to placebo. There were no changes in plasma glucose concentrations between the groups at baseline and at weeks 20–24 before breakfast, after breakfast, before lunch, after lunch, and before dinner.
CharaceristicsCharaceristicsCharaceristicsCharaceristics NateglinideNateglinideNateglinideNateglinide PlaceboPlaceboPlaceboPlacebo PPPP----valuevaluevaluevalue
Weight change 1.2±0.5 1.0±0.4 NS
HbA1c (%) 7.1±0.2 7.3±0.1 NS
Change in HbA1c -0.4±02 -0.04±0.1 <0.05
FPG (mmol/l 5.6±03 5.9±0.3 NS
PPGE (mmol/l 2.5±02 3.1±0.2 <0.02
Väitöskirja_Juurinen_sisustaitto.indd 46 21.4.2014 21:51:36

47
fig 13. Mean diurnal glucose profiles before (weeks -2 and 0) and during nateglinide therapy (weeks 20–24). Adapted from Juurinen et al. Diabetic Medicine, 2009; 26, 409–415 (Study III) reproduced with permission of copyright holder.
Hypoglycemia
The number of episodes of symptomatic, confirmed hypoglycemia and the number of grade 2 hypoglycemia per patient was higher in the nateglinide than the placebo group. The episodes of biochemical hypoglycemia, nocturnal, confirmed hypoglycemia were similar in both groups (table 10). The home monitored glucose at the time of hypoglycemic symptoms during the optimization period averaged 3.4±0.06 vs. 3.1 ±0.06 mmol/l in nateglinide and placebo group and during the treatment phase 3.2 ±0.05 vs. 3.3±0.06 mmol/l, respectively.
table 10. Treatment period: rates of hypoglycemia (events/pt-year), (% of patients).
Adapted from Juurinen et al. Diabetic Medicine, 2009; 26, 409-415 (Study III) reproduced with permission of copyright holder.
NateglinideNateglinideNateglinideNateglinide PlaceboPlaceboPlaceboPlacebo PPPP----valuevaluevaluevalue
Symptomatic, confirmed, plasma glucose <4.0 mmol/l
7.7 (75 %) 4.7 (54 %) <0.05
Symptomatic, confirmed, plasma glucose <3.1 mmol/l
3.4 (50 %) 1.6 (24 %) <0.05
Nocturnal, confirmed 1.6 (33 %) 0.4 (17 %) NS
Daytime, confirmed 6.1 (68 %) 4.2 (49 %) NS
Väitöskirja_Juurinen_sisustaitto.indd 47 21.4.2014 21:51:36

INSULIN THERAPY IN TYPE 2 DIABETES
48
6.4. InItIatIon of InsulIn therapy IndIvIdually or In groups (Iv)
Eligible patients (n=128) were recruited at randomization visit. Seven patients dropped out during the recruitment phase while waiting for the initiation of insulin therapy (metastasis of papillary thyroid carcinoma, retinal neovascularization, and unwillingness to continue: n=2; group formation took too long: n=1; other: n=2). Intention-to-treat population, a total of 121 patients started insulin therapy. Five dropped out from the individual education arm (poor compliance, n=2; hypoglycemia, n=1; protocol violation, n=1; new adverse event, n=1). No patients dropped out from the group education arm. The mean group size was 5.3 individuals. Of scheduled visits there was no difference in attendance between the educational groups: 95.6 % vs. 90.3 %, individual education vs. group education, p=NS.
Glycemic control
HbA1c decreased from 8.65±0.18 % to 6.89±0.14 % in patients individually treated (p<0.001) and from 8.79±0.20 % to 6.81±0.12 % in patients treated in the group education arm (p<0.001). There was no difference between the two arms. FPG decreased from 9.0±0.1 mmol/l to 6.3±0.1 mmol/l in the individual education arm. In the group treatment patients FPG decreased from 8.7±0.1 mmo/l to 6.4±0.1 mmol/l (fig. 14). No difference was found between the study arms in the percentage of patients achieving target (mean FPG: range 4.0–5.5 mmol/l): 66 % in the group treatment arm and 70 % in the individual treatment arm (p=NS).
Väitöskirja_Juurinen_sisustaitto.indd 48 21.4.2014 21:51:36

49
figure 14. Insulin dose, FPG and days with available FPGs (%) by week did not differ significantly between study arms. Adapted by Juurinen L. from Yki-Järvinen et al. Diabetes Care, 2007;30:1364–1369 (Study IV) reproduced with permission of copyright holder. Hypoglycemia
The number of episodes of symptomatic hypoglycemia in the individual education arm was 3.5 episodes/patient year and 3.1 episodes/patient year in the group treatment arm (p=NS). The percentage of symptomatic hypoglycemia was similar in the individual and group treatment arms 44 and 40 %, (p=NS). The percentage of nocturnal symptomatic hypoglycemia was 13 % in the individual and 10% in group treatment arms (p=NS). There were no episodes of severe hypoglycemia.
Väitöskirja_Juurinen_sisustaitto.indd 49 21.4.2014 21:51:37

INSULIN THERAPY IN TYPE 2 DIABETES
50
Insulin dose and other clinical characteristics at week 24
The insulin doses did not differ significantly between study arms: 62±5 IU/day in the individual arm and 56±5 IU/day in group treatment arm (p=NS) (0.64±0.05 IU/kg/day and 0.60±0.05 IU/kg/day, p=NS) (fig. 13). Weight gain was lower in the individual arm (2.2±0.4 kg) than in the group arm (3.7±0.6 kg), p<0.02. There were no differences in S-triglycerides, S-HDL cholesterol, or S-LDL cholesterol concentrations between the study groups.
Treatment satisfaction and time spent on patient education
The treatment satisfaction outcome improved significantly in both education arms. No difference was found in the responses to the individual questions of the DTSQ between study groups. The total time spent starting insulin was 48 % lower in the group than in the individual education arm. However, there was no correlation between total time spent in education and the HbA1c.
The total (scheduled in-class or over-the-phone and extra time for the group arm was 2.3±0.1 h (n=58) and 4.4±0.2 h (n=63) in the individual arm. In the group arm: 1.6±0.1 h for scheduled visits, 0.59±0.03 h for scheduled phone calls, and 0.73±0.24 h for extra visits (n=10) and 0.17±0.05 h for extra phone calls (n=11). The corresponding times in the individual arm: 3.6±0.2 h for scheduled visits, 0.59±0.03 h for scheduled phone calls, 0.59±0.2 h for extra visits (n=14) and 0.14±0.03 h for extra phone calls (n=11).
Väitöskirja_Juurinen_sisustaitto.indd 50 21.4.2014 21:51:37

51
7. DISCUSSIoN
All of the patients in Studies I-IV were obese, middle-aged patients with type 2 diabetes. BMI varied between 31 to 37 kg/m2 and duration of diabetes varied from 7 to 12 years. The glycemic control was suboptimal, mean HbA1c in the studies ranged from 7.4 % to 8.9 %. In I and IV patients were insulin-naïve and basal insulin therapy started as recommended by the current ADA/EASD treatment guideline (6). The additional OAD, rosiglitazone (II) or nateglinide (III) was combined with basal insulin therapy and MET.
Effects of insulin therapy on liver fat and hepatic insulin sensitivity (I)
LFAT decreased during chronic insulin therapy. The 20 % decrease in LFAT is less than that of PPARγ agonists have shown to decrease in studies of patients with type 2 diabetes (mean 40 %, range 32–51 %) (10). A moderate weight loss of 7 kg has decreased LFAT also more than insulin therapy did in the present study (53). Since the normal value for liver fat is maximally 5 % (20), (217), LFAT was still high and liver was insulin resistant at the end of insulin therapy.
Our result was confirmed later by Lingvay et al (218), (219). Liver fat content measured by 1H-MRS decreased 45 % by insulin therapy combined with MET in treatment-naïve patients with type 2 diabetes.
We found insulin therapy to enhance hepatic insulin sensitivity as measured from insulin suppression of HGP. Effects of insulin therapy on insulin peripheral sensitivity have previously been examined in 18 studies. In most of these studies, a significant improvement in whole body or peripheral glucose uptake was found (220), (221), (222), (223), (224), (225), (226), (227) (228), (229), (230), (231), (232), (233), (74) and the metabolic clearance rate of glucose improved significantly by insulin therapy in two studies (233), (234). We used lower insulin infusion rate than all these studies except two of them (224), (235) and our finding that insulin-stimulated glucose uptake remained unchanged is consistent with these two studies (224), (235).
The changes in LFAT correlated significantly with hepatic insulin sensitivity. We have previously made a similar finding in patients with type 2 diabetes (7) and in healthy men (2). A significant positive correlation was found between the fasting insulin concentration before insulin therapy and liver fat. Thus hepatic insulin resistance may increase the need for endogenous insulin secretion to control HGP. Consistent with these data, our result found a correlation between LFAT and the insulin dose.
Total serum adiponectin levels remained unchanged by insulin therapy and thus unlikely contributed to decreases in LFAT or enhancement of hepatic insulin sensitivity. On the other hand, S-FFA concentrations decreased possibly due to inhibition of lipolysis by insulin. This is a likely mechanism underlying reduced liver fat since FFA are the main source of intrahepatocellular triglycerides both basally and postprandially
Väitöskirja_Juurinen_sisustaitto.indd 51 21.4.2014 21:51:37

INSULIN THERAPY IN TYPE 2 DIABETES
52
(77). FFA also induce hepatic insulin resistance (93). A significant proportion of liver triglycerides originates from de novo lipogenesis in patients with NAFLD (77). Insulin therapy induces hyperinsulinemia, when diurnal insulin profiles are measured before and during basal insulin therapy (68). This would be expected to stimulate rather than inhibit lipogenesis in the liver (9). However, it seems that inhibition of peripheral lipolysis, as measured from the decrease in S-FFA is more predominat in determining the direction of change in LFAT since the latter decreased significantly. Lowering of plasma glucose concentrations by insulin therapy also reduces the substrate for de novo lipogenesis and thereby also LFAT although de novo lipogenesis was not directly measured in the present study. Ryysy et al found that LFAT correlated with insulin requirements in type 2 diabetic patients, independent of body weight (7). S-ALT also predicts insulin requirements independent of body weight (8).
Effects of addition of a PPARγ agonist on liver fat and hepatic insulin sensitivity (II)
We have previously shown that the degree of hepatic steatosis is the key determinant of insulin requirements (7) and that the PPARγ agonist rosiglitazone markedly decreases liver fat content compared to MET (10). We therefore now tested the hypothesis that rosiglitazone decreases insulin requirements in type 2 diabetic patients treated with high doses of insulin. Addition of a PPARγ agonist (rosiglitazone) to basal insulin therapy for 8 months decreased HbA1c significantly despite a 41 % reduction in the insulin dose. LFAT decreased by 46 %, and hepatic insulin sensitivity increased significantly. The decrease in LFAT correlated with a decrease in insulin requirements and an increase in hepatic insulin sensitivity. In previous studies, PPARγ agonists when combined with insulin therapy, decreased insulin doses averaged 13 IU/d (236), (237), (238), (69), (70), (71), (72), (73). In the present study, insulin requirements decreased by 90 IU/d. Patients with the highest baseline insulin doses at baseline showed the greatest relative reduction of insulin doses (238), (74).
Peripheral insulin sensitivity remained unchanged during rosiglitazone treat-ment. This was an expected finding, since low physiological insulin infusion rates are optimal for assessment of hepatic rather than peripheral insulin sensitivity (239), (23), (24), (45).
Weight gain (3.2 kg) was greater than would be expected from improve-ment in glycemic control [1.5–2.0 kg per 1 % decrease in HbA1c (240)]. The finding is similar as previous study by Balas B et al. (241). PPARγ agonists increase mainly fat mass (241). Weight gain in Study II was found to be due to an increase in fat free mass and fat mass.
Hepatic insulin sensitivity was measured by the euglycemic, hyperinsulinemic clamp technique, which is the golden standard of the method to quantitate peripheral and hepatic insulin sensitivity. However, this method is expensive and invasive. Thus, it was not feasible to study a control group. This is a potential limitation (I, II) and
Väitöskirja_Juurinen_sisustaitto.indd 52 21.4.2014 21:51:37

53
a time effect independent of insulin (I) or rosiglitazone (II) could contribute to the results. On the other hand, we have shown that addition of MET alone has no effect on LFAT and that rosiglitazone alone compared to MET decreases LFAT by 50 % in patients with type 2 diabetes (10). Effect of a short-acting insulin secretagogue on postprandial glycemia in patients treated with basal insulin and metformin (III)
Studies III and IV of the present thesis were undertaken to improve treatment of type 2 diabetic patients. In study III, we combined a short-acting insulin secretagogue, nateglinide to basal insulin with MET to improve postprandial hyperglycemia. In previous studies in patients treated with oral agents only, decreases in HbA1c by nateglinide as compared to placebo have averaged 0.5 % (161), 0.55 % (162), 0.6 % (163), 0.39 % (160), 0.7 % (165), 0.31 % (164) and 0.8 % (242). In the present study HbA1c averaged 7.4–7.5 % before addition of nateglinide or placebo to basal insulin MET combination therapy. HbA1c decreased by 0.4 %, which is comparable to that found in studies using nateglinide in patients not treated with insulin.
Regarding studies on effects of nateglinide in previously insulin-treated patients, Dashora et al (158) compared added nateglinide or placebo to previous insulin therapy. In this study 55 type 2 diabetic patients were recruited. These patients initially used mixed insulin regimens. Insulin therapy was changed to insulin glargine for one month before addition of either nateglinide or placebo for 16 weeks (158). Before addition of nategilinide or placebo, HbA1c averaged 8.2 % in the nateglinide and 8.2 % in the placebo group. The baseline-adjusted mean decrease in HbA1c by nateglinide compared to placebo averaged 0.43 % at the end of treatment. This was very similar to that in our study. This difference in HbA1c was not statistically significant (158). The decrease in HbA1c in study III by nateglinide as compared to placebo reached statistical significance most likely because of a larger sample size.
The frequency of hypoglycemia in study III was significantly higher in the nategli-nide than the placebo group. Almost half of the patients in the nateglinide group had at least one episode of symptomatic confirmed hypoglycemia. The frequencies of hy-poglycemia were greater than in the study of Dashora et al. (158). In our study home-glucose monitoring was extensive as was the recording of hypoglycemia. Glycemic control was also significantly better in our study with nateglinide (HbA1c 7.1 %) than in the study of Dashora et al (158) (HbA1c 7.8%). This could also have contributed to the higher rate of hypoglycemia in the present study than in that of Dashora et al (158), since the rate of hypoglycemia is inversely proportional to glycemic control (14).
Väitöskirja_Juurinen_sisustaitto.indd 53 21.4.2014 21:51:37

INSULIN THERAPY IN TYPE 2 DIABETES
54
Initiation of insulin (IV)
In the last study of the present thesis, we tested whether basal insulin therapy can be started in groups as well as individually in patients with type 2 diabetes. We compared,
in a randomized fashion, initiation of insulin therapy by adding basal insulin to existing oral agents individually and in groups. Both methods of insulin initiation seemed equally effective in improving glycemic control. The primary end point was difference in HbA1c between the education programs. We found that starting insulin in type 2 diabetes in groups gives as good glycemic control as individual initiation, and that excellent glycemic control can be achieved using both models. There were no differences in insulin doses, symptomatic or biochemical hypoglycemia or treatment satisfaction between the groups. However, the amount time the nurse spent in initiating insulin individually was twice that spent in initiating insulin in groups. Basal insulin therapy is possible to start with the education in groups as well as with the individual education using the simple principles of the present study. The patient education in groups is a considerable option because this saves time and resources.
We chose to start insulin therapy by adding a single injection of basal insulin to
existing oral agents. This means that only one measurement of glucose was needed for adjustment of the insulin dose. In addition, basal insulin therapy combined with OADs is associated with less weight gain and hypoglycemia than multiple insulin injection regimens (243). Glucose values were sent to the treatment center electronically, which allowed the nurse to easily follow fasting plasma glucoses over time. We achieved one of the best glycemic controls in any insulin treatment study in type 2 diabetes by the year 2007, when the study was published. The HbA1c in the group education
arm averaged 6.8 % (244), (245), (202), (8), (15), (198). Body weight increased 3.7 kg. HbA1c decreased by 2 % units in both study groups. We have previously shown that for every 1 % decrease in HbA1c, body weight increases by 2 kg. Thus the average predicted weight gain was a 4 kg, which was observed. Weight gain was slightly higher in the group than the individual education arm. The patients may have received more dietary advice during the individual education sessions than in the group. This could have contributed to the difference in weight gain between the groups. Treatment satisfaction improved similarly in both educational groups. This was observed although participation in the group as compared to the individual arm required less time of the patient.
This thesis is based on studies published between year 2007 and 2009. Since then, newer OADs, DPP4-inhibitors and GLP-1 agonists, have been increasingly used instead of SUs, glindes and TZDs. Rosiglitazone was withdrawn due to an increase in cardiovascular events, especially heart failure (169). However, there are no data to demonstrate superiority of these newer agents. Indeed, in two cardiovascular outcome studies, the effects of alogliptin (246) and saxaglipitin (247) were modest (0.3 % decrease in HbA1c compared to placebo) and there was no benefit with respect cardiovascular disease, the main complication of type 2 diabetes. In the other
Väitöskirja_Juurinen_sisustaitto.indd 54 21.4.2014 21:51:37
55
study, the incidence of heart failure increased by 30 % in the DPP-4 as compared to the placebo group (247).
Although use of TZDs has decreased, recent studies have shown pioglitazone to have beneficial effects on NASH (61), (66), (248). Thus, although use of TZDs were initially restricted to patients with normal liver enzymes, because of the fear of liver toxicity after troglitazone, which caused liver failure (168), TZDs are now recommended to be used in patients with NASH (249).
Altogether, basal insulin therapy remains one of the basic options to treat hyperglycemia in patients with type 2 diabetes due to the proceeding beta-cell failure and hepatic insulin resistance.
Väitöskirja_Juurinen_sisustaitto.indd 55 21.4.2014 21:51:37

INSULIN THERAPY IN TYPE 2 DIABETES
56
8. SUMMARY AND CoNCLUSIoNS
The first two studies of the present thesis (I and II) were undertaken to understand hepatic effects of insulin and a PPARγ agonist in patients with type 2 diabetes. It was shown that insulin therapy increases hepatic insulin sensitivity and significantly decreases liver fat content in obese type 2 diabetic patients. These changes were associated with decreases in circulating FFA, the predominant substrate of intrahepatocellular triglycerides synthesis. Decreases in glucose might also have contributed to the decrease in liver intrahepatocellular triglycerides, although we did not measure the rate of de novo lipogenesis. These data show that subcutaneous insulin therapy has beneficial effect on the liver.
In study II, it was shown that rosiglitazone decreased insulin requirements by 41 % and liver fat content by 47 %. It also significantly improved hepatic insulin sensitivity and glycemic control in type 2 diabetic patients who were poorly controlled despite using unusually high doses of insulin. However, this improvement was obtained at the expence of weight gain.
Studies III and IV of the present thesis were undertaken to improve treatment of type 2 diabetic patients. We hypothesized that addition of nateglinide might improve postprandial hyperglycemia in patients treated with basal insulin. We found that addition of nateglinide to basal insulin with MET lowered postprandial glucose excursions significantly compared to placebo and improved average glycemic control (HbA1c) by 0.4 %. This relatively small improvement was obtained at the expense of increased hypoglycemia and necessitated administration of three daily doses of nateglinide, which is cumbersome.
In the last study of the present thesis, we tested whether basal insulin therapy can be started in groups as well as individually in patients with type 2 diabetes. We found that starting insulin in type 2 diabetes in groups gives as good glycemic control as individual initiation, and that excellent glycemic control can be achieved using both models.
Väitöskirja_Juurinen_sisustaitto.indd 56 21.4.2014 21:51:37

57
9. ACKNoWLEDGEMENTS
The work for this thesis was carried out at the Department of Medicine, Division of Diabetes, University of Helsinki during the years from 2004 to 2011.
I owe my greatest gratitude to Professor Hannele Yki-Järvinen for her excellent supervision and research facilities. I have been privileged to work under her superb, word-class supervision. Her scientific knowledge and extensive experience in the field of type 2 diabetes opened me a new world in understanding the pathogenesis of diabetes. Especially I appreciate her ability to step in future, to make important and clinically relevant questions and find answers of uncompromisingly high academic standard. The encouraging attitude during the hardest times has carried this work forward.
I am most grateful to docent Saara Metso, and professor Jussi Pihlajamäki, for their highly expert review of the manuscript. Their thorough work and constructive comments and valuable criticism are greatly appreciated.
I thank professor Aila Rissanen for encouraging support during my work.I have been fortunate to have many wonderful co-workers in the “Yki-team”. I want
to thank all colleagues I have had the honour to work with during these years Drs Robert Bergholm, Anja Cornèr, Janne Makkonen, Ksenia Sevastianova, Jussi Sutinen, Marjo Tamminen, Mirja Tiikkainen, docents Anna Kotronen, Kirsi Pietiläinen, and Jukka Westerbacka. Especially I want to thank Dr Mirja Tiikkainen, who taught me accurately the details of the insulin clamp - technique and guided me at the beginning of the research work. Docent Jukka Westerbacka and Dr Robert Bergholm are warmly thanked for skillful guidance in scientific work. I appreciate your kind attitude and support. I thank Dr Jussi Sutinen, you thought me how exact one should be when analyzing data, or dealing with all scientific work. I thank docent Anna Kotronen for your help especially during the writing process, and for all the support and good company. I thank Dr Ksenia Sevastianova for the help and advices you gave me during these years. Your vivid temperament delighted me.
My special thanks to our research nurses Katja Sohlo, Mia Urjansson, Pirkko Salmi, Anne Salo and Maarit Toivonen for excellent technical knowledge and help. I could not manage without your high-quality assistance. It was an honour to do the teamwork with you. The radiographer Pentti Pölönen I appreciate your technical assistance. Helena Laakkonen-Isoza, Maria Puupponen, Maija Lepistö and Marja Aarnio are greatly appreciated for their secreterial skills and guidance. I want to extend my thanks to Hannele Hildèn, Helinä Perttunen-Nio, Virve Naatti and Leena Kaipiainen. All together you created friendly atmosphere at floor 4. I started my research at Minerva and I would like to thank Tuulikki Nyman, Carita Kortman and docent Vesa Olkkonen for
Väitöskirja_Juurinen_sisustaitto.indd 57 21.4.2014 21:51:37
INSULIN THERAPY IN TYPE 2 DIABETES
58
guidance and help during these years. I thank Dr Marit Granèr for assessing the echocardiography and Antti Hakkarainen for analysis of 1 H-MRS.
My sincere thanks to other collaborators, Drs. Markku Vähätalo, Juha Saltevo, Tarja Teikari-Myyrä, Tuula Kock, Helena Lanki, Eeva Leppävuori, Katriina Nikkilä, Ritva Kauppinen-Mäkelin, Sanni Lahdenperä, Gil Nijpels, Michael Alvarsson, Kerstin Brismar, Tord Bystedt, Ian Caldwell and Melanie Davis.
I thank warmly my superior Kalevi Oksanen for the supportive attitude and for the possibility of the long research leave from clinical work. I thank my past and current colleagues at Meilahti and at Central Hospital of Kanta-Häme for friendship, especially docents Satu Vehkavaara, Nina Matikainen and Anja Orvola.
I express my deepest appreciation to all patients and volunteers who participated in these studies.
This work was financially supported from the Finnish Medical Society Duodecim.During my work as a research fellow my beloved father and my godfather died. I
was depressed and I had to be responsible of many practical and emotional challenges, to which I was poorly prepared. With the support of my husband, Jarmo, I coped with all difficulties. There are no words enough to thank you for the partnership, patience and love you have given to me during all these years we have lived together. Finally, I wish to thank our daughters Anni and Pilvi. You have grown up to young adults during my research years. Thank you for understanding and love.
Väitöskirja_Juurinen_sisustaitto.indd 58 21.4.2014 21:51:37

59
references
1. Bedogni G, Miglioli L, Masutti F, Tiribelli C, Marchesini G, Bellentani S (2005) Prevalence of and risk factors for nonalcoholic fatty liver disease: The dionysos nutrition and liver study. Hepatology 42(1):44–52
2. Seppala-Lindroos A, Vehkavaara S, Hakkinen AM, Goto T, Westerbacka J, Sovijarvi A, Halavaara J, Yki-Jarvinen H (2002) Fat accumulation in the liver is associated with defects in insulin suppression of glucose production and serum free fatty acids independent of obesity in normal men. J Clin Endocrinol Metab 87(7):3023–3028
3. Adiels M, Westerbacka J, Soro–Paavonen A, Hakkinen AM, Vehkavaara S, Caslake MJ, Packard C, Olofsson SO, Yki-Jarvinen H, Taskinen MR, Boren J (2007) Acute suppression of VLDL(1) secretion rate by insulin is associated with hepatic fat content and insulin resistance. Diabetologia 50(11):2356–2365
4. Adiels M, Taskinen MR, Packard C, Caslake MJ, Soro-Paavonen A, Westerbacka J, Vehkavaara S, Hakkinen A, Olofsson SO, Yki-Jarvinen H, Boren J (2006) Overproduction of large VLDL particles is driven by increased liver fat content in man. Diabetologia 49(4):755–765
5. Valle T, Koivisto VA, Reunanen A, Kangas T, Rissanen A (1999) Glycemic control in patients with diabetes in finland. Diabetes Care 22(4):575–579
6. Inzucchi SE, Bergenstal RM, Buse JB, Diamant M, Ferrannini E, Nauck M, Peters AL, Tsapas A, Wender R, Matthews DR, American Diabetes Association (ADA), European Association for the Study of Diabetes (EASD) (2012) Management of hyperglycemia in type 2 diabetes: A patient-centered approach: Position statement of the american diabetes association (ADA) and the european association for the study of diabetes (EASD). Diabetes Care 35(6):1364–1379
7. Ryysy L, Hakkinen AM, Goto T, Vehkavaara S, Westerbacka J, Halavaara J, Yki-Jarvinen H (2000) Hepatic fat content and insulin action on free fatty acids and glucose metabolism rather than insulin absorption are associated with insulin requirements during insulin therapy in type 2 diabetic patients. Diabetes 49(5):749–758
8. Yki-Jarvinen H, Kauppinen–Makelin R, Tiikkainen M, Vahatalo M, Virtamo H, Nikkila K, Tulokas T, Hulme S, Hardy K, McNulty S, Hanninen J, Levanen H, Lahdenpera S, Lehtonen R, Ryysy L (2006) Insulin glargine or NPH combined with metformin in type 2 diabetes: The LANMET study. Diabetologia 49(3):442–451
9. Matsuda M, Korn BS, Hammer RE, Moon YA, Komuro R, Horton JD, Goldstein JL, Brown MS, Shimomura I (2001) SREBP cleavage-activating protein (SCAP) is required for increased lipid synthesis in liver induced by cholesterol deprivation and insulin elevation. Genes Dev 15(10):1206–1216
10. Tiikkainen M, Hakkinen AM, Korsheninnikova E, Nyman T, Makimattila S, Yki-Jarvinen H. 2004. Effects of rosiglitazone and metformin on liver fat content, hepatic insulin resistance, insulin clearance, and gene expression in adipose tissue in patients with type 2 diabetes. Diabetes 53(8):2169–2176
11. Bajaj M, Suraamornkul S, Pratipanawatr T, Hardies LJ, Pratipanawatr W, Glass L, Cersosimo E, Miyazaki Y, DeFronzo RA (2003) Pioglitazone reduces hepatic fat content and augments splanchnic glucose uptake in patients with type 2 diabetes. Diabetes 52(6):1364–1370
12. Riddle MC, Rosenstock J, Gerich J, Insulin Glargine 4002 Study Investigators. (2003) The treat-to-target trial: Randomized addition of glargine or human NPH insulin to oral therapy of type 2 diabetic patients. Diabetes Care 26(11):3080–3086
13. Hermansen K, Davies M, Derezinski T, Martinez Ravn G, Clauson P, Home P (2006) A 26-week, randomized, parallel, treat-to-target trial comparing insulin detemir with NPH insulin as add-on therapy to oral glucose-lowering drugs in insulin-naive people with type 2 diabetes. Diabetes Care 29(6):1269–1274
14. Hollander PA, Schwartz SL, Gatlin MR, Haas SJ, Zheng H, Foley JE, Dunning BE (2001) Importance of early insulin secretion: Comparison of nateglinide and glyburide in previously diet-treated patients with type 2 diabetes. Diabetes Care 24(6):983–988
Väitöskirja_Juurinen_sisustaitto.indd 59 21.4.2014 21:51:37

INSULIN THERAPY IN TYPE 2 DIABETES
60
15. Yki-Jarvinen H, Ryysy L, Nikkila K, Tulokas T, Vanamo R, Heikkila M (1999) Comparison of bedtime insulin regimens in patients with type 2 diabetes mellitus. A randomized, controlled trial. Ann Intern Med 130(5):389–396
16. Yki-Jarvinen H (2010) Insulin resistance in type 2 diabetes. Textbook of Diabetes, Wiley–Blackwell Publishing 4th edition(1):174
17. Alberti KG, Eckel RH, Grundy SM, Zimmet PZ, Cleeman JI, Donato KA, Fruchart JC, James WP, Loria CM, Smith SC Jr. (2009) International Diabetes Federation Task Force on Epidemiology and Prevention, Hational Heart, Lung, and Blood Institute, American Heart Association, World Heart Federation, International Atherosclerosis Society, International Association for the Study of Obesity 2009 Harmonizing the metabolic syndrome: A joint interim statement of the international diabetes federation task force on epidemiology and prevention; National Heart, Lung, and Blood Institute; American Heart Association; World Heart Federation; International Atherosclerosis Society; and International Association for the Study of Obesity Circulation 120(16):1640–1645
18. Farrell GC, Larter CZ (2006) Nonalcoholic fatty liver disease: From steatosis to cirrhosis. Hepatology 43(2 Suppl 1):S99–S112
19. Neuschwander-Tetri BA, Caldwell SH (2003) Nonalcoholic steatohepatitis: Summary of an AASLD single topic conference. Hepatology 37(5):1202–1219
20. Szczepaniak LS, Nurenberg P, Leonard D, Browning JD, Reingold JS, Grundy S, Hobbs HH, Dobbins RL (2005) Magnetic resonance spectroscopy to measure hepatic triglyceride content: Prevalence of hepatic steatosis in the general population. Am J Physiol Endocrinol Metab 288(2):E462–468
21. Kotronen A, Westerbacka J, Bergholm R, Pietilainen KH, Yki-Jarvinen H (2007) Liver fat in the metabolic syndrome. J Clin Endocrinol Metab 92(9):3490–3497
22. DeFronzo RA, Tobin JD, Andres R (1979) Glucose clamp technique: A method for quantifying insulin secretion and resistance. Am J Physiol 237(3):E214–223
23. DeFronzo RA, Ferrannini E, Hendler R, Felig P, Wahren J (1983) Regulation of splanchnic and peripheral glucose uptake by insulin and hyperglycemia in man. Diabetes 32(1):35–45
24. Rizza RA, Mandarino LJ, Gerich JE (1981) Dose-response characteristics for effects of insulin on production and utilization of glucose in man. Am J Physiol 240(6):E630–639
25. Yki-Jarvinen H (1993) Action of insulin on glucose metabolism in vivo. Baillieres Clin Endocrinol Metab 7(4):903–927
26. Steele R (1959) Influences of glucose loading and of injected insulin on hepatic glucose output. Ann N Y Acad Sci 82:420–430
27. Nurjhan N, Consoli A, Gerich J (1992) Increased lipolysis and its consequences on gluconeogenesis in non–insulin–dependent diabetes mellitus. J Clin Invest 89(1):169–175
28. Puhakainen I, Koivisto VA, Yki-Jarvinen H (1992) Lipolysis and gluconeogenesis from glycerol are increased in patients with noninsulin–dependent diabetes mellitus. J Clin Endocrinol Metab 75(3):789–794
29. Virtanen KA, Lonnroth P, Parkkola R, Peltoniemi P, Asola M, Viljanen T, Tolvanen T, Knuuti J, Ronnemaa T, Huupponen R, Nuutila P (2002) Glucose uptake and perfusion in subcutaneous and visceral adipose tissue during insulin stimulation in nonobese and obese humans. J Clin Endocrinol Metab 87(8):3902–3910
30. Nuutila P, Koivisto VA, Knuuti J, Ruotsalainen U, Teras M, Haaparanta M, Bergman J, Solin O, Voipio-Pulkki LM, Wegelius U (1992) Glucose-free fatty acid cycle operates in human heart and skeletal muscle in vivo. J Clin Invest 89(6):1767–1774
31. Hallsten K, Yki-Jarvinen H, Peltoniemi P, Oikonen V, Takala T, Kemppainen J, Laine H, Bergman J, Bolli GB, Knuuti J, Nuutila P (2003) Insulin- and exercise-stimulated skeletal muscle blood flow and glucose uptake in obese men. Obes Res 11(2):257–265
32. Iozzo P, Turpeinen AK, Takala T, Oikonen V, Solin O, Ferrannini E, Nuutila P, Knuuti J (2003) Liver uptake of free fatty acids in vivo in humans as determined with 14(R, S)-[18F]fluoro-6-thia-heptadecanoic acid and PET. Eur J Nucl Med Mol Imaging 30(8):1160–1164
Väitöskirja_Juurinen_sisustaitto.indd 60 21.4.2014 21:51:38

61
33. Reaven GM (1983) Insulin resistance in noninsulin-dependent diabetes mellitus. Does it exist and can it be measured? Am J Med 74(1A):3–17
34. Shen SW, Reaven GM, Farquhar JW (1970) Comparison of impedance to insulin-mediated glucose uptake in normal subjects and in subjects with latent diabetes. J Clin Invest 49(12):2151–2160
35. Harano Y, Hidaka H, Takatsuki K, Ohgaku S, Haneda M, Motoi S, Kawagoe K, Shigeta Y, Abe H (1978) Glucose, insulin, and somatostatin infusion for the determination of insulin sensitivity in vivo. Metabolism 27(9 Suppl 1):1449–1452
36. Bergman RN, Finegood DT, Ader M (1985) Assessment of insulin sensitivity in vivo. Endocr Rev 6(1):45–86
37. Monzillo LU, Hamdy O (2003) Evaluation of insulin sensitivity in clinical practice and in research settings. Nutr Rev 61(12):397–412
38. Kotronen A, Vehkavaara S, Seppala-Lindroos A, Bergholm R, Yki-Jarvinen H (2007) Effect of liver fat on insulin clearance. Am J Physiol Endocrinol Metab 293(6):E1709–1715
39. Wallace TM, Levy JC, Matthews DR (2004) Use and abuse of HOMA modeling. Diabetes Care 27(6):1487–1495
40. Rothman DL, Magnusson I, Katz LD, Shulman RG, Shulman GI (1991) Quantitation of hepatic glycogenolysis and gluconeogenesis in fasting humans with 13C NMR. Science 254(5031):573–576
41. Landau BR, Wahren J, Chandramouli V, Schumann WC, Ekberg K, Kalhan SC (1996) Contributions of gluconeogenesis to glucose production in the fasted state. J Clin Invest 98(2):378–385
42. Gastaldelli A, Miyazaki Y, Pettiti M, Buzzigoli E, Mahankali S, Ferrannini E, DeFronzo RA (2004) Separate contribution of diabetes, total fat mass, and fat topography to glucose production, gluconeogenesis, and glycogenolysis. J Clin Endocrinol Metab 89(8):3914–3921
43. DeFronzo RA, Ferrannini E (1987) Regulation of hepatic glucose metabolism in humans. Diabetes Metab Rev 3(2):415–459
44. Gastaldelli A, Toschi E, Pettiti M, Frascerra S, Quinones-Galvan A, Sironi AM, Natali A, Ferrannini E (2001) Effect of physiological hyperinsulinemia on gluconeogenesis in nondiabetic subjects and in type 2 diabetic patients. Diabetes 50(8):1807–1812
45. Yki-Jarvinen H, Young AA, Lamkin C, Foley JE (1987) Kinetics of glucose disposal in whole body and across the forearm in man. J Clin Invest 79(6):1713–1719
46. Malmstrom R, Packard CJ, Caslake M, Bedford D, Stewart P, Yki-Jarvinen H, Shepherd J, Taskinen MR (1998) Effects of insulin and acipimox on VLDL1 and VLDL2 apolipoprotein B production in normal subjects. Diabetes 47(5):779–787
47. Marchesini G, Brizi M, Bianchi G, Tomassetti S, Bugianesi E, Lenzi M, McCullough AJ, Natale S, Forlani G, Melchionda N (2001) Nonalcoholic fatty liver disease: A feature of the metabolic syndrome. Diabetes 50(8):1844–1850
48. Mitrakou A, Kelley D, Veneman T, Jenssen T, Pangburn T, Reilly J, Gerich J (1990) Contribution of abnormal muscle and liver glucose metabolism to postprandial hyperglycemia in NIDDM. Diabetes 39(11):1381–1390
49. Kotronen A, Juurinen L, Tiikkainen M, Vehkavaara S, Yki-Jarvinen H (2008) Increased liver fat, impaired insulin clearance, and hepatic and adipose tissue insulin resistance in type 2 diabetes. Gastroenterology 135(1):122–130
50. Goldberg IJ, Ginsberg HN (2006) Ins and outs modulating hepatic triglyceride and development of nonalcoholic fatty liver disease. Gastroenterology 130(4):1343–1346
51. Kechagias S, Ernersson A, Dahlqvist O, Lundberg P, Lindstrom T, Nystrom FH (2008) Fast food based hyper-alimentation can induce rapid and profound elevation of serum alanine aminotransferase in healthy subjects. Gut 57(5):649–654
Väitöskirja_Juurinen_sisustaitto.indd 61 21.4.2014 21:51:38

INSULIN THERAPY IN TYPE 2 DIABETES
62
52. Sevastianova K, Santos A, Kotronen A, Hakkarainen A, Makkonen J, Silander K, Peltonen M, Romeo S, Lundbom J, Lundbom N, Olkkonen VM, Gylling H, Fielding BA, Rissanen A, Yki-Jarvinen H (2012) Effect of short-term carbohydrate overfeeding and long–term weight loss on liver fat in overweight humans. Am J Clin Nutr 96(4):727–734
53. Tiikkainen M, Bergholm R, Vehkavaara S, Rissanen A, Hakkinen AM, Tamminen M, Teramo K, Yki-Jarvinen H (2003) Effects of identical weight loss on body composition and features of insulin resistance in obese women with high and low liver fat content. Diabetes 52(3):701–707
54. Larson–Meyer DE, Heilbronn LK, Redman LM, Newcomer BR, Frisard MI, Anton S, Smith SR, Alfonso A, Ravussin E (2006) Effect of calorie restriction with or without exercise on insulin sensitivity, beta–cell function, fat cell size, and ectopic lipid in overweight subjects. Diabetes Care 29(6):1337–1344
55. Viljanen AP, Iozzo P, Borra R, Kankaanpaa M, Karmi A, Lautamaki R, Jarvisalo M, Parkkola R, Ronnemaa T, Guiducci L, Lehtimaki T, Raitakari OT, Mari A, Nuutila P (2009) Effect of weight loss on liver free fatty acid uptake and hepatic insulin resistance. J Clin Endocrinol Metab 94(1):50–55
56. Petersen KF, Dufour S, Befroy D, Lehrke M, Hendler RE, Shulman GI (2005) Reversal of nonalcoholic hepatic steatosis, hepatic insulin resistance, and hyperglycemia by moderate weight reduction in patients with type 2 diabetes. Diabetes 54(3):603–608
57. Tamura Y, Tanaka Y, Sato F, Choi JB, Watada H, Niwa M, Kinoshita J, Ooka A, Kumashiro N, Igarashi Y, Kyogoku S, Maehara T, Kawasumi M, Hirose T, Kawamori R (2005) Effects of diet and exercise on muscle and liver intracellular lipid contents and insulin sensitivity in type 2 diabetic patients. J Clin Endocrinol Metab 90(6):3191–3196
58. Yki-Jarvinen H (2004) Thiazolidinediones. N Engl J Med 351(11):1106–1118
59. Boden G, Homko C, Mozzoli M, Showe LC, Nichols C, Cheung P (2005) Thiazolidinediones upregulate fatty acid uptake and oxidation in adipose tissue of diabetic patients. Diabetes 54(3):880–885
60. Mayerson AB, Hundal RS, Dufour S, Lebon V, Befroy D, Cline GW, Enocksson S, Inzucchi SE, Shulman GI, Petersen KF (2002) The effects of rosiglitazone on insulin sensitivity, lipolysis, and hepatic and skeletal muscle triglyceride content in patients with type 2 diabetes. Diabetes 51(3):797–802
61. Belfort R, Harrison SA, Brown K, Darland C, Finch J, Hardies J, Balas B, Gastaldelli A, Tio F, Pulcini J, Berria R, Ma JZ, Dwivedi S, Havranek R, Fincke C, DeFronzo R, Bannayan GA, Schenker S, Cusi K (2006) A placebo-controlled trial of pioglitazone in subjects with nonalcoholic steatohepatitis. N Engl J Med 355(22):2297–2307
62. Caldwell SH, Patrie JT, Brunt EM, Redick JA, Davis CA, Park SH, Neuschwander-Tetri BA (2007) The effects of 48 weeks of rosiglitazone on hepatocyte mitochondria in human nonalcoholic steatohepatitis. Hepatology 46(4):1101–1107
63. Miyazaki Y, Mahankali A, Wajcberg E, Bajaj M, Mandarino LJ, DeFronzo RA (2004) Effect of pioglitazone on circulating adipocytokine levels and insulin sensitivity in type 2 diabetic patients. J Clin Endocrinol Metab 89(9):4312–4319
64. Kadowaki T, Yamauchi T (2005) Adiponectin and adiponectin receptors. Endocr Rev 26(3):439–451
65. Ratziu V, Charlotte F, Bernhardt C, Giral P, Halbron M, Lenaour G, Hartmann-Heurtier A, Bruckert E, Poynard T, LIDO Study Group (2010) Long-term efficacy of rosiglitazone in nonalcoholic steatohepatitis: Results of the fatty liver improvement by rosiglitazone therapy (FLIRT 2) extension trial. Hepatology 51(2):445–453
66. Aithal GP, Thomas JA, Kaye PV, Lawson A, Ryder SD, Spendlove I, Austin AS, Freeman JG, Morgan L, Webber J (2008) Randomized, placebo-controlled trial of pioglitazone in nondiabetic subjects with nonalcoholic steatohepatitis. Gastroenterology 135(4):1176–1184
67. Chalasani NP, Sanyal AJ, Kowdley KV, Robuck PR, Hoofnagle J, Kleiner DE, Unalp A, Tonascia J, NASH CRN Research Group (2009) Pioglitazone versus vitamin E versus placebo for the treatment of non–diabetic patients with non–alcoholic steatohepatitis: PIVENS trial design. Contemp Clin Trials 30(1):88–96
Väitöskirja_Juurinen_sisustaitto.indd 62 21.4.2014 21:51:38

63
68. Yki-Jarvinen H, Kauppila M, Kujansuu E, Lahti J, Marjanen T, Niskanen L, Rajala S, Ryysy L, Salo S, Seppala P (1992) Comparison of insulin regimens in patients with non–insulin–dependent diabetes mellitus. N Engl J Med 327(20):1426–1433
69. Davidson JA, Perez A, Zhang J, The Pioglitazone 343 Study Group (2006) Addition of pioglitazone to stable insulin therapy in patients with poorly controlled type 2 diabetes: Results of a double–blind, multicentre, randomized study. Diabetes Obes Metab 8(2):164–174
70. Raskin P, Rendell M, Riddle MC, Dole JF, Freed MI, Rosenstock J, Rosiglitazone Clinical Trials Study Group (2001) A randomized trial of rosiglitazone therapy in patients with inadequately controlled insulin–treated type 2 diabetes. Diabetes Care 24(7):1226–1232
71. Berhanu P, Perez A, Yu S (2007) Effect of pioglitazone in combination with insulin therapy on glycaemic control, insulin dose requirement and lipid profile in patients with type 2 diabetes previously poorly controlled with combination therapy. Diabetes Obes Metab 9(4):512–520
72. Garg R, Gopal J, Jones GR (2007) Rosiglitazone: Safety and efficacy in combination with insulin in poorly controlled type 2 diabetes mellitus patients treated with insulin alone. J Diabetes Complications 21(1):1–6
73. Poulsen MK, Henriksen JE, Hother-Nielsen O, Beck-Nielsen H (2003) The combined effect of triple therapy with rosiglitazone, metformin, and insulin aspart in type 2 diabetic patients. Diabetes Care 26(12):3273–3279
74. Yu JG, Kruszynska YT, Mulford MI, Olefsky JM (1999) A comparison of troglitazone and metformin on insulin requirements in euglycemic intensively insulin-treated type 2 diabetic patients. Diabetes 48(12):2414–2421
75. Gupta AK, Bray GA, Greenway FL, Martin CK, Johnson WD, Smith SR (2010) Pioglitazone, but not metformin, reduces liver fat in type-2 diabetes mellitus independent of weight changes. J Diabetes Complications 24(5):289–296
76. Teranishi T, Ohara T, Maeda K, Zenibayashi M, Kouyama K, Hirota Y, Kawamitsu H, Fujii M, Sugimura K, Kasuga M (2007) Effects of pioglitazone and metformin on intracellular lipid content in liver and skeletal muscle of individuals with type 2 diabetes mellitus. Metabolism 56(10):1418–1424
77. Donnelly KL, Smith CI, Schwarzenberg SJ, Jessurun J, Boldt MD, Parks EJ (2005) Sources of fatty acids stored in liver and secreted via lipoproteins in patients with nonalcoholic fatty liver disease. J Clin Invest 115(5):1343–1351
78. Lewis GF, Carpentier A, Adeli K, Giacca A (2002) Disordered fat storage and mobilization in the pathogenesis of insulin resistance and type 2 diabetes. Endocr Rev 23(2):201–229
79. Yki-Jarvinen H (2001) Combination therapies with insulin in type 2 diabetes. Diabetes Care 24(4):758–767
80. Makkonen J, Pietilainen KH, Rissanen A, Kaprio J, Yki-Jarvinen H (2009) Genetic factors contribute to variation in serum alanine aminotransferase activity independent of obesity and alcohol: A study in monozygotic and dizygotic twins. J Hepatol 50(5):1035–1042
81. Browning JD, Horton JD (2004) Molecular mediators of hepatic steatosis and liver injury. J Clin Invest 114(2):147–152
82. Petersen KF, Dufour S, Feng J, Befroy D, Dziura J, Dalla Man C, Cobelli C, Shulman GI (2006) Increased prevalence of insulin resistance and nonalcoholic fatty liver disease in Asian-Indian men. Proc Natl Acad Sci USA 103(48):18273–18277
83. Kotronen A, Johansson LE, Johansson LM, Roos C, Westerbacka J, Hamsten A, Bergholm R, Arkkila P, Arola J, Kiviluoto T, Fisher RM, Ehrenborg E, Orho-Melander M, Ridderstrale M, Groop L, Yki-Jarvinen H (2009) A common variant in PNPLA3, which encodes adiponutrin, is associated with liver fat content in humans. Diabetologia 52(6):1056–1060
Väitöskirja_Juurinen_sisustaitto.indd 63 21.4.2014 21:51:38

INSULIN THERAPY IN TYPE 2 DIABETES
64
84. Sookoian S, Pirola CJ (2011) Meta-analysis of the influence of I148M variant of patatin-like phospholipase domain containing 3 gene (PNPLA3) on the susceptibility and histological severity of nonalcoholic fatty liver disease. Hepatology 53(6):1883–1894
85. Duncan RE, Ahmadian M, Jaworski K, Sarkadi-Nagy E, Sul HS (2007) Regulation of lipolysis in adipocytes. Annu Rev Nutr 27:79–101
86. Bays H, Mandarino L, DeFronzo RA (2004) Role of the adipocyte, free fatty acids, and ectopic fat in pathogenesis of type 2 diabetes mellitus: Peroxisomal proliferator–activated receptor agonists provide a rational therapeutic approach. J Clin Endocrinol Metab 89(2):463–478
87. Rabe K, Lehrke M, Parhofer KG, Broedl UC (2008) Adipokines and insulin resistance. Mol Med 14(11–12):741–751
88. Kadowaki T, Yamauchi T (2011) Adiponectin receptor signaling: A new layer to the current model. Cell Metab 13(2):123–124
89. Xu H, Barnes GT, Yang Q, Tan G, Yang D, Chou CJ, Sole J, Nichols A, Ross JS, Tartaglia LA, Chen H (2003) Chronic inflammation in fat plays a crucial role in the development of obesity-related insulin resistance. J Clin Invest 112(12):1821–1830
90. Frayn KN, Arner P, Yki-Jarvinen H (2006) Fatty acid metabolism in adipose tissue, muscle and liver in health and disease. Essays Biochem 42:89–103
91. Ferrannini E, Barrett EJ, Bevilacqua S, DeFronzo RA (1983) Effect of fatty acids on glucose production and utilization in man. J Clin Invest 72(5):1737–1747
92. Groop LC, Saloranta C, Shank M, Bonadonna RC, Ferrannini E, DeFronzo RA (1991) The role of free fatty acid metabolism in the pathogenesis of insulin resistance in obesity and noninsulin-dependent diabetes mellitus. J Clin Endocrinol Metab 72(1):96–107
93. Korenblat KM, Fabbrini E, Mohammed BS, Klein S (2008) Liver, muscle, and adipose tissue insulin action is directly related to intrahepatic triglyceride content in obese subjects. Gastroenterology 134(5):1369–1375
94. Cinti S, Mitchell G, Barbatelli G, Murano I, Ceresi E, Faloia E, Wang S, Fortier M, Greenberg AS, Obin MS (2005) Adipocyte death defines macrophage localization and function in adipose tissue of obese mice and humans. J Lipid Res 46(11):2347–2355
95. Weyer C, Funahashi T, Tanaka S, Hotta K, Matsuzawa Y, Pratley RE, Tataranni PA (2001)Hypoadiponectinemia in obesity and type 2 diabetes: Close association with insulin resistance and hyperinsulinemia. J Clin Endocrinol Metab 86(5):1930–1935
96. Bajaj M, Suraamornkul S, Kashyap S, Cusi K, Mandarino L, DeFronzo RA (2004) Sustained reduction in plasma free fatty acid concentration improves insulin action without altering plasma adipocytokine levels in subjects with strong family history of type 2 diabetes. J Clin Endocrinol Metab 89(9):4649–4655
97. Bugianesi E, Pagotto U, Manini R, Vanni E, Gastaldelli A, de Iasio R, Gentilcore E, Natale S, Cassader M, Rizzetto M, Pasquali R, Marchesini G (2005) Plasma adiponectin in nonalcoholic fatty liver is related to hepatic insulin resistance and hepatic fat content, not to liver disease severity. J Clin Endocrinol Metab 90(6):3498–3504
98. Gerich JE, Mitrakou A, Kelley D, Mandarino L, Nurjhan N, Reilly J, Jenssen T, Veneman T, Consoli A (1990) Contribution of impaired muscle glucose clearance to reduced postabsorptive systemic glucose clearance in NIDDM. Diabetes 39(2):211–216
99. Thiebaud D, Jacot E, DeFronzo RA, Maeder E, Jequier E, Felber JP (1982) The effect of graded doses of insulin on total glucose uptake, glucose oxidation, and glucose storage in man. Diabetes 31(11):957–963
100. DeFronzo RA, Gunnarsson R, Bjorkman O, Olsson M, Wahren J (1985) Effects of insulin on peripheral and splanchnic glucose metabolism in noninsulin–dependent (type II) diabetes mellitus. J Clin Invest 76(1):149–155
101. Rizza RA, Mandarino LJ, Gerich JE (1981) Mechanism and significance of insulin resistance in non-insulin-dependent diabetes mellitus. Diabetes 30(12):990–995
Väitöskirja_Juurinen_sisustaitto.indd 64 21.4.2014 21:51:38

65
102. DeFronzo RA (1992) Pathogenesis of type 2 (non-insulin-dependent) diabetes mellitus: A balanced overview. Diabetologia 35(4):389–397
103. Groop LC, Bonadonna RC, DelPrato S, Ratheiser K, Zyck K, Ferrannini E, DeFronzo RA (1989) Glucose and free fatty acid metabolism in non-insulin-dependent diabetes mellitus. Evidence for multiple sites of insulin resistance. J Clin Invest 84(1):205–213
104. Rothman DL, Shulman RG, Shulman GI (1992) 31P nuclear magnetic resonance measurements of muscle glucose-6-phosphate. Evidence for reduced insulin-dependent muscle glucose transport or phosphorylation activity in non-insulin-dependent diabetes mellitus. J Clin Invest 89(4):1069–1075
105. Yki-Jarvinen H (1992) Glucose toxicity. Endocr Rev 13(3):415–431
106. Zierath JR, Krook A, Wallberg–Henriksson H (2000) Insulin action and insulin resistance in human skeletal muscle. Diabetologia 43(7):821–835
107. Yki-Jarvinen H, Helve E, Koivisto VA (1987) Hyperglycemia decreases glucose uptake in type I diabetes. Diabetes 36(8):892–896
108. Vuorinen–Markkola H, Koivisto VA, Yki-Jarvinen H (1992) Mechanisms of hyperglycemia-induced insulin resistance in whole body and skeletal muscle of type I diabetic patients. Diabetes 41(5):571–580
109. Dresner A, Laurent D, Marcucci M, Griffin ME, Dufour S, Cline GW, Slezak LA, Andersen DK, Hundal RS, Rothman DL, Petersen KF, Shulman GI (1999) Effects of free fatty acids on glucose transport and IRS-1-associated phosphatidylinositol 3-kinase activity. J Clin Invest 103(2):253–259
110. Belfort R, Mandarino L, Kashyap S, Wirfel K, Pratipanawatr T, Berria R, Defronzo RA, Cusi K (2005) Dose-response effect of elevated plasma free fatty acid on insulin signaling. Diabetes 54(6):1640–1648
111. Westerbacka J, Wilkinson I, Cockcroft J, Utriainen T, Vehkavaara S, Yki-Jarvinen H (1999) Diminished wave reflection in the aorta. A novel physiological action of insulin on large blood vessels. Hypertension 33(5):1118–1122
112. Westerbacka J, Yki-Jarvinen H, Turpeinen A, Rissanen A, Vehkavaara S, Syrjala M, Lassila R (2002) Inhibition of platelet–collagen interaction: An in vivo action of insulin abolished by insulin resistance in obesity. Arterioscler Thromb Vasc Biol 22(1):167–172
113. Berne C, Fagius J, Pollare T, Hjemdahl P (1992) The sympathetic response to euglycaemic hyperinsulinaemia. evidence from microelectrode nerve recordings in healthy subjects. Diabetologia 35(9):873–879
114. Bergholm R, Westerbacka J, Vehkavaara S, Seppala–Lindroos A, Goto T, Yki-Jarvinen H (2001) Insulin sensitivity regulates autonomic control of heart rate variation independent of body weight in normal subjects. J Clin Endocrinol Metab 86(3):1403–1409
115. Tamminen M, Westerbacka J, Vehkavaara S, Yki-Jarvinen H (2002) Insulin-induced decreases in aortic wave reflection and central systolic pressure are impaired in type 2 diabetes. Diabetes Care 25(12):2314–2319
116. Vehkavaara S, Seppala-Lindroos A, Westerbacka J, Groop PH, Yki-Jarvinen H (1999) In vivo endothelial dysfunction characterizes patients with impaired fasting glucose. Diabetes Care 22(12):2055–2060
117. Villanova N, Moscatiello S, Ramilli S, Bugianesi E, Magalotti D, Vanni E, Zoli M, Marchesini G (2005) Endothelial dysfunction and cardiovascular risk profile in nonalcoholic fatty liver disease. Hepatology 42(2):473–480
118. Lautamaki R, Borra R, Iozzo P, Komu M, Lehtimaki T, Salmi M, Jalkanen S, Airaksinen KE, Knuuti J, Parkkola R, Nuutila P (2006) Liver steatosis coexists with myocardial insulin resistance and coronary dysfunction in patients with type 2 diabetes. Am J Physiol Endocrinol Metab 291(2):E282–290
119. Defronzo RA (2009) Banting lecture. from the triumvirate to the ominous octet: A new paradigm for the treatment of type 2 diabetes mellitus. Diabetes 58(4):773–795
Väitöskirja_Juurinen_sisustaitto.indd 65 21.4.2014 21:51:38

INSULIN THERAPY IN TYPE 2 DIABETES
66
120. Polonsky KS, Given BD, Hirsch LJ, Tillil H, Shapiro ET, Beebe C, Frank BH, Galloway JA, Van Cauter E (1988) Abnormal patterns of insulin secretion in non–insulin–dependent diabetes mellitus. N Engl J Med 318(19):1231–1239
121. Tripathy D, Carlsson M, Almgren P, Isomaa B, Taskinen MR, Tuomi T, Groop LC (2000) Insulin secretion and insulin sensitivity in relation to glucose tolerance: Lessons from the botnia study. Diabetes 49(6):975–980
122. Yki-Jarvinen H (1990) Acute and chronic effects of hyperglycaemia on glucose metabolism. Diabetologia 33(10):579–585
123. Lyssenko V, Jonsson A, Almgren P, Pulizzi N, Isomaa B, Tuomi T, Berglund G, Altshuler D, Nilsson P, Groop L (2008) Clinical risk factors, DNA variants, and the development of type 2 diabetes. N Engl J Med 359(21):2220–2232
124. Muoio DM, Newgard CB (2008) Mechanisms of disease: Molecular and metabolic mechanisms of insulin resistance and beta–cell failure in type 2 diabetes. Nat Rev Mol Cell Biol 9(3):193–205
125. Kashyap S, Belfort R, Gastaldelli A, Pratipanawatr T, Berria R, Pratipanawatr W, Bajaj M, Mandarino L, DeFronzo R, Cusi K (2003) A sustained increase in plasma free fatty acids impairs insulin secretion in nondiabetic subjects genetically predisposed to develop type 2 diabetes. Diabetes 52(10):2461–2474
126. Makimattila S, Fineman MS, Yki-Jarvinen H (2000) Deficiency of total and nonglycosylated amylin in plasma characterizes subjects with impaired glucose tolerance and type 2 diabetes. J Clin Endocrinol Metab 85(8):2822–2827
127. Holman RR, Paul SK, Bethel MA, Matthews DR, Neil HA 2008 10–year follow–up of intensive glucose control in type 2 diabetes. N Engl J Med 359(15):1577–89
128. Tuomilehto J, Lindstrom J, Eriksson JG, Valle TT, Hamalainen H, Ilanne-Parikka P, Keinanen-Kiukaanniemi S, Laakso M, Louheranta A, Rastas M, Salminen V, Uusitupa M, Finnish Diabetes Prevention Study Group (2001) Prevention of type 2 diabetes mellitus by changes in lifestyle among subjects with impaired glucose tolerance. N Engl J Med 344(18):1343–1350
129. Uusitupa MI, Stancakova A, Peltonen M, Eriksson JG, Lindstrom J, Aunola S, Ilanne-Parikka P, Keinanen-Kiukaanniemi S, Tuomilehto J, Laakso M (2011) Impact of positive family history and genetic risk variants on the incidence of diabetes: The finnish diabetes prevention study. Diabetes Care 34(2):418–423
130. Manley SE, Stratton IM, Cull CA, Frighi V, Eeley EA, Matthews DR, Holman RR, Turner RC, Neil HA, United Kingdom Prospective Diabets Study Group (2000) Effects of three months’ diet after diagnosis of type 2 diabetes on plasma lipids and lipoproteins (UKPDS 45). UK prospective diabetes study group. Diabet Med 17(7):518–523
131. Brehm BJ, Lattin BL, Summer SS, Boback JA, Gilchrist GM, Jandacek RJ, D’Alessio DA (2009) One-year comparison of a high-monounsaturated fat diet with a high-carbohydrate diet in type 2 diabetes. Diabetes Care 32(2):215–220
132. Davis NJ, Tomuta N, Schechter C, Isasi CR, Segal-Isaacson C, Stein D, Zonszein J, Wylie-Rosett J (2009) Comparative study of the effects of a 1-year dietary intervention of a low-carbohydrate diet versus a low-fat diet on weight and glycemic control in type 2 diabetes. Diabetes Care 32(7):1147–1152
133. Barnard RJ, Lattimore L, Holly RG, Cherny S, Pritikin N (1982) Response of non-insulin-dependent diabetic patients to an intensive program of diet and exercise. Diabetes Care 5(4):370–374
134. Sjostrom L, Lindroos AK, Peltonen M, Torgerson J, Bouchard C, Carlsson B, Dahlgren S, Larsson B, Narbro K, Sjostrom CD, Sullivan M, Wedel H, Swedish Obese Subjects Study Scientific Group (2004) Lifestyle, diabetes, and cardiovascular risk factors 10 years after bariatric surgery. N Engl J Med 351(26):2683–2693
135. Balkau B, Mhamdi L, Oppert JM, Nolan J, Golay A, Porcellati F, Laakso M, Ferrannini E, EGIR–RISC Study Group (2008) Physical activity and insulin sensitivity: The RISC study. Diabetes 57(10):2613–2618
136. Winnick JJ, Sherman WM, Habash DL, Stout MB, Failla ML, Belury MA, Schuster DP (2008) Short–term aerobic exercise training in obese humans with type 2 diabetes mellitus improves whole–body
Väitöskirja_Juurinen_sisustaitto.indd 66 21.4.2014 21:51:38

67
insulin sensitivity through gains in peripheral, not hepatic insulin sensitivity. J Clin Endocrinol Metab 93(3):771–778
137. Giannopoulou I, Ploutz–Snyder LL, Carhart R, Weinstock RS, Fernhall B, Goulopoulou S, Kanaley JA (2005) Exercise is required for visceral fat loss in postmenopausal women with type 2 diabetes. J Clin Endocrinol Metab 90(3):1511–1518
138. Boule NG, Haddad E, Kenny GP, Wells GA, Sigal RJ (2001) Effects of exercise on glycemic control and body mass in type 2 diabetes mellitus: A meta-analysis of controlled clinical trials. JAMA 286(10):1218–1227
139. Sigal RJ, Kenny GP, Boule NG, Wells GA, Prud’homme D, Fortier M, Reid RD, Tulloch H, Coyle D, Phillips P, Jennings A, Jaffey J (2007) Effects of aerobic training, resistance training, or both on glycemic control in type 2 diabetes: A randomized trial. Ann Intern Med 147(6):357–369
140. Castaneda C, Layne JE, Munoz-Orians L, Gordon PL, Walsmith J, Foldvari M, Roubenoff R, Tucker KL, Nelson ME (2002) A randomized controlled trial of resistance exercise training to improve glycemic control in older adults with type 2 diabetes. Diabetes Care 25(12):2335–2341
141. DeFronzo RA, Barzilai N, Simonson DC (1991) Mechanism of metformin action in obese and lean noninsulin–dependent diabetic subjects. J Clin Endocrinol Metab 73(6):1294–1301
142. Inzucchi SE, Maggs DG, Spollett GR, Page SL, Rife FS, Walton V, Shulman GI (1998) Efficacy and metabolic effects of metformin and troglitazone in type II diabetes mellitus. N Engl J Med 338(13):867–872
143. Hundal RS, Krssak M, Dufour S, Laurent D, Lebon V, Chandramouli V, Inzucchi SE, Schumann WC, Petersen KF, Landau BR, Shulman GI (2000) Mechanism by which metformin reduces glucose production in type 2 diabetes. Diabetes 49(12):2063–2069
144. DeFronzo RA, Goodman AM (1995) Efficacy of metformin in patients with non-insulin-dependent diabetes mellitus. the multicenter metformin study group. N Engl J Med 333(9):541–549
145. Bodmer M, Meier C, Krahenbuhl S, Jick SS, Meier CR (2008) Metformin, sulfonylureas, or other antidiabetes drugs and the risk of lactic acidosis or hypoglycemia: A nested case-control analysis. Diabetes Care 31(11):2086–2091
146. UK prospective diabetes study (UKPDS) group. (1998) Intensive blood-glucose control with sulphonylureas or insulin compared with conventional treatment and risk of complications in patients with type 2 diabetes (UKPDS 33). Lancet 352(9131):837–853
147. Knowler WC, Barrett–Connor E, Fowler SE, Hamman RF, Lachin JM, Walker EA, Nathan DM, Diabetes Prevention Program Research Group (2002) Reduction in the incidence of type 2 diabetes with lifestyle intervention or metformin. N Engl J Med 346(6):393–403
148. Evans JM, Donnelly LA, Emslie–Smith AM, Alessi DR, Morris AD (2005) Metformin and reduced risk of cancer in diabetic patients. BMJ 330(7503):1304–1305
149. Li D, Yeung SC, Hassan MM, Konopleva M, Abbruzzese JL (2009) Antidiabetic therapies affect risk of pancreatic cancer. Gastroenterology 137(2):482–488
150. Malaisse WJ, Lebrun P (1990) Mechanisms of sulfonylurea-induced insulin release. Diabetes Care 13 Suppl 3:9–17
151. Ribalet B, John SA, Xie LH, Weiss JN (2006) ATP-sensitive K+ channels: Regulation of bursting by the sulphonylurea receptor, PIP2 and regions of Kir6.2. J Physiol 571(Pt 2):303–317
152. Turner RC, Cull CA, Frighi V, Holman RR (1999) Glycemic control with diet, sulfonylurea, metformin, or insulin in patients with type 2 diabetes mellitus: Progressive requirement for multiple therapies (UKPDS 49). UK prospective diabetes study (UKPDS) group. JAMA 281(21):2005–2012
153. Kahn SE, Haffner SM, Heise MA, Herman WH, Holman RR, Jones NP, Kravitz BG, Lachin JM, O’Neill MC, Zinman B, Viberti G, ADOPT Study Group (2006) Glycemic durability of rosiglitazone, metformin, or glyburide monotherapy. N Engl J Med 355(23):2427–2443
154. Schmitz O, Lund S, Andersen PH, Jonler M, Porksen N (2002) Optimizing insulin secretagogue therapy in patients with type 2 diabetes: A randomized double-blind study with repaglinide. Diabetes Care 25(2):342–346
Väitöskirja_Juurinen_sisustaitto.indd 67 21.4.2014 21:51:38

INSULIN THERAPY IN TYPE 2 DIABETES
68
155. Scheen AJ (2005) Drug interactions of clinical importance with antihyperglycaemic agents: An update. Drug Saf 28(7):601–631
156. McLeod JF (2004) Clinical pharmacokinetics of nateglinide: A rapidly-absorbed, short-acting insulinotropic agent. Clin Pharmacokinet 43(2):97–120
157. Goldberg RB, Einhorn D, Lucas CP, Rendell MS, Damsbo P, Huang WC, Strange P, Brodows RG (1998) A randomized placebo-controlled trial of repaglinide in the treatment of type 2 diabetes. Diabetes Care 21(11):1897–1903
158. Dashora UK, Sibal L, Ashwell SG, Home PD (2007) Insulin glargine in combination with nateglinide in people with type 2 diabetes: A randomized placebo-controlled trial. Diabet Med 24(4):344–349
159. Damsbo P, Clauson P, Marbury TC, Windfeld K (1999) A double-blind randomized comparison of meal-related glycemic control by repaglinide and glyburide in well-controlled type 2 diabetic patients. Diabetes Care 22(5):789–794
160. Saloranta C, Hershon K, Ball M, Dickinson S, Holmes D (2002) Efficacy and safety of nateglinide in type 2 diabetic patients with modest fasting hyperglycemia. J Clin Endocrinol Metab 87(9):4171–4176
161. Horton ES, Clinkingbeard C, Gatlin M, Foley J, Mallows S, Shen S (2000) Nateglinide alone and in combination with metformin improves glycemic control by reducing mealtime glucose levels in type 2 diabetes. Diabetes Care 23(11):1660–1665
162. Hanefeld M, Bouter KP, Dickinson S, Guitard C (2000) Rapid and short-acting mealtime insulin secretion with nateglinide controls both prandial and mean glycemia. Diabetes Care 23(2):202–207
163. Rosenstock J, Hassman DR, Madder RD, Brazinsky SA, Farrell J, Khutoryansky N, Hale PM, Repaglinide Versus Nateglinide Comparison Study Group (2004) Repaglinide versus nateglinide monotherapy: A randomized, multicenter study. Diabetes Care 27(6):1265–1270
164. Mari A, Gastaldelli A, Foley JE, Pratley RE, Ferrannini E (2005) Beta-cell function in mild type 2 diabetic patients: Effects of 6-month glucose lowering with nateglinide. Diabetes Care 28(5):1132–1138
165. Schwarz SL, Gerich JE, Marcellari A, Jean–Louis L, Purkayastha D, Baron MA (2008) Nateglinide, alone or in combination with metformin, is effective and well tolerated in treatment-naive elderly patients with type 2 diabetes. Diabetes Obes Metab 10(8):652–660
166. Miyazaki Y, Mahankali A, Matsuda M, Glass L, Mahankali S, Ferrannini E, Cusi K, Mandarino LJ, DeFronzo RA (2001) Improved glycemic control and enhanced insulin sensitivity in type 2 diabetic subjects treated with pioglitazone. Diabetes Care 24(4):710–719
167. Boden G, Cheung P, Mozzoli M, Fried SK (2003) Effect of thiazolidinediones on glucose and fatty acid metabolism in patients with type 2 diabetes. Metabolism 52(6):753–759
168. Gale EA (2001) Lessons from the glitazones: A story of drug development. Lancet 357(9271):1870–1875
169. Komajda M, McMurray JJ, Beck–Nielsen H, Gomis R, Hanefeld M, Pocock SJ, Curtis PS, Jones NP, Home PD (2010) Heart failure events with rosiglitazone in type 2 diabetes: Data from the RECORD clinical trial. Eur Heart J 31(7):824–831
170. Lago RM, Singh PP, Nesto RW (2007) Congestive heart failure and cardiovascular death in patients with prediabetes and type 2 diabetes given thiazolidinediones: A meta-analysis of randomised clinical trials. Lancet 370(9593):1129–1136
171. Aronoff S, Rosenblatt S, Braithwaite S, Egan JW, Mathisen AL, Schneider RL (2000) Pioglitazone hydrochloride monotherapy improves glycemic control in the treatment of patients with type 2 diabetes: A 6-month randomized placebo-controlled dose-response study. Diabetes Care 23(11):1605–1611
172. Nesto RW, Bell D, Bonow RO, Fonseca V, Grundy SM, Horton ES, Le Winter M, Porte D, Semenkovich CF, Smith S, Young LH, Kahn R, American Heart Association, American Diabetes Association (2003) Thiazolidinedione use, fluid retention, and congestive heart failure: A consensus statement from the American Heart Association and American Diabetes Association. Circulation 108(23):2941–2948
Väitöskirja_Juurinen_sisustaitto.indd 68 21.4.2014 21:51:38

69
173. Aubert RE, Herrera V, Chen W, Haffner SM, Pendergrass M (2010) Rosiglitazone and pioglitazone increase fracture risk in women and men with type 2 diabetes. Diabetes Obes Metab 12(8):716–721
174. Vilsboll T, Holst JJ (2004) Incretins, insulin secretion and type 2 diabetes mellitus. Diabetologia 47(3):357–366
175. Schmitz O (2008) The GLP-1 concept in the treatment of type 2 diabetes – still standing at the gate of dawn? J Clin Endocrinol Metab 93(2):375–377
176. Chia CW, Egan JM (2008) Incretin-based therapies in type 2 diabetes mellitus. J Clin Endocrinol Metab 93(10):3703–3716
177. Karagiannis T, Paschos P, Paletas K, Matthews DR, Tsapas A (2012) Dipeptidyl peptidase-4 inhibitors for treatment of type 2 diabetes mellitus in the clinical setting: systematic review and meta-analysis. BMJ 12(34):1344–1369
178. Dunning BE, Gerich JE (2007) The role of alpha-cell dysregulation in fasting and postprandial hyperglycemia in type 2 diabetes and therapeutic implications. Endocr Rev 28(3):253–283
179. Aschner P, Kipnes MS, Lunceford JK, Sanchez M, Mickel C, Williams-Herman DE, Sitagliptin Study 021 Group (2006) Effect of the dipeptidyl peptidase-4 inhibitor sitagliptin as monotherapy on glycemic control in patients with type 2 diabetes. Diabetes Care 29(12):2632–2637
180. Pi–Sunyer FX, Schweizer A, Mills D, Dejager S 2007 Efficacy and tolerability of vildagliptin monotherapy in drug–naive patients with type 2 diabetes. Diabetes Res Clin Pract 76(1):132–138
181. Ahren B (2009) Clinical results of treating type 2 diabetic patients with sitagliptin, vildagliptin or saxagliptin – Diabetes control and potential adverse events. Best Pract Res Clin Endocrinol Metab 23(4):487–498
182. Scheen AJ (2010) Pharmacokinetics of dipeptidylpeptidase-4 inhibitors. Diabetes Obes Metab 12(8):648–658
183. Matikainen N, Manttari S, Schweizer A, Ulvestad A, Mills D, Dunning BE, Foley JE, Taskinen MR (2006) Vildagliptin therapy reduces postprandial intestinal triglyceride-rich lipoprotein particles in patients with type 2 diabetes. Diabetologia 49(9):2049–2057
184. Yki-Jarvinen H, Rosenstock J, Durán-Garcia S, Pinnetti S, Bhattacharya S, Thiemann S, Patel S, Woerle HJ (2013) Effects of adding linagliptin to basal insulin regimen for inadequately controlled type 2 diabetes: a ≥52-week randomized, double-blind study. Diabetes Care 36(12):3875–3881
185. Vilsbøll T, Rosenstock J, Yki-Järvinen H, Cefalu WT, Chen Y, Luo E, Musser B, Andryuk PJ, Ling Y, Kaufman KD, Amatruda JM, Engel SS, Katz L (2010) Efficacy and safety of sitagliptin when added to insulin therapy in patients with type 2 diabetes. Diabetes Obes Metab 12(2):167–77
186. Barnett AH, Charbonnel B, Donovan M, Fleming D, Chen R (2012) Effect of saxagliptin as add-on therapy in patients with poorly controlled type 2 diabetes on insulin alone or insulin combined with metformin. Curr med Opin 28(4): 513–23
187. Drucker DJ, Nauck MA (2006) The incretin system: Glucagon-like peptide-1 receptor agonists and dipeptidyl peptidase-4 inhibitors in type 2 diabetes. Lancet 368(9548):1696–1705
188. Bunck MC, Diamant M, Corner A, Eliasson B, Malloy JL, Shaginian RM, Deng W, Kendall DM, Taskinen MR, Smith U, Yki-Jarvinen H, Heine RJ (2009) One-year treatment with exenatide improves beta-cell function, compared with insulin glargine, in metformin-treated type 2 diabetic patients: A randomized, controlled trial. Diabetes Care 32(5):762–768
189. Meier JJ (2012) GLP–1 receptor agonists for individualized treatment of type 2 diabetes mellitus. Nat Rev Endocrinol 8(12):728–742
190. Garber A, Henry R, Ratner R, Garcia–Hernandez PA, Rodriguez-Pattzi H, Olvera-Alvarez I, Hale PM, Zdravkovic M, Bode B, LEAD-3 (Mono) Study Group (2009) Liraglutide versus glimepiride monotherapy for type 2 diabetes (LEAD-3 mono): A randomised, 52-week, phase III, double-blind, parallel-treatment trial. Lancet 373(9662):473–481
Väitöskirja_Juurinen_sisustaitto.indd 69 21.4.2014 21:51:38

INSULIN THERAPY IN TYPE 2 DIABETES
70
191. DeFronzo RA, Ratner RE, Han J, Kim DD, Fineman MS, Baron AD (2005) Effects of exenatide (exendin–4) on glycemic control and weight over 30 weeks in metformin–treated patients with type 2 diabetes. Diabetes Care 28(5):1092–1100
192. Nauck MA, Vilsboll T, Gallwitz B, Garber A, Madsbad S (2009) Incretin-based therapies: Viewpoints on the way to consensus. Diabetes Care 32 Suppl 2:S223–31
193. Riddle MC, Aronson R, Home P, Marre M, Niemoeller E, Miossec P, Ping L, Ye J, Rosenstock J (2013) Adding once–daily lixisenatide for type 2 diabetes inadequately controlled by established basal insulin: A 24–week, randomized, placebo–controlled comparison (GetGoal-L). Diabetes Care 36(9):2489–2496
194. Abdul–Ghani MA, Norton L, Defronzo RA (2011) Role of sodium-glucose cotransporter 2 (SGLT 2) inhibitors in the treatment of type 2 diabetes. Endocr Rev 32(4):515–31
195. Ferrannini E, Ramos SJ, Salsali A, Tang W, List JF (2010) Dapagliflozin monotherapy in type 2 diabetic patients with inadequate glycemic control by diet and exercise: a randomized, double-blind, placebo–controlled, phase 3 trial. Diabetes Care 33(10):2217–2224
196. Kilo C, Mezitis N, Jain R, Mersey J, McGill J, Raskin P (2003) Starting patients with type 2 diabetes on insulin therapy using once-daily injections of biphasic insulin aspart 70/30, biphasic human insulin 70/30, or NPH insulin in combination with metformin. J Diabetes Complications 17(6):307–313
197. Malone JK, Kerr LF, Campaigne BN, Sachson RA, Holcombe JH; Lispro Mixture-Glargine Study Group (2004) Combined therapy with insulin lispro Mix 75/25 plus metformin or insulin glargine plus metformin: a 16-week, randomized, open-label, crossover study in patients with type 2 diabetes beginning insulin therapy. Clin Ther 26(12):2034–2044
198. Raskin P, Allen E, Hollander P, Lewin A, Gabbay RA, Hu P, Bode B, Garber A, INITIATE Study Group (2005) Initiating insulin therapy in type 2 diabetes: A comparison of biphasic and basal insulin analogs. Diabetes Care 28(2):260–265
199. Jacober SJ, Scism-Bacon JL, Zagar AJ (2006) A comparison of intensive mixture therapy with basal insulin therapy in insulin-naïve patients with type 2 diabetes receiving oral antidiabetes agents. Diabetes Obes Metab 8(4):448–455
200. Holman RR, Thorne KI, Farmer AJ, Davies MJ, Keenan JF, Paul S, Levy JC; 4–T Study Group (2007) Addition of biphasic, prandial, or basal insulin to oral therapy in type 2 diabetes. N Engl J Med 357(17):1716–1730
201. Wolffenbuttel BH, Sels JP, Rondas–Colbers GJ, Menheere PP, Nieuwenhuijzen Kruseman AC (1996) Comparison of different insulin regimens in elderly patients with NIDDM. Diabetes Care 19(12):1326–1332
202. Janka HU, Plewe G, Riddle MC, Kliebe-Frisch C, Schweitzer MA, Yki-Järvinen H (2005) Comparison of basal insulin added to oral agents versus twice-daily premixed insulin as initial insulin therapy for type 2 diabetes. Diabetes Care 28(2):254–259
203. Landstedt-Hallin L, Adamson U, Arner P, Bolinder J, Lins PE (1995) Comparison of bedtime NPH or preprandial regular insulin combined with glibenclamide in secondary sulfonylurea failure. Diabetes Care 18(8):1183–1186
204. Bastyr EJ 3rd, Johnson ME, Trautmann ME, Anderson JH Jr, Vignati L (1999) Insulin lispro in the treatment of patients with type 2 diabetes mellitus after oral agent failure. Clin Ther 21(10):1703–1714
205. Bretzel RG, Nuber U, Landgraf W, Owens DR, Bradley C, Linn T (2008) Once-daily basal insulin glargine versus thrice-daily prandial insulin lispro in people with type 2 diabetes on oral hypoglycaemic agents (APOLLO): an open randomised controlled trial. Lancet 371(9618):1073–1084
206. Taves DR (1974) Minimization: A new method of assigning patients to treatment and control groups. Clin Pharmacol Ther 15(5):443–453
207. Bradley C, Speight J (2002) Patient perceptions of diabetes and diabetes therapy: Assessing quality of life. Diabetes Metab Res Rev 18 Suppl 3:S64–69
208. Lukaski HC, Johnson PE, Bolonchuk WW, Lykken GI (1985) Assessment of fat-free mass using bioelectrical impedance measurements of the human body. Am J Clin Nutr 41(4):810–817
Väitöskirja_Juurinen_sisustaitto.indd 70 21.4.2014 21:51:38

71
209. Marti B, Tuomilehto J, Salomaa V, Kartovaara L, Korhonen HJ, Pietinen P (1991) Body fat distribution in the Finnish population: Environmental determinants and predictive power for cardiovascular risk factor levels. J Epidemiol Community Health 45(2):131–137
210. Ferrannini E (1988) The theoretical bases of indirect calorimetry: A review. Metabolism 37(3):287–301
211. Yki-Jarvinen H, Puhakainen I, Saloranta C, Groop L, Taskinen MR (1991) Demonstration of a novel feedback mechanism between FFA oxidation from intracellular and intravascular sources. Am J Physiol 260(5 Pt 1):E680–9
212. Kadish AH, Little RL, Sternberg JC (1968) A new and rapid method for the determination of glucose by measurement of rate of oxygen consumption. Clin Chem 14:116–131
213. Puhakainen I, Koivisto VA, Yki-Jarvinen H (1991) No reduction in total hepatic glucose output by inhibition of gluconeogenesis with ethanol in NIDDM patients. Diabetes 40(10):1319–1327
214. Kuzuya H, Blix PM, Horwitz DL, Steiner DF, Rubenstein AH (1977) Determination of free and total insulin and C–peptide in insulin-treated diabetics. Diabetes 26(1):22–29
215. Friedewald WT, Levy RI, Fredrickson DS (1972) Estimation of the concentration of low-density lipoprotein cholesterol in plasma, without use of the preparative ultracentrifuge. Clin Chem 18(6):499–502
216. Miles J, Glasscock R, Aikens J, Gerich J, Haymond M (1983) A microfluorometric method for the determination of free fatty acids in plasma. J Lipid Res 24(1):96–99
217. Westerbacka J, Corner A, Tiikkainen M, Tamminen M, Vehkavaara S, Hakkinen AM, Fredriksson J, Yki-Jarvinen H (2004) Women and men have similar amounts of liver and intra–abdominal fat, despite more subcutaneous fat in women: Implications for sex differences in markers of cardiovascular risk. Diabetologia 47(8):1360–1369
218. Lingvay I, Raskin P, Szczepaniak LS (2007) Effect of insulin–metformin combination on hepatic steatosis in patients with type 2 diabetes. J Diabetes Complications 21(3):137–142
219. Lingvay I, Roe ED, Duong J, Leonard D, Szczepaniak LS (2012) Effect of insulin versus triple oral therapy on the progression of hepatic steatosis in type 2 diabetes. J Investig Med 60(7):1059–1063
220. Henry RR, Gumbiner B, Ditzler T, Wallace P, Lyon R, Glauber HS (1993) Intensive conventional insulin therapy for type II diabetes. Metabolic effects during a 6-month outpatient trial. Diabetes Care 16(1):21–31
221. Baron AD, Laakso M, Brechtel G, Edelman SV (1991) Reduced capacity and affinity of skeletal muscle for insulin–mediated glucose uptake in noninsulin–dependent diabetic subjects. Effects of insulin therapy. J Clin Invest 87(4):1186–1194
222. Bell PM, Firth RG, Rizza RA (1986) Effects of hyperglycemia on glucose production and utilization in humans. Measurement with [23H]-, [33H]-, and [614C]-glucose. Diabetes 35(6):642–648
223. Cusi K, Cunningham GR, Comstock JP (1995) Safety and efficacy of normalizing fasting glucose with bedtime NPH insulin alone in NIDDM Diabetes Care 18(6):843–851
224. Firth RG, Bell PM, Rizza RA (1986) Effects of tolazamide and exogenous insulin on insulin action in patients with non–insulin–dependent diabetes mellitus. N Engl J Med 314(20):1280–1286
225. Garvey WT, Olefsky JM, Griffin J, Hamman RF, Kolterman OG (1985) The effect of insulin treatment on insulin secretion and insulin action in type II diabetes mellitus. Diabetes 34(3):222–234
226. Ginsberg H, Rayfield EJ (1981) Effect of insulin therapy on insulin resistance in type II diabetic subjects. Evidence for heterogeneity. Diabetes 30(9):739–745
227. Laakso M, Uusitupa M, Takala J, Majander H, Reijonen T, Penttila I (1988) Effects of hypocaloric diet and insulin therapy on metabolic control and mechanisms of hyperglycemia in obese non–insulin–dependent diabetic subjects. Metabolism 37(11):1092–1100
228. Pisu E, De Benedictis D, Baggiore C, Diana A, Marengo C, Bozzo C, Renzetti A, Pagano G (1990) Insulin supplement in type 2 diabetic patients with secondary failure to oral agents ameliorates hepatic and peripheral insulin sensitivity but not insulin secretion. Diabet Med 7(9):805–809
Väitöskirja_Juurinen_sisustaitto.indd 71 21.4.2014 21:51:38

INSULIN THERAPY IN TYPE 2 DIABETES
72
229. Pouwels MJ, Tack CJ, Hermus AR, Lutterman JA (2003) Treatment with intravenous insulin followed by continuous subcutaneous insulin infusion improves glycaemic control in severely resistant type 2 diabetic patients. Diabet Med 20(1):76–79
230. Scarlett JA, Gray RS, Griffin J, Olefsky JM, Kolterman OG (1982) Insulin treatment reverses the insulin resistance of type II diabetes mellitus. Diabetes Care 5(4):353–363
231. Tamminen MK, Westerbacka J, Vehkavaara S, Yki-Jarvinen H (2003) Insulin therapy improves insulin actions on glucose metabolism and aortic wave reflection in type 2 diabetic patients. Eur J Clin Invest 33(10):855–860
232. Yki-Jarvinen H, Esko N, Eero H, Marja–Riitta T (1988) Clinical benefits and mechanisms of a sustained response to intermittent insulin therapy in type 2 diabetic patients with secondary drug failure. Am J Med 84(2):185–192
233. Andrews WJ, Vasquez B, Nagulesparan M, Klimes I, Foley J, Unger R, Reaven GM (1984) Insulin therapy in obese, non-insulin-dependent diabetes induces improvements in insulin action and secretion that are maintained for two weeks after insulin withdrawal. Diabetes 33(7):634–642
234. Gormley MJ, Hadden DR, Woods R, Sheridan B, Andrews WJ (1986) One month’s insulin treatment of type II diabetes: The early and medium-term effects following insulin withdrawal. Metabolism 35(11):1029–1036
235. Nankervis A, Proietto J, Aitken P, Harewood M, Alford F (1982) Differential effects of insulin therapy on hepatic and peripheral insulin sensitivity in type 2 (non-insulin-dependent) diabetes. Diabetologia 23(4):320–325
236. Mattoo V, Eckland D, Widel M, Duran S, Fajardo C, Strand J, Knight D, Grossman L, Oakley D, Tan M, H6E-MC-GLAT study group (2005) Metabolic effects of pioglitazone in combination with insulin in patients with type 2 diabetes mellitus whose disease is not adequately controlled with insulin therapy: Results of a six-month, randomized, double-blind, prospective, multicenter, parallel-group study. Clin Ther 27(5):554–567
237. Hollander P, Yu D, Chou HS (2007) Low-dose rosiglitazone in patients with insulin–requiring type 2 diabetes. Arch Intern Med 167(12):1284–1290
238. Buch HN, Baskar V, Barton DM, Kamalakannan D, Akarca C, Singh BM (2002) Combination of insulin and thiazolidinedione therapy in massively obese patients with type 2 diabetes. Diabet Med 19(7):572–574
239. Ferrannini E, Mari A (1998) How to measure insulin sensitivity. J Hypertens 16(7):895–906
240. Makimattila S, Nikkila K, Yki-Jarvinen H (1999) Causes of weight gain during insulin therapy with and without metformin in patients with type II diabetes mellitus. Diabetologia 42(4):406–412
241. Balas B, Belfort R, Harrison SA, Darland C, Finch J, Schenker S, Gastaldelli A, Cusi K (2007) Pioglitazone treatment increases whole body fat but not total body water in patients with non-alcoholic steatohepatitis. J Hepatol 47(4):565–570
242. Fonseca V, Grunberger G, Gupta S, Shen S, Foley JE (2003) Addition of nateglinide to rosiglitazone monotherapy suppresses mealtime hyperglycemia and improves overall glycemic control. Diabetes Care 26(6):1685–1690
243. Yki-Jarvinen H, Kotronen A (2013) Is there evidence to support use of premixed or prandial insulin regimens in insulin-naive or previously insulin-treated type 2 diabetic patients? Diabetes Care 36 Suppl 2:S205–211
244. Fritsche A, Schweitzer MA, Haring HU, 4001 Study Group (2003) Glimepiride combined with morning insulin glargine, bedtime neutral protamine hagedorn insulin, or bedtime insulin glargine in patients with type 2 diabetes. A randomized, controlled trial. Ann Intern Med 138(12):952–959
245. Yki-Jarvinen H, Dressler A, Ziemen M, HOE 901/300s Study Group (2000) Less nocturnal hypoglycemia and better post-dinner glucose control with bedtime insulin glargine compared with bedtime NPH insulin during insulin combination therapy in type 2 diabetes. HOE 901/3002 study group. Diabetes Care 23(8):1130–1136
Väitöskirja_Juurinen_sisustaitto.indd 72 21.4.2014 21:51:39
73
246. White WB, Cannon CP, Heller SR, Nissen SE, Bergenstal RM, Bakris GL, Perez AT, Fleck PR, Mehta CR, Kupfer S, Wilson C, Cushman WC, Zannad F; EXAMINE Investigators (2013) Alogliptin after acute coronary syndrome in patients with type 2 diabetes. N Engl J Med 369(14):1327–1335
247. Scirica BM, Bhatt DL, Braunwald E, Steg PG, Davidson J, Hirshberg B, Ohman P, Frederich R, Wiviott SD, Hoffman EB, Cavender MA, Udell JA, Desai NR, Mosenzon O, McGuire DK, Ray KK, Leiter LA, Raz I; SAVOR–TIMI 53 Steering Committee and Investigators (2013) Saxagliptin and cardiovascular outcomes in patients with type 2 diabetes mellitus. N Engl J Med 369(14):1317–1326
248. Sanyal AJ, Chalasani N, Kowdley KV, McCullough A, Diehl AM, Bass NM, Neuschwander-Tetri BA, Lavine JE, Tonascia J, Unalp A, Van Natta M, Clark J, Brunt EM, Kleiner DE, Hoofnagle JH, Robuck PR; NASH CRN (2010) Pioglitazone, vitamin E, or placebo for nonalcoholic steatohepatitis. N Engl J Med 362(18):1675–1685
249. Chalasani N, Younossi Z, Lavine JE, Diehl AM, Brunt EM, Cusi K, Charlton M, Sanyal AJ; American Gastroenterological Association; American Association for the Study of Liver Diseases; American College of Gastroenterology (2012) The diagnosis and management of non-alcoholic fatty liver disease: practice guideline by the American Gastroenterological Association, American Association for the Study of Liver Diseases, and American College of Gastroenterology. Gastroenterology 142(7):1592–1609
Väitöskirja_Juurinen_sisustaitto.indd 73 21.4.2014 21:51:39

74
oRIGINAL PUBLICATIoNS
I Juurinen Leena, Tiikkainen Mirja, Häkkinen Anna-Maija, Hakkarainen Antti, Yki-Järvinen Hannele effects of insulin therapy on liver fat content and hepatic insulin sensitivity in patients with type 2 diabetes. American Journal of Physiology, Endocrinology and Metabolism 292: E829–E835, 2007. II Juurinen Leena, Kotronen Anna, Granér Marit, Yki-Järvinen Hannele rosiglitazone reduces liver fat and insulin requirements and improves hepatic insulin sensitivity and glycemic control in patients with type 2 diabetes requiring high insulin doses. Journal of Clinical Endocrinology and Metabolism 93: 118–124, 2008. III Juurinen Leena, Tiikkainen Mirja, Saltevo Juha, Nikkilä Katriina, Lanki, Helena, Leppävuori Eeva, Kock Tuula, Teikari-Myyrä Tarja, Kauppinen-Mäkelin Ritva, Kotronen Anna, Yki-Järvinen Hannele nateglinide combination therapy with basal insulin and metformin in patients with type 2 diabetes. Diabetic Medicine 26: 409–415, 2009. Iv Yki-Järvinen Hannele, Juurinen Leena, Alvarsson Michael, Bystedt Tord, Caldwell Ian, Davies Melanie, Lahdenperä Sanni, Nijpels Gil, Vähätalo Markku Initiate Insulin by aggressive titration and education (InItIate): a randomized study to compare initiation of insulin combination therapy in type 2 diabetic patients individually and in groups. Diabetes Care 30: 1364–1369, 2007. Publication II has also been included in the doctoral thesis of Anna Kotronen entitled
liver fat in the metabolic syndrome and type 2 diabetes, University of Helsinki, 2008.
Väitöskirja_Juurinen_sisustaitto.indd 74 21.4.2014 21:51:39