insurance 101 the basics - insurance institute of kentucky
TRANSCRIPT

1
© 2010 Property Casualty Insurers Association of America
Insurance 101The Basics

2
© 2010 Property Casualty Insurers Association of America
What is Insurance?
Methods of addressing uncertain risk• Avoid (don’t purchase)• Keep (don’t insure)• Transfer (purchase insurance)
Insurance is the “transfer” of uncertain financial consequences for a certain financial cost (e.g., premium)
3
© 2010 Property Casualty Insurers Association of America
How does it work?
Policy is a legal “contract of adhesion”
Insurance is for accidental/“fortuitous” events
Insurance rates “shall not be excessive, inadequate, or unfairly discriminatory”
4
© 2010 Property Casualty Insurers Association of America
Why does it work? Risks are shared among a large group
of “similarly” classified insureds
Premiums are “conservatively” invested in “liquid” instruments
“Spread of risk”
Reinsurance
5
© 2010 Property Casualty Insurers Association of America
How does society benefit?
Payment for losses
Reduction of uncertainty
Loss control
Long-term investments

6
© 2010 Property Casualty Insurers Association of America
What are the types of insurers?
Stock
Mutual
Reciprocal exchange
Lloyd’s
Fraternal benefit societies

7
© 2010 Property Casualty Insurers Association of America
How is insurance marketed? Independent agents
Brokers
Exclusive agents
Direct
Direct mail
Internet

8
© 2010 Property Casualty Insurers Association of America
Why regulate insurance? Complex promise for future performance
Solidity
Equity and Fairness
Freedom from governmental restraint
Freedom of access to the market

9
© 2010 Property Casualty Insurers Association of America
Who regulates insurance? States - Currently
• McCarran-Ferguson Act
Federal interest
• Gramm-Leach-Bliley Act
Judicial impact

10
© 2010 Property Casualty Insurers Association of America
How is insurance regulated? System types
• Open competition - “no file”• “File and use” or “Use and file”• “Prior approval”• State mandated/controlled
Why should policyholders care?• Freedom to choose/purchase
• Affordability/Availability• Market responds to competition

11
© 2010 Property Casualty Insurers Association of America
So, what does all this mean? Complex and mature marketplace
• 3,100 insurers writing in the U.S.• 722 insurers writing in Kentucky
Intimate relationship with society• Delicate balance• Complex economic relationships
• Banking• Investments• Real Estate

12
© 2010 Property Casualty Insurers Association of America
What is the process? Company established Selection of market segment Development of product
• Policy• Jurisdiction• Rating/Underwriting
Sale of product Claims Settlement
13
© 2010 Property Casualty Insurers Association of America
How are rates developed? Law of large numbers Probability distributions Review of past losses
• Frequency• Severity
Review of expenses• Loss adjustment expenses• Overhead expenses

14
© 2010 Property Casualty Insurers Association of America
How are rates developed? Predictability of future losses and expenses
• Large number claims over a period of time - 3 to 5 years at least
• Medical costs, legal costs, jury awards
Reasonable degree of certainty
Spread of Risk

15
© 2010 Property Casualty Insurers Association of America
What is underwriting?
Discriminatory classifications
Application of rules/classifications
Risk selection
Pricing

16
© 2010 Property Casualty Insurers Association of America
How does it work? Agent/Company Representative
• Application/completion• Information - DMV report, etc.
Underwriters• Application/classifications• Additional info (financial, loss)• Risk Selection• Pricing
© 2010 Property Casualty Insurers Association of America
Part II
Countrywide and State Industry Results
18
© 2010 Property Casualty Insurers Association of America
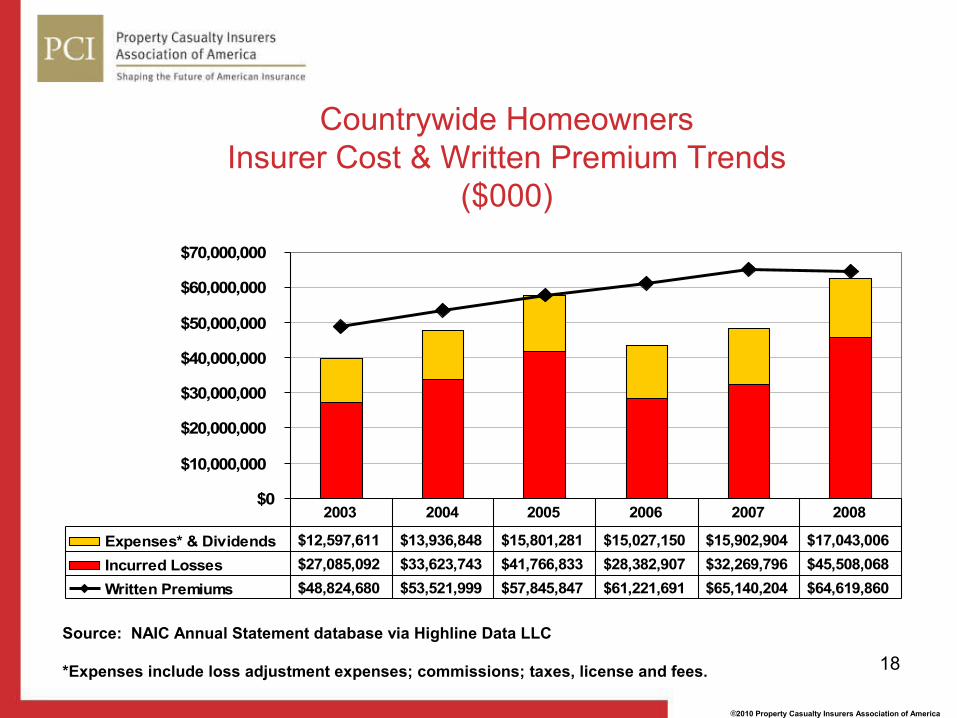
Countrywide HomeownersInsurer Cost & Written Premium Trends
($000)
$0
$10,000,000
$20,000,000
$30,000,000
$40,000,000
$50,000,000
$60,000,000
$70,000,000
Expenses* & Dividends $12,597,611 $13,936,848 $15,801,281 $15,027,150 $15,902,904 $17,043,006Incurred Losses $27,085,092 $33,623,743 $41,766,833 $28,382,907 $32,269,796 $45,508,068Written Premiums $48,824,680 $53,521,999 $57,845,847 $61,221,691 $65,140,204 $64,619,860
2003 2004 2005 2006 2007 2008
Source: NAIC Annual Statement database via Highline Data LLC
*Expenses include loss adjustment expenses; commissions; taxes, license and fees.

19
© 2010 Property Casualty Insurers Association of America
Countrywide Personal AutomobileInsurer Cost & Written Premium Trends
($000)
$0
$20,000,000
$40,000,000
$60,000,000
$80,000,000
$100,000,000
$120,000,000
$140,000,000
$160,000,000
$180,000,000
Expenses* and Dividends $37,566,162 $38,712,944 $39,132,978 $39,053,426 $40,177,049 $38,429,788
Incurred Losses $97,163,981 $94,803,242 $98,221,019 $95,210,949 $101,151,572 $104,667,232
Written Premiums $157,580,075 $163,086,257 $163,882,272 $164,705,553 $164,722,658 $164,289,793
2003 2004 2005 2006 2007 2008
Source: NAIC Annual Statement database via Highline Data LLC
*Expenses include loss adjustment expenses; commissions; taxes, license and fees.

20
© 2010 Property Casualty Insurers Association of America
Property Casualty Industry Combined Ratio
101.6%
105.6%107.7%
110.0%
115.7%
107.5%
100.1%98.4%
100.8%
92.5%
95.7%
103.9%
90.0%
95.0%
100.0%
105.0%
110.0%
115.0%
120.0%
1997 1998 1999 2000 2001 2002 2003 2004 2005 2006 2007 2008
Source: PCI based on A.M. Best’s Aggregates & Averages

21
© 2010 Property Casualty Insurers Association of America
P/C Net Income 1999-2008(after taxes in $ millions)
$21,865 $20,223
-$6,970
$2,903
$29,877
$38,722$43,230
$63,695 $61,940
$2,379
-$15,000
-$5,000
$5,000
$15,000
$25,000
$35,000
$45,000
$55,000
$65,000
$75,000
1999 2000 2001 2002 2003 2004 2005 2006 2007 2008
2001 was the first year ever with afull year net loss.
Source: ISO Industry Financial Results
22
© 2010 Property Casualty Insurers Association of America
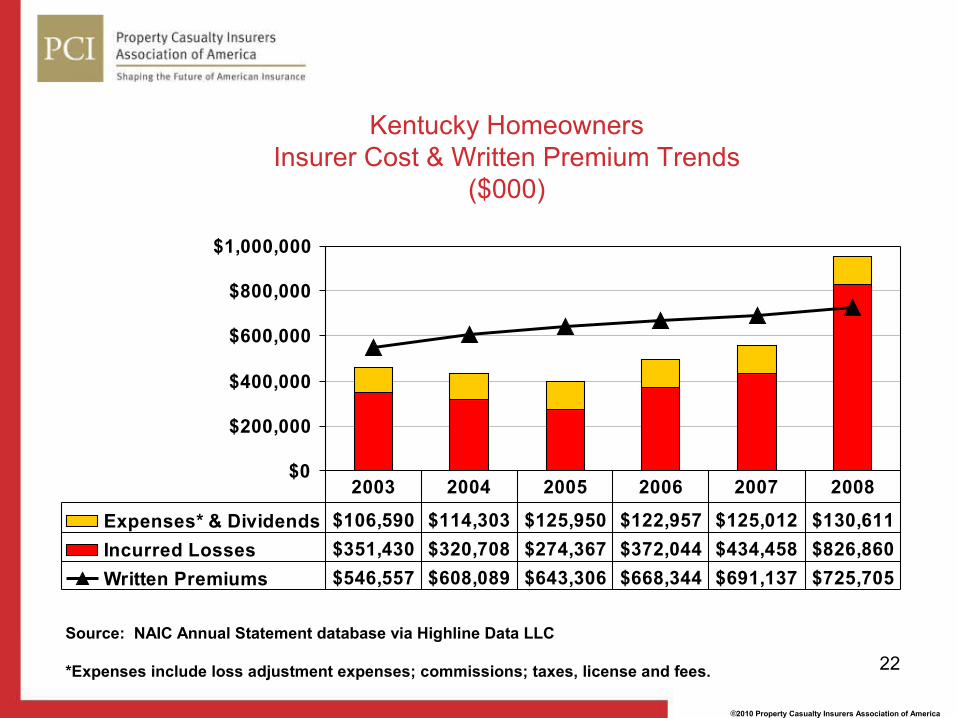
Kentucky HomeownersInsurer Cost & Written Premium Trends
($000)
$0
$200,000
$400,000
$600,000
$800,000
$1,000,000
Expenses* & Dividends $106,590 $114,303 $125,950 $122,957 $125,012 $130,611Incurred Losses $351,430 $320,708 $274,367 $372,044 $434,458 $826,860Written Premiums $546,557 $608,089 $643,306 $668,344 $691,137 $725,705
2003 2004 2005 2006 2007 2008
Source: NAIC Annual Statement database via Highline Data LLC
*Expenses include loss adjustment expenses; commissions; taxes, license and fees.

23
© 2010 Property Casualty Insurers Association of America
Kentucky Personal AutomobileInsurer Cost & Written Premium Trends
($000)
$0
$500,000
$1,000,000
$1,500,000
$2,000,000
$2,500,000
Expenses* & Dividends $299,404 $313,646 $343,410 $306,080 $322,733 $301,197Incurred Losses $1,334,609 $1,299,958 $1,239,864 $1,261,824 $1,311,277 $1,379,073Written Premiums $2,080,805 $2,167,627 $2,172,996 $2,186,383 $2,158,371 $2,122,721
2003 2004 2005 2006 2007 2008
Source: NAIC Annual Statement database via Highline Data LLC
*Expenses include loss adjustment expenses; commissions; taxes, license and fees.

24
© 2010 Property Casualty Insurers Association of America
Kentucky Total Property & Casualty LinesInsurer Cost & Written Premium Trends
($000)
$0
$1,000,000
$2,000,000
$3,000,000
$4,000,000
$5,000,000
$6,000,000
$7,000,000
Expenses* & Dividends $994,275 $1,069,184 $1,120,025 $1,063,556 $1,085,378 $1,039,476Incurred Losses $3,505,062 $3,443,025 $3,437,201 $3,164,718 $3,330,907 $3,919,917Written Premiums $5,413,136 $5,755,282 $5,947,311 $5,805,614 $5,806,948 $5,697,839
2003 2004 2005 2006 2007 2008
Source: NAIC Annual Statement database via Highline Data LLC
*Expenses include loss adjustment expenses; commissions; taxes, license and fees.

© 2010 Property Casualty Insurers Association of America
Questions?
Thank you!