int. j. pharm original article - josai.ac.jp
TRANSCRIPT

1
Int. J. Pharm Original article
Controlled release of a model hydrophilic high molecular weight compound from injectable non-lamellar liquid crystal formulations containing different types of 5
phospholipids
Akie Okada1), Hiroaki Todo1), Ichiro Hijikuro2), Shoko Itakura1), Kenji Sugibayashi1,*) 10
1) Faculty of Pharmacy and Pharmaceutical Sciences, Josai University, 1-1 Keyakidai,
Sakado, Saitama 350-0295, Japan
2) Farnex Inc., Tokyo Institute of Technology Yokohama Venture Plaza, 4259-3 15
Nagatsuta, Midori-ku, Yokohama 226-8510, Japan
* Corresponding author.
E-mail address: [email protected] (K. Sugibayashi)
20

2
Abstract Skin offers an easily accessible and convenient site for the administration of
drugs. Therefore, the development of injectable formulations with controlled drug release
properties are now expected to deliver middle- and large-size biomolecules. In the present study, formulations mainly composed of a novel polyol ester with an isoprenoid side 25
chain; mono-O-(5,9,13-trimethyl-4-tetradecenyl) glycerol ester (MGE), that was capable
of forming a non-lamellar liquid crystal (NLLC), were prepared with different types of phospholipid. Then, factors that affected the release of a model entrapped drug, fluorescein-isothiocyanate dextran (FD-4, M.W. 4,000), from the MGE formulations were
analyzed with multi-regression analysis. In addition, self-assembly of the NLLC structure 30
was investigated using small-angle X-ray scattering analysis after contacting the MGE formulations with water. NLLC-forming ability of the formulations after s.c. injection
into rats was also confirmed using microscopic observations. FD-4 concentrations in blood were determined after s.c. injection of the MGE formulations. The injectable MGE formulations successfully constructed NLLC structures to form a sponge-like gel after 35
contact with water in vitro and in vivo (in rats) as well. In in vitro conditions, the amount of FD-4 released from the formulations was altered by changing the type and concentration of phospholipid in the MGE formulations and can be expressed with
parameters such as MGE content and interplanar spacing of the NLLC. A significantly sustained FD-4 level in the blood was observed after s.c. injection of the formulations. 40
These results suggested that injectable MGE formulations may have the potential to
achieve controlled release profiles of drugs after s.c. injection. Keywords: Non-lamellar liquid crystal injectable formulation, controlled release, middle- 45
to high-molecular weight drugs, phospholipid

3
1. Introduction Biopharmaceuticals have become the mainstream in the current worldwide drug
market. The most convenient dosage forms, oral formulations, however, are not available 50
for many biopharmaceuticals due to their low bioavailability from the GI tract. Instead of oral formulations, transdermal drug delivery, including intradermal (i.d.) and subcutaneous (s.c.) administration, are of increasing interest as alternative administration
routes. These routes of administration have advantages such as the avoidance of first-pass effects, effective delivery of drugs with low oral bioavailability, and the utilization of 55
various types of dosing vehicles compared with intravenous (i.v.) administration (Park,
2014). Recently, minimally invasive i.d and s.c. administrations of drugs have become possible through the technological development of micro-electromechanical systems. Thus, many reports have been published on physical devices such as microneedle arrays,
needle-free injection, and thermalporation, which can directly administer 60
biopharmaceuticals into i.d and s.c layers of tissues (Santos et al., 2014). Several biocompatible formulations such as liposomes, poly (lactic-co-glycolic
acid) microspheres, and hyaluronic acid microspheres with controlled drug release properties can improve therapeutic effects, reduce side effects, and provide a better quality of life (Guo et al., 2017; Angst et al., 2006; Wilczewska et al., 2012; Bhosale et 65
al., 2013). Therefore, the combination of these physical devices and biocompatible formulations may become the most amenable methods for the self-administration of biopharmaceuticals by patients (Lee et al., 2018).
Lyotropic non-lamellar liquid crystals (NLLCs), such as phytantriol (PHY) and glyceryl monooleate (GMO), based on the self-assembly of amphiphilic lipids in water, 70
have gained increasing attention as next-generation nanocarriers for drug delivery. The
critical packing parameter (CPP) determines the geometric self-assembly structure; i.e.,
CPP < 1/3 for spherical micelles, 1/2–1 for bicontinuous cubic (Q1), »1 for a lamella structure, ≥1 for a reversed bicontinuous cubic phase (Q2), and >1 for reversed hexagonal
phase (H2). Phospholipids can be used to form liposomes, which are typical 75
biocompatible drug carriers. On the other hand, GMO and PHY form NLLCs states Q2 and H2 in water (Shi et al., 2015). NLLCs have complex large internal surface areas and
aqueous networks. Thus, they can encapsulate a wide range of drugs (i.e. hydrophilic, lipophilic, and amphiphilic) with a high entrapment efficacy. In addition, these characteristics are preferable for the controlled release of entrapped drugs (Otte et al., 80

4
2018; Rajabalaya et al., 2017; Chen et al., 2014). Moreover, improvement of the physical stability of entrapped proteins has been reported using NLLCs (Kulkarni et al., 2011; Evenbratt and Ström., 2017; Boge et al., 2016). The structures of NLLCs can be changed
by many factors, including temperature, pH, water content, and different additives (Kulkarni et al., 2011; Lim et al., 2015; Mei et al., 2018; Wu et al., 2014; Butreddy et al., 85
2015). Because phase structure-related drug-delivery systems have been broadly
published, it becomes possible now to fabricate intelligent drug carriers with NLLCs. In the present study, easily self-administrable formulations with sustained drug
release properties have been investigated using NLLC-forming lipids. A novel
amphiphilic lipid, mono-O-(5,9,13-trimethyl-4-tetradecenyl) glycerol ester (MGE) (0.47 90
Pa・s at a share rate of 10 s-1)was used instead of GMO and PHY, because MGE is easy to handle due to its relatively low viscosity at room temperature. In addition, an
isoprenoid type fatty chain in the MGE structure exhibited a highly self-organized NLLC structure with closed packing at the interface over a wide range of temperatures (Kadhum et al., 2017; Kadhum et al., 2017). 95
Drug absorption rate is closely characterized by the drug release rate; therefore, it is important to understand the release rate of entrapped drugs to optimize the formulation. In the present study, an s.c. injectable formulation with a sustained drug
release rate of a model hydrophilic high molecular weight of compound, fluorescein isothiocyanate–dextran (FD-4; average molecular weight 4,000), was developed by 100
altering the formulation by adding phospholipids to an NLLC-forming lipid, MGE.
2. Materials and Methods 2.1. Materials
FD-4 was obtained from Sigma-Aldrich (St. Louis, MO, USA). 1,2-Dimyristoyl-105
sn-glycero-3-phosphocholine (DMPC), 1,2-dipalmitoyl-sn-glycero-3-phosphocholine (DPPC), 1,2-distearoyl-sn-glycero-3-phosphocholine (DSPC), and 1,2-dioleoyl-sn-
glycero-3-phosphocholine (DOPC) were purchased from NOF Corporation (Tokyo, Japan). MGE was kindly provided by Farnex Inc. (Yokohama, Japan). Polyoxyethylene sorbitan monooleate (Tween 80) was obtained from Tokyo Chemical Industry (Tokyo, 110
Japan). All other regents were used without further purification. 2.2. Animal experiments

5
Male Wistar rats weighing about 190–230 g (8 weeks old) were obtained from Ishikawa Laboratory Animals (Fukaya, Saitama, Japan). Rats were housed in a room at 115
25 ± 2°C and the light was turned on and off every 12 h. The rats had freely available
water and diet (obtained from Oriental Yeast Co., Ltd., Tokyo, Japan). All animal feeding and experiments were approved by the Institutional Animal Care and Use Committee of Josai University (Sakado, Saitama, Japan).
120
2.3. Preparation of MGE formulations Table 1 shows the composition of the prepared MGE formulations. MGE,
ethanol and Tween 80 were added to a glass vial at 60°C and stirred with a hot-plate magnetic stirrer (RSH-1DN, AS ONE Corp., Osaka, Japan) at 500 rpm for 5 min. Then, each of the weighed phospholipids was added to a vial at 60°C and further mixed at 700 125
rpm for 1 h to prepare homogeneous base formulations. After cooling to room temperature, FD-4 was dispersed thoroughly using a spatula in the base formulation to obtain a suspension with a concentration of 15.6 mg/mL. Ethanol and Tween 80 were
used as additives to completely dissolve each phospholipid in the MGE formulations. Msc48 and Mpc48 became solid state when DSPC and DPPC were added to the 130
formulation at their concentrations higher than 36%. Thus, Msc48 and Mpc48 were not
evaluated in the present study.
(Table 1)
135
2.4. Polarized microscope observation Polarized images were observed using a microscope (VHX-5000, Keyence
Corp., Osaka, Japan). The observed samples were prepared by applying 10 µL of each MGE formulation on a slide glass, followed by dropping an equal volume of phosphate-buffered saline (PBS; 1/30 M PBS, pH 7.4) onto the formulation. Polarized images were 140
acquired 15 min after applying PBS to the formulation. All samples were observed on a glass slide with a cover glass at room temperature.
2.5. Small angle X-ray scattering (SAXS) analysis SAXS measurements of the MGE formulations were carried out using a Rigaku 145
NANOViewer SAXS system equipped with an X-ray generator (Akishima, Tokyo,
6
Japan) (Cu Kα radiation, λ = 1.5418 Å) operated at 30 kV and 40 mA. The camera focal length was set to 700 mm. The scatter pattern was acquired on a blue imaging plate for 1 h. The obtained pattern was analyzed using a Rigaku NANO-Solver program. All
processes related to the measurement operation were conducted by a qualified researcher 150
at Kanazawa University (Kanazawa, Ishikawa, Japan). Crystalline interplanar spacing, d, was determined, in accordance with the Bragg equation.
2.6. In vitro release tests
A Pur-A-Lyzer™ Mini Dialysis Kit Mini (Sigma Aldrich) was used to perform 155
the FD-4 release tests (Báez-Santos et al., 2016). After application of 100 µL of each formulation into a dialysis tube (molecular cut-off; 12,000), the sample was placed into a 25 mL tube (MINI-2362-025, AGC Techno Glass Co. Ltd., Yoshida, Shizuoka, Japan)
filled with 20 mL PBS containing 0.01% sodium azide as a preservative in the receiver
solution. In vitro FD-4 release was conducted at room temperature (25 ± 2°C) 160
(Rosenbaum et. al., 2010, Clogston et. al., 2005) with shading using aluminum foil. The
receiver solution was periodically sampled, and the same volume of fresh PBS containing sodium azide was added to the receiver compartment to maintain a constant volume. The water absorption ratio was determined by the formulation weights before and 48 h after
placing into a 5 mL tube filled with PBS containing 0.01% sodium azide. 165
2.7. In vivo experiments
Wistar rats were anesthetized with isoflurane (Pfizer, New York, NY, USA). The right jugular vein was exposed, and a silicone tube catheter with a 0.5-mm internal diameter and a 1.0-mm outer diameter (Silascon 100-00N, Kaneka Medics, Osaka, Japan) 170
were inserted into the vein. The catheter was prefilled with sterilized saline containing heparin (50 IU/mL; Mochida, Tokyo, Japan). The free ends of the catheter were dorsally externalized, which permitted the experiment to be conducted in unanesthetized and
unrestrained conditions. The rats were used after a recovery period. The MGE formulation (100 µL) containing FD-4 was administered to the shaved back skin on the 175
right side of rats using a 1 mL disposal syringe (Terumo Corp., Tokyo, Japan) with a 23G
needle (Terumo Corp.). Blood sampling was conducted periodically until 48 h after administration of the formulation. Plasma was obtained after centrifugation of blood at
21,500 × g for 5 min at 4°C. The obtained plasma was kept in a freezer at -20°C. Plasma
7
(100 µL) was thoroughly mixed with PBS (400 µL) and centrifuged (21,500 × g for 5 180
min at 4°C) to obtain the supernatant. The FD-4 concentration was determined at excitation and emission wavelengths of 485 and 535 nm, respectively, using a
fluorescence spectrophotometer (RF5300PC, Shimadzu, Kyoto, Japan). 2.8. Observation of FD-4 disposition 185
A 1.5 cm ´1.5 cm area of skin was excised from the rat back where the MGE formulation was administered, embedded in frozen section compound (SCEM; Leica Microsystems GmbH, Wetzlar, Germany) and frozen at −80°C. The frozen skin was cut
into 10-μm-thick sections using a cryostat (CM3050S, Leica Microsystems, GmbH, Wetzlar, Germany). The center part of the administration site was observed using a 190
confocal laser scanning microscope (Fluoview FV1000, software: FV10-ASW, Olympus
Corp., Tokyo, Japan).
2.9. In vivo imaging after administration of FD-4 in rats
Fluorescence images of administered FD-4 were observed using an IVIS 195
Spectrum (Perkin Elmer, Waltham, MA, USA) with a 465-nm excitation filter and a 520-nm emission filter, and recorded before injection (0 min) and 1 and 2 days after
administration. The epi-illumination settings for image acquisition were exposure time (2 s), binning (medium), f-stop (2), and field of view (22 cm). For three-dimensional (3D) image acquisition, fluorescence and photographic images were acquired and overlaid. 200
Data analysis was performed using Living Image version 4.7 software (SAS Institute Inc. Cary, NC, U.S.A.).
2.10. Multi-regression analysis
Multi-regression analysis was carried out using JMPÒ Pro (ver. 14.1.0, SAS 205
Institute, Cary, NC, USA). Stepwise regression analysis was employed to develop a
regression, and the most suitable descriptors were selected using coefficient of variation (r2). Separately, stepwise regression was used to select the best factors to predict FD-4 release ratio, based on the r2 value, from descriptors retrieved from measured parameters. 210
2.11. Statistical analysis

8
All experimental measurements were performed at least in triplicate. Values are expressed as the mean ± standard deviation (SD). Statistical significance of differences
in FD-4 release and blood concentration of FD-4 were examined using one-way analysis
of variance (ANOVA) followed by the Tukey–Kramer post-hoc test. The significance 215
level was set at p < 0.05.

9
3. Results Figure 1 shows the water absorption ratio in the MGE formulations. Most of the
formulations in this experiment absorbed about 30% water. Mmc48 showed the highest 220
water absorption among the MGE formulations, and only Mmc48 had a significantly higher (p< 0.05) water absorption ratio compared with neat MGE formulations, M.
Figure 2 shows polarized images 15 min after adding PBS to the prepared formulations. All preparations showed polarized images. The corresponding SAXS results are illustrated in Fig. 3, and the spacing lattices are summarized in Table 2. 225
Formulation M exhibited an H2 structure. Msc12, Moc12, and Moc24 displayed H2
structures as well. Msc12 had Pn3m as well as the H2 structures, whereas the other formulations showed only Pn3m structures. Thus, the liquid crystal structure of MGE can
be modified by the type and concentration of phospholipids. The interplanar spacing was also changed by the type and amount of phospholipid; interplanar spacing increased with 230
the increasing amount of phospholipid in the formulation, except for Mmc.
(Figures 1 - 3)
(Table 2)
235
Figure 4 shows the amount of FD-4 released from the MGE formulations over 48 h. Drug release was confirmed from all formulations without an obvious burst of
drug release (time course data not shown). The total amount of FD-4 released from Mmc increased with an increase in DMPC content, except for Mmc48. Significantly increased FD-4 release (p< 0.05) was observed in Mmc24, Mmc36, and Mmc48 240
compared with M. Almost similar results were observed in the other formulations. The highest FD-4 releases were observed at the highest phospholipid content in Mpc, Msc, and Moc. In addition, the effect of addition of ethanol and Tween 80 to the formulation
(composition; M: ethanol: Tween= 88:10:2) was investigated on the FD-4 release. No
significant effect on the FD-4 release was observed compared with M (data not shown). 245
(Figure 4)

10
Figure 5a shows a relationship between the FD-4 release from the MGE 250
formulation and their interplanar spacings. A good relationship (r2=0.78) was confirmed between them. In addition, logarithm of the amount of FD-4 released was well expressed
(r2=0.82) using the following equation (eq. 1, Fig. 5b); log $%4!"#"$%"& = 0.434 ∙ ,- − 0.020 ∙ 01 − 0.027 ∙ 31 − 0.018 ∙ 611 + 0.304 ∙255
6% + 0.709 (eq. 1)
where IS, MC, PC, NNC, and ND are interplanar spacing, M content, phospholipid
content, number of carbon chains in the phospholipid, and number of double bonds in the carbon chain, respectively. The root mean square error (RMSE) was 0.144. From this 260
equation, the increasing phospholipid content decreased FD-4 release, and ND increased
FD-4 release.
(Figure 5)
265
Although the construction of NLLC was confirmed in water-rich conditions, further investigations are needed to clarify the drug disposition and the construction of
the NLLC structure in the skin after topical administration. Figure 6 shows whole animal images obtained from IVIS Spectrum 0, 1, and 2 days after s.c. administration of neat MGE formulation into the right side of the back in rats. Figure 6 shows the tissue 270
distribution after s.c. injection of M and collected samples from the injected area 24 h after administration. Fluorescence images showed the FD-4 disposition at the administration site over at least 2 days.
FD-4 distribution and construction of NLLC gel form after s.c. injection were confirmed by microscopic observation of the skin section (Fig. 7a and b) and gel 275
recovered from the administration site (Fig. 7c). A green color distribution derived from
FD-4 was confirmed 1 h after administration (Fig. 7a), and its localization was also observed over at least 24 h (Fig. 7b). A bright fluorescence color was detected across the whole subcutis 1 h after administration, whereas the green color was observed mainly in
the shallow subcutis 24 h after administration. A sponge-like, yellow-colored, semi-solid 280
gel was collected 48 h after the administration of M (Fig. 7c). The gel form was confirmed at least over 7 days at the administration site, and completely disappeared by 1 month

11
after administration (data not shown).
(Figures 6 and 7) 285
A semi-solid gel was constructed after s.c. injection of the formulation. The FD-
4 concentration–time profile was further investigated in the next step. Mmc12/24/48 and
Moc12/24/48 formulations were selected, because Mmc had a higher amount of FD-4 released and Moc contained an unsaturated fatty acid. FD-4 solution and M were also 290
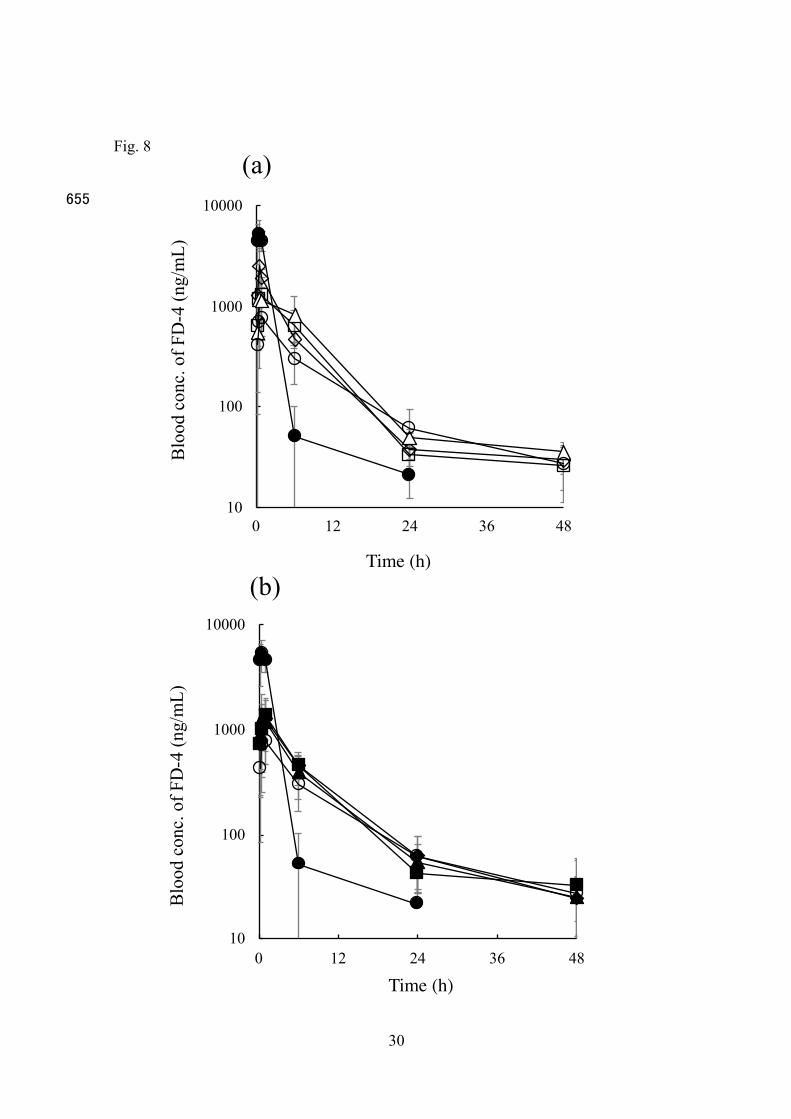
administered for comparison.
Figure 8 shows the concentration profiles of FD-4 after s.c. injection of Mmc (a) and Moc (b) into rats. FD-4 solution was also injected for comparison. When FD-4
solution was administered, a higher blood concentration of FD-4 (5282 ± 1761 ng/mL) was observed 30 min after administration. However, the blood concentration decreased 295
rapidly, and was not detected 24 h after administration (the lower limitation of detection of FD-4 was less than 10 ng/mL). When Mmc and Moc were administered, on the other
hand, the maximum blood concentration (Cmax) was lower than that obtained with FD-4
solution (M; 762.7 ± 300 ng/mL at 60 min, Mmc12; 1178 ± 300 ng/mL at 30 min, Mmc24; 2534 ± 1174 ng/mL at 30 min, Mmc48; 1300 ± 617.2 ng/mL at 60 min, Moc12; 1257 ± 300
907.6 ng/mL at 30 min, Moc24; 1266 ± 635.6 ng/mL at 30 min, and Moc48; 1383 ± 599 ng/mL at 60 min). Furthermore, FD-4 was detected at least 48 h after administration for MGE formulations. No significant difference in FD-4 concentration was observed
between Mmc and Moc formulations. 305
(Figure 8)
4. Discussion
Many reports have been published where cubic and reverse hexagonal liquid
crystal structures (Q2 and H2, respectively) were used as a raw material to develop useful 310
drug delivery systems (Báez-santos et al., 2016; Ki et al., 2014; Liang et al., 2017; Kim et al., 2014). Unlike closed bilayer structures such as liposomes, cubic and reverse
hexagonal liquid crystal structures are non-closed type vehicles. Thus, especially for hydrophilic drugs, the entrapped drugs might easily leak from the vehicles, leading to disadvantages such as low biomembrane permeation and physicochemical instability of 315

12
the drugs. To overcome these problems, formulations containing self-organizing NLLC compounds must be improved. In addition, low-viscosity NLLC-forming lipids may be preferable for designing drug delivery systems for injectable, nasal, and oral cavity
administration (Chang and Bodmeier., 1998; Nguyen et al., 2011; Yang, 2014). In the present study, injectable formulations consisting of an NLLC-forming lipid, MGE, with 320
phospholipids were designed, and the effect of phospholipids in the MGE formulation
was evaluated on the drug release and blood absorption profiles. The cumulative amount of FD-4 released from the MGE formulation was
successfully expressed using eq. 1. NLLC has been receiving increasing attention as a
novel controlled-release carrier, because the drug release rate is closely related to the 325
crystalline phase structure and interplanar spacing for its lattice structure (Clogston and Caffrey, 2015; Clogston et al., 2005; Dellinger and Braun, 2004; Martiel et al., 2014).
A CPP is used to predict which phase structure may be preferentially formed by a given lipid (Garti et al., 2014). In the reverse hexagonal phase, H2, one cylinder is present per unit cell center. The densely packed, straight and water-filled cylinders exhibit 330
two-dimensional ordering. Each cylinder is surrounded by a layer of surfactant molecules perpendicular to the cylinder interface such that their hydrophobic moieties are positioned outwards from the water rod. On the other hand, the reverse cubic bicontinuous phase has
two water channels. These are consecutive but not crossed, and are separated by a lipid bilayer. Consequently, the release rates of entrapped drugs are faster in the order lamellar 335
phases, cubic phases, hexagonal phases, and micellar cubic (Huang and gui, 2018; Zebara
and Mezzenga, 2014). In the present study, the cumulative amount of FD-4 released from the MGE
formulations was related to the interplanar spacing. Furthermore, a good model to express
FD-4 release from the formulations can be estimated using the following parameters; 340
interplanar spacing, MGE content, phospholipid content, number of carbon chains in the phospholipid, and number of double bonds in the carbon chain. According to eq.1 as
above, MGE content, phospholipid content, and the number of carbon chains in the phospholipid acted as negative factors, whereas pore spacing distance and the number of double bonds in the carbon chain were selected as positive factors. Fong et al. reported 345
slower drug release from the H2 phase than from the Q2 phase (Fong and Le, 2012). In the present study, the NLLC structure constructed by MGE was H2 phase. Higher MGE content suppressed the FD-4 release. Thus, MGE content was selected as a negative factor.

13
The amount of FD-4 released decreased with an increase in the lipid chain length. Because the CPP values of DMPC, DPPC, and DSPC are almost the same (1/2 < CPP<1) (Guo et 350
al., 2014), it was difficult to explain the relationship between the decreased release of FD-
4 and the hydrocarbon chain length of phospholipids in the formulation. However, longer hydrocarbon chains have higher van der Waals interactions. Thus, a decrease in the mobility of hydrocarbon chains in phospholipids is probably related to the decreased
release of FD-4. Phospholipids with unsaturated lipid chains have a larger CPP than those 355
with saturated lipid chains, because they bend at the position of the double bond to form an open structure (Zhai et al., 2017). A loose membrane structure caused by DOPC may
be the reason for increased FD-4 release compared with that from the formulation containing DSPC. Thus, the addition of phospholipid into MGE may be useful to prepare injectable formulations to achieve the controlled release of middle- to high-molecular 360
weight drugs. A sponge-like gel was obtained after s.c. administration of the MGE formulation,
suggesting that the formulation can form an NLLC structure in the subcutis, although
freely available fluid in the tissue is slightly different to the in vitro conditions as used in the in vitro release tests and SAXS observations. In addition, the gel was confirmed to 365
retain its shape at least for 7 days. The self-organization process with MGE may begin
from the interface between MGE. Then, when the structural organization is fully formed, the main pathway for FD-4 release should be continuous aqueous channels in the NLLC that connect to the dispersion phase or skin tissue. The blood concentration of FD-4 after
s.c. administration of the Mmc and Moc formulations was significantly prolonged 370
compared with that of its solution. However, no significant difference was found in the FD-4 concentration in blood between them.
Low molecular compounds (<1 kDa) are rapidly taken up into the systemic circulation from blood capillaries after s.c. injection, whereas the rate of absorption of middle- to high-molecular weight compounds such as peptides is typically low, as shown 375
by their prolonged terminal half-life (Jin et al., 2015). Systemic absorption of middle- to high-molecular weight compounds is restricted by their limited permeability across the vascular endothelium, and in this case, the lymphatic system may provide an alternative
absorption pathway (Harvey et al., 2011). Thus, the slower rate of lymphatic absorption decreases blood concentration. 380
14
Throughout in vivo experiment, no severe toxicities were detected (no weight
loss, no respiratory failure and no inflammation at the administrated site). However,
further safety evaluations should be carried out to ensure the usefulness of this MGE as
a pharmaceutical excipient for a depot formulation.
385
5. Conclusion Injectable MGE formulations with phospholipids prepared in the present study
successfully constructed NLLC structures after s.c. injection. In in vitro conditions, the amount of an entrapped hydrophilic high molecular weight molecule, FD-4, released from
the NLLC structure was changed by adding phospholipid to the formulations and can be 390
expressed with selected parameters such as MGE content and interplanar spacing. The formulation formed a sponge-like gel in the subcutaneous layer after injection, and the
sustained blood concentration of FD-4 was obtained after s.c. injection, suggesting that the MGE formulations can be utilized as an injectable formulation to achieve sustained drug release. 395

15
References Angst, M. S., Drover, D. R., 2006. Pharmacology of drugs formulated with
DepoFoamTM: A sustained release drug delivery system for parenteral 400
administration using multivesicular liposome technology. Clinical Pharmacokin. 45, 1153–1176.
Báez-santos, Y. M., Otte, A., Mun, E. A., Soh, B., Song, C., Lee, Y., Park, K., 2016.
Formulation and characterization of a liquid crystalline hexagonal mesophase region of phosphatidylcholine , sorbitan monooleate, and tocopherol acetate for 405
sustained delivery of leuprolide acetate. Int. J. Pharm. 514, 314–321.
Báez-Santos, Y. M., Otte, A., Park, K., 2016. A fast and sensitive method for the detection of leuprolide acetate: A high-throughput approach for the in vitro evaluation of liquid crystal formulations. Anal. Chem. 88, 4613–4618.
Bhosale, R. R., Osmani, R. A., Harkare, B. R., Ghodake, P. P., 2013. Cubosomes : The 410
Inimitable Nanoparticulate Drug Carriers. Scholars Acad. J. Pharm. 2, 481–486. Boge, L., Bysell, H., Ringstad, L., Wennman, D., Umerska, A. Casisa, V., Eriksson, J.,
Joly-Guillou, M., Edwards, K., Andersson, M., 2016. Lipid-based liquid crystals as carriers for antimicrobial peptides: Phase behavior and antimicrobial Effect. Langmuir 32, 4217-4228. 415
Butreddy, A., Narala, A., Dudhipala, N., 2015. Formulation and characterization of liquid crystalline hydrogel of agomelatin: In vitro and ex vivo evaluation. J. App.
Pharm. Sci. 5, 110-114.
Chang, C., Bodmeier, R., 1998. Low viscosity monoglyceride-based drug delivery systems transforming into a highly viscous cubic phase. Int. J. Pharm. 173, 51–420
60.
Chen, Y., Ma, P., Gui, S., 2014. Cubic and hexagonal liquid crystals as drug delivery systems. Biomed Res. Int. 2014, 1-12.
Clogston, J., Caffrey, M., 2005. Controlling release from the lipidic cubic phase. Amino
acids, peptides, proteins and nucleic acids. J. Control. Release 107, 97–111. 425
Clogston, J., Craciun, G., Hart, D. J., Caffrey, M., 2005. Controlling release from the lipidic cubic phase by selective alkylation. J. Control. Release 102, 441–461.
Dellinger, T. M., Braun, P. V., 2004. Lyotropic liquid crystals as nanoreactors for nanoparticle synthesis. Chem. Mater 160, 2201–2207.

16
Evenbratt, H., Ström, A., 2017. Phase behavior, rheology, and release from liquid 430
crystalline phases containing combinations of glycerol monooleate, glyceryl monooleyl ether, propylene glycol, and water. RSC Adv. 7, 32966–32973.
Fong, C., Le T., Drummound. J., 2012. Lyotropic liquid crystal engineering – ordered nanostructured small molecule amphiphile self-assembly materials by design. Chem. Soc. Rev. 41, 1297–1322. 435
Garti N., Libster D., Aserin A. 2014. Solubilization and delivery of drugs from GMO-based lyotropic liquid crystals, in: Li Q, (eds.), Manpscience with liquid crystals, Springer, New York, pp. 355–414.
Guo, D., Huang, J., 2017. New Developments in Long-Acting Injectable Nanoformulations. Glob. J. Pharmceu. Sci. 4, 1-7. 440
Guo, Y., Pogodin, S., Baulin, V. A., Guo, Y., Pogodin, S., Baulin, V. A., 2014. General
model of phospholipid bilayers in fluid phase within the single chain mean field theory. J. Chem. Phys. 140, 1-9.
Harvey, A. J., Kaestner, S. A., Sutter, D. E., Harvey, N. G., Mikszta, J. A., Pettis, R. J.,
2011. Microneedle-based intradermal delivery enables rapid lymphatic uptake and 445
distribution of protein drugs. Pharm. Res. 28, 107–116. Huang, Y., & Gui, S., 2018. Factors affecting the structure of lyotropic liquid crystals
and the correlation between structure and and drug diffusion. RSC Adv. 8, 6978–6987.
Jin, J., Zhu, L., Chen, M., Xu, H. Wang, H., Feng, X., Zhu, X., Zhou, Q., 2015. The 450
optimal choice of medication administration route regarding intravenous, intramuscular, and subcutaneous injection. Patient Prefer. Adherence 9, 923–942.
Kadhum, W. R., Hada, T., Hijikuro, I., Todo, H., Sugibayashi, K., 2017. Development
and optimization of orally and topically applied liquid crystal drug formulations. J. Oleo Sci. 66, 939–950. 455
Kadhum, W. R., Sekiguchi, S., Hijikuro, I., Todo, H., Sugibayashi, K., 2017. A novel
chemical enhancer approach for transdermal drug delivery with C17-monoglycerol ester liquid crystal-forming lipid. J. Oleo Sci. 66, 443–454.
Ki, M., Lim, J., Ko, J., Park, S., Kim, J., Cho, H., Park, E., Kim, D., 2014. A new
injectable liquid crystal system for one month delivery of leuprolide. J. Control. 460
Release 185, 62–70.

17
Kim, D., Jahn, A., Cho, S., Kim, J., Ki, M., Kim, D., 2014. Lyotropic liquid crystal systems in drug delivery: a review. J. Pharm. Invest. 45, 1-11.
Kulkarni, C. V., Wachter, W., Iglesias-Salto, G., Engelskirchen, S., Ahualli, S., 2011.
Monoolein: a magic lipid? Phys. Chem. Chem. Phys. 13, 3004–3021. 465
Lee, H., Song, C., Baik, S., Kim, D., Hyeon, T., Kim, D.-H., 2018. Device-assisted transdermal drug delivery. Adv. Drug. Deliv. Rev. 127, 35-45.
Liang, X., Chen, Y., Jiang, X., Wang, S., Zhang, J., Gui, S., 2017. H II mesophase as a drug delivery system for topical application of methyl salicylate. Eur. J. Pharm.
Sci. 100, 155–162. 470
Lim, J. L., Ki, M. H., Joo, M. K., An, S. W., Hwang, K. M., Park, E. S., 2015. An injectable liquid crystal system for sustained delivery of entecavir. Int. J. Pharm. 490, 265–272.
Martiel, I., Sagalowicz, L., Mezzenga, R., 2014. Phospholipid-based nonlamellar mesophases for delivery systems: Bridging the gap between empirical and rational 475
design. Adv. Colloid Interface Sci. 209, 127–143.
Mei, L., Xie, Y., Huang, Y., Wang, B., Chen, J., Quan, G., Pan, X., Liu, H., Wang, L., Liu, X., Wu, C., 2018. Injectable in situ forming gel based on lyotropic liquid crystal for persistent postoperative analgesia. Acta Biomater. 67, 99–110.
Nguyen, T., Hanley, T., Porter, C. J. H., Boyd, B. J., 2011. Nanostructured liquid 480
crystalline particles provide long duration sustained-release effect for a poorly water soluble drug after oral administration. J. Control. Release 153, 180–186.
Otte, A., Soh, B. K., Yoon, G.,Park, K., 2018. Liquid crystalline drug delivery vehicles for oral and IV/subcutaneous administration of poorly soluble (and soluble) drugs. Int. J. Pharm. 539, 175–183. 485
Park, K., 2014. Controlled drug delivery systems: Past forward and future back. J.
Control. Release 190, 3–8. Rajabalaya, R., Musa, M. N., Kifli, N., & David, S. R., 2017. Oral and transdermal drug
delivery systems: Role of lipid-based lyotropic liquid crystals. Drug Des. Devel.
Ther. 11, 393–406. 490
Rosenbaum, E., Tavelin, S., Johansson, L. B.-Å., 2010. A characterization study on the
application of inverted lyotropic phases for subcutaneous drug release. International Journal of Pharmaceutics, 388, 52–57.

18
Santos, A., Sinn Aw, M., Bariana, M., Kumeria, T., Wang, Y., & Losic, D., 2014. Drug-releasing implants: Current progress, challenges and perspectives. J. Mater. 495
Chem. B 2, 6157–6182.
Shi, X., Peng, T., Huang, Y., Mei, L., Gu, Y., Huang, J., Han, K. Li, G., Hu, C., Pan, X., Wu, C. 2015. Comparative studies on glycerol monooleate- and phytantriol-based cubosomes containing oridonin in vitro and in vivo. Pharm. Dev. Technol. 22,
322-329. 500
Wilczewska, A. Z., Niemirowicz, K., Markiewicz, K. H., Car, H., 2012. Nanoparticles as drug delivery systems. Pharmacolo. Reports 64, 1020–1037.
Wu, Z., Alany, R. G., Tawfeek, N., Falconer, J., Zhang, W., Hassan, I. M., Rutland, M., Svirskis, D., 2014. A study of microemulsions as prolonged-release injectables through in-situ phase transition. J. Control. Release 174, 188–194. 505
Yang, Z., 2014. Evaluating the potential of cubosomal nanoparticles for oral delivery of amphotericin B in treating fungal infection. Int. J. Nanomed. 9, 327-336.
Zabara, A., Mezzenga, R., 2014. Controlling molecular transport and sustained drug
release in lipid-based liquid crystalline mesophases. J. Control. Release 188, 31–43. 510
Zhai, J., Tran, N., Sarkar, S., Fong, C., Mulet, X., & Drummond, C. J., 2017. Self-
assembled lyotropic liquid crystalline phase behavior of monoolein-capric acid-phospholipid nanoparticulate systems. Langmuir 33, 2571-2580.

19
Figure captions 515
Figure 1 Water uptake into the MGE formulations 48 h after contact with PBS.
Nomenclature of the formulation codes of Mαβ are as follows; M: MGE, α: type of phospholipid (mc: DMPC, pc; DPPC, sc: DSPC, oc: DOPC), β: concentration of phospholipid (12, 24, 36, and 48).
520
Figure 2 Polarized image of the MGE formulations 15 min after contact with PBS. Formulation codes: same as in Fig. 1.
Figure 3 Small-angle X-ray analysis of the MGE formulations 48 h after contact with PBS. Formulation codes: same as in Fig. 1. 525
Figure 4 Amount of FD-4 released from the MGE formulations. Formulation codes: same
as in Fig. 1. Each point represents the mean ± S.D. (n = 3 - 4). * p < 0.05 Figure 5 Relationship between interplanar spacing and the cumulative amount of FD-4 530
released (a) (r2=0.98) and prediction of the logarithm of the cumulative amount of FD-4
released from the MGE formulations (b). Formulation codes: same as in Fig. 1. Line in Fig. 5b: log $%4!"#"$%"& = 0.434 ∙ ,- − 0.020 ∙ 01 − 0.027 ∙ 31 − 0.018 ∙ 611 +0.304 ∙ 6% + 0.709(r2 = 0.82). The root of mean square error (RMSE) was 0.1444.
535
Figure 6 Whole animal images of rats visualized using and IVIS Spectrum 0, 1, and 2 days after s.c. injection of M. A formulation containing FD-4 was injected and its
localization was observed. The formulation was administered to the back of rat on the right side using a 1 mL-disposal syringe with a 23G needle. 540
Figure 7 Distribution of FD-4 (a and b) and constructed gel (c) after s.c. injection of M. A distribution of green color derived from FD-4 was confirmed 1 h (a) and 24 h (b) after administration. The constructed gel was collected from the administration site 48 h after
s.c. injection in rats. 545

20
Figure 8 Time course of blood concentration of FD-4 after s.c. injection of Mmc (a) and Moc (b) formulations in rats. Symbols in (a); �: FD-4 solution, �: M, r: Mmc12, ¯: Mmc24, and £: Mmc48. Symbols in (b); �: FD-4 solution, �: M, p: Moc12, u: Moc24,
and ¢: Moc48. Each point represents the mean ± S.D. (n = 3 - 4). 550

21
Ta
ble
1 Co
mpo
sitio
n of
the
MG
E fo
rmul
atio
ns c
onta
inin
g di
ffere
nt ty
pes o
f pho
spho
lipid
oc fo
rmul
atio
ns
oc
48
40
---
---
---
48
10
2
M: M
GE,
α: t
ype
of p
hosp
holip
id, β
: con
cent
ratio
n of
pho
spho
lipid
, mc:
DM
PC, p
c; D
PPC,
sc: D
SPC,
oc:
DO
PC.
Uni
t: w
eigh
t per
wei
ght (
w/w
)
36
52
---
---
---
36
10
2
24
64
---
---
---
24
10
2
12
76
---
---
---
12
10
2
sc fo
rmul
atio
ns
sc
36
52
---
---
36
---
10
2
24
64
---
---
24
---
10
2
12
76
---
---
12
---
10
2
pc fo
rmul
atio
ns
pc
36
52
---
36
---
---
10
2
24
64
---
24
---
---
10
2
12
76
---
12
---
---
10
2
mc
form
ulat
ions
mc
48
40
48
---
---
---
10
2
36
52
36
---
---
---
10
2
24
64
24
---
---
---
10
2
12
76
12
---
---
---
10
2
M
---
---
100
---
---
---
---
α β M
mc pc
sc
oc
Etha
nol
Tw
een
80

22
Table 2 Constructed liquid crystal structure and interplanar spacing of the formulations
Formulation Liquid crystal structure d (nm)
M H2 4.36
Mmc12 Pn3m 5.33
Mmc24 Pn3m 6.42
Mmc36 Pn3m 7.39
Mmc48 Pn3m 6.76
Mpc12 Pn3m 5.32
Mpc24 Pn3m 6.34
Mpc36 Pn3m 7.39
Msc12 H2 4.87
Msc24 H2 + Pn3m 5.49
Msc36 Pn3m 6.61
Moc12 H2 4.65
Moc24 H2 4.95
Moc36 Pn3m 6.28
The relative positions of the Bragg peaks are in a ratio of √ 2:√ 3:√ 4 showing Pn3m structure. The
spacing ratio of 1:!1 3$ :!1 4$ :!1 7$ shows H2 structure. The peak positions were calculated with
SAXS data shown in Fig. 3.

23
Fig. 1 555

24
Fig. 2
560
565
570
575
580
585
100.0 µm
M
Mmc48
Mmc24
Mmc12
Mmc36
Moc48
Moc24
Moc12
Moc36
Msc24 Mpc24
Msc36
Msc12
Mpc36
Mpc12
25
Fig. 3 590
595
600
0.2 0.7 1.2 1.7 2.2 2.7 3.2 3.7 4.2 4.7
MMmc12Mmc24Mmc36Mmc48
0.2 0.7 1.2 1.7 2.2 2.7 3.2 3.7 4.2 4.7
MMoc12Moc24Moc36Moc48
0.2 0.7 1.2 1.7 2.2 2.7 3.2 3.7 4.2 4.7
MMpc12Mpc24Mpc36
0.2 0.7 1.2 1.7 2.2 2.7 3.2 3.7 4.2 4.7
MMsc12Msc24Msc36
(a)
Intensity
(c) (d)
2θ
(b)

26
Fig. 4 605
610
615

27
Mea
sure
d am
ount
of L
og R
R
Predicted amount of Log RR
0.4
0.6
0.8
1.0
1.2
1.4
1.6
0.2
1.8
0.4 0.6 0.8 1.0 1.2 1.4 1.6 1.80.2
R2 = 0.82RMSE = 0.1444
(a)
(b)Interplanar spacing, d (nm)
y = 9.0721x - 38.106R² = 0.7763
0
10
20
30
40
50
4 5 6 7 8
Mmc48
Mpc36
Mpc24Msc36
Mmc36
Mmc24
Moc36Moc48
Mpc12
Mmc12Moc24
MMoc12
Msc12 Msc24
Cum
ulat
ive
amou
ntof
FD-4
rele
ased
(%)
Fig. 5

28
Fig. 6 620
625
630
635
640
645
650
Day 0 Day 1
Day 2
2.0
1.5
1.0
0.5
x108
Radiance
(p/sec/cm2/sr)
Color scale
Min = 4.00 ´106
Max = 2.00 ´108

29
Fig. 7 (a)
500.0 µm
1.0 cm
(b)
(c)
Stratum corneum Viable epidermis
Subctanous layer
Stratum corneum
Dermis
Subctanous layer
500.0 µm
1 h 24 h
Dermis
Viable epidermis
30
10
100
1000
10000
0 12 24 36 48
10
100
1000
10000
0 12 24 36 48
Time (h)
Time (h)
(b)
Bloo
d co
nc. o
f FD
-4 (n
g/m
L)Bl
ood
conc
. of F
D-4
(ng/
mL)
(a)Fig. 8 655