integral mass balance (imb) method for measuring
TRANSCRIPT
doi.org/10.26434/chemrxiv.12855551.v1
Integral Mass Balance (IMB) Method for Measuring Multicomponent GasAdsorption Equilibria in Nanoporous MaterialDarren Broom, Orhan Talu, Michael J. Benham
Submitted date: 24/08/2020 • Posted date: 25/08/2020Licence: CC BY-NC-ND 4.0Citation information: Broom, Darren; Talu, Orhan; Benham, Michael J. (2020): Integral Mass Balance (IMB)Method for Measuring Multicomponent Gas Adsorption Equilibria in Nanoporous Material. ChemRxiv.Preprint. https://doi.org/10.26434/chemrxiv.12855551.v1
Multicomponent gas adsorption equilibria must be determined in order to assess the performance of anadsorbent for a particular gas separation and for process design. The experimental techniques commonlyused for this purpose, however, are time-consuming and typically require large samples. In this article, wedescribe a new approach, called the Integral Mass Balance (IMB) method, which combines the controlled flowof a gas mixture with in-situ gravimetric measurement and gas composition analysis using quadrupole massspectrometry. The IMB method allows very rapid equilibrium multicomponent gas adsorption measurementsto be performed on samples weighing only a few grams. The method is demonstrated and validated byperforming binary O2/N2 adsorption measurements on a commercial 5A zeolite, at ambient temperature anda total pressure of 0.915 MPa. Excellent agreement with previously published data was found, using a 3.5 gsample, with a measurement time of only four hours for a twenty point isotherm. In contrast, other techniquesof equivalent accuracy would require around twenty days of experimental effort to collect a comparableamount of data. Selectivities were also calculated and shown to agree with previously published results. Inprinciple, the technique could readily be extended to measure gas adsorption from ternary or higher mixtures.
File list (1)
download fileview on ChemRxivBroom-IMB-method-multicomponent-adsorption.pdf (1.71 MiB)

1
Integral Mass Balance (IMB) method for measuring
multicomponent gas adsorption equilibria in
nanoporous materials
Darren P. Broom,* † Orhan Talu‡ and Michael J. Benham†
† Hiden Isochema Ltd, 422 Europa Boulevard, Warrington WA5 7TS, UK
‡ Chemical and Biomedical Engineering, Cleveland State University, Cleveland, Ohio 44115,
USA
ABSTRACT
Multicomponent gas adsorption equilibria must be determined in order to assess the performance
of an adsorbent for a particular gas separation and for process design. The experimental
techniques commonly used for this purpose, however, are time-consuming and typically require
large samples. In this article, we describe a new approach, called the Integral Mass Balance
(IMB) method, which combines the controlled flow of a gas mixture with in-situ gravimetric
measurement and gas composition analysis using quadrupole mass spectrometry. The IMB
method allows very rapid equilibrium multicomponent gas adsorption measurements to be
performed on samples weighing only a few grams. The method is demonstrated and validated by
performing binary O2/N2 adsorption measurements on a commercial 5A zeolite, at ambient

2
temperature and a total pressure of 0.915 MPa. Excellent agreement with previously published
data was found, using a 3.5 g sample, with a measurement time of only four hours for a twenty
point isotherm. In contrast, other techniques of equivalent accuracy would require around twenty
days of experimental effort to collect a comparable amount of data. Selectivities were also
calculated and shown to agree with previously published results. In principle, the technique
could readily be extended to measure gas adsorption from ternary or higher mixtures.
INTRODUCTION
Separating gases using porous adsorbents usually relies on the selective adsorption of one
species over another.1,2 Industrial separations tend to exploit equilibrium selectivity, for which
multicomponent (binary or higher) gas adsorption isotherms provide essential information for
assessing adsorbents for a given separation and for process design.3 Obtaining such data,
however, is experimentally challenging.4-9 As a result, usually only binary adsorption data are
measured in order to save time and effort on tedious experiments.
Single component (pure gas) isotherms can be measured using a range of techniques, of which
the volumetric/manometric10-12 and gravimetric10,11,13,14 methods are the most common. Both
approaches can be extended to multicomponent adsorption, but the challenge is in determining
the adsorbed phase composition – at a specified gas phase composition – in addition to the total
amount adsorbed. Gravimetric measurements, for example, provide only the total weight change
of a sample, as a result of adsorption, while volumetric/manometric measurements typically
involve measuring only the total pressure change in a system of known volume. Neither the total
sample weight nor the total system pressure change can determine the amount of each individual

3
component adsorbed by the sample. This information, however, can be obtained in a number of
different ways, which we will now briefly review.
Volumetric Methods for Mixture Adsorption Equilibrium
Multicomponent volumetric methods tend to use either open or closed systems and various
approaches have been developed over the last sixty or so years.4,5,15-19 In the most commonly
used closed systems, gases are delivered from different calibrated volumes and are recirculated,
using a pump, to mix the components and force them through an adsorbent bed.20-22 Once
equilibrium has been achieved, the bed is isolated, and the pressure and temperature measured.
The gas composition in the system is then determined using, for example, a Mass Spectrometer
(MS) or, more commonly, a Gas Chromatograph (GC).19,23 The amount of each component
adsorbed can then be calculated from material balances between the initial and final contents of
the void space of the instrument. Care must be taken to ensure equilibrium has been achieved,
which may require hours; and, although the final gas pressures – both partial and total – can be
measured to high accuracy, they cannot be controlled. This lack of control over the final state of
the system can make presentation of phase diagrams challenging due to the additional degree of
freedom. Nevertheless, providing a large enough sample is used, high accuracy results can be
obtained using this approach.
Open system multicomponent volumetric measurements, meanwhile, involve passing a gas
mixture through an adsorbent bed using Mass Flow Controllers (MFCs), while measuring the
outlet flow rate and determining the downstream gas composition using a GC4,21 or MS.24,25
Measurements made at total pressures other than ambient require a back pressure regulator, or a
flow controller, to be mounted downstream of the bed. A material balance expression is then
4
used to calculate the amount of each component adsorbed, by integrating the inlet and outlet flow
rates and gas compositions. As equilibration is quicker in open systems, these measurements are
less time-consuming than their closed system counterparts. An additional advantage is the
control over the final partial and total gas pressures, which helps in determining phase diagrams.
High accuracy, however, is difficult to achieve, because of the relatively low accuracy of gas
flow control and measurement, particularly with mixtures of varying composition and pressure.24
A third multicomponent volumetric option involves isolating an open system, following
equilibration, and then desorbing or transferring the entire contents of the column into a separate
volume for analysis. Measuring pressure and temperature, and determining the gas composition
in the desorption chamber, then allows calculation of the amount of each component adsorbed,
prior to desorption.26-31 This approach, sometimes called the total desorption method,3,6,25 has
been used for many years.17,18 It is the most accurate way of measuring multicomponent gas
adsorption equilibria, at any desired partial or total pressure and temperature, but it is very
laborious.5,6 For every isotherm point, the adsorbent bed must be heated to fully desorb the gas,
while the desorption chamber is usually cooled, to collect the contents of the bed. This process,
including subsequent analysis of the gas composition, requires hours of additional time and
effort.
Gravimetric Methods for Mixture Adsorption Equilibrium
Gravimetric multicomponent methods, meanwhile, tend to take one of two forms.11 The first
involves a similar measurement to the closed volumetric systems described above. A gas mixture
is circulated through a gravimetric system, while the sample weight is monitored using the
microbalance. Once equilibrium has been achieved – in terms of sample temperature, total
5
pressure, and sample weight – the gas composition is analyzed using a GC or MS. The amount of
each component adsorbed can then be calculated by combining the total weight measurement
with the final gas composition.23,32-35 Sample size, in this case, is limited by the microbalance
capacity, but the dead volume of the system must also be low enough to make a reliable
measurement. Using a small sample in a large volume will prevent detection of sufficient
differences in the gas phase, to allow calculation of the amount of each component adsorbed;
although an auxiliary adsorbent bed can be used to increase sensitivity, if required.34
Equilibration times are also lengthy;33,34 and, similar to closed volumetric systems, the final
partial and total pressures cannot be controlled.
The second option avoids the need for gas composition analysis, using a GC or MS, by
combining the gravimetric and volumetric techniques.32,36 In this case, gases are delivered from
calibrated volumes and circulated through a gravimetric system. Following equilibration, the
total pressure and system volume are combined with the sample weight measurement and an
equation of state for the gas mixture, in order to calculate the amount of each component
adsorbed. This method is limited to binary mixtures and only works for adsorbate pairs with
sufficiently different molar masses. Accuracy also depends on the difference between the
molecular weights. Further drawbacks include long equilibration times36 and a lack of control
over the final partial and total gas pressures.3,6
Other Methods to Approximate Mixture Adsorption Equilibrium
The main approaches described above – both volumetric and gravimetric – provide full
adsorption equilibrium characterization data. That is, all variables in the functionalities n1,2 =
f1,2(T, P, y1) are measured or set. The intensive variables, n1, n2, T, P and y1, however, are not
6
independent of one another, due to the Gibbs-Duhem relation,37 and so thermodynamic relations
can be used to calculate the value of one from all the others; at the expense of thermodynamic
consistency checks, which in this case then become redundant. Mathematically, these are
differential equations, and some of the partial derivatives can be measured directly. Other
multicomponent measurement methods, mostly based on gas chromatography,38-45 therefore
exploit this approach.
In gas chromatography, the response at the outlet of a column is monitored while a change in the
inlet concentration is made. Frontal chromatography, for measuring breakthrough curves, for
example, is a common approach to studying mixture adsorption.19,46-49 This is similar to open
system multicomponent volumetric measurement, except the outlet flow rate is not usually
determined in chromatographic systems, as only the outlet gas composition is required to
measure a breakthrough curve. Binary gas adsorption, however, can also be studied using other
types of gas chromatography.41 At low concentrations, for example, a pulse of the gas mixture
can be injected into an inert (non-adsorbing) carrier gas, or a pulse of one component injected
into an adsorbing carrier.38 Measured retention times – the time taken for each component to
appear in the effluent – are usually related to some form of the partial derivatives of the adsorbed
phase, with respect to partial pressure, and can therefore be used to determine Henry’s law
coefficients for each component. Alternatively, isosteric enthalpies or heats of adsorption can be
determined from the temperature derivatives. In concentration pulse chromatography,
meanwhile, a pulse of one component is injected into a carrier gas consisting of the binary
mixture.40,42,43,50-54 This allows binary gas adsorption to be studied at higher partial pressures.
Concentration steps can also be applied.39
7
In contrast to other multicomponent techniques, gas chromatography measurements tend to be
quick. A bed must first be prepared for adsorption and equilibrated with the carrier gas, but a
single data point can be determined in the time taken for a pulse or concentration change to pass
through the column, which may only be a matter of minutes. Measurement conditions are also
well controlled. However, the required data analysis is complex. Only differential adsorbed
quantities can be determined, so a mathematical isotherm equation must be assumed in order to
relate retention time to the amount of each component adsorbed.40,41,43,44,51,53
Finally, one very different approach to measuring binary adsorption equilibrium is isotope
exchange, which uses isotopic tracers.55,56 Rynders et al,55 for example, described a closed loop
cycle method, in which a gas mixture is circulated through an adsorbent bed, before an isotope is
switched into the flow. The response of the system is then determined using an MS. Adsorption
kinetics can be studied using this method, but multicomponent equilibria can also be determined
by monitoring the mole fractions of the isotopic species of different components in the system.55
The basic premise of this approach is the fact that there cannot be any equilibrium adsorption
selectivity between isotopes of the same component. An obvious disadvantage of isotope
exchange, however, together with the related technique of tracer gas chromatography,57 is the
need to use isotopes, which can be expensive and may not be readily available. A large amount
of sample – at least 10 g, for example – is also required to obtain accurate data.
The Ongoing Need for New Methods
Measurements made using the above techniques are therefore mostly time-consuming and
typically require large samples. Some early volumetric studies,20,26 for instance, used tens of
grams of material, and a more recent report24 of an open volumetric system used sample sizes of
8
~26 g and ~29 g. In closed volumetric or gravimetric systems, several hours are often required to
ensure equilibrium has been achieved, solely for a single data point,4-6,34 and the adsorbent must
be regenerated each time. Open system measurements, meanwhile, although rapid, tend to be
inaccurate due to the difficulty, as noted above, of measuring flow rates of gas streams with
changing composition and sometimes pressure.4,5,24 Errors and uncertainties can also accumulate,
particularly when individual readings – of temperature, pressure, or flow – are being summed or
integrated over time to calculate adsorbed quantities. Such problems can be reduced, to some
extent, by increasing sample size,34 but this is a significant practical disadvantage. No existing
technique therefore provides a widely applicable and convenient way of measuring
multicomponent gas adsorption isotherms.9 The most accurate are laborious, while quicker
methods tend to be less accurate and require large samples, which causes a problem when
characterizing new materials that are often only available in small quantities.
The number of new nanoporous materials, meanwhile, has increased dramatically in recent
years.7,58-63 There is significant interest in using them to separate gases,7,19,46,58,59,64 but the lack of
convenient methods for practically assessing their performance for specific separations is
problematic. To simply estimate their separation performance, single component isotherms are
often combined to predict multicomponent gas adsorption using methods such as Ideal Adsorbed
Solution Theory (IAST);8,65 however, IAST, in particular, has limitations – it applies mainly, for
example, to ideal mixtures of adsorbates of similar size and interaction strength.8 Computer
simulations – using, for example, Grand Canonical Monte Carlo (GCMC) methods – are very
useful for estimating competitive adsorption. But they rely on idealized computational models of
materials and on the accuracy of the description of the intermolecular interactions in any given
adsorbate-adsorbent system. The only way to determine the adsorption properties of a real
9
adsorbent to sufficient accuracy, particularly for developing practical separations, is therefore to
measure them.19 Despite decades of research, however – and the unquestionable success of
industrial separation processes – convenient and accurate experimental techniques for measuring
multicomponent gas adsorption have remained elusive. Advances in this area would therefore
still be very valuable.9
In light of the above, we now describe a new approach, called the Integral Mass Balance (IMB)
method, which combines an open flowing system with in-situ gravimetric measurement and gas
analysis using quadrupole mass spectrometry. It allows very rapid determination of
multicomponent gas adsorption isotherms at near ambient temperature, up to total pressures of at
least 1.0 MPa, using only a few grams of sample, and therefore offers the promise of improving
the speed, accuracy, and convenience of multicomponent measurement. A complete dataset can
be collected in a matter of hours, compared to several days of experimental effort using other
techniques of comparable accuracy. To the best of our knowledge, it has not been reported
before.
We begin by introducing the necessary background, before describing the experimental set-up
and procedure. We then present O2/N2 binary adsorption measurements on a commercial 5A
zeolite. These measurements validate the technique because similar, thermodynamically
consistent,66 results have been obtained previously for the same sample, using two different
volumetric techniques in two different laboratories,21 and excellent agreement has been found.
We conclude by discussing possible limitations of the technique, and its potential future use for
measuring kinetics and adsorption from ternary or higher gas mixtures.
10
BACKGROUND
A conventional open volumetric system uses an adsorption column and operates with a constant
inlet flow of known composition, preferably at constant temperature and pressure. The sample
mass is determined following activation of the adsorbent at high temperature, under vacuum or
helium flow, and the total outlet flow rate and outlet gas composition are measured during an
experiment. The material balance for this system enables the partial molar quantities of each
component adsorbed to be calculated from the difference between the inlet and outlet molar flow
rates of each component and the gas retained in the column void space.
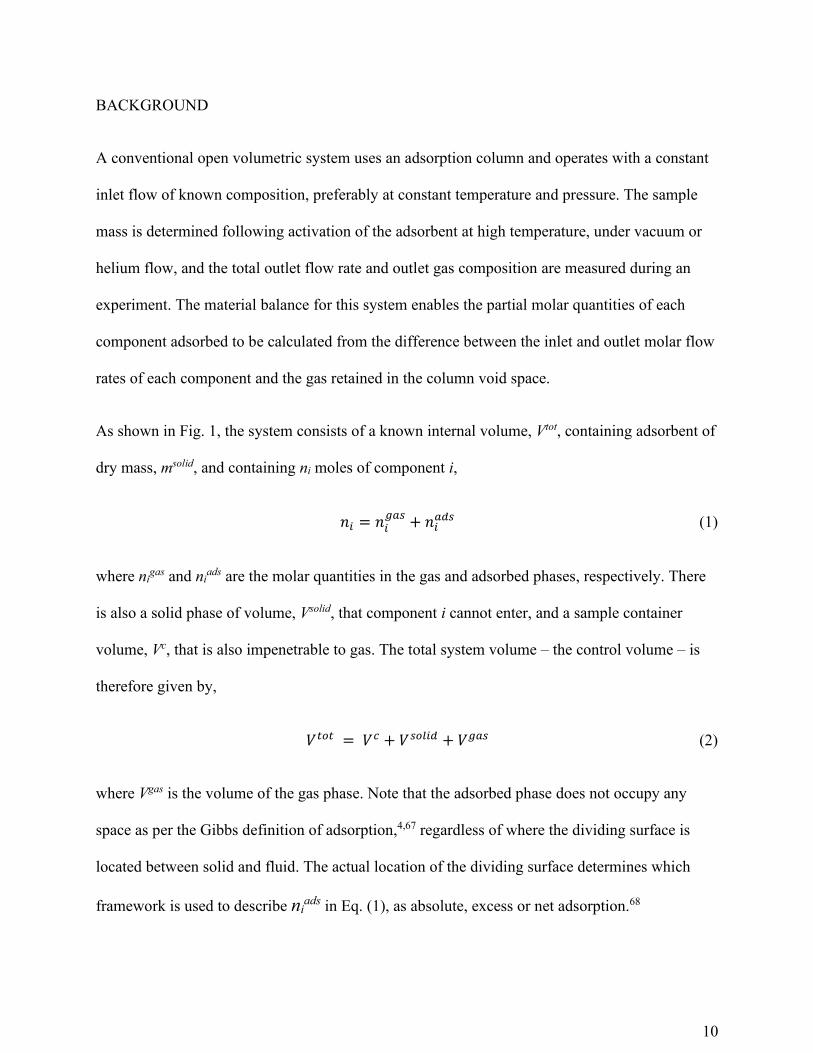
As shown in Fig. 1, the system consists of a known internal volume, Vtot, containing adsorbent of
dry mass, msolid, and containing ni moles of component i,
𝑛𝑖 = 𝑛𝑖𝑔𝑎𝑠
+ 𝑛𝑖𝑎𝑑𝑠 (1)
where nigas and ni
ads are the molar quantities in the gas and adsorbed phases, respectively. There
is also a solid phase of volume, Vsolid, that component i cannot enter, and a sample container
volume, Vc, that is also impenetrable to gas. The total system volume – the control volume – is
therefore given by,
𝑉𝑡𝑜𝑡 = 𝑉𝑐 + 𝑉𝑠𝑜𝑙𝑖𝑑 + 𝑉𝑔𝑎𝑠 (2)
where Vgas is the volume of the gas phase. Note that the adsorbed phase does not occupy any
space as per the Gibbs definition of adsorption,4,67 regardless of where the dividing surface is
located between solid and fluid. The actual location of the dividing surface determines which
framework is used to describe niads in Eq. (1), as absolute, excess or net adsorption.68

11
Figure 1. A schematic diagram of a conventional open volumetric system column, indicating the
parameters and variables required to calculate the adsorbed quantities. The inlet quantities (f in,
yiin) are held constant, while the outlet quantities (f out, yi
out) are measured as a function of time, at
constant P and T. The control volume, Vtot, is a sum of the volumes of the sample, Vsolid, the gas
phase, Vgas, and any containment material – a holder, for example, or filters, Vc.
For a breakthrough experiment, the molar material balance between the inlet and outlet for the
system, assuming no chemical reactions, can be written with respect to chemical component i as,
𝑓𝑖𝑛𝑦𝑖𝑖𝑛 − 𝑓𝑜𝑢𝑡𝑦𝑖
𝑜𝑢𝑡 =𝑑𝑛𝑖
𝑑𝑡 (3)
where f is the total molar flow rate and yi is the molar fraction in the inlet and outlet flows. Open
volumetric systems, with all their inherent advantages with respect to experiment time, determine
the adsorbed amount of a given component, Δniads, by integration of Eq. (3) as,
∆𝑛𝑖𝑎𝑑𝑠 = ∫ (𝑓𝑖𝑛𝑦𝑖
𝑖𝑛 − 𝑓𝑜𝑢𝑡𝑦𝑖𝑜𝑢𝑡)
𝑡
0𝑑𝑡 − ∆𝑛𝑖
𝑔𝑎𝑠 (4)

12
where Δnigas is the molar quantity of component i accumulated in the gas phase of the column in
Vgas. This approach, however, has practical limitations with regard to accuracy, as noted in the
Introduction, due to the uncertainty in determining the total outlet flow rate.4,24
Figure 2. A schematic diagram of the IMB method column, indicating the parameters and
variables required to calculate the adsorbed quantities. The inlet quantities (Fin, Yiin) are held
constant, while the outlet composition (Yiout) and weight change of the sample (dw/dt) are
measured as a function of time, at constant P and T. The control volume is a sum of the volumes
of the sample, the gas phase, and the sample container or bucket.
13
The IMB method overcomes this limitation by combining gravimetric analysis with the open
system measurement. As shown in Fig. 2, the system still consists of the control volume as
above, but with the adsorbent freely suspended in a gas permeable container, or bucket, within
the vessel in order that it can be weighed continuously. The gas mixture enters via a diffuser in
the base of the vessel and flows past the sample. The exhaust mixture passes through a chimney
and is evacuated by the gravimetric system exhaust control valve. The composition of the
exhaust gas is then sampled within the chimney to an online MS. Compared to traditional open
volumetric systems, the most significant difference is that the outlet flow rate is not measured,
because it is not needed, as we show next.
It is easier to work with mass rather than molar balances for the IMB system, and so we begin by
defining the mass confined between the inlet and the outlet in Fig. 2 as,
𝑚 = 𝑚𝑐 + 𝑚𝑠𝑜𝑙𝑖𝑑 + 𝑚𝑔𝑎𝑠 + 𝑚𝑎𝑑𝑠 (5)
where mc is the mass of the sample container, and mgas and mads are the masses of the gas and
adsorbed phases, respectively. The mass balance is written with respect to component i as,
𝐹𝑖𝑛𝑌𝑖𝑖𝑛 − 𝐹𝑜𝑢𝑡𝑌𝑖
𝑜𝑢𝑡 =𝑑𝑚𝑖
𝑑𝑡 (6)
where F is total mass flow rate and Yi is the mass fraction in the inlet and outlet flows. Mass
fraction is defined as,
𝐹𝑖 = 𝑀𝑖𝑦𝑖𝑓 ∶ 𝑌𝑖 =𝑀𝑖𝑦𝑖
�̅� (7)
where Mi is the molar mass of component i and �̅� is the mean molar mass of the gas mixture.
The component mass balance in Eq. (6) can be summed for all components to give,
14
𝐹𝑜𝑢𝑡 = 𝐹𝑖𝑛 − 𝑑𝑚
𝑑𝑡 (8)
The total outlet flow rate, Fout, can then be substituted into Eq. (6) and the equation integrated to
give the change in mass of component i, Δmi, as,
∆𝑚𝑖 = ∫ (𝐹𝑖𝑛𝑌𝑖𝑖𝑛 − (𝐹𝑖𝑛 −
𝑑𝑚
𝑑𝑡 ) 𝑌𝑖
𝑜𝑢𝑡)𝑡
0𝑑𝑡 (9)
Here, mass refers to the total accumulation of component i in the system, in both the gas and
adsorbed phases. Some simplification then gives,
∆𝑚𝑖 = 𝐹𝑖𝑛 ∫ ( 𝑌𝑖𝑖𝑛 − 𝑌𝑖
𝑜𝑢𝑡)𝑡
0𝑑𝑡 + ∫ 𝑌𝑖
𝑜𝑢𝑡𝑡
0𝑑𝑚 (10)
This is the main equation required to analyze IMB data. Note that the term involving mass only
includes a differential quantity, dm, which can be measured more accurately in long experiments.
A typical measurement comprises an isothermal step change to a new fixed gas inlet composition
at time t = 0. The mass change is calculated in the long-time limit after equilibration (Yiin = Yi
out,
dm/dt = 0), where both integrals tend to zero; hence there should be no accumulation of
uncertainty. It is essentially a point-to-point measurement of mixture adsorption with a time
response similar to chromatographic experiments. From a practical viewpoint, this also means a
dynamic calibration, usually a linear interpolation, can be applied between the gas analyzer and
inlet flow composition at the end of each adsorption step. There should therefore also be no
disadvantage in using a multipoint method to determine equilibrium isotherms of the partial
adsorbed amount, with the concomitant saving in experiment time. Proper time-lags, of course,
must be applied to different signals in the experiment, in order to bring all to a common time
15
basis before integrating the raw data. Details of the dynamic MS calibration and time-lag
measurements are provided in the Supporting Information (SI).
To convert Eq. (10) to the partial amount of each component adsorbed, two further contributions
must be considered:
1. The internal balance measurement, w, must be corrected for buoyancy to calculate the
system mass change term, dm.
2. The accumulation in the fluid phase in the column must be subtracted from ∆𝑚𝑖,
according to the chosen reference state, whether net, excess or absolute adsorption.
Details of these contributions are provided in the SI, but the final equation for calculating the
partial amount of component i adsorbed using the IMB method is,
𝑀𝑖∆𝑛𝑖𝑎𝑑𝑠 = 𝐹𝑖𝑛 ∫ ( 𝑌𝑖
𝑖𝑛 − 𝑌𝑖𝑜𝑢𝑡)
𝑡
0𝑑𝑡 + ∫ 𝑌𝑖
𝑜𝑢𝑡𝑡
0𝑑𝑤 +
𝑃𝑉𝑡𝑜𝑡
𝑍𝑅𝑇∫ 𝑌𝑖
𝑜𝑢𝑡𝑑�̅�𝑡
0− 𝑀𝑖∆𝑦𝑖
𝑃𝑉𝑔𝑎𝑠
𝑍𝑅𝑇 (11)
The first term on the right hand side of Eq. (11) is the flow integration common to all open
system measurements, but notice it only involves the inlet flow. The second integral term is with
respect to dw, or the direct balance reading, while the last term is the usual correction for gas
phase accumulation. The third term is the buoyancy correction applied to the balance
measurement. It includes the spatially averaged molecular weight, �̅�, of the gas mixture in the
column. Interestingly, as explained in the SI, it involves the total column volume, 𝑉𝑡𝑜𝑡, rather
than just the sample container and sample volumes, 𝑉𝑐 + 𝑉𝑠𝑜𝑙𝑖𝑑. 𝑉𝑡𝑜𝑡 is easier to measure when
the column is empty, or to estimate from the dimensions of the column. Incidentally, the split
between the gas phase and “impenetrable” volume still needs to be measured, according to the
reference state used to define adsorption.
16
There is inherent uncertainty in determining �̅� – and hence d�̅� in the third term of Eq. (11) –
because of the adsorption wave traveling through the column. This is a potential limitation of the
IMB method; unless there is either an accompanying spatially resolved measurement of the gas
distribution in the column or if the system mass is measured externally to directly provide dm in
Eq. (10) – to eliminate the need for internal buoyancy corrections. However, spatially resolved
measurement of the gas distribution in the column is not feasible, and it would be experimentally
challenging to externally weigh an entire flow-through system to sufficient accuracy. To
determine �̅� in our calculations, we instead assume a simple arithmetic average of the inlet and
outlet conditions, at every instant.
Note that the third term of Eq. (11) vanishes if the components have equal molar masses because,
in this case, d�̅� = 0. Conversely, it will increase as the difference in molar mass increases,
because d�̅� will then proportionally increase or decrease during each step change in
concentration. The magnitude of the uncertainty can be estimated by rewriting this term, using
integration by parts, as,
∫ 𝑌𝑖𝑜𝑢𝑡𝑑�̅� =
𝑡
0[𝑌𝑖
𝑜𝑢𝑡�̅�]0𝑡 − ∫ �̅�𝑑𝑌𝑖
𝑜𝑢𝑡𝑡
0 (12)
The value of the integral is therefore finite, with the first term on the right hand side of Eq. (12)
representing the maximum possible value. Later, we show that this contribution is very small, at
least for the data presented in this work.
EXPERIMENTAL
The IMB method is demonstrated here using a Hiden Isochema Intelligent Gravimetric Analyzer
(IGA) equipped with a specially designed reactor, consisting of a column holding the sample in a
17
cylindrical sample container, as shown in Fig. 3. The sample container, made from 316L
stainless steel woven mesh, is suspended from one side of the balance by a gold chain and a fine
tungsten hangdown wire. The maximum height of the sample container, and hence the effective
length of the column, is 70 mm, with a diameter of 10 mm in this instance. The container has
capacity for approximately 4 g of zeolite. Different size containers to suit sample packing can
also be accommodated using a hollow cylindrical spacer.
The weight of the sample and container is measured in situ using an electronic compensating
beam balance mounted in a thermostatted vacuum- and pressure-compatible chamber.13,69,70 The
highest available dynamic weighing range (1 g) with a resolution of 1 μg and a long-term
stability of ± 1 μg is used for the present study. A recirculating waterbath controls the isotherm
temperature of the reactor, in the range 283 K to 313 K, with a regulation accuracy of ± 0.025 K,
while integral heating elements can be used to increase the sample temperature further, to 523 K
for standard Kalrez® internal reactor seals or to 623 K with metal internal seals. Temperature is
measured and controlled against a platinum resistance thermometer (PRT), as indicated in Fig. 3.
During an experiment, a gas mixture of controlled composition is introduced at the base of the
column, via a diffuser, with the total pressure regulated using a stepper motor-controlled bellows
valve positioned at the outlet of the IGA. Gas flow rates are controlled using Brooks Instruments
(Hatfield, PA, USA) 5850E MFCs, with a maximum flow rate of 100 mL min-1 and a
manufacturer flow measurement accuracy of ± 1% full scale. The flow calibration is improved
by cubic polynomial expansion of the calculated volume flow rate during free pressurization for
a series of command values. Total pressure is measured using a GE Sensing PDCR 4020 strain
gauge sensor, with a quoted measurement accuracy of ± 0.04% full scale and a typical control
regulation accuracy of ± 1 mbar. Gas is initially introduced to the column using a pneumatically-

18
actuated 4-way, 2-position VICI (Valco Instruments Corporation Inc, Houston, TX, USA) GC
valve, to establish flow prior to switching the mixture to the sample position.
Figure 3. Specially designed IMB method reactor for the Hiden Isochema Intelligent
Gravimetric Analyzer (IGA), with key components labeled (MS, mass spectrometer; PRT,
platinum resistance thermometer).
The outlet gas composition is determined by sampling from the chimney at the top of the column
(see Fig. 3). A capillary connects the sampling port to a Hiden Analytical (Warrington, UK)
Dynamic Sampling Mass Spectrometer (DSMS). The capillary, combined with a bypass line on
the DSMS, allows reduction of the pressure from ambient down to the high vacuum conditions
required in the MS chamber. A manual metering valve is used to control the further pressure
drop required when performing measurements at elevated (above ambient) pressures.

19
The remainder of the instrument is maintained at a constant pressure throughout the experiment
using a helium counterflow to maintain a constant gas concentration. Sample degassing is
performed in a helium flow at elevated temperature and the dry state determined from the weight
of the sample in helium prior to the analysis; the entire instrument can also be evacuated, if
required, using a dry turbomolecular pump system, with a base vacuum < 10-6 mbar. Total inlet
flow rate and pressure, as well as temperature, are maintained constant during each analysis and
only the inlet gas composition is varied.
The material used to demonstrate the method is a commercial 5A zeolite (Tosoh Corporation), as
originally studied by Talu et al;21 the original N2/O2 adsorption data was shown to be
thermodynamically consistent, and has been used later in other adsorption studies.71,72
Approximately 3.5 g of sample was used in this work. The sample was degassed at a temperature
of 523 K for 24 hours in vacuum and subsequently in a flow of helium, until the weight
stabilized. High purity gases obtained from Air Products were used, with the following purity
levels: He (99.999%), N2 (99.999%), and O2 (99.999%). No further purification was applied. The
skeletal sample volume, Vsolid, was determined in situ from isothermal helium displacement at a
series of gas pressures up to 1.0 MPa. The sample container volume, Vc, was previously
established using helium pycnometry by an independent laboratory.
The aim of the experiments presented here was to replicate multicomponent analyses presented
previously.21 Total pressure was therefore set to 0.915 MPa, and a series of pure component (O2
or N2) and binary mixture (O2/N2) adsorption isotherms were measured at 296.45 K (23.3°C).
The IMB method enables multipoint isotherms to be followed automatically, in a single run, with
the equilibration time at each point determined by monitoring the microbalance weight reading
and outlet composition until the steady state conditions, Yiin = Yi
out and dw/dt = 0, are met.
20
A total of 10 experiment cycles were performed; 5 cycles started with determination of pure N2
sorption followed by 20 mixtures of N2/O2 between the extremities and then pure O2 desorption;
5 cycles were the reverse direction. This was to test the repeatability of the measurements and
also to investigate reversibility; in particular whether the difference in the flow pattern between
directions of measurement was significant in this instance. Individual N2 and O2 vacuum
adsorption measurements were also made using an independent gravimetric instrument to test the
agreement between the excess uptakes of pure N2 and O2 up to a total pressure of 1.0 MPa.
RESULTS & DISCUSSION
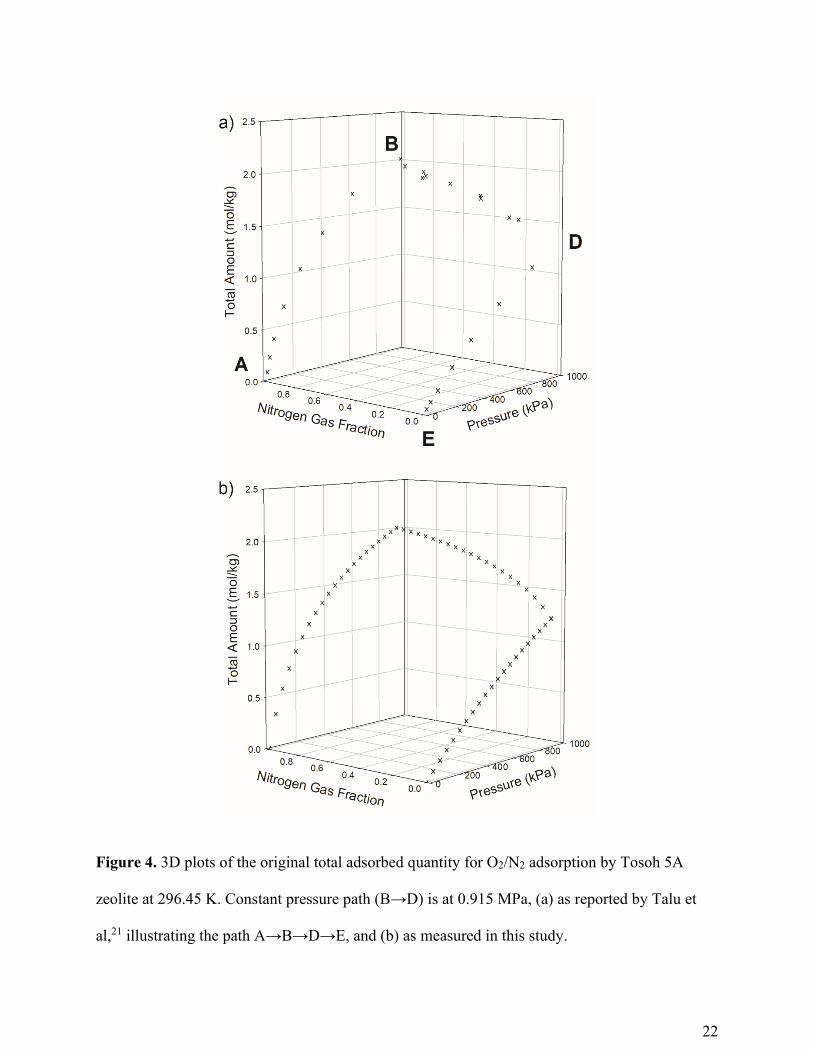
The total uptake measurements reported by Talu et al,21 and replicated in this study, are shown in
Fig. 4(a). Using the labelling from the original work, the pure N2 adsorption isotherm is shown
as the path A→B, the mixed N2/O2 region as B→D, and the pure O2 adsorption (or desorption)
isotherm as D→E. These data were measured using a closed (recirculating) volumetric system at
Cleveland State University and an open (flowing) volumetric system at Air Products and
Chemicals, Inc, in Allentown, PA. Figure 4(b) shows the equivalent total adsorption data
measured in this work.
To compare the total adsorption data, Fig. 5 shows each individual path, A→B, B→D, and
D→E, for the Talu et al21 study and our replication. Excellent agreement was found, apart from a
small discrepancy in the amount of N2 adsorption obtained at the highest pressure. There is no
obvious reason for this discrepancy, but good agreement was found between the pure N2
adsorption isotherm measured in the flowing system (Fig. 4(a)) and an independent measurement
performed on another gravimetric instrument (see Fig. 12). A period of nearly 25 years separates
the measurements made by Talu et al21 and those reported here. Furthermore, good agreement
21
between gas adsorption measurements made at elevated pressures in different laboratories is
difficult to achieve.73 So it is perhaps unsurprising to find a small difference (approximately 2%
to 3%) in the uptakes measured using different techniques in different laboratories, separated by
such a long period of time.
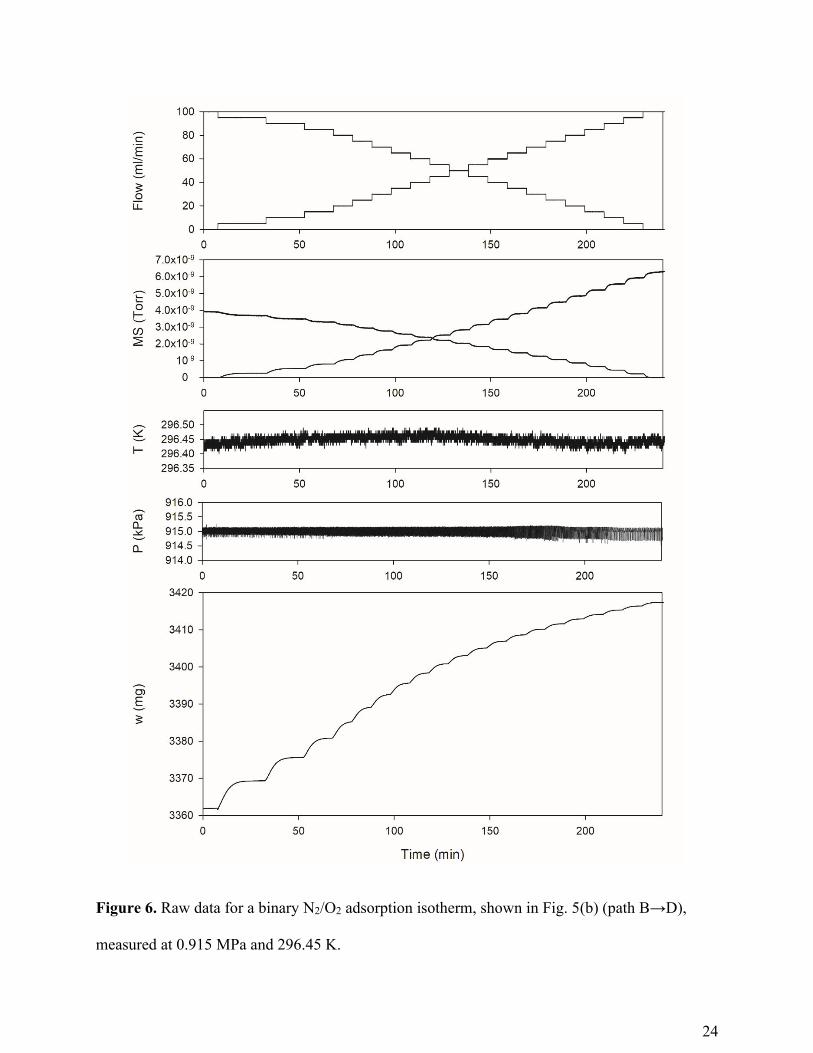
Figure 6 shows the real time raw data obtained for the binary N2/O2 adsorption isotherm
measurement shown in Fig. 5(b) (path B→D). It can be seen that the weight change measured by
the microbalance at each partial pressure step rapidly follows the change in inlet gas
composition, as determined from the MFC signal. Adsorption occurs over the course of a few
minutes, before the system reaches a steady state.
22
Figure 4. 3D plots of the original total adsorbed quantity for O2/N2 adsorption by Tosoh 5A
zeolite at 296.45 K. Constant pressure path (B→D) is at 0.915 MPa, (a) as reported by Talu et
al,21 illustrating the path A→B→D→E, and (b) as measured in this study.

23
Figure 5. Plots of each branch of the full path for Tosoh 5A zeolite at 296.45 K, showing (a) the
pure N2 adsorption isotherm (path A→B), (b) binary N2/O2 mixture (path B→D) at 0.915 MPa,
and (c) the pure O2 adsorption isotherm (path D→E).
24
Figure 6. Raw data for a binary N2/O2 adsorption isotherm, shown in Fig. 5(b) (path B→D),
measured at 0.915 MPa and 296.45 K.
25
Figure 7 shows the integrals in the mass balance expression (Eq. (11)) through the course of the
binary N2/O2 adsorption isotherms (path B→D), for the data presented in Fig. 6. This
demonstrates the relative contributions from each term under the reported conditions. The flow
term dominates among the three integrals in Eq. (11). The quantity of N2 and O2 adsorbed at
each equilibrium point is given by the difference between the total amount of each gas in the
column (the sum of the three integrals) and the amount of each species remaining in the gas
phase, as indicated by the diamond symbols (♦) in Fig. 7. Note that the MS signal expressed as
partial pressure in Torr, as shown in Fig. 6, must be converted to Yiout in Eq. (11) using
calibration measurements described in the SI. Notice that the approximated term involving the
average molecular mass, �̅�, is small compared to the other terms, particularly for O2.
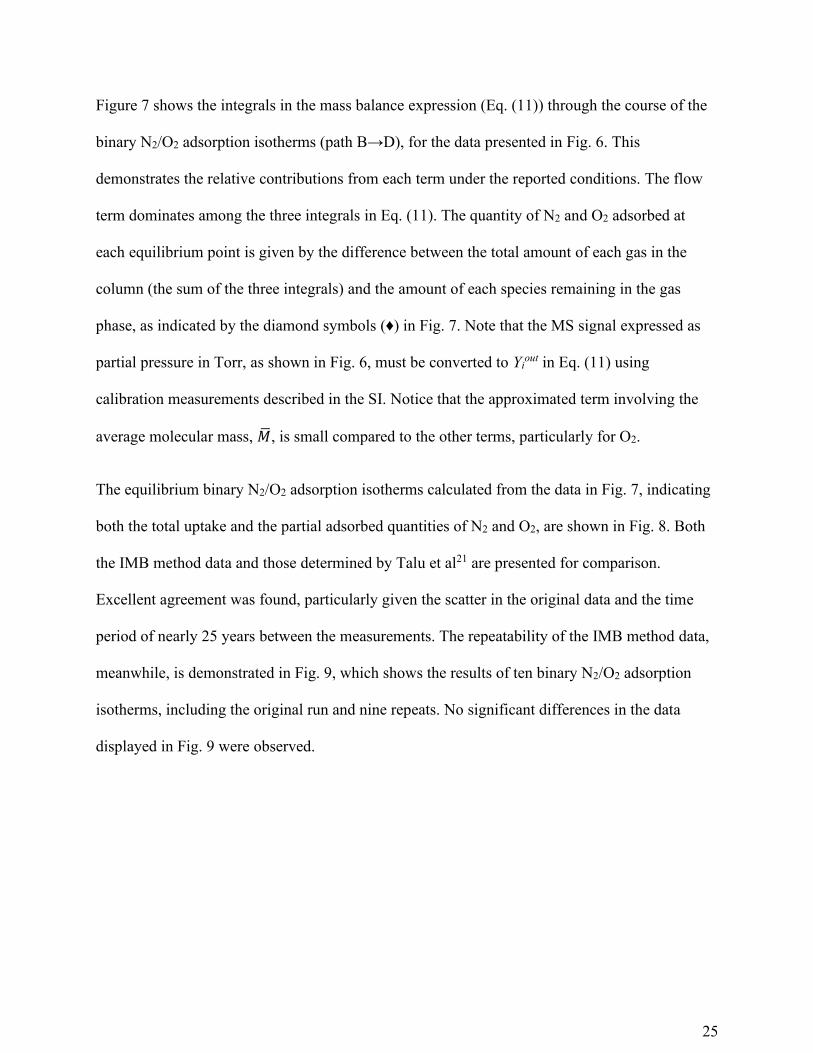
The equilibrium binary N2/O2 adsorption isotherms calculated from the data in Fig. 7, indicating
both the total uptake and the partial adsorbed quantities of N2 and O2, are shown in Fig. 8. Both
the IMB method data and those determined by Talu et al21 are presented for comparison.
Excellent agreement was found, particularly given the scatter in the original data and the time
period of nearly 25 years between the measurements. The repeatability of the IMB method data,
meanwhile, is demonstrated in Fig. 9, which shows the results of ten binary N2/O2 adsorption
isotherms, including the original run and nine repeats. No significant differences in the data
displayed in Fig. 9 were observed.

26
Figure 7. A plot of the integrals in the mass balance expression (Eq. (11)) for a binary N2/O2
adsorption isotherm (path B→D).
27
Figure 8. Equilibrium binary N2/O2 adsorption isotherms, calculated from the data shown in Fig.
7, measured at 0.915 MPa and 296.45 K.
Adsorbent selectivity is important for process design and theory, but it is difficult to measure
accurately in experiments. Figure 10 shows the equilibrium selectivity, Seq, calculated using the
following expression,
𝑆𝑒𝑞 =𝑛1 𝑦1⁄
𝑛2 𝑦2⁄ (13)
where n1 and n2 are the partial molar adsorbed quantities of N2 and O2, respectively, and y1 and
y2 are their gas phase mole fractions. The experimental data of Talu et al21 and the IMB method
are shown, and compared to the IAST calculations reported by Talu et al.21 The variation in the
28
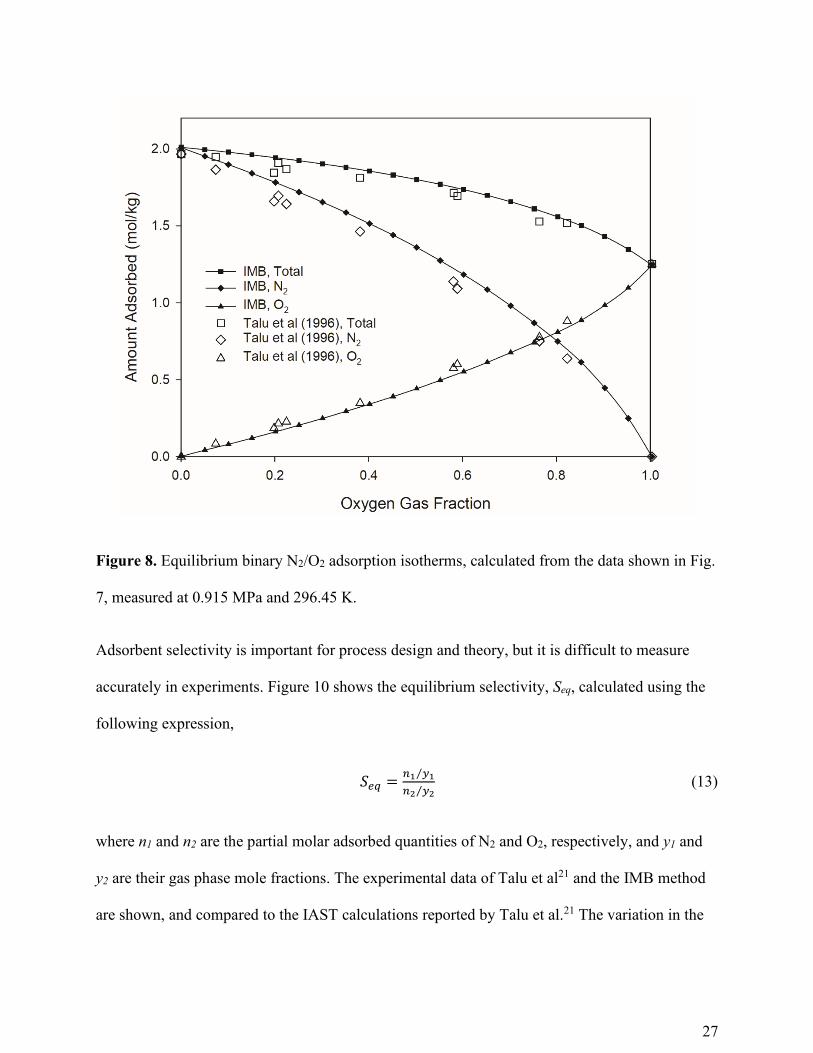
selectivities calculated using the IMB method reflect the sensitivity of Seq to the precise values of
n1 and n2 used for each calculation. The data presented here is, in general, within the uncertainty
band reported by Talu et al21 for their data.
Figure 9. Binary N2/O2 adsorption isotherms for Tosoh 5A at 0.915 MPa and 296.45 K, showing
the original dataset and nine repeats. The Talu et al21 data are shown by the open symbols, as in
Fig. 8.
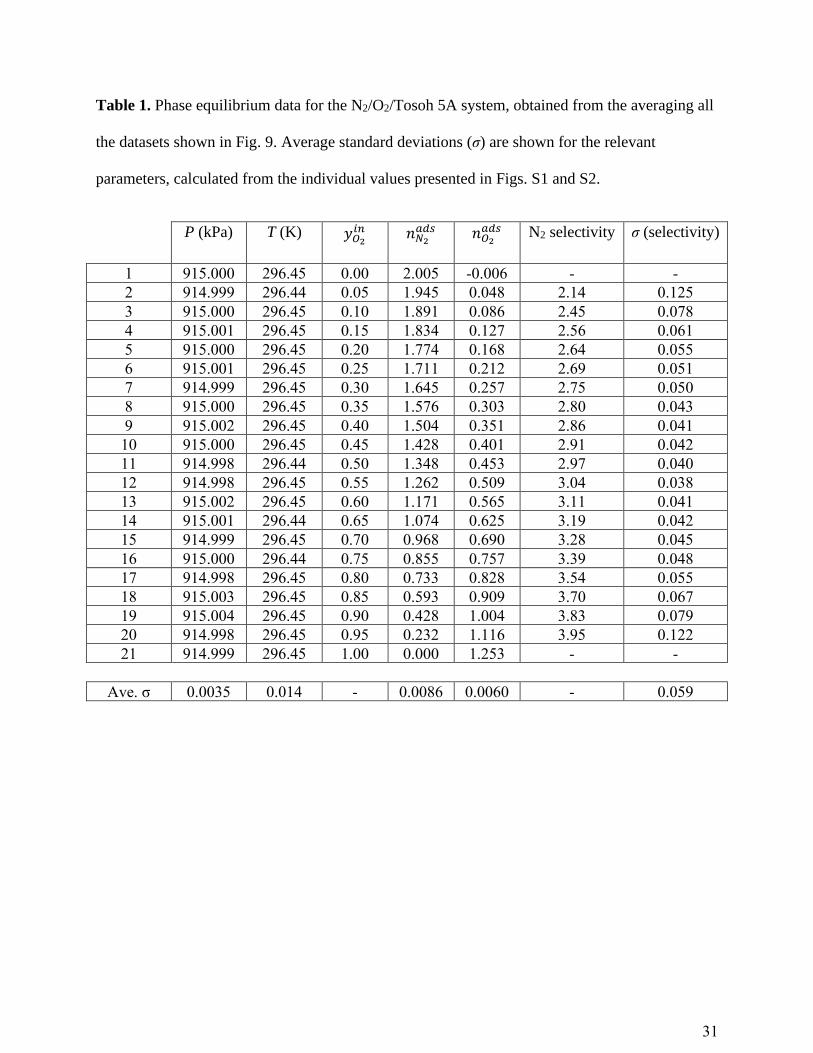
To summarize the results obtained using the IMB method, Table 1 shows the averaged values of
the phase equilibrium data using all the binary adsorption data measured in this study. The full
dataset, including the standard deviations calculated from each individual measurement, is
presented in Tables S1 and S2. The standard deviations shown in Tables S1 and S2, apart from

29
those for the selectivity, are essentially random; so we have presented the averages in Table 1, to
indicate their order of magnitude. In Table S2, we have presented both the standard deviations of
the calculated selectivities – representing the spread in the values across all ten measurements –
and the standard deviations obtained from estimates of the uncertainties in each of the various
measured parameters. The final average values of the selectivities, together with both the
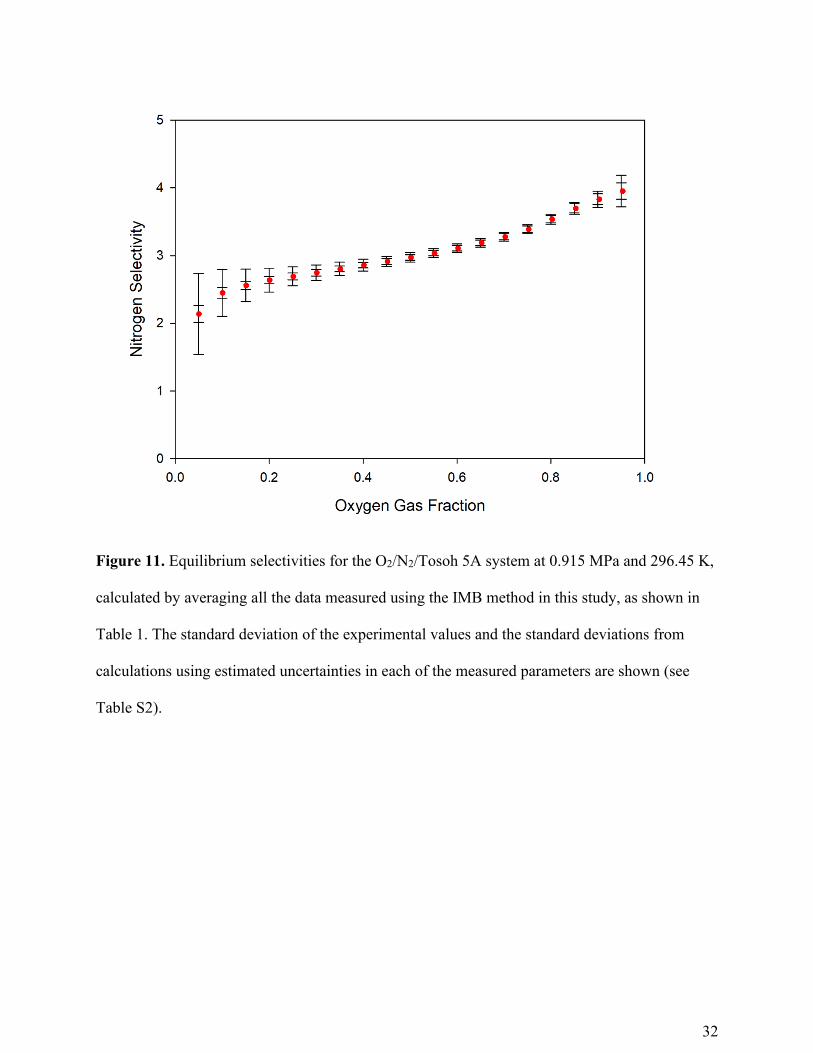
experimental and calculated standard deviations, are plotted in Fig. 11. Note that these standard
deviations are not directly comparable to the uncertainty bounds reported by Talu et al21 and
plotted in Fig. 10, because Talu et al21 obtained their uncertainties from a propagation of error
analysis. The standard deviations presented in Figure 11 indicate the precision of the IMB
method data, but not their accuracy.
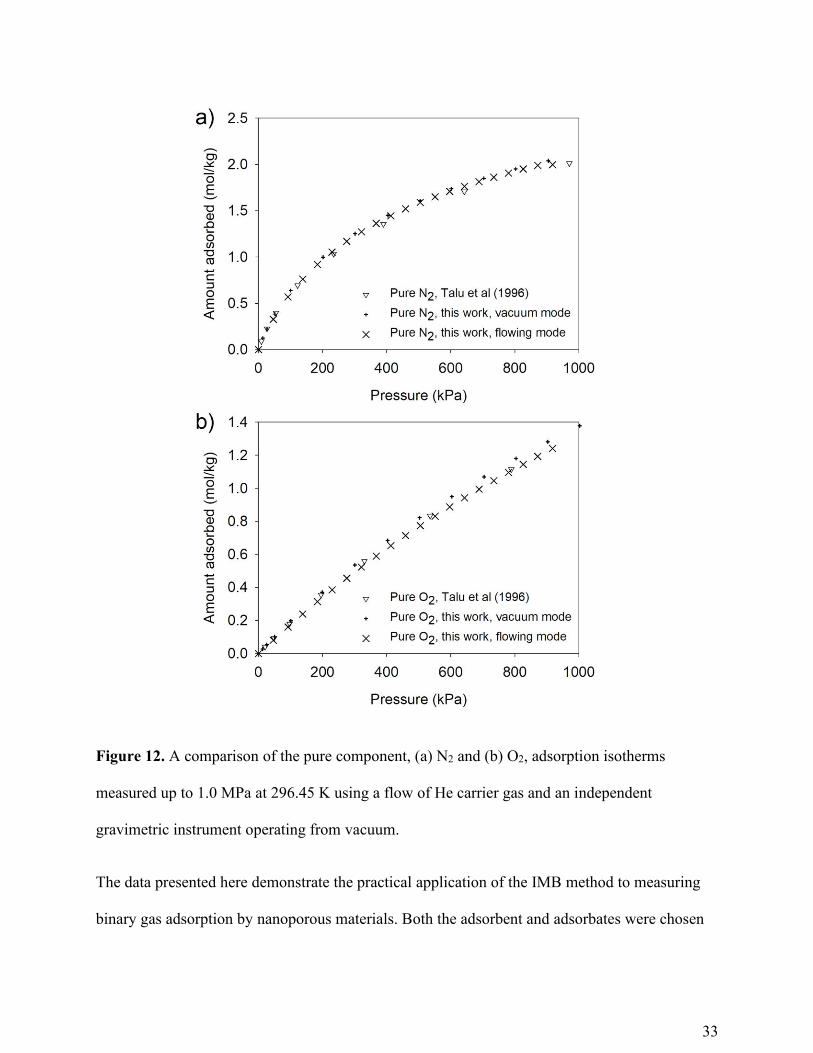
Finally, an independent instrument was used to directly measure pure component isotherms in a
traditional gravimetric experiment, without any need for composition measurements. We call this
vacuum mode. In addition, the IMB flow-through approach introduced here can also be used with
helium as a second component to determine pure component isotherms. The results of these two
types of experiments are compared to the Talu et al21 pure component data in Fig. 12. It can be
seen that there is good agreement between the three datasets, with O2 adsorption measured in
vacuum mode being slightly higher than the other two.

30
Figure 10. Equilibrium selectivities for the O2/N2/Tosoh 5A system at 0.915 MPa and 296.45 K,
comparing the IMB method and Talu et al21 data with IAST calculations.
31
Table 1. Phase equilibrium data for the N2/O2/Tosoh 5A system, obtained from the averaging all
the datasets shown in Fig. 9. Average standard deviations (σ) are shown for the relevant
parameters, calculated from the individual values presented in Figs. S1 and S2.
P (kPa) T (K) 𝑦𝑂2
𝑖𝑛 𝑛𝑁2
𝑎𝑑𝑠 𝑛𝑂2
𝑎𝑑𝑠 N2 selectivity σ (selectivity)
1 915.000 296.45 0.00 2.005 -0.006 - -
2 914.999 296.44 0.05 1.945 0.048 2.14 0.125
3 915.000 296.45 0.10 1.891 0.086 2.45 0.078
4 915.001 296.45 0.15 1.834 0.127 2.56 0.061
5 915.000 296.45 0.20 1.774 0.168 2.64 0.055
6 915.001 296.45 0.25 1.711 0.212 2.69 0.051
7 914.999 296.45 0.30 1.645 0.257 2.75 0.050
8 915.000 296.45 0.35 1.576 0.303 2.80 0.043
9 915.002 296.45 0.40 1.504 0.351 2.86 0.041
10 915.000 296.45 0.45 1.428 0.401 2.91 0.042
11 914.998 296.44 0.50 1.348 0.453 2.97 0.040
12 914.998 296.45 0.55 1.262 0.509 3.04 0.038
13 915.002 296.45 0.60 1.171 0.565 3.11 0.041
14 915.001 296.44 0.65 1.074 0.625 3.19 0.042
15 914.999 296.45 0.70 0.968 0.690 3.28 0.045
16 915.000 296.44 0.75 0.855 0.757 3.39 0.048
17 914.998 296.45 0.80 0.733 0.828 3.54 0.055
18 915.003 296.45 0.85 0.593 0.909 3.70 0.067
19 915.004 296.45 0.90 0.428 1.004 3.83 0.079
20 914.998 296.45 0.95 0.232 1.116 3.95 0.122
21 914.999 296.45 1.00 0.000 1.253 - -
Ave. σ 0.0035 0.014 - 0.0086 0.0060 - 0.059
32
Figure 11. Equilibrium selectivities for the O2/N2/Tosoh 5A system at 0.915 MPa and 296.45 K,
calculated by averaging all the data measured using the IMB method in this study, as shown in
Table 1. The standard deviation of the experimental values and the standard deviations from
calculations using estimated uncertainties in each of the measured parameters are shown (see
Table S2).
33
Figure 12. A comparison of the pure component, (a) N2 and (b) O2, adsorption isotherms
measured up to 1.0 MPa at 296.45 K using a flow of He carrier gas and an independent
gravimetric instrument operating from vacuum.
The data presented here demonstrate the practical application of the IMB method to measuring
binary gas adsorption by nanoporous materials. Both the adsorbent and adsorbates were chosen
34
due to the availability of the original sample and prior data for validation purposes. It is likely
that the method can be applied widely to a variety of different gases and materials, although
there may be limits to the experimental conditions under which it works to sufficient accuracy.
Such limits may include sample size, total pressure, and potentially the range and number of
different adsorbate species.
With regard to species, the adsorption of binary mixtures of N2 and O2 is not particularly
challenging to measure, compared to some other gas pairs. N2 and O2 are relatively similar in
molar mass, and hence density. As noted in the Background section, there is inherent uncertainty
in determining the third integral term on the right hand side of Eq. (11), because it depends on
the mean molar mass, �̅�, which will be subject to perturbation from fluctuations in gas density
due to adsorption. Such fluctuations are likely to be greater when the properties of each
adsorbate differ, in terms of both density and interaction strength. A larger change in the mean
molar mass, for example, during a step change in concentration, due to differences in the molar
masses of each component, will increase the magnitude of d�̅�. On the other hand, if the
components have equal molar masses, then the third term will vanish because d�̅� will be zero.
Errors or uncertainties associated with this issue will therefore be greater when the components
are more disparate in molar mass and density. Examples include mixtures of H2 with CO2 or
heavier hydrocarbons. The range of applicability of the IMB method, in terms of combinations of
different species, will therefore have to be tested in the future, to determine if there are limits due
to differing gas properties. It may be possible, however, to minimize the difficulties associated
with such differences by adjusting the experimental parameters; for example, by reducing the
concentration step size during isotherm determination.
35
The above issue is also related to the maximum total pressure used for a measurement. As for
single component (pure gas) gravimetric gas adsorption experiments, buoyancy effects increase
with gas pressure and density. We have demonstrated that the technique, as implemented in this
study, can produce physically reasonable and thermodynamically consistent data at total
pressures of up to 1.0 MPa using N2 and O2. Accurate measurements are likely to be achievable
at yet higher pressures with these species. In the case of combinations of gases of significantly
different molar masses, however, the upper pressure limit may be lower.
A further limitation may be the kinetics of adsorption. In the case of very slow kinetics, long
equilibration and hence experiment times may be required. This will lead to integrations being
performed over extended periods, and this may increase accumulative error or uncertainty.
Again, such cases will need to be tested, bearing in mind that the kinetics of adsorption for some
species may depend significantly on the properties of the adsorbent; specifically its pore size,
morphology, and the adsorbate-adsorbent interaction strength in each case.
Related to this, the IMB method may be useful, in the future, for studying adsorption kinetics.
Each measurement, following a step change in inlet concentration, as shown in Figs. 6 and 7, is
effectively a breakthrough curve; although note that the adsorbent column is not a fixed bed, so
the determined values of Yiout, as a function of time, may be affected by bypass flow.
Furthermore, the calculated values of Δniads depend on knowledge of the density profile of the
gas in the column. In this work, we have used an approximation, in which we assume a simple
arithmetic average of the inlet and outlet conditions, at every instant, to calculate 𝑑�̅� in the third
term of Eq. (11). This assumption may be inadequate to extract sufficient kinetic information
from the data, but this will have to be investigated further before any firm conclusions can be
drawn on the usefulness of the IMB method for kinetic studies.

36
In principle, the IMB method can also be applied to ternary or higher mixtures. Eq. (11) is
general and applies to any number of components i. Practical testing of the reported apparatus for
a larger number of components, however, has not yet been performed, and this will be the
subject of future work. There must be limits to the number of components that can be used, even
with regard to the accuracy with which Yiin can be controlled for more complex mixtures. But
these are difficult to predict or determine without performing practical experiments.
The apparatus used in this study has not yet been optimized for smaller samples. Using a smaller
sample will reduce the overall magnitude of each contribution to Eq. (11), as shown in Fig. 7 for
the measurements made in this work. A lower cut-off is likely to exist, below which the quality
of the data is too poor to yield accurate values of the equilibrium uptakes of each component in
the mixture. As noted in the Experimental section, however, a hollow cylindrical spacer can be
used to accommodate samples of smaller diameter. It may be possible to significantly reduce the
sample size; particularly for materials that adsorb relatively large quantities of gas, as this will
result in larger relative weight change signals from the microbalance. The sensitivity of the MS
to smaller amounts of gas in a system of reduced volume and hence sample size seems unlikely
to be a limiting factor. But further tests will need to be performed to determine how far the
sample size can be reduced, and to investigate ways in which measurements using the IMB
method may be performed with even smaller samples than those used in this work.
CONCLUSION
This article describes a new method – combining an open flowing system with in-situ
gravimetric measurements and quadrupole mass spectrometry – that allows very rapid
determination of accurate multicomponent gas adsorption isotherms. Its implementation has been
37
demonstrated and validated by performing binary O2/N2 adsorption measurements on a
commercial 5A zeolite at ambient temperature and a total pressure of 0.915 MPa. Excellent
agreement with previously published data was found, using a 3.5 g sample, with a measurement
time of only four hours for a twenty point isotherm. Selectivities were also in good agreement
with previously published results. In addition to being fast and accurate, the final equilibrium
conditions in the gas phase, in terms of temperature, pressure and composition (T, P, and yi), can
be controlled exactly. Furthermore, since it is fast, the method can also provide a more detailed
description of 3D phase diagrams, by determining more data points per isotherm in a given
experimental time.
The technique should be tested in the future for other gas combinations under different
experimental conditions, for different samples, to determine its full range of applicability. Wider
use of the technique may allow acquisition of large amounts of equilibrium multicomponent gas
adsorption data, enhancing the field of gas adsorption, both in terms of applications and for
theoretical studies.
ASSOCIATED CONTENT
Supporting Information. Includes further detail on the conversion of mass balance to partial
amount adsorbed, flow rate calibration, mass spectrometer signal calibration, and time lag
measurement; full phase equilibrium data calculated using all the binary adsorption data
measured in this study; and photographs of the full IMB system (IGA-003-MC).
AUTHOR INFORMATION
38
Corresponding Author
*Email: [email protected].
Author Contributions
The manuscript was written through contributions of all authors. All authors have given approval
to the final version of the manuscript.
ACKNOWLEDGMENTS
The authors wish to thank Richard Murden for mechanical design, Matthew Gee and Luke
Wilkinson for engineering support, and Hiden Analytical for technical assistance with the mass
spectrometer.
REFERENCES
(1) Ruthven, D. M., Principles of adsorption and adsorption processes; Wiley: New York,
1984.
(2) Yang, R. T., Gas separation by adsorption processes; Imperial College Press: London,
1997.
(3) Sircar, S., Basic research needs for design of adsorptive gas separation processes. Ind.
Eng. Chem. Res. 2006, 45(16), 5435-5448.
(4) Talu, O., Needs, status, techniques and problems with binary gas adsorption experiments.
Adv. Colloid Interface Sci. 1998, 76-77, 227-269.
(5) Talu, O., Measurement and analysis of mixture adsorption equilibrium in porous solids.
Chem. Ing. Tech. 2011, 83(1-2), 67-82.

39
(6) Sircar, S., Recent developments in macroscopic measurement of multicomponent gas
adsorption equilibria, kinetics, and heats. Ind. Eng. Chem. Res. 2007, 46(10), 2917-2927.
(7) Broom, D. P.; Thomas, K. M., Gas adsorption by nanoporous materials: Future
applications and experimental challenges. MRS Bull. 2013, 38(5), 412-421.
(8) Walton, K. S.; Sholl, D. S., Predicting multicomponent adsorption: 50 years of the Ideal
Adsorbed Solution Theory. AIChE J. 2015, 61(9), 2757-2762.
(9) Walton, K. S., 110th Anniversary: Commentary: Perspectives on adsorption of complex
mixtures. Ind. Chem. Eng. Res. 2019, 58(37), 17100-17105.
(10) Belmabkhout, Y.; Frère, M.; De Weireld, G., High-pressure adsorption measurements. A
comparative study of the volumetric and gravimetric methods. Meas. Sci. Technol. 2004, 15(5),
848-858.
(11) Keller, J. U.; Staudt, R., Gas adsorption equilibria: Experimental methods and
adsorptive isotherms; Springer: New York, 2005.
(12) Rouquerol, J.; Rouquerol, F.; Llewellyn, P.; Maurin, G.; Sing, K. S. W., Adsorption by
powders and porous solids: Principles, methodology and applications, 2nd. ed.; Academic Press:
London, 2014.
(13) Benham, M. J.; Ross, D. K., Experimental determination of absorption-desorption
isotherms by computer-controlled gravimetric analysis. Z. Phys. Chem. NF 1989, 163, S25-32.

40
(14) De Weireld, G.; Frère, M.; Jadot, R., Automated determination of high-temperature and
high-pressure gas adsorption isotherms using a magnetic suspension balance. Meas. Sci. Technol.
1999, 10(2), 117-126.
(15) Lewis, W. K.; Gilliland, E. R.; Chertow, B.; Hoffman, W. H., Vapor-adsorbate
equilibrium. I. Propane-propylene on activated carbon and on silica gel. J. Am. Chem. Soc. 1950,
72(3), 1153-1157.
(16) Lewis, W. K.; Gillibrand, E. R.; Chertow, B.; Cadogan, W. P., Adsorption equilibria.
Hydrocarbon gas mixtures. Ind. Eng. Chem. 1950, 42(7), 1319-1326.
(17) Habgood, H. W., The kinetics of molecular sieve action. Sorption of nitrogen-methane
mixtures by Linde molecular sieve 4A. Can. J. Chem. 1958, 36(10), 1384-1397.
(18) Basmadjian, D., Adsorption equilibria of hydrogen, deuterium, and their mixtures. Part I.
Can. J. Chem. 1960, 38(1), 141-148.
(19) Hamon, L.; Heymans, N.; Llewellyn, P. L.; Guillerm, V.; Ghoufi, A.; Vaesen, S.;
Maurin, G.; Serre, C.; De Weireld, G.; Pirngruber, G. D., Separation of CO2–CH4 mixtures in the
mesoporous MIL-100(Cr) MOF: Experimental and modelling approaches. Dalton Trans. 2012,
41(14), 4052-4059.
(20) Costa, E.; Sotelo, J. L.; Calleja, G.; Marrón, C., Adsorption of binary and ternary
hydrocarbon gas mixtures on activated carbon: Experimental determination and theoretical
prediction of the ternary equilibrium data. AIChE J. 1981, 27(1), 5-12.

41
(21) Talu, O.; Li, J.; Kumar, R.; Mathias, P. M.; Moyer, J. D.; Schork, J. M., Measurement
and analysis of oxygen/nitrogen/5A-zeolite adsorption equilibria for air separation. Gas Sep.
Purif. 1996, 10(3), 149-159.
(22) Calleja, G.; Pau, J.; Calles, J. A., Pure and multicomponent adsorption equilibrium of
carbon dioxide, ethylene, and propane on ZSM-5 zeolites with different Si/Al ratios. J. Chem.
Eng. Data 1998, 43(6), 994-1003.
(23) Keller, J. U.; Dreisbach, F.; Rave, H.; Staudt, R.; Tomalla, M., Measurement of gas
mixture adsorption equilibria of natural gas compounds on microporous sorbents. Adsorption
1999, 5(3), 199-214.
(24) Hofman, P. S.; Rufford, T. E.; Chan, K. I.; May, E. F., A dynamic column breakthrough
apparatus for adsorption capacity measurements with quantitative uncertainties. Adsorption
2012, 18(3-4), 251-263.
(25) Shirani, B.; Eic, M., Novel differential column method for measuring multicomponent
gas adsorption isotherms in NaY zeolite. Ind. Eng. Chem. Res. 2017, 56(4), 1008-1018.
(26) Reich, R.; Ziegler, W. T.; Rogers, K. A., Adsorption of methane, ethane, and ethylene
gases and their binary and ternary mixtures and carbon dioxide on activated carbon at 212-301 K
and pressure to 35 atmospheres. Ind. Eng. Chem. Process Des. Dev. 1980, 19(3), 336-344.
(27) Kumar, R.; Sircar, S., Skin resistance for adsorbate mass transfer into extruded adsorbent
pellets. Chem. Eng. Sci. 1986, 41(9), 2215-2223.
42
(28) Talu, O.; Zwiebel, I., Multicomponent adsorption equilibria of nonideal mixtures. AIChE
J. 1986, 32(8), 1263-1276.
(29) Chen, Y. D.; Ritter, J. A.; Yang, R. T., Nonideal adsorption from multicomponent gas
mixtures at elevated pressures on a 5A molecular sieve. Chem. Eng. Sci. 1990, 45(9), 2877-2894.
(30) Yun, J.-H.; Düren, T.; Keil, F. J.; Seaton, N. A., Adsorption of methane, ethane, and their
binary mixtures on MCM-41: Experimental evaluation of methods for the prediction of
adsorption equilibrium. Langmuir 2002, 18(7): 2693-2701.
(31) He, Y.; Yun, J.-H.; Seaton, N. A., Adsorption equilibrium of binary methane/ethane
mixtures in BPL activated carbon: Isotherms and calorimetric heats of adsorption. Langmuir
2004, 20(16), 6668-6678.
(32) Dreisbach, F.; Staudt, R.; Keller, J. U., High pressure adsorption data of methane,
nitrogen, carbon dioxide and their binary and ternary mixtures on activated carbon. Adsorption
1999, 5(3), 215-227.
(33) Hamon, L.; Frère, M.; De Weireld, G., Development of a new apparatus for gas mixture
adsorption measurements coupling gravimetric and chromatographic techniques. Adsorption
2008, 14(4-5), 493-499.
(34) Ottiger, S.; Pini, R.; Storti, G.; Mazzotti, M., Competitive adsorption equilibria of CO2
and CH4 on a dry coal. Adsorption 2008, 14(4-5), 539-556.
43
(35) Hefti, M.; Marx, D.; Joss, L.; Mazzotti, M., Adsorption equilibrium of binary mixtures of
carbon dioxide and nitrogen on zeolites ZSM-5 and 13X. Microporous Mesoporous Mater. 2015,
215, 215-228.
(36) Keller, J. U.; Staudt, R.; Tomalla, M., Volume-gravimetric measurements of binary gas
adsorption equilibria. Ber. Bunsenges. Phys. Chem. 1992, 96(1), 28-32.
(37) Talu, O.; Li,J.; Myers, A.L., Activity coefficients of adsorbed mixtures. Adsorption 1995,
1(2), 103-112.
(38) Gilmer, H. B.; Kobayashi, R., The study of gas-solid equilibrium at high pressures by
gas-chromatography: Part 1. Ethane, propane, and n-butane at essentially infinite dilutions in the
methane-silica gel system. AIChE J. 1964, 10(6), 797-803.
(39) Ruthven, D. M.; Kumar, R., An experimental study of single-component and binary
adsorption equilibria by a chromatographic method. Ind. Eng. Chem. Fundamen. 1980, 19(1),
27-32.
(40) Glover, C. J.; Lau, W. R., Determination of multicomponent sorption equilibria using
perturbation gas chromatography. AIChE J. 1983, 29(1), 73-79.
(41) Parcher, J. F.; Hyver, K. J., Gas chromatographic determination of binary adsorption
isotherms. J. Chromatogr. A 1984, 302, 195-204.
(42) Hyun, S. H.; Danner, R. P., Gas adsorption isotherms by use of perturbation
chromatography. Ind. Eng. Chem. Fundamen. 1985, 24(1), 95-101.

44
(43) Buffham, B. A.; Mason, G.; Heslop, M. J., Binary adsorption isotherms from
chromatographic retention times. Ind. Eng. Chem. Res. 1999, 38(3), 1114-1124.
(44) Heslop, M. J.; Buffham, B. A.; Mason, G., Tests of the consistency between binary gas
adsorption isotherms and binary chromatographic retention volumes. Ind. Eng. Chem. Res. 2000,
39(5), 1514-1519.
(45) Harlick, P. J. E.; Tezel, F. H., CO2-N2 and CO2-CH4 binary adsorption isotherms with H-
ZSM5: The importance of experimental data regression with the concentration pulse method.
Can. J. Chem. Eng. 2001, 79(2), 236-245.
(46) Keskin, S.; van Heest, T. M.; Sholl, D. S., Can metal-organic framework materials play a
useful role in large-scale carbon dioxide separations? ChemSusChem 2010, 3(8), 879-891.
(47) Dantas, T. L. P.; Luna, F. M. T.; Silva Jr., I. J.; de Azevedo, D. C. S.; Grande, C. A.;
Rodrigues, A. E.; Moreira, R. F. P. M., Carbon dioxide-nitrogen separation through adsorption
on activated carbon in a fixed bed. Chem. Eng. J. 2011, 169(1-3), 11-19.
(48) Krishna, R.; Long, J. R., Screening metal-organic frameworks by analysis of transient
breakthroughs of gas mixtures in a fixed bed adsorber. J. Phys. Chem. C 2011, 115(26), 12941-
12950.
(49) Rocha, L. A. M.; Andreassen, K. A.; Grande, C. A., Separation of CO2/CH4 using carbon
molecular sieve (CMS) at low and high pressure. Chem. Eng. Sci. 2017, 164, 148-157.
(50) van der Vlist, E.; van der Meijden, J., Determination of adsorption isotherms of the
components of binary gas mixtures by gas chromatography. J. Chromatogr. A 1973, 79, 1-13.
45
(51) Tondeur, D.; Kabir, H.; Luo, L. A.; Granger, J., Multicomponent adsorption equilibria
from impulse response chromatography. Chem. Eng. Sci. 1996, 51(15), 3781-3799.
(52) Gumma, S.; Talu, O., Infinite dilution selectivity measurements by gas chromatography.
In Adsorption Science and Technology; Lee C.-H., Ed.; World Scientific: Singapore, 2003; pp
131-135.
(53) Kennedy, D.; Tezel, F. H., Improved method for determining binary adsorption isotherms
by using concentration pulse chromatography: Adsorption of CO2 and N2 by silicalite at different
pressures. Adsorption 2014, 20(1), 189-199.
(54) Kennedy, D. A.; Mujcin, M.; Trudeau, E.; Tezel, F. H., Pure and binary adsorption
equilibria of methane and nitrogen on activated carbons, desiccants, and zeolites at different
pressures. J. Chem. Eng. Data 2016, 61(9), 3163-3176.
(55) Rynders, R. M.; Rao, M. B.; Sircar, S., Isotope exchange technique for measurement of
gas adsorption equilibria and kinetics. AIChE J. 1997, 43(10), 2456-2470.
(56) Mohr, R. J.; Vorkapic, D.; Rao, M. B.; Sircar, S., Pure and binary gas adsorption
equilibria and kinetics of methane and nitrogen on 4A zeolite by isotope exchange technique.
Adsorption 1999, 5(2), 145-158.
(57) Parcher, J. F., Tracer pulse chromatography: A review and prospectus. J. Chromatogr. A
1982, 251(3), 281-288.
(58) Li, J.-R.; Kuppler, R. J.; Zhou, H.-C., Selective gas adsorption and separation in metal-
organic frameworks. Chem. Soc. Rev. 2009, 38(5), 1477-1504.
46
(59) Li, J.-R.; Sculley, J.; Zhou, H.-C., Metal-organic frameworks for separations. Chem. Rev.
2012, 112(2), 869-932.
(60) Tian, J.; Thallapally, P. K.; McGrail, B. P., Porous organic molecular materials.
CrystEngComm 2012, 14(6), 1909-1919.
(61) Furukawa, H.; Cordova, K. E.; O’Keeffe, M.; Yaghi, O. M., The chemistry and
applications of metal-organic frameworks. Science 2013, 341, 1230444.
(62) Slater, A. G.; Cooper, A. I., Function-led design of new porous materials. Science 2015,
348, aaa8075.
(63) Cooper, A. I., Porous molecular solids and liquids. ACS Cent. Sci. 2017, 3(6), 544-553.
(64) Mu, B.; Glover, T. G., Eds., Gas adsorption in metal-organic frameworks: Fundamentals
and applications; CRC Press: Boca Raton, 2018.
(65) Myers, A. L.; Prausnitz, J. M., Thermodynamics of mixed-gas adsorption. AIChE J.
1965, 11(1), 121-127.
(66) Talu, O.; Myers, A. L., Rigorous thermodynamic treatment of gas adsorption. AIChE J.
1988, 34(11), 1887-1893.
(67) Gumma, S.; Talu, O., Net adsorption: A thermodynamic framework for supercritical gas
adsorption and storage in porous solids. Langmuir 2010, 26(22), 17013-17023.
(68) Talu, O., Net adsorption of gas/vapor mixtures in microporous solids. J. Phys. Chem. C
2013, 117(25), 13059-13071.
47
(69) Reid, C. R.; O’koye, I. P.; Thomas, K. M., Adsorption of gases on carbon molecular
sieves used for air separation. Spherical adsorptives as probes for kinetic selectivity. Langmuir
1998, 14(9), 2415-2425.
(70) Fletcher, A. J.; Benham, M. J.; Thomas, K. M., Multicomponent vapor sorption on active
carbon by combined microgravimetry and dynamic sampling mass spectrometry. J. Phys. Chem.
B 2002, 106(30), 7474-7482.
(71) Mathias, P. M.; Kumar, R.; Moyer, J. D.; Schork, J. M.; Srinivasan, S. R.; Auvil, S. R.;
Talu, O., Correlation of multicomponent gas adsorption by the dual-site Langmuir model.
Application to nitrogen/oxygen adsorption on 5A-zeolite. Ind. Eng. Chem. Res. 1996, 35(7),
2477-2483.
(72) Ritter, J. A.; Bumiller, K. C.; Tynan, K. J.; Ebner, A. D., On the use of the dual process
Langmuir model for binary gas mixture components that exhibit single process or linear
isotherms. Adsorption 2019, 25, 1511-1523.
(73) Nguyen, H. G. T.; Espinal, L.; van Zee, R. D.; Thommes, M.; Toman, B.; Hudson, M. S.
L.; Mangano, E.; Brandani, S.; Broom, D. P.; Benham, M. J.; Cychosz, K.; Bertier, P.; Yang, F.;
Krooss, B. M.; Siegelman, R. L.; Hakuman, M.; Nakai, K,; Ebner, A. D.; Erden, L.; Ritter, J. A.;
Moran, A.; Talu, O.; Huang, Y.; Walton, K. S.; Billemont, P.; De Weireld, G., A reference high-
pressure CO2 adsorption isotherm for ammonium ZSM-5 zeolite: results of an interlaboratory
study. Adsorption 2018, 24(6), 531-539.

download fileview on ChemRxivBroom-IMB-method-multicomponent-adsorption.pdf (1.71 MiB)