integral observations of the enigmatic be stars ... · integral observations of the enigmatic be...
TRANSCRIPT
Source of Acquisition NASA Goddard Space Flight center
INTEGRAL Observations of the Enigmatic Be Stars y Cassiopeiae and HD 110432
S. J. Sturner and C. R. Shrader
Exploration of the Universe Division, Code 661, NASA, Goddard Space Flight Center, Greenbelt, MD 20771
and
Universities Space Research Association, 1021 I Wincopin Circle, Suite 620, Columbia, MD 21044
ABSTRACT
We present the results of a hard X-ray study of the Be stars y Cassiopeiae and HD 110432 based on observations made with the INTEGRAL observatory. These stars are known to be moderately strong, X-ray sources (L, = 1032-1033 erg s-l). These values are at the extreme high end of the known luminosity distribution for active coronal systems, but several orders of magnitude below typical X-ray binaries. The hard X-ray spectra for these systems are quite similar. They can be well fitted by either optically thin thermal plasma models with kT = 12.5 - 14 keV or a cutoff powerlaw + gaussian line model with photon indices in the 1.3 - 1.5 range and a line energy of 6.7 keV. The 20-50 keV light curves show no evidence for flaring and no significant evidence for periodic variability. It has been proposed that the X-ray emission is due to either accretion onto a white dwarf companion or magnetic activity near the surface of the Be star. We discuss in detail the pros and cons of each scenario towards explaining our spectral and temporal results. Given that both thermal and nonthermal models fit the data equally well, we cannot use the spectra to delineate between these two scenarios. Recent observations indicate that y Cas has a -1 No companion in a 203.59 day orbit. This is consistent with the white dwarf - Be star binary model but the lack of periodic modulation of the flux on this timescale calls this conclusion into question. On the other hand the lack of flaring activity may rule against the magnetic activity model. We discuss advances in observations and theory that need to be made to resolve the origin of these systems.
Subject headings: gamma rays: observations - stars: emission line, Be - stars: individual (y Cassiopeiae, HD 110432) - white dwarfs - X-rays: binaries - X-rays: stars
https://ntrs.nasa.gov/search.jsp?R=20070016052 2018-08-31T20:03:01+00:00Z
- 2 -
1. INTRODUCTION
Classical Be stars are B stars whose spectra contain emission lines from H I and He I while also showing evidence for rapid rotation and equatorial decretion disks [see Porter & Rivinius (2003) for a review of Be stars]. In this paper we present the results of-INTEGRAL hard X-rayly-ray observations of the Be stars y Cas (HD 5394) and HD 110432. These stars have been previously detected in the X-ray/?-ray band, see e.g. Owens et al. (1999) and Torrej6n & Orr (2001), with luminosities in the range - ergs s-'. This is significantly larger than the typical X-ray luminosity for isolated 0 and B stars of N
lo3* ergs s-' (Helfand & Moran 2001; Pallavicini et al. 1981) yet smaller than the X- ray luminosity of Be-neutron star binary systems which during quiescence typically exceed
ergs s-' (e.g. Negueruela 1998). There are two leading models for producing the observed X-rays from these sources: accretion onto a white dwarf companion or magnetic activity near the stellar surface. Because of the similar optical and X-ray characteristics of these two peculiar stars, Smith & Balona (2006) have suggested that they are the first two members of a new class of X-ray bright Be stars.
ergs s-' and during outburst can exceed N
1.1. y Cassiopeiae
y Cas was the first known Be star (Secchi 1867). It is of spectral type BO IVe (Tokovinin 1997) and is at a distance of 188 pc (Chevalier & Ilovaisky 1998). The mass of y Cas has been estimated to be in the range 13-18 Ma (Harmanec et al. 2000; Zorec, F'rgmat, & Cidale 2005; Gontcharov, Andronova, & Titov 2000; Tokovinin 1997). It is a member of a visual binary system with a 1765 year period, an angular separation of 2.2", and a companion mass of -1.2 Ma estimated from the visual magnitude difference (Tokovinin 1997). There is also astrometric evidence from HIPPARCOS for a third member of the system with an estimated mass of -8 Mo and an orbital period 2 60 years (Gontcharov, Andronova, & Titov 2000). Perhaps most relevant to the topic of X-ray emission from y Cas is the recent spectroscopic evidence for a -1 Mo fourth member to this system in a 203.59 day orbit about the primary Be star (Harmanec et al. 2000; Miroshnichenko, Bjorkman, & Krugov 2002). The nature of the fourth member is unknown but its mass is consistent with it being a white dwarf or neutron star and thus it is a prime candidate for the source of the X-ray emission. On the other hand, this fourth component could also be an ordinary late-type dwarf star with no connection to the observed X-ray emission.
As we have stated, y Cas is a known, moderately strong (L, - erg/s) X-ray source (e.g. W1iit.e et al. 1982; Smith, Robinson, & Corbet 1998; Kubo et a1 1998; Owens et al. 1999). The X-ray spectrum is well fitted by optically thin thermal plasma models (Smith
- 3 -
et al. 2004; Owens et al. 1999; Kubo et a1 1998; Smith, Robinson, & Corbet 1998; Parmar et al. 1993; Murakami et al. 1986). Some authors have found that the spectrum can also be satisfactorily fitted with a power-law or cutoff power-law model plus a gaussian emission line at 6.7 keV (den Hartog et al. 2006; Smith, Robinson, & Corbet 1998; Kubo et a1 1998; Parmar et al. 1993). An accurate characterization of the emission is essential to understanding the nature of this system since a thermal characterization of the spectrum supports the white dwarf accretion hypothesis while a power-law spectrum would support a magnetic flaring origin for the X-rays.
Temporal analysis of the X-ray emission has shown it to consist of two components (Smith, Robinson, & Corbet 1998): 1) a “basal” component that varies on timescales of hours and contributes -70% of the X-ray flux, and 2) a (‘shot” component characterized by fluctuations on timescales of seconds to minutes. Smith, Robinson, & Corbet (1998) also found an anticorrelation between variations in the UV and X-rays which led to the identification of a 1.123 day period [and later revised to 1.12277 days by Robinson & Smith (2000)l that they attributed to rotation of the Be star. Apparao (2002), on the otherhand, postulates that this period may due to the rotation of a white dwarf companion. A somewhat similar period of 1.48700 & 0.00013 days was discovered by Harmanec et al. (2000) using Hipparcos data; but given the accuracy for these two measurements, these periods must be considered inconsistent with each other. Robinson, Smith, & Henry (2002) have reported that there are 3% cyclical variations in the B and V bands with periods between 55 and 93 days for which they have proposed a cyclical magnetic dynamo model.
1.2. HD 110432
HD 110432 (HR 4830, BZ Cru) is a B0.5-B1.5 IIIe star (Codina et al. 1984; Dachs, Poetzel, & Kaiser 1989; Hoffleit & Warren 1991) at a distance of -300 pc (Chevalier & Ilovaisky 1998) with some striking similarities to the better known y Cas (Smith & Balona 2006). If we assume it is a standard B0.5 111 star, the mass and radius of HD 110432 are 21.5 - 25.1 Mo and -14.8 Ro (Vacca, Garmany, & Shull 1996), respectively.
This star is the proposed optical counterpart of the X-ray source 1H1249-637 (Wood et al. 1984; Elvis et al. 1992). Torrej6n & Orr (2001) have presented results of BeppoSAX observations of HD 110432 where they found that, similar to y Cas, the X-ray spectrum could be fitted by an optically thin thermal plasma model with a temperature of -11 keV. They found that it could also be fitted by a cutoff powerlaw with a photon spectral index of 1.6 and a cutoff energy of 19.9 keV plus two Gaussian lines at 6.76 and 8.41 keV. The unabsorbed 2-10 keV luminosity of 3.4 x lo3’ erg s-l is similar to that, of y Cas, 5.7 x erg s-l (Owens
- 4 -
et al. 1999).
Torrej6n & Orr (2001) found a 0.164 day periodicity in the BeppoSAX MECS light curve while uvby photometric observations by Barrera, Mennickent, & Vogt (1991) showed two possible periods at 1.42 or 1.77 days. As with y Cas, the origins of these periods are unclear. Again, two possibilities are rotation of the Be star or a compact companion. If we assume that the 1.42 day or 1.77 day period is due to an as yet undetected white dwarf companion, using the spin period-orbital period relation of Apparao (2002)) we find an expected orbital period of 200-250 days, similar to that of y Cas.
1.3. High-Energy Properties
The fact that the X-ray luminosity of these stars falls in between those of ordinary stars of their spectral type and those of Be-neutron star binaries has led to suggestions that the emission is due to either accretion onto a white dwarf companion (e.g. Kubo et a1 1998; Owens et al. 1999; Apparao 2002) or magnetically induced flaring activity at near the stellar surface (e.g. Smith & Balona 2006; Smith et al. 2004; Robinson & Smith 2000; Smith, Robinson, & Corbet 1998). The controversy surrounding the emission mechanism has yet to be resolved as there are pros and cons to both scenarios.
In this paper we explore the hard X-ray spectra of these two Be star systems using INTEGRAL. We also calculate long-term light curves in an effort to search for flares and long timescale flux variations. These data, collectively, comprise the most complete high- energy dataset of these two enigmatic systems. We attempt to identify possible signatures which may delineate between possible companion object types (or lack thereof), search for any significant differences between the two systems unique to this spectral domain, and draw contrasts and comparisons between these systems and known Be X-ray binaries and isolated (coronal emitting) Be stars.
2. INSTRUMENTATION - INTEGRAL
INTEGRAL was launched into a 3-day elliptical orbit on October 17, 2002. It carries four instruments, two of which have been used for our analyses: the imager IBIS (Ubertini et al. 2003) and the spectrometer SPI (Vedrenne et al. 2003). For a complete description of the INTEGRAL spacecraft and mission refer to Winkler et al. (2003).
IBIS is. a coded mask instrument which has a wide field of view (FOV) of 29" x 29" (9" x 9" fully coded) with a point spread function (PSF) of 12' (FWHM) and is sensitive over
- 5 -
the energy range 15 keV to 10 MeV. There are two detector layers: ISGRI, an upper CdTe layer with peak sensitivity between 15 and 200 keV, and PICsIT, a bottom CsI layer, with a peak sensitivity above 200 keV. In this paper we have used only ISGRI data.
The Spectrometer on Integral, SPI, covers the 20 keV - 8 MeV energy range with an energy dependent resolution of 2-8 keV (FWHM). It consists of an array of 19 hexagonal high-purity Germanium detectors. A hexagonal coded aperture mask located 1.7 m above the detection plane images large regions of the sky (fully coded field of view 16") with an angular resolution of -2.5".
3. OBSERVATIONS AND DATA ANALYSIS
We have analyzed the IBIS/ISGRI and SPI public data from pointings with y Cas (a!
= 14.177, 6 = 60.717) and HD 110432 (a! = 190.709, 6 = -63.059) in the field of view. For IBIS/ISGRI we chose only those Science Windows (SCWs) with pointing directions within 10" of each source while for SPI we used 12". The data for y Cas consisted of 578 SCWs for IBIS/ISGRI and 785 SCWs for SPI ranging from December 28, 2002 to September 12, 2004. The large disparity in the number of SCWs for the two instruments is because many of the observations used in the y Cas analysis had the supernova remnant Cas A as the primary target which is roughly 13.6" away from y Cas. Thus the larger field-of-view of SPI allowed us to include many more of the dither pointings of the Cas A observations. For HD 110432, the IBIS/ISGRI and SPI data consisted of 384 and 509 SCWs, respectively. This data was taken between January 11, 2003 to December 22, 2004.
The data were downloaded from the HEASARC mirror to the INTEGRAL Public Data Archive. Data reduction was performed using the standard OSA 5.1 analysis software pack- age available from the INTEGRAL Science Data Centre. Spectral and timing analyses were performed using the XSPEC and XRONOS data analysis packages, respectively.
4. RESULTS
4.1. y Cassiopeiae
4.1.1. Imaging and Spectral Analysis
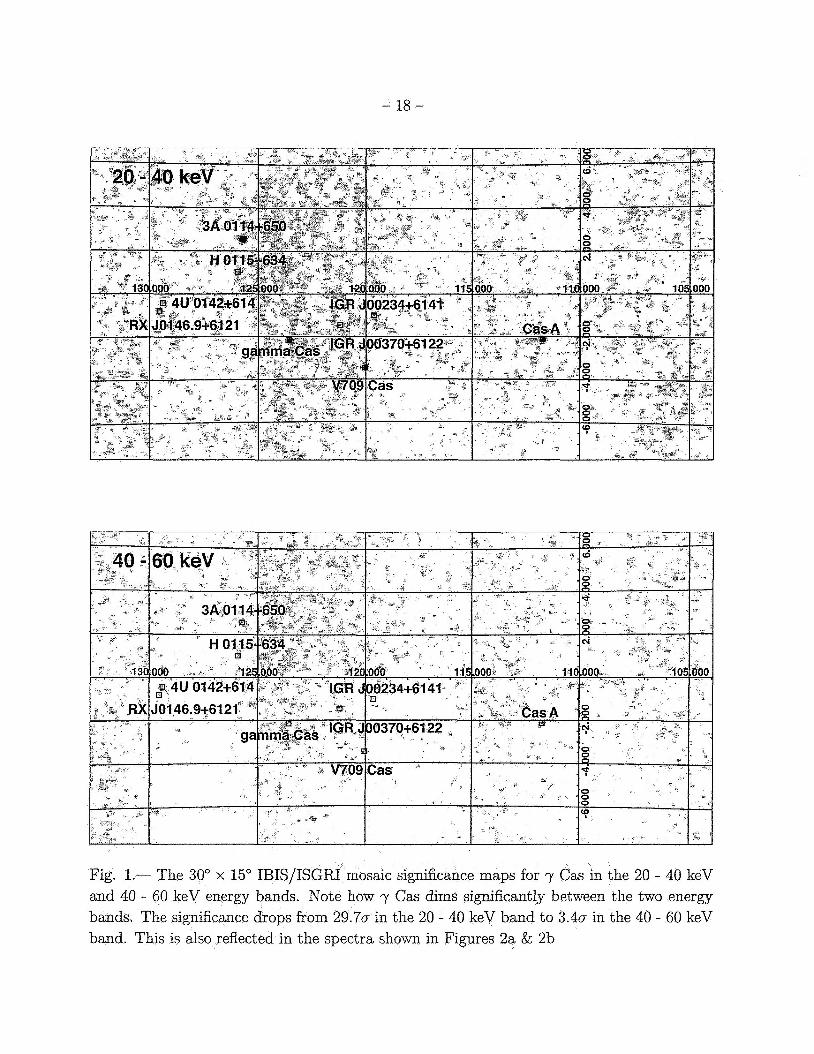
We used the OSA 5.1 software to produce mosaic images of the y Cas region in broad energy bands using images from all science windows. In Figure 1 we show the resulting 20-40
- 6 -
keV and 40-60 keV significance maps. It is very evident that y Cas has a soft spectrum in this energy range as it dims significantly between these two energy bands.
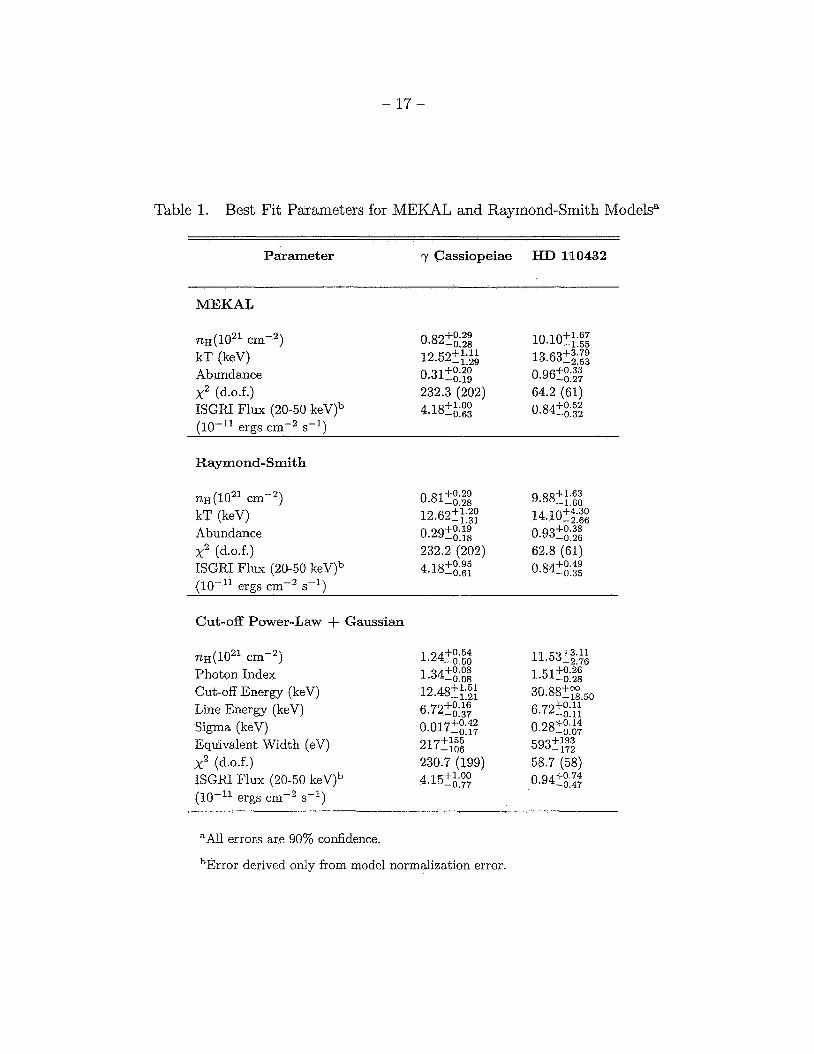
We extracted hard X-ray spectra from both the IBIS/ISGRI and SPI data. These data were then fitted simultaneously in XSPEC along with ASCA GIS and BeppoSAX PDS spectra which were retrieved from the HEASARC and BeppoSAX ASI-SDC on-line data archives. Previous analyses of broadband X-ray spectra of y Cas have generally found that the spectra were well fit by optically thin thermal plasma models, such as Raymond-Smith (Raymond & Smith 1977) and MEKAL (Mewe, Lemen, & van den Oord 1986) (e.g. Owens et al. 1999; Smith, Robinson, & Corbet 1998; Kubo et a1 1998; Horaguchi et al. 1994; Murakami et al. 1986) but in some cases a power-law (or cut-off power-law) model plus a gaussian line also provided an adequate fit (den Hartog et al. 2006; Smith, Robinson, & Corbet 1998; Kubo et a1 1998; Parmar et al. 1993). In our joint fits we used the Raymond- Smith and MEKAL model implementations in XSPEC as well as a cutoff power-law + gaussian line model. In the thermal model fits, the column depth, plasma temperature, and metal abundances relative to solar were free parameters but were held constant between data sets. In the cutoff power-law fits, the column depth, photon spectral index, cutoff energy, line energy, line width, and line strength were free parameters but were held constant between data sets. The model normalization was allowed to vary between data sets to compensate for cross calibration errors.
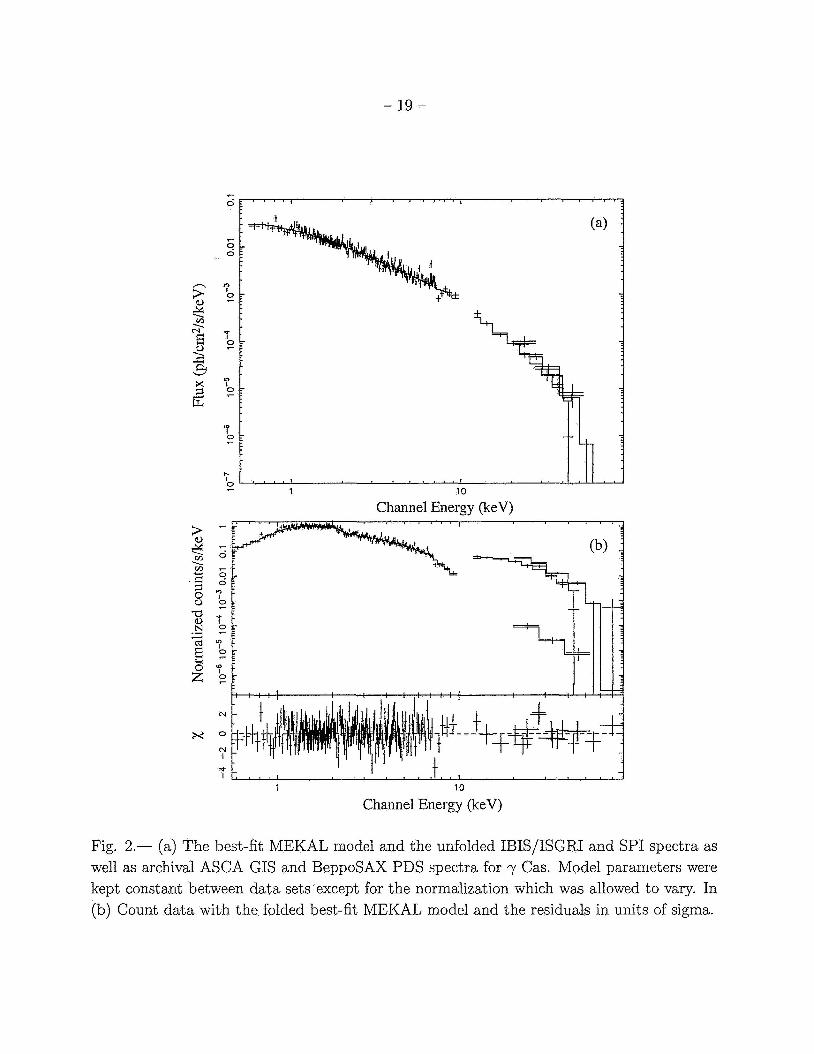
The best-fit results for all models are given in Table 1. In Figure 2a we show the best fit MEKAL model and the unfolded photon spectra. In Figure 2b we show the data sets with the best-fit folded MEKAL model and the residuals. Our analysis shows that all the models produced acceptable fits to the data with similar values for x;. The temperatures for the thermal models are -12.5 keV. This result is in good agreement with previous analyses which have yielded plasma temperatures in the range kT = 10 - 13 keV with strong Fe XXV and Fe XXVI emission lines at -6.7 keV and 6.97 keV (e.g. Owens et al. 1999; Smith, Robinson, & Corbet 1998; Kubo et a1 1998; White et al. 1982). Iron lines at these energies are consistent with emission from a hot plasma with kT > 10 keV (Smith et al. 2004).
When fitting a cutoff power-law + gaussian line model to the data, we find that a photon spectral index of 1.34 with a cut-off energy of 12.48 keV best fits the data. The gaussian line is centered 6.72 keV with an equivalent width of 217 eV. It is difficult to compare our cut-off powerlaw parameters results with those from previous works since our data spans a much larger range of energy than most of the previous works (e.g. Kubo et a1 1998) and/or the previous works fit the data with a powerlaw with no break. This means that the spectral indices found in the literature span a wide range of values. For instance, Parmar et al. (1993) found that EXOSAT data for y Cas was well fit with a cutoff power-law with an
- 7 -
index of 1.14 but requiring a low cutoff energy at 8.2 keV while Smith, Robinson, & Corbet (1998) fit RXTE data with an unbroken powerlaw which a required a much softer index of 2.1. Our line energy is consistent with previous results which have generally ranged from 6.66-6.77 keV (Owens et al. 1999; Smith, Robinson, & Corbet 1998; Kubo et a1 1998; Parmar et al. 1993). The equivalent width determined by our fit is also consistent with previous works which have ranged from 185 eV (Parmar et al. 1993) to 296 eV (Owens et al. 1999).
Another characteristic of the X-ray spectrum of y Cas that is commonly found is a low metal abundance in the range 0.30 - 0.43 solar (Owens et al. 1999; Smith, Robinson, & Corbet 1998; Kubo et a1 1998; Murakami et al. 1986). We find that the metal abundance is - 0.30, in agreement with the previous measurements. Kubo et a1 (1998) point out that abundances of -0.35 solar are typical of white dwarf binary systems observed by ASCA but they admit that there is no compelling explanation of why this is true. Hence this can’t be considered a strong argument for accretion onto a white dwarf as the source of the X-ray emission.
4.1.2. Timing Analysis
As we have discussed in $1, the optical emission of y Cas has been shown to exhibit a 203.59 day periodicity which has been associated with the orbital motion of a -1 Ma companion (Harmanec et al. 2000) as well as a 1.1-1.5 day periodicity seen in the optical, UV, and X-ray (Smith, Robinson, & Corbet 1998; Harmanec et al. 2000). It has been postulated that this shorter period may be due to the rotation of either the Be star itself (Smith, Robinson, & Corbet 1998) or a white dwarf companion (Apparao 2002). We used the IBIS/ISGRI data to produce a long term lightcurve in order to search for periodicities on both timescales.
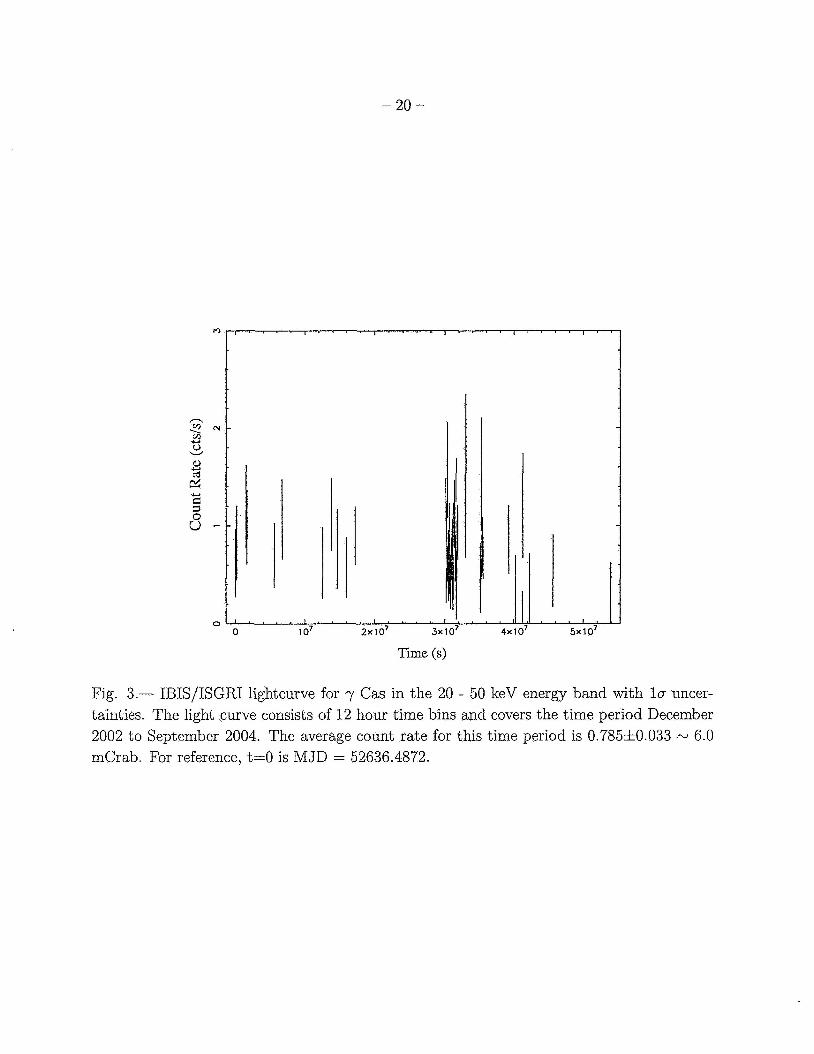
The flux history of y Cas is illustrated in Figure 3 where we show the 20-50 keV lightcurve rebinned into 12 hour time bins. From Figure 3 we can see that there is no evidence for large flares but, because much of this time period is sparsely sampled, neither can we cannot rule out flares. We tested whether the lightcurve was consistent with being constant using the x2 statistic. The result from this analysis was highly dependent on how the data were binned. Time bins shorter than - 1 day produced highly variable results with the probability of being constant varying from as high as 86% for 9 hour bins to only 3.7% for 12 hour bins. For time bins > 1 day the probability of being constant stays in the 80%-100% range with the exception of a small range of time bin sizes near 40 hours where the probability drops to 40%-50%. We can only speculate that these findings are related in
- 8 -
some way to the reported 27 and 36 hour periods of Smith, Robinson, & Corbet (1998) and Harmanec et al. (2000), respectively.
In order to search for longer period variations, we rebinned the data into 3 day time bins and fit it with a sinusoid where the period, phase, amplitude and mean count rate were free parameters. We found a best fit period of 40.9 days with a x2 37.536 (d.0.f. = 24). This period is driven almost entirely by the cluster of data points seen in Figure 3 near 3 x lo7 seconds. These points represent approximately 0.5 of a cycle. This 40 day period is notably outside the 55-93 day period range found by Robinson, Smith, & Henry (2002) and thus, given the low significance of the fit, its reality is questionable.
4.2. HD 110432
4.2.1. Spectral Analysis
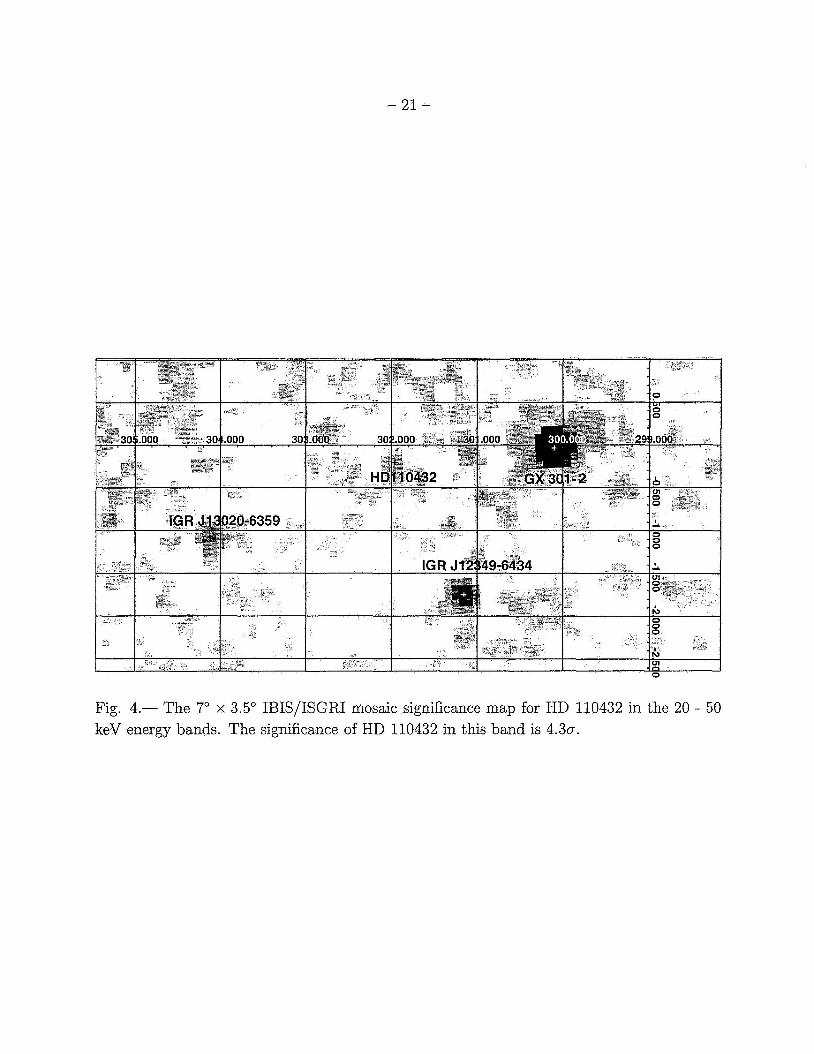
We produced mosaic images of the HD110432 region in broad energy bands using data from all 384 science windows. In Figure 4 we show the resulting 20-50 keV significance map. It is very evident that HD 110432 is much dimmer than y Cas in this energy band.
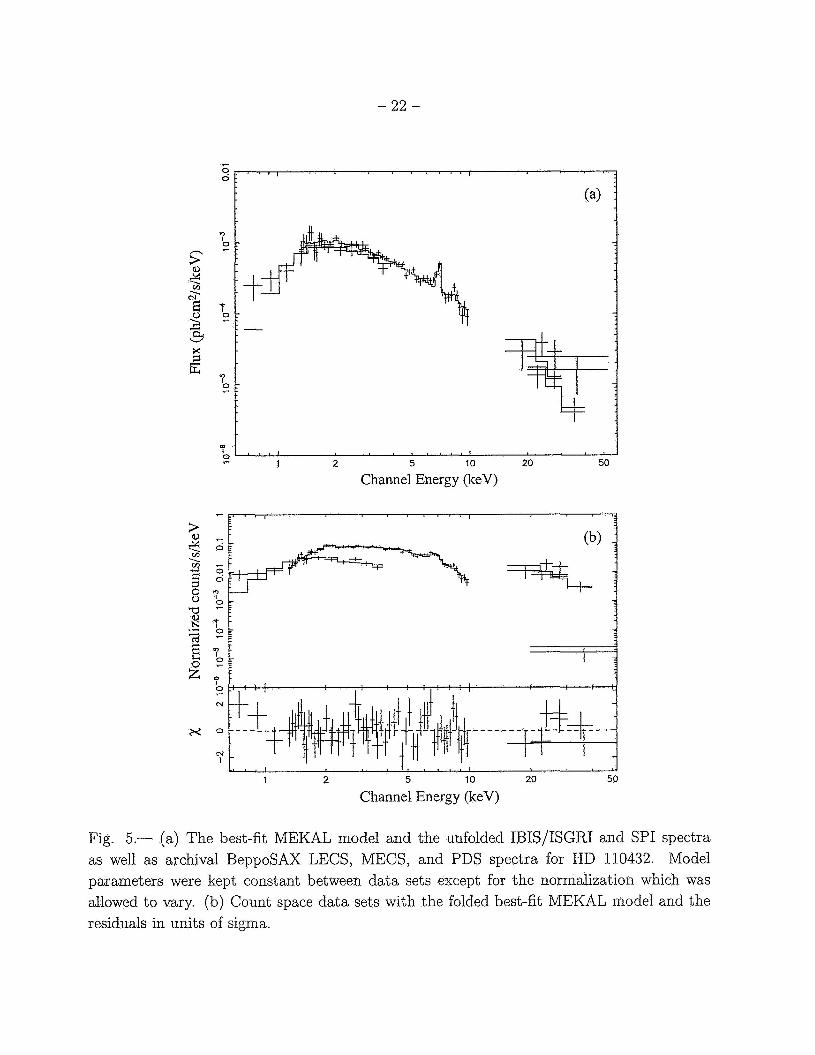
We extracted hard X-ray spectra from the IBIS/ISGRI and SPI data. These INTE- GRAL data were simultaneously fitted with BeppoSAX LECS, MECS, and PDS spectra obtained from the ASI-SDC archive. We fit the data from HD 110432 in XSPEC using the same spectral models those used for y Cas, MEKAL, Raymond-Smith, and a cut-off power- law fgaussian. The best-fit model parameters are given in Table 1. The plasma temperature for the thermal models is - 14 keV while the best fit cut-off powerlaw+gaussian is described by an index of 1.15, a cut-off energy of 30.88 keV. and a line energy of 6.72 keV. The errors for these fit parameters are significantly larger than for the y Cas fits owing to the fact that HD 110432 is -5 times dimmer. In Figure 5a we show the best fit MEKAL model and the unfolded photon spectra. In Figure 5b we show the data sets with the best-fit folded MEKAL model and the residuals.
Our plasma temperature is consistent with that found by Torrej6n & Orr (2001) for HD 110432 using only the BeppoSAX data. Torrej6n & Orr (2001) found a temperature of 10.55 f 1.9 keV when fitting with the MEKAL model compared to our 13.63(+3.79, -2.53) keV. On the other hand, Torrejcjn & Orr (2001) found that the metal abundaiices were only marginally consistent with solar, 0.78 f 0.20, while our abundances are fully consistent with solar, 0.96(+0.33, -0.27). We also find that our best-fit parameters for the cut-off powerlaw+gaussian model are consistent with those found by Torrejcjn & Orr (2001).
- 9 -
Comparing the results for HD 110432 with those for y Cas we find that while the plasma temperatures are very similar, the abundances for HD 110432 are consistent with solar while the those of y Cas are distinctly sub-solar. This finding draws into question the white dwarf - Be binary scenario for the X-ray emission from these stars if the observation of Kubo et a1 (1998) concerning low metaliicity in white dwarf binary systems is correct. This discrepancy also appears in the case of the cut-off powerlaw+gaussian fits. Here we found that the while spectral indices and the line energies were similar, the equivalent width of the line was - 2 . 7 ~ larger in the case of HD 110432.
4.2.2. Timing Analysis
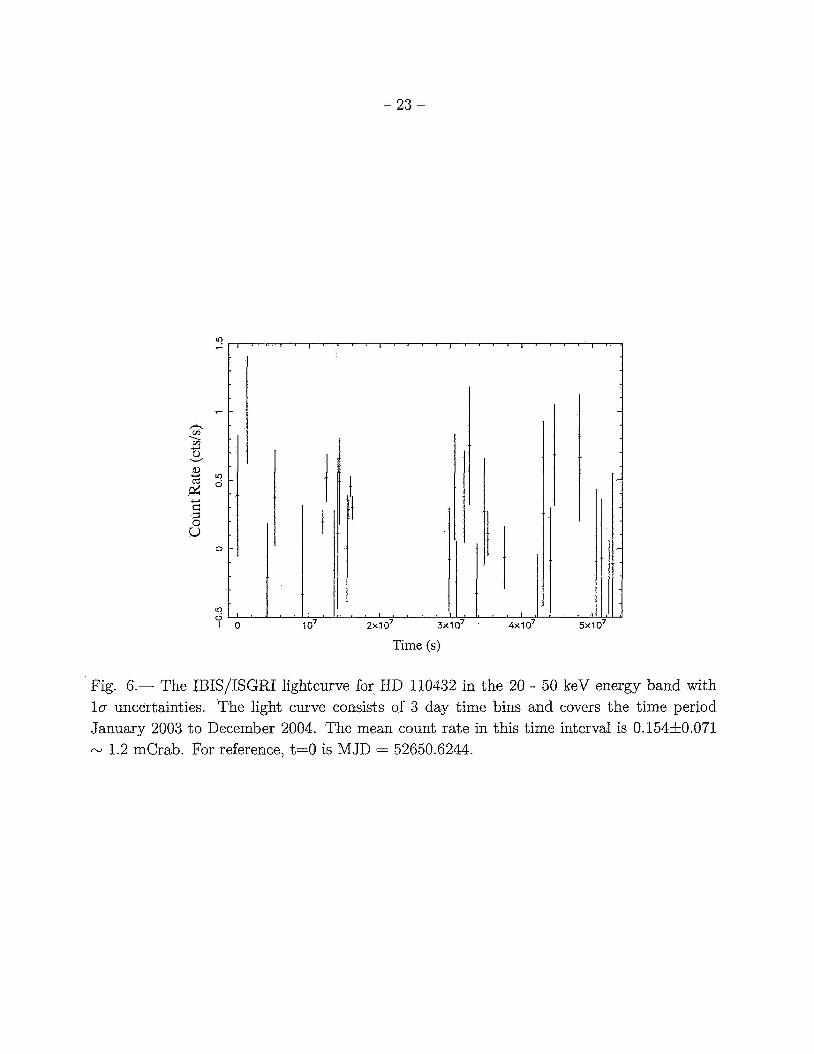
We used the IBIS/ISGRI data to produce a long term lightcurve in order to search periodicities and/or epsiodes of flaring actvity. The resulting lightcurve is shown in Figure 6 where we have rebinned the data into 3 day time bins. The average count rate during this timespan was 0.154f0.071. By inspection there are no time periods in which flaring activity occurred although the time span is rather sparsely sampled. Using the the XRONOS routine lcstats, we find that the probability of constancy is 68%. The data are not of high enough significance to warrant searching for periodicities as we did for the case of y Cas.
5 . DISCUSSION
The long standing enigma of y Cas remains but some new clues about this system are slowly emerging. The broadband X-ray emission from the Be stars y Cas and HD 110432 show striking similarities. The continuum spectra are well fit by a hot (kT-12-14 keV) optically thin thermal plasma or a relatively hard broken powerlaw (photon index- 1.3-1.5). Both spectra exhibit strong emission lines at 6.7 keV from Fe XXV and possibly at 6.97 keV from Fe XXVI. There is also one notable difference. We found that metal abundances for y Cas were distinctly sub-solar, in concurrence with several previous works (Owens et al. 1999; Smith, Robinson, & Corbet 1998; Kubo et a1 1998; Murakami et al. 1986), while those for HD 110432 were consistent with solar. This finding is echoed in our power-law+gaussian fit results where we found that the equivalent width for the 6.7 keV line was 2.7 times larger for HD 110432 than y Cas. We feel that the similarities in the broadband X-ray spectrum argue in favor of these two stars being members of the same class of objects, as suggested by Smith & Balona (2006), although the question of what emission mechanism is at work remains unresolved.
- 10 -
As we have stated, there are two leading models for the production of the observed X-ray emission from these sources: 1) accretion onto a white dwarf companion [although claims that y Cas is a neutron star X-ray binary still persist (den Hartog et al. 2006)], and 2) magnetically induced flaring activity at or near the stellar surface . Detailed arguments for and against these models have been presented by several authors, e.g. Kubo et a1 (1998), Owens et al. (1999), Robinson & Smith (2000), and Apparao (2002).
Determining the nature of these systems is difficult as, among other reasons, the quality of the hard X-ray data does not even allow us to determine if the emission is thermal or nonthermal in origin. The best-fit spectral indices are similar to those observed from known Be-neutron star binary systems (e.g. Haberl & Pietsch 2004) but the similarities between the systems discussed here and the known Be-neutron star systems end there. First, the iron line emission from Be-neutron star systems is dominated by the line 6.4 keV with only weak emission (if any at all) at 6.7 keV and 6.97 keV. The iron line emission, and the implied high temperature plasma, seen from y Cas and HD 110432 is much more consistent with a white dwarf companion than a neutron star companion (Owens et al. 1999; Kubo et a1 1998; Haberl 1995, and references therein).
Second, the X-ray luminosities of y Cas and HD 110432, previously found to be ergs s-' (Torrej6n & Orr 2001; Owens et al.
-
1999; Kubo et a1 1998), are in stark contrast to the highly variable luminosities of Be-neutron stars systems which range from
ergs s-' during outbursts (Haberl & Pietsch 2004; Negueruela 1998). On the other hand, the shallower gravitational potential well of a white dwarf compared to a neutron star could account for the lower observed quiescent luminosity.
- ergs s-' during quiescence to up to -
We can calculate the luminosity in the 20-50 keV band using the ISGRI fluxes listed in Table 1 while assuming distances to y Cas and HD 110432 of of 188 f. 20 pc and 300?::, respectively (Chevalier & Ilovaisky 1998). Using the results for the MEKAL best fit, we find that the luminosity for y Cas is 1.77t::E; x ergs s-' while the luminosity for HD 110432 is 9.05f::2,: x lo3' ergs s-'. Thus the luminosities of these two sources are consistent with each other, albeit with a significant error on the luminosity of HD 110432 due to its very low observed flux.
Third, many of the know Be-neutron star binaries are X-ray pulsars (Haberl & Pietsch 2004; Yokogawa et al. 2003; Haberl & Sasaki 2000; Negueruela 1998). Searches for pulsations on timescales of seconds to minutes in the X-ray emission from y Cas have been conducted with none found (Robinson & Smith 2000; Owens et al. 1999; Kubo et a1 1998; Smith, Robinson, & Corbet 1998).
- 11 -
We now turn to the white dwarf binary hypothesis for the origin of the X-rays. First, let us examine whether a white dwarf-Be binary system with the orbital parameters of y Cas is capable of producing the the required - ergs X-ray luminosity. Harmanec et al. (2000) determined that the semi-major axis of the orbit of the - 1 Ma companion about y Cas was 350-400 Ra. The eccentricity of this orbit was found by Harmanec et al. (2000) to be 0.26 while Miroshnichenko, Bjorkman, & Krugov (2002) found that the orbit was in fact circular. The Be-white dwarf binary system evolution models of Raguzova (2001) also suggest that the white dwarf orbit in a Be binary system should be circular and co-planar with the Be equatorial decretion disk. Such an orbit is favored by the absence of large luminosity variations that would be expected during periastron passage in a highly elliptical orbit.
Work by Waters et al. (1989) and Kubo et a1 (1998) indicated that X-ray luminosities N > ergs s-l could be achieved for y Cas-like parameters assuming accretion onto a white dwarf of wind material with an outflow velocity 5 200 km s-'. We note however that Robinson & Smith (2000) have disputed the validity of such calculations claiming that these authors did not properly take into account the efficiency of converting the gravitational energy into X-rays. They contend once this is taken into account, the X-ray luminosity from such a system would be 1 to 2 orders of magnitude smaller than what is observed for y Cas. It has been suggested that the motion of the gas in the disk is mostly Keplerian with only small radial velocities (e.g. Hummel & Vrancken 2000; Negueruela & Okzaki 2000; Hanuschik 1995). Given this, Robinson & Smith (2000) contend that the methodology of Kubo et a1 (1998) that is used to calculate the luminosity is suspect. Apparao (2002) suggests that since the white dwarf would have the same Keplerian velocity as the local disk gas, the resulting relative velocity between the gas and the white dwarf would be very small and hence the accretion rate would be large enough to produce the observed X-ray luminosity. Apparao (2002) also argues that density variations in the disk gas could account for anti-correlation in the X-ray and UV intensities noted by Robinson & Smith (2000). A resolution of this controversy is beyond the scope of this paper. We contend that the controversy is is still open and requires more detailed models of accretion onto compact objects embedded in a Keplerian disk with only small radial velocities.
Perhaps the greatest difficulty with the Be-white dwarf binary system scenario for these stars is the problem of forming such a system given the estimated mass ranges for y Cas of 13-18 M, (Harmanec et al. 2000; Zorec, fiemat, & Cidale 2005; Gontcharov, Andronova, & Titov 2000; Tokovinin 1997) and HD 110432 of 21.5-25.1 VI,. In order for a white dwarf to form in a Be system, its progenitor must initially be more massive than the Be star progenitor. Evolutionary models by Raguzova (2001) suggest that the maximum initial mass of a white dwarf progenitor in a Be binary system is 10-11 M,. Thus y Cas would
- 12 -
have needed to be initially 210 Ma for a white dwarf companion to have formed, but the accretion of 3 - 8 Ma or more from the companion to reach its current mass seems unlikely. The evolutionary scenario would be even more difficult in this case of HD 110432 given that it is possibly more massive than y Cas.
An alternative to the white dwarf binary model has been proposed and refined in a series a papers by M. A. Smith, R. D. Robinson, and collaborators (e.g. Smith et al. 2004; Robinson, Smith, & Henry 2002; Robinson & Smith 2000; Smith & Robinson 1999; Smith, Robinson, & Corbet 1998). These authors have proposed a picture in which there is a dynamic interaction between magnetic structures near the stellar surface and the decretion disk about the star. The model has evolved to explain the flux variations that were found on several time scales utilizing optical, UV, and X-ray monitoring of y Cas. They discovered that there was a cyclical variation in both the UV and X-ray data with a 1.12 day period but the lightcurves in the two bands were 180" out of phase (Robinson & Smith 2000; Smith, Robinson, & Corbet 1998). Rapid X-ray fluctuations on timescales of seconds to minutes, termed "shots," were also observed (Smith, Robinson, & Corbet 1998). The number and amplitude of these shots were found to increase during the UV minimum. More recently a longer timescale was identified. Robinson, Smith, & Henry (2002) found that the optical and X-ray emission from y Cas exhibited cyclical variations with periods that changed from 55 to 93 days. In this case the optical and X-ray fluxes showed a strong positive correlation.
It was proposed that the shots were generated in magnetic structures near the stellar surface and that the 1.12 day period is due to rotation of the star (Robinson & Smith 2000; Smith, Robinson, & Corbet 1998). A possible signature of such models may be magnetically induced flaring, which would be pronounced in the hard X-ray band. As noted, we are unable to identify such behavior. The dips in the UV spectrum were attributed to cool, optically thin clouds that corotate with the star (Smith, Robinson, & Hatzes 1998). The 55-93 day variability has a more complicated explanation in their model. Robinson, Smith, & Henry (2002) suggest that the variability is due to a cyclic dynamo operating near the inner edge of the Keplerian decretion disk at - 2.5R,. This dynamo was purported to result from a Balbus-Hawley instability which which produces turbulence that amplifies and modulates the stellar seed field (Balbus & Hawley 1991). Unfortunately it is difficult to test this model as no detailed theoretical spectral studies have been carried out. Thus this model remains mostly untested beyond its ability to, in principle, yield variability on the required timescales.
Thus while we cannot at this time authoritatively state which model is correct for these systems, we can say that y Cas and HD 110432 appear to be members of the same class of objects, Be stars with X-ray luminosities intermediate between those observed from Be-
- 13 -
neutron star systems and those typical of normal early.type stars. In fact, this class of objects may be expanding. Recently, Lopes de Oliveira (2006) have suggested that the B0.5111-Ve stars SA0 49725 and HD 161103 are new members of this class. The X-ray spectra of these stars were found to be well fitted by thermal plasma models with temperatures - 10 keV. But in contrast to both y Cas and HD 110432, the X-ray spectra of SA0 49725 and HD 161103 exhibit emission lines not only at 6.7’ keV and 6.97 keV from H-like and He-like Fe, but also the Fe K fluorescence line at 6.4 keV which they attribute to reprocessing of the continuum emission in cold matter near the X-ray source.
A resolution to the question of what emission mechanism is at work in these systems will require advances on several fronts:
1. Improved hard X-ray spectra, especially above 50 keV. This will enable researchers to better differentiate between thermal and nonthermal origins for the emission. In the near- term, the INTEGRAL mission has been approved through 2008 with a possible extension through 2010. Three to five years of additional data will help us to improve upon the IBIS/ISGRI and SPI spectra presented here. On the horizon, future hard X-ray missions with advanced mirrors will provide significant improvements in sensitivity up to - 100 keV.
2. Improvements in modeling the formation of white dwarf - Be star binary systems in which significant matter transfer occurs. One of the significant strikes against the white dwarf binary scenario is the question of whether a such binary system can even be formed if the Be star has a mass well above 11 Ma.
3. Detailed theoretical modeling of both the white dwarf binary and magnetospheric models with an aim toward identifying spectral and temporal signatures that can be compared, in detail, with observations.
6. ACKNOWLEDGEMENTS
We would like to thank Myron Smith for stimulating discussions on the nature of these systems. This work made use of the NASA High-Energy Astrophysics Research Archive Center (HEASARC), and the NASA INTEGRAL Guest Observer Facility. The Off-line Scientific Analysis (OSA) software available from the INTEGRAL Science Data Centre was used to perform much of the analysis in this work. This work is based in part on observations with INTEGRAL, an ESA project with instruments and science data centre funded by ESA member states (especially the PI countries: Denmark, France, Germany, Italy, Switzerland, Spain), Czech Republic and Poland, and with the participation of Russia and the USA.
- 14 -
REFERENCES
Apparao, E;. M. V. 2002, A&A, 382, 554
Apparao, K. M. V. 1994, A&A, 291, 775
Balbus, S., & Hawley, J. F. 1991, ApJ, 376, 214.
Ballereau, D., Chauville, J., & Zorec, J. 1995, A&AS, 111, 423
Barrera, L. H., Mennickent, R. E., & Vogt, N. 1991, Ap&SS, 185, 79
Chevalier, C., & Ilovaisky, S. A. 1998, A&A, 330, 201
Codina, S. J., de Freitas Pacheco, J. A., Lopes, D. F., & Gilra, D. 1984, A&AS, 57, 239
Corbet, R. H. D. 1986, MNRAS, 220, 1047
Dachs, J., Poetzel, R., & Kaiser, D. 1989, A&AS, 78, 487
den Hartog, P. R., et al. 2006, A&A, in press
Elvis, M., Plummer, D., Schachter, J., & Fabbiano, G. 1992, ApJS, 80, 257
Gontcharov, G. A., Andronova, A. A., & Titov, 0. A. 2000, A&A, 355, 1164
Haberl, F. 1995, A&A, 296, 685
Haberl, F., & Pietsch, W. 2004, A&A, 414, 667
Haberl, F., & Sasaki, M. 2000, A&A, 359, 573
Hanuschik, R. W. 1995, A&A, 295, 423
Helfand, D. J., & Moran, E. C. 2001, ApJ, 554, 27
Harmanec, P., et al. 2000, A&A, 364, L85
Hoffleit, D., & Warren, W. H. 1991, Bright Star Catalog 5th Revised Edition
Horaguchi, T. et al. 1994, PASJ, 46, 9
Hummel, W., & Vrancken, M. 2000, A&A, 359, 1075
Kubo, S., Murakami, T., Ishida, M., & Corbet, R. H. D. 1998, PASJ, 50 417
- 15 -
Lopes de Oliveira, R., Motch, C., Haberl, F., Negueruela, I., & Janot-Pacheco, E. 2006, A&A, in press
Mennickent, R- E., Vogt, N., Barrera, L. H., Covarrubias, R., & Ramhez, A. 1994, A&AS, 106, 427
Mewe, R., Lemen, J.R., and van den Oord, G.H.J. 1986, A&AS, 65, 511
Miroshnichenko, A. S., Bjorkman, E(. S., & Krugov, V. D. 2002, PASP, 114, 1226
Murakami, T., Koyama, K., Inoue, H., & Agrawal, P. C. 1986, ApJ, 310, L31
Negueruela, I. 1998, A&A, 338, 505
Negueruela, I., & Okazaki, A. T. 2000, in ASP C'onference Series 214, IAU Colloq. 175, The Be Phenomenon in Early -Type Stars, ed. M. A. Smith, H. Henrichs, & J. Fabregat, 713
Owens, A., et al. 1998, A&A, 348, 170
Pallavicini, R. et al. 1981, ApJ, 248, 279
Parmar, A. N., Israel, G. L., Stella, L., & White, N. E. 1993, A&A, 275, 227
Porter, J. M., & Rivinius, T. 2003, PASP, 115, 1153
Raguzova, N. V. 2001, A&A, 367, 848
Raymond, J. C., & Smith, B. W. 1977, ApJS, 35 419
Robinson, R. D., & Smith, M. A. 2000, ApJ, 540, 474
Robinson, R. D., Smith, M. A., & Henry, 6. W. 2002, ApJ, 575, 435
Secchi, A. 1867, Astron. Nachr., 68 63
Smith, M. A., & Balona, L. 2006, ApJ, 640, 491
Smith, M. A., & Robinson, R. D. 1999, ApJ, 517, 866
Smith, M. A., Robinson, R. D., Corbet, R. H. D. 1998, ApJ, 503, 877
Smith, M. A., Robinson, R. D., Hatzes, A. P. 1998, ApJ, 507, 945
Smith, M. A., et a1.2004, ApJ, 600, 972
- 16 -
Tokovinin, A. A. 1997, A&AS, 124, 75
Torrejbn, J. M., & Orr, A. 2001, A&A, 377, 148
Ubertini, P., et al. 2003, A&A, 411, L131
Vacca, W. D., Garmany, C. D., & Shull, J. M. 1996, ApJ, 460, 914
Vedrenne, G., et al. 2003, A&A, 411, L63
Waters, L. B. F. M., Pols, 0. R., Hogeveen, S. J., Cotk, J., & van den Heuvel, E. P. J. 1989, A&A, 220 L1
White, N. E., Swank, J. H., Holt, S. S., & Parmar, A. N. 1982, ApJ, 263, 277
Winkler, C., et al. 2003, A&A, 411, L1
Wood, K. S., et al. 1984, ApJS, 96, 507
Yokogawa, J., Imanishi, K., Tsujimoto, M., Koyama, K., & Nishiuchi, M. 2003, PASJ, 55, 161
Zorec, J., Frkmat, Y., & Cidale, L. 2005, A&A, 441, 235
This preprint was prepared with the AAS &'I)$ macros v5.2.
- 17-
Table 1. Best Fit Parameters for MEKAL and Raymond-Smith Models"
Parameter y Cassiopeiae HD 110432
MEKAL
nH(1oZ1 cm-2) kT (keV) Abundance x 2 (d.0.f.) 232.3 (202) 64.2 (61) ISGRI Flux (20-50 keV)b 4.18-0.63 0 * 8 4 - ~ . 3 ~ (10-l~ ergs cm-2 s-')
+1.00 +0.52
Raymond-Smit h
nH(1oZ1 cm-2) kT (keV) Abundance x2 (d.0.f.) 232.2 (202) 62.8 (61)
f0.49 ISGRI Flux (20-50 keV)b 4.182:::; 0.84-~.,5 (10-l~ ergs cm-' s-')
Cut-off Power-Law + Gaussian
n H ( loz1 cm-2) Photon Index Cut-off Energy (keV) Line Energy (keV) Sigma (keV) Equivalent Width (eV) x2 (d.0.f.) ISGRI Flux (20-50 keV)b (10-l' ergs cm-2 s-l)
11.5323,::; f0.26
1.51-0.28 30.8827&0 6.722;: :
f0.14 0'28-0.07 593::;; 58.7 (58) 0.94+0,::$
aAll errors are 90% confidence.
bError derived only from model normalization error.
- 18 -
Fig. 1.- The 30" x 15" IBIS/ISGRI mosaic significance maps for y Cas in the 20 - 40 keV and 40 - 60 keV energy bands. Note how y Cas dims significantly between the two energy bands. The significance drops from 29.70 in the 20 - 40 keV band to 3 . 4 ~ in the 40 - 60 keV band. This is also reflected in the spectra shown in Figures 2a 8z 2b
- 19 -
r. I
2 ‘ ’ “ ‘ I 1 10
Channel Energy (keV)
N
x o N I * I
1 10
Channel Energy (keV)
Fig. 2.- (a) The best-fit MEKAL model and the unfolded IBIS/ISGRI and SPI spectra as well as archival ASCA GIS and BeppoSAX PDS spectra for y Cas. Model parameters were kept constant between data sets except for the normalization which was allowed to vary. In (b) Count data with the folded best-fit MEKAL model and the residuals in units of sigma.
- 20 -
Time (s)
Fig. 3.- IBIS/ISGRI lightcurve for y Cas in the 20 - 50 keV energy band with la uncer- tainties. The light curve consists of 12 hour time bins and covers the time period December 2002 to September 2004. The average count rate for this time period is 0.785f0.033 - 6.0 mCrab. For reference, t = O is MJD = 52636.4872.
- 21 -
Fig. 4.- The 7" x 3.5" IBIS/ISGRI mosaic significance map for HD 110432 in the 20 - 50 keV energy bands. The significance of HD 110432 in this band is 4.30.
- 22 -
Fig. 5.- (a) The best-fit MEKAL model and the unfolded IBIS/ISGRI and SPI spectra as well as archival BeppoSAX LECS, MECS, and PDS spectra for HD 110432. Model parameters were kept constant between data sets except for the normalization which was allowed to vary. (b) Count space data sets with the folded best-fit MEKAL model and the residuals in units of sigma
- 23 -
Time (s)
I
Fig. 6.- The IBIS/ISGRI lightcurve for HD 110432 in the 20 - 50 keV energy band with la uncertainties. The light curve consists of 3 day time bins and covers the time period January 2003 to December 2004. The mean count rate in this time interval is 0.154f0.071 - 1.2 mCrab. For reference, t = O is MJD = 52650.6244.