integrated analysis of experimental datasets reveals...
TRANSCRIPT
1
INTEGRATED ANALYSIS OF EXPERIMENTAL DATASETS REVEALS MANY NOVEL PROMOTERS IN 1% OF THE HUMAN GENOME
Nathan D. Trinklein1,*,†, Ulaş Karaöz2,*, Jiaqian Wu3,*, Anason Halees2,*, Shelley Force Aldred1, Patrick J. Collins1, Deyou Zheng4, Zhengdong Zhang4, Mark Gerstein4, Michael Snyder3,4, Richard M. Myers1,# and Zhiping Weng2,5,#
*These authors contributed equally to this work. #Correspondence and requests for materials should be addressed to Richard M. Myers or Zhiping Weng. †Presently at SwitchGear Genomics. 1. Department of Genetics, Stanford University School of Medicine, Stanford, CA 94305 2. Bioinformatics Program, Boston University, 24 Cummington St., Boston, MA 02215. 3. Department of Molecular, Cellular and Developmental Biology, Yale University, New Haven, CT 06520. 4. Department of Molecular Biophysics and Biochemistry, Yale University, New Haven, CT 06520. 5. Biomedical Engineering Department, Boston University, 44 Cummington St., Boston, MA 02215. ABSTRACT The regulation of transcriptional initiation in the human genome is a critical component of global gene regulation, but a complete catalog of human promoters currently does not exist. In order to identify regulatory regions, we developed four computational methods to integrate 129 sets of ENCODE-wide chromatin immunoprecipitation data. They collectively predicted 1393 regions. Roughly 47% of the regions were unique to one method, as each method makes different assumptions about the data. Overall, predicted regions tend to localize to highly conserved, DNaseI hypersensitive, and actively transcribed regions in the genome. Interestingly, a significant portion of the regions overlap with annotated 3'-UTRs, suggesting that some of them might regulate antisense transcription. Majority of the predicted regions are more than 2kb away from the 5'-ends of previously annotated human cDNAs and hence are novel. These novel regions may regulate unannotated transcripts or may represent new alternative transcription start sites of known genes. We tested 163 such regions for promoter activity in four cell lines using transient transfection assays and 25% of them showed transcriptional activity above background in at least one cell line. We also performed 5'-RACE experiments on 62 novel regions and 76% of the regions were associated with the 5'-ends of at least two RACE products. Our results suggest that there are at least 35% more functional promoters in the human genome than currently annotated.
2
INTRODUCTION The pilot phase of the ENCODE project has generated a large volume and variety of functional genomics data (The ENCODE Project Consortium 2004). Over 150 independent experiments were conducted to characterize transcriptional regulatory elements in human cell lines. The majority of these datasets measure transcription-factor binding and histone modifications using the technique of chromatin immunoprecipitation combined with genomic microarrays (ChIP-chip) or tag sequencing. Other datasets include high-throughput promoter reporter assays. Many of these experiments were conducted on factors known by previous studies to mark sites of transcription initiation, such as TAF1, methylation of Lysine 4 on histone H3, and RNA polymerase II. This compendium of data thus provides an unprecedented collection of experimental observations characterizing transcription start sites (TSSs) and their associated promoters in 1% of the human genome. With this set of transcriptional regulatory element data, we aimed to map transcriptional promoters and regulatory regions throughout the ENCODE defined regions independent of mRNA to genomic DNA sequence alignments. We used an integrated approach that evaluated the data as a whole in a quantitative manner rather than studying each dataset individually. One of the most significant analytical challenges with microarray-based functional genomics is the continuous nature of the data. Specifically in the case of ChIP-chip, a discreet biochemical event (e.g. histone modification) is usually not reflected as a binary experimental output. Therefore, invoking a threshold for calling a site bound or unbound by a transcription factor in an individual dataset is often arbitrary and individual data points near the threshold can be easily misclassified depending on whether the emphasis is placed on specificity or sensitivity. These shortcomings can be overcome when a number of experiments are analyzed together, as a modest signal that is reproduced across a number of experiments can become much more significant than it would be in a single experiment. To this end, we have implemented four complementary methods to integrate the compendium of ENCODE transcriptional regulatory element data. First, a Naïve Bayes method computes a score that combines the ChIP signals in different experiments, which are thresholded and weighted according to how well they perform on a set of known promoters. Second, we developed a tree-weighting method that computes a weighted sum of counts for a given region, where the weights account for both the TSS enrichments of individual experiments and the correlation between experiments. Third, a majority-voting method determines the level of experimental support for each genomic position, defined by the number of cross-lab, cross-platform or cross-factor experiments that designate that position above some statistical threshold. Lastly, we developed a Z-score method that generates a cumulative score by summing over the Z-scores of a genomic interval across multiple experiments. These methods predict regions of 0.6-1.5 kb sizes, dictated by the resolution of the underlying ChIP datasets. The regions do not provide directionality or connectivity
3
for transcripts in the vicinity, because the methods do not use sequence as input. Our main goal is to identify potential regulatory regions from evidence other than direct cDNA sequence, thus we take a promoter-centric approach in designing validation experiments. We leave the characterization of the nature of products emanating from the novel promoters to future work. To evaluate the effectiveness of these different methods, we compared their predictions with TSSs identified by other independent experiments and genome annotations, many of which have been produced by the ENCODE project. We also conducted extensive experimental validation of novel regions that were not part of existing promoter annotation. We experimentally validated 85 novel promoters with transient transfection assays and Rapid Amplification of cDNA Ends (5’-RACE) experiments, and demonstrated the power of an analytical approach that integrates the data from many genome-scale experiments. Extrapolating from these results, we estimate that there are at least 35% more novel promoters than currently annotated. RESULTS Genome Regions Predicted by the Four Methods The four complementary approaches make different assumptions and therefore have unique advantages and disadvantages. For example, Z-score assumes that each experiment has the same predictive power for promoters, but it makes no assumption on how a promoter should look like. In contrast, Naïve Bayes uses a training set of known promoters to determine which experiments have the highest predictive power and weights the experiments accordingly. Voting explicitly takes into account the finding that experiments performed by the same lab or on the same microarray platform tend to identify similar genomic regions as significant. Tree-Weighting determines this lab or platform bias automatically via correlating the datasets.
The number of regions predicted by each method and the agreement between them are shown in Figure 1 (see also Supplementary Table 1 for a full listing). Z-score identified the smallest number of regions (580), followed by Naïve Bayes (689), Tree-Weighting (714), and Voting (985). There are 340 regions that are predicted by all four methods, and these are likely the highest confidence promoter regions. Interestingly, Z-score, Naïve Bayes, and Voting had a similar percentage of unique regions (26%, 28%, and 28% respectively); however Tree-Weighting had only 5% unique regions with 92% of its regions included in the Voting list. These comparisons indicate that all four methods are identifying a significant number of the same regions but also many regions unique to that particular method, and that Tree-Weighting and Voting perform more similarly to each other than the others. In addition, the near 2-fold variation in the absolute number of regions identified by the four different methods (from 580 to 985) suggests that some of the approaches may be more specific than others.
The different methods also tend to predict regions of varying length

4
(Supplementary Figure 1). Z-score and Tree-Weighting predict regions that are on average 1.5 ± 0.8kb long while Naïve Bayes and Voting predict regions roughly half the size (0.8 ± 0.3kb and 0.6 ± 0.3kb respectively). The resolution of our predictions is limited by the underlying datasets – the genomic DNA produced in the fragmentation process of ChIP is roughly 500-1kb long. Regions that are predicted by all methods are longest (3.8 ± 2kb; called Common4) as we merge the overlapping predictions by the four methods together. Shared regions (predicted by two or three methods) are affected by merging in the same way (1.6 ± 0.9kb). The difference in length distribution impacts the region-based accounting of validation rate described below, as longer regions have a higher chance of being validated.
Comparison of Predicted Genome Regions with Other Datasets and Annotations
As one way to assess the accuracy of the promoter predictions by each approach, we compared the 340 regions common to the four lists along with the regions unique to each list with other experimental datasets and genomic annotations that independently mark sites of transcription initiation. In order to assess the significance of these overlaps, we randomly placed the same number of size-matched regions 100 times in ENCODE regions for each comparison to determine the mean amount of overlap by chance, and the actual observed overlap is expressed as the number of standard deviations away from the mean. The other datasets and genomic annotations we compared against included a high-confidence set of TSSs defined by the Genes and Transcripts analysis group of the ENCODE consortium (GT-TSS), which is a integration of GENCODE ({REF PMID: 16925838}) annotated TSSs and CAGE and GIS-PET defined 5’-ends (Ng et al. 2005; Shiraki et al. 2003), regions of nucleosome displacement assayed by FAIRE (Lee et al. 2004), regions of DNaseI hypersensitivity ({REF PMID: 16791208}), 5’-UTRs, 3’-UTRs, and coding sequences of known genes (Figure 2).
As shown in Figure 2F, the intersection of all four methods shows the highest degree of overlap with all markers, supporting the hypothesis that these regions are more likely to be promoters than those identified by any of the individual methods alone. Not surprisingly, GT-TSSs and 5’-UTRs were two of the top three categories that showed the highest degree of overlap with the intersection of the four lists. Interestingly, regions of DNaseI hypersensitivity have the second highest degree of overlap perhaps because the ChIP-chip and the DNaseI hypersensitivity experiments both identify the most active promoters in the cell lines tested. Further support for the regulatory potential of the predicted regions comes from the significant enrichment with datasets of active transcription (TARs/transfrags and racefrags) (R. Guigo, pers. comm.) and with those of non-exonic regions that are proximal to known genes (intergenic proximal and intronic proximal), as well as the significant depletion of non-exonic regions that are distal to genes (intergenic distal and intronic distal). In addition, there is a significant enrichment of evolutionarily constrained sequences (Karolchik et al. 2003), indicating that on average the predicted regions are under selective pressure. There is also a slight enrichment of pseudogenes, which could be accounted for by the actual transcriptional activities of some pseudogenes (Balakirev and Ayala 2003; Zheng et al. 2005) or could
Deleted: J. Stamatoyannopoulos, per. comm.

5
be due to the cross-hybridization of microarray probes targeting pseudogenes with genomic regions from the parental genes. In fact we observed transcription emanating from four annotated pseudogenes in our 5’-RACE experiments (see 5’-RACE results below and Figure 5C).
Panels A-D of Figure 2 show the degree of overlap of the same categories with the regions unique to each of the four methods. The regions unique to Z-score (Figure 2D) and unique to Naïve Bayes (Figure 2A) show the highest degree overlap with GT-TSSs, suggesting that these two approaches are more specific than Tree-Weighting and Voting. Tree-Weighting shows the least significant overlap with the other categories but also has the smallest number (38) of unique regions. Naïve Bayes and Voting show the most overlap with categories that potentially indicate novel regulatory regions (DNaseI hypersensitivity and FAIRE). Figure 2E shows the results for regions predicted by two or three methods, with significant overlaps with GT-TSS, 5’-UTR, DNaseI hypersensitivity and FAIRE.
The significant overlaps with independent datasets are highly encouraging and
indicate that we are indeed identifying promoters with an integrated analysis of ENCODE ChIP-chip data. Interestingly, some of the regions that we identified do not overlap with known promoters and are thus putative novel promoters. We define a “known promoter” as a region previously identified as a promoter. When we began this project, the GENCODE annotation was not fully developed, and we defined a novel promoter as one that was more than 2kb away from the TSS of a GenBank cDNA. All the promoters that we chose for experimental validation were novel based on that definition. Upon completion of the GENCODE annotations, we revised our definition of novel promoters to those that were ±2kb surrounding GENCODE annotated TSSs. Consequently, some of the regions we previously designated “novel promoters” are now part of the GENCODE annotation and are thus categorized as “known” below.
Ninety (26%) of the 340 regions predicted by all four methods and 861 (62%) of
the 1393 regions predicted by at least one method were thus deemed novel upon the GENCODE criteria. A significant proportion of the predicted regions are localized to the boundaries of GENCODE annotated transcripts (Figure 3 shows the distance distribution in comparison to randomly placed regions of equal sizes). Yet 319 regions are more than 20kb away from the 5’-end of an annotated transcript. Some of these may be functional long-range elements.
In order to assess whether some of the predicted regions greater than 2kb away
from the 5’-end of a cDNA were indeed active promoters, we tested 163 regions (126 novel regions based on the GENCODE definition) by transient transfection reporter assays and 62 regions (28 remain novel) by 5’-RACE experiments. Transient transfection assays validated 41 of 163 predicted regions We cloned 250 genomic fragments that are within 1kb of 163 predicted regions and
6
tested them for promoter activity in four human cell lines (HT1080, HeLa, HCT116, and CRL1690) using high-throughput transient transfection reporter assays (Table 1). Nearby CAGE and GIS-PET (Ng et al. 2005; Shiraki et al. 2003) were used to determine the direction of the fragment when available, otherwise the region was cloned in both directions. An independent set of 24 randomly chosen genomic regions were previously cloned to establish the background of luminescent signal (Cooper et al. 2006), and a tested fragment is deemed active if its signal is three or more standard deviations away from the mean of these negatives. Thus roughly 0.1% of randomly chosen genomic regions are positive by chance. We call a promoter validated by this method if any one of its cloned fragments is positive in at least one cell line.
Overall, 41 tested putative promoters were functional out of the 163 tested,
corresponding to a validation rate of 25%. Encouragingly, the validation rate for the novel ones were only lower by 2% than that of the known ones, suggesting that a similar validation rate would be observed for the remaining novel predictions if they were also tested. Regions predicted by multiple methods clearly had the highest validation rate. Specifically, predictions common to all four methods had a validation rate of 39%, followed by predictions made by two or three methods (20%), and only 13% of regions unique to one method were validated.
We compared sequence features of the prediction regions that were validated and the ones that were not. The former have a higher tendency of overlapping with a CpG island (36% vs. 9%) or containing a TATA-box (52% vs. 25%) but a lower tendency of containing a CCAAT-box (25% vs. 59%). This is in agreement with our previous study which showed that promoter fragments active in transient transfection assays tended to be GC rich (Cooper et al. 2006). The results here further indicate that canonical promoters (e.g. with CpG and TATA) tend to have a higher validation rate by transfection assays. One might reason that these promoters tend to be stronger and active in more cell lines, and thus easier to detect. This reasoning also explains the apparently lower validation rate in our current study (25% active in at least one of four cell lines) compared with that in our aforementioned study (40% and 60% active in at least one of four or 16 cell lines respectively). We argue that there are a higher percentage of non-canonical promoters in the predicted novel regions in this study. This is consistent with our earlier observation in that study of widely different validation rates between different classes of promoters (such as the most distal vs. the more proximal ones; cf. table 1 in (Cooper et al. 2006)). Therefore, it is likely many of the un-validated predictions are actually functional if more cell lines are used or if a less stringent threshold is used for calling a fragment active. 5’-RACE validated 47 of 62 predicted regions We performed 5’-RACE in one cell line (NB4) to test 62 predicted regions. 5’-RACE experiments provide evidence of transcription in living cells, and thus complement transient transfection assays that measure promoter activity in vitro. In total, we designed 149 pairs of nested primers targeting a ± 1kb window around the predicted regions. Multiple designs were made for some regions, depending upon neighboring TAR

7
evidence (Bertone et al. 2004). If at least two sequenced clones map to within 1kb of a predicted region (regardless of the strand), it is deemed as a validated promoter. The results are summarized in Table 1. Of the 62 regions we set out to test, 47 (76%) were thus validated. Interestingly, the validation rate is even slightly higher for the 28 novel regions (79%) compared with the 34 regions that got annotated as a GENCODE TSS (74%). Clearly the GENCODE annotation provides additional evidence to validate the positive RACE results and indicates the robustness of our predictions.
The number of validated promoters generally correlated with the number of methods used to predict the promoter. Regions predicted by all four methods had a validation rate of 85% while the ones predicted by only one method had a validation rate of 67%, and the ones predicted by two or three methods had an intermediate rate of 74%. Among the 15 tested predictions made by only one method, 10 were by the Tree-Weighting method and 7 were validated by the RACE experiment. Unfortunately there is not enough RACE data on regions unique to other methods. The validation rate was not correlated with whether or not a CAGE/GIS-PET was present near the predicted promoter (77% for tag absent and 72% for tag present; the overall rate was 75%).
We manually inspected the validated promoters with respect to GENCODE annotated transcripts. Most of them are associated with existing genes. Only two did not overlap known transcripts; nevertheless, they seemed to interact with yet unannotated transcripts, as they fell within the bounds of novel transcripts defined by a GIS-PET cluster. Some of them initiate transcription of products that are embedded in an intron (as sense or antisense), others provide an alternative transcription start site (and hence a new variant), and the remaining are antisense to an exon (typically the 5’-UTR or 3’-UTR and less frequently an internal exon) of the associated gene. Figure 4 shows three examples of antisense transcripts represented by our RACE products. Interestingly, in many of the intron embedded and alternative TSS cases, a SINE or LINE (indicated by RepeatMasker; http://ftp.genome.washington.edu/RM/RepeatMasker.html) was found at or near the promoter region. Additionally, in two of the 3’-UTR antisense cases, the transcripts appeared to be spliced.
We systematically classified the transcripts associated with the 41 promoters validated by transient transfection assays and the 47 promoters validated by 5’-RACE experiments (inferred for the former and the RACE products for the latter) into 11 categories, depending upon the relative positions of the transcripts with respect the nearest GENCODE annotated gene (Figure 5). The total number of cases is summed to 48 for transfection and 59 for RACE, as some classes (notably intron embedded) can be interpreted as other classes (e.g. new TSS or antisense). The two sets both have large representations of 5’-exon antisense, 3’-exon antisense, and intron embedded; however, the transfection set has 10 intergenic regions while the RACE set has 11 known promoters and 4 pseudogenes. The discrepancy could be due to different criteria for region selection. Such classification should be helpful for inferring the biological functions of newly validated promoters.
8
DISCUSSION In this study we have identified 1393 genomic regions in 1% of the human genome (44 ENCODE regions totaling 30 Mb) that are potentially promoters, by integrating the results of many transcription-factor binding and histone modification ChIP-chip data sets. The results of this analysis provide an alternative way to map transcription start sites and promoters independent of aligning cDNA sequences to the genome. Approximately 52% of the promoters annotated by GENCODE in ENCODE regions were identified by our approach. Because the ChIP experiments were carried out in a limited number of cell lines under only a few conditions, we do not expect all GENCODE promoters to be be identified. The observed overlap was highly significant and gave us confidence that we were able to identify many of the previously known promoters. The 1393 regions identified by us are also highly enriched in other independent datasets generated by high-throughput experiments in the ENCODE consortium, namely transcription (CAGE, GIS-PET, transfrag, TAR, racefrag) and DNaseI hypersensitivity.
Of the regions we identified without cDNA support, we experimentally validated
85 novel promoters from a total of 205 tested (41.5%), with 41/163 validated by transient transfection reporter assays and 47/62 by 5’-RACE experiments. Twenty regions were tested by both methods and 18 (90%) were validated by one or both of the methods (16 were validated by 5’-RACE, 5 by transfection, and 3 by both methods). If we extrapolate the validation rate of 41.5% (85/205) to 861 novel regions, we arrive at the estimate that there are 357 functional novel promoters in the ENCODE regions. If we use the same rate that 532 predicted regions account for 52% of GENCODE annotated promoters, we conclude that there are at least 35% more functional promoteirs than those currently annotated. There are many reasons for this 35% to be an underestimate, the most obvious one being that only four cell lines were used for transient transfection assays and one cell line for 5’-RACE experiments. Another reason is that only a few pairs of primers were designed for each predicted region (most regions had only one pair of primers). The resolution of the data also limited the accuracy of our validation experiments. Our approach may identify regions that are near to but 1-2kb away from the TSS, because many of the input datasets are histone modifications, which have been shown to be centered 1-2kb downstream the TSS (Kim and Ren 2006). This limitation likely affected the design of the transient transfection assays more severely than 5’-RACE, as the cloned fragments are typically 500-1k bp long and we might have missed the TSS and the functional core promoter in a fraction of the cloned fragments.
By examining these validated promoters individually, we observed that 13% of
the novel promoters are alternative promoters that start downstream of the most 5’ TSS of previously characterized genes, or extend the 5’-end of previously known genes. Approximately 11% of the novel promoters are in intergenic regions and may represent the TSSs of new genes, and a surprisingly high 23% of the novel promoters are on the antisense strand of previously identified transcripts (mostly terminal exons), potentially driving transcription of an antisense transcript (Figure 5).
9
It will require additional experimental work to determine the structure of the transcripts originating at these validated promoters, and consequently, whether these are alternative promoters of existing genes or promoters of new genes yet to be identified. Deep sequencing efforts (REF the FANTOM mouse paper) are invaluable in providing such information. Thus, a large portion of our predictions are awaiting the confirmation of high-throughput transcriptome projects. Some predictions, however, in particular the ones that function in selected cell types under selected conditions, will require targeted RACE-sequencing experiments that link the new 5’-ends to existing or novel genes. While we are confident in stating that the validated novel promoters are bound by the basal transcription machinery or have histone modifications frequently associated with active transcription, and are able to drive transcription in transient transfection assays or produce a transcript detectable by 5’-RACE, the biological relevance of these sequences remains to be determined. In vivo experiments such as targeted knockout of these sequences or in vivo reporter assays need to be performed to further characterize the roles of these sequences in living organisms. While these sequences may indeed promote transcription, the possibility exists that this may represent inconsequential transcriptional activity that has neither positive nor detrimental effect on the organism. In this capacity, these sequences may serve as reservoirs of regulatory potential that may be utilized in the course of evolution to positively select new genes or regulate existing genes in different ways. Thus, some or all of the novel regulatory sequences we have identified in this project may represent a snapshot of the equilibrium that has been reached between the creation and erosion of regulatory sequences in the evolving human genome. Four integrative methods were applied in this study to identify promoters because promoter-related factors were the focus of the available experimental datasets. There is no reason, however, why these approaches could not be applied to other sets of functional data to identify other types of functional genomic elements. Specifically, identifying long-range transcriptional regulatory elements such as enhancers and insulators has proven to be very difficult. With appropriate types of experimental data, a similar analysis as was conducted here could be applied to identify certain classes of long-range elements. In fact, some of the datasets we used were not restricted to promoters, e.g., mono-methylation of the lysine 4 residue on histone H3 and the binding of sequence specific factors such as p53 and STAT1. Thus some of our predicted regions may be functional long-range elements.
The major strength of our approach is that sensitivity can be improved by integration without sacrificing specificity, as integrating weak scores in multiple datasets can lead to a reliable prediction by our approach. It was clear that regions predicted by multiple methods had a higher validation rate than regions predicted by a single method, and this was seen for both experimental validation approaches. This highlights the value of using multiple methods. It would also be important to compare the performances of the different methods. We have not tested sufficient number of regions predicted by only one method (Supplementary Table 1), thus are not able to make a statistically robust comparison in this work. It is an important future direction. Certainly, these analyses will

10
become more powerful as more genome-wide functional data become available. Another potential future direction of this work would be to combine the unique advantages that the different methods afford to create a hybrid method that eliminates the shortcomings of the individual methods. For example, the experimental weightings derived by the Bayesian approach could be used to weight the contribution of the different experiments in the Z-score approach. Then, the regions identified by the Z-score approach could be added to the Bayesian training set to refine the weights of the individual experiments, and an iterative process could be invoked by this cycle.
11
MATERIALS AND METHODS ChIP-chip Datasets Among the data generated by the ENCODE consortium, the genomic regions targeted by 18 sequence-specific transcription factors, 6 histone modifications, PolII, TAF1, and TFIIB were determined by ChIP using antibodies to these components and either genomic tiling array (high density oligonucleotide or PCR products) or sequencing-based analyses (ChIP-PET and STAGE). In total there are 129 datasets on 11 different cell lines. Some of these experiments were performed at four time points after retinoic acid stimulation, and some others were performed before and 30 minutes after interferon γ treatment. The raw data of these experiments were obtained from the UCSC genome browser (the ENCODE consortium; http://genome.ucsc.edu/ENCODE/).
In addition, thresholded target lists (or hits) reported at several false discovery rate (FDR) cutoffs (1%, 5% and 10% FDR) for each dataset were obtained from the Transcriptional Regulation analysis group (Z. Weng, pers. comm.). These hits were used by both Tree-Weighting and Voting methods as described below. The Naïve Bayes Method Training Set. CAGE (5' Cap Analysis of Gene Expression) and GIS-PET (Gene Identification Signature Paired-End ditag) clusters (Ng et al. 2005; Shiraki et al. 2003) were used to identify positive examples of TSSs. Clusters of CAGE tags with less than 4 tags were removed to get 797 examples. Among these, 223 that overlapped with the 5'-ends of GIS-PETs in either HCT116 or MCF7 cell lines were used as the positive training set. Additionally, 225 regions spanning approximately 450kbs based on deep introns (3rd or deeper) and the CDS parts of deep exons were used to build the negative training set. The introns that were overlapping with exons from other transcripts, TARs or transfrags were filtered out. A set of 1365 negative examples was collected by extracting all possible uniformly distributed and non-overlapping windows of 300 bps. Training of the Bayesian Model: Each TSS training example was associated with a ChIP-chip enrichment score profile from different ChIP-chip experiments. The average enrichment score within a 1-kb window around the TSS was used. The average scores were binarized at a cutoff that maximized the correlation between the training set and the binarized ChIP-chip dataset. After this binarization, the training set consisted of positive and negative examples of a TSS, and each TSS had a binary profile of various ChIP-chip datasets. Using this training set, we can write the log-odds of a TSS given the data as: log-oddsTSS = log [P(TSS | all data) / P(non-TSS | all data)]. Assuming that the datasets are conditionally independent of each other (hence the name Naïve Bayes), the log-odds of a TSS consist of two terms:

12
log-oddsTSS = log [P(TSS) / P(non-TSS)] + ∑all data log [P(Di | TSS) / P(Di | non-TSS)] The first term, which is data independent, is the prior expectation of a TSS. The second term, which is based on the data, gives the log-odds of a TSS given the data. Di is a binary variable associated with the ith dataset. If Di equals 1, we denote the contribution to the second term PLL (positive log-likelihood-ratio), and if it equals 0 we denote it NLL (negative log-likelihood-ratio). For each ChIP-chip dataset, PLL and NLL were estimated empirically using the binarized profiles for the training set. Scanning of ENCODE Regions with the Bayesian Model: The Naïve Bayes model consists of PLL and NLL scores for each dataset, which give the Bayesian contribution of each dataset to the prediction of TSS. New regulatory regions were predicted by scanning ENCODE regions using the Naïve Bayes model. For each base pair in the ENCODE regions, the Bayesian contributions (PLL if the score is over the binarization cutoff from training, NLL otherwise) from each dataset are summed. A chosen cutoff was defined to binarize the final scores. All the contiguous base pairs that scored one at the end of the binarization were clustered. These regions were further filtered by pruning all the regions shorter than 300 bps and by joining regions separated by less than 200 bps. The score cutoff was calculated based on the expected prevalence of TSSs in the entire ENCODE region but was later made more stringent to obtain a higher confidence set of predictions. As expected, the 223 positive examples were predicted by the algorithm. These represent easy cases and were also predicted by at least one other method. Thus we chose to keep these predictions in the downstream analysis. The Tree-Weighting Method For each ChIP-chip experiment (i), we first computed the fold-enrichment (Fi) of its hits (determined at 1% FDR) near a TSS, defined as the number of observed hits near TSS (-2kb ~ 200 bp) divided by the expected number derived from simulation in which size-matched DNA fragments were randomly distributed back into individual ENCODE regions (excluding repeats). Subsequently, a tree was constructed to cluster all ChIP experiments, according to their correlation coefficients with respect to the genomic distribution of hits and non-hit regions. Using a branch-length division method (Gerstein et al. 1994), we then assigned a weight (Wi) to each experiment in order to minimize the bias introduced by same factors being tested in several conditions and multiple platforms. Within this scheme, the overall weight for a factor would be shared by individual experiments with ratios between 1/n and 1 (n is the number of experiments that tested this factor). The hits from all experiments were then merged to generate a list of non-overlapping regions, with hits that overlapped by ≥ 50 bps joined. This resulted in 3227 regions with an average length of 1.1kb. A score (Sj) was subsequently assigned to each of these regions defined as ∑ (Ni x Fi x Wi), where Ni was the number of hits within this region j from experiment i, Fi and Wi were the fold-enrichment and weight computed for experiment i, respectively. We thresholded Sj at 0.05 to generate a final integrative list of 828 regions, which had a mean length of 1.7kb. This cutoff approximately corresponded to 2 ChIP hits per region.

13
The Z-score Method All of the ChIP-chip datasets have a resolution much lower than a single base. In addition, different methods have different resolutions and also probe somewhat different subregions of the ENCODE regions. We thus needed to match corresponding data points between datasets, so we divided the ENCODE region into ~24,000 reference intervals that largely corresponded to the probes from the two types of PCR tiling arrays. We then fit the normalized ChIP intensity data from each experiment to these reference intervals by taking the average value over the interval.
With all the datasets aligned to one reference interval set, we did a Z-score transformation (number of standard deviations away from the mean) of each individual dataset to normalize for variation between datasets. This is appropriate because each experimental dataset is dominated by negative results; therefore the distribution of each dataset is approximately normal. The normalized scores allow comparing the same genomic interval between datasets in a consistent framework.
For each interval, the score assigned is simply the sum of all the normalized scores of the different datasets at that interval. To determine the significance of the score, we produced a background distribution of score sums by shuffling the values of each individual dataset over the ~24,000 intervals and summed the scores at each interval. By repeating the process 10 times, we obtained a background set of ~240,000 scores against which the real score sums can be assigned a P-value. We define an interval as part of a putative promoter if it had a positive score and a P-value <0.001. Putative promoter intervals within 100 bps were merged together. The Voting Method The voting method is based on weights that take into account the number of different labs that performed the experiments on a particular factor or histone modification and the number of different experimental platforms used in these studies. Supplementary Table 2 shows the weights used for each experiment. For each experiment, all the base pairs within a hit list were assigned the same weight. Thus every position in ENCODE regions was assigned a score: zero if the position was not part of any hit, and otherwise the sum of the weights of all experiments that included that position in their hits. The weights were selected so that the score was above one if the base was supported by at least two experiments performed on the same platform by different labs or on different platforms by the same lab. A continuous stretch of positions with scores above one were clustered together to define a genomic region whose score was the mean score of all the positions contained within it. Merging of the Predicted Regions by the Four Methods The four sets of predicted regions from the four methods were pooled and two regions are
14
merged if they overlap by one or more base pairs. This resulted in 1393 regions with length distribution shown in Supplementary Figure 1. These regions were then intersected with the original four sets of regions to determine which methods predicted each region. Each region was consequently assigned to one of the six categories: Common4 consisted of regions supported by all four methods; Shared consisted of regions supported by two or three methods; and four categories each consisted of regions Unique to an individual method. Overlap of the Predicted Regions with Genomic Annotations (Figure 2) Each category of the predicted regions defined in the previous paragraph was intersected with the following 13 genomic annotation datasets: (1) GT-TSS (±2kb), a high-confidence set of TSSs that have evidence for one or more complete transcripts from GENCODE ({REF PMID: 16925838}) and/or ≥ 5 tags from CAGE or GIS-PET; (2) 5'-UTR, which are 5’ untranslated regions defined by GENCODE transcripts; (3) 3'-UTR, which are 3’ untranslated regions defined by GENCODE transcripts; (4) intergenic distal, which are intergenic regions further than 5kb away from a GENCODE transcript; (5) intergenic proximal, which are intergenic regions within 5kb of a GENCODE transcript; (6) intronic distal, which are intronic regions further than 5kb away from a GENCODE exon; (7) intronic proximal, which are intronic regions within 5kb of a GENCODE exon; (8) DHS (DNaseI hypersensitive sites) determined by the Chromatin and Replication analysis group of the ENCODE consortium ({REF PMID: 16791208}); (9) FAIRE (Lee et al. 2004); (10) TARs and transfrags, which are transcribed regions determined by hybridizing mRNA to genomic tiling oligonucleotide arrays; (11) pseudogenes; (12) Racefrags (downloaded from http://encode.g2.bx.psu.edu/; (Giardine et al. 2005)), which are transcribed regions generated by hybridizing RACE products to genomic tiling arrays; (13) ECS (evolutionarily constrained sequences) based on the Most Conserved Track at the UCSC Genome Browser (Karolchik et al. 2003). GT-TSS, TAR, 5'-UTR, 3'-UTR, intergenic distal, intergenic proximal, intronic distal, intronic proximal, transfrags and racefrags were produced by the Genes and Transcripts analysis group of the ENCODE consortium (R. Guigo, pers. comm.). We randomly placed each of the 13 genomic datasets in ENCODE regions (excluding RepeatMask-ed regions for TARs/transfrags, Racefrags, and FAIRE as the tiling arrays did not tile over repeats). The number of the predicted regions that overlapped a genomic annotation was calculated for each randomization trial, and 100 trials were performed. The significance of the overlap is reported as the number of standard deviations away from the mean number of overlapping regions in the random trials. Distance Distributions of Predicted regions with Respect to Transcript Boundaries (Figure 3) For each predicted region, the distance from its start or end to the nearest GENCODE annotated transcript on either strand was calculated. There were two ENCODE regions that did not contain any annotated transcripts. Twelve predicted regions fell within these ENCODE regions and were excluded from the analysis. There were 3794 GENCODE
Deleted: J. Stamatoyannopoulos, pers. comm.
15
annotated first exons and 2608 last exons. Overlapping first exons were merged into 1372 representative first exons and overlapping last exons merged into 1254 representative last exons. All the regions that contained exons from different transcripts were removed. Based on this processing, 1339 5'-ends and 1227 3'-ends were defined, upon which the distance calculations were based. Sequence Analysis of the Validated and Un-validated Regions The fraction of regions that overlap with CpG islands (UCSC Genome Browser's CpG islands track) was calculated. For motif search, an in-house motif scanning algorithm called Possum was used (http://zlab.bu.edu/~mfrith/possum/) using TRANSFAC matrices (Wingender et al. 2000) for TATA-box (M00216, M00252, M00471) and CAAT box (M00109, M00116, M00117, M00159, M00190, M00200, M00254). The fraction of the promoters with at least one Possum hit (score ≥ 7) was reported. As expected, CpG-island enriched and TATA-box enriched validated promoters represented two different groups with insignificant overlap (Supplementary table 3). Fragment Cloning for Testing Promoters Activity using Transfection Assays From the full set of predicted promoters we randomly selected a mixture of promoters representing cases that were identified by one method, multiple methods, were high scoring, were low scoring (near threshold), fell in gene rich regions and fell in gene poor regions. For each of the putative promoters to be tested, we determined the presence of at least one CAGE or GIS-PET supporting a TSS in that region. If a region had CAGE or GIS-PET support, we used the 5’-end of the CAGE or GIS-PET sequence as the predicted TSS and used Primer3 software to design primers by inputting 600 bps of upstream sequence and 100 bps downstream of the predicted TSS (Trinklein et al. 2003). Each primer pair was required to flank the transcription start site. For the promoters that lacked nearby transcripts we designed primers to amplify a 1000 bps fragment so that we could clone it in both directions. A putative promoter was thus possibly tested by more than one fragment. We added 16 bps tails to the 5’-end of each primer to facilitate cloning by the Infusion Cloning System (BD Biosciences, Clontech cat no. 639605). (Left primer tail: 5’-CCGAGCTCTTACGCGT-3’, Right primer tail: 5’-CTTAGATCGCAGATCT-3’) We amplified the fragments using the touchdown PCR protocol previously described (Trinklein et al. 2003) and Titanium Taq Enzyme (BD Biosciences, Clontech, cat no 639210). To clone our PCR amplified fragments using the Infusion Cloning System, we combined 2 μl purified PCR product and 100 ng linearized pGL3-Basic vector (Promega). We added this mixture to the Infusion reagent and incubated at 42°C for 30 minutes. After incubation, the mixture was diluted and transformed into competent cells (Clontech cat. No. 636758). We screened clones for insert by PCR and positive clones were prepared as previously described. We quantified DNA with a 96-well spectrophotometer (Molecular Devices, Spectramax 190) and standardized concentrations to 50 ng/μl for transfections. Cell Culture, Transient Transfection and Reporter Gene Activity Assays

16
Transfection was performed in four cultured human cell lines (HeLa, HCT116, HT1080, and CRL1690) as previously described (Trinklein et al. 2003). We seeded 5,000-10,000 cells per well in 96-well plates. Twenty-four hours after seeding, we co-transfected 50 ng of each experimental luciferase plasmid with 10 ng of renilla control plasmid (pRL-TK, Promega Cat. No. E2241) in duplicate using 0.3 μl of FuGene (Roche) transfection reagent per well. We also transfected 24 random genomic fragments as negative controls for each cell line separately. Cells were lysed 24-48 hours post-transfection, depending on cell type. We measured luciferase and renilla activity using the PE Wallac Luminometer and the Dual Luciferase Kit (Promega, Cat. No. E1960). We followed the protocol suggested by the manufacturer with the exceptions of injecting 60 μl each of the luciferase and renilla substrate reagents and reading for 5 seconds. Identification of Active Promoters All activity data was reported as a transformed ratio of luciferase to renilla. We determined the mean ratio and standard deviation of the 24 negative controls in the four cell lines independently. Fragment activity was then expressed as the number of standard deviations from the mean for each fragment in each cell line. We called a fragment significantly positive if it was three standard deviations above the mean ratio of the negatives. We called a putative promoter active if any of its tested fragments was significantly positive in at least one cell line. Selection of Putative Promoters for RACE Validation We tested 62 predicted promoters for activity in one cell line. The selection of the test regions was mainly designed around the Tree-Weigthing (TW) method and selected roughly equal number of regions from each of the following groups: Unique to TW, shared between TW and only one method, shared with two methods and shared with 3 methods. The promoter regions were extended to be the union of the regions identified by individual methods, as described above.
In all cases, only promoters with some evidence of transcriptional activity nearby (such as a TAR, a CAGE tag or a GIS-PET) were selected and one active region was used as the index for the 5’-RACE design. In cases where the transcriptional activity was based only on TARs, two indices were selected: one upstream and one downstream of the promoter. To determine the design basis, we constructed a matrix for describing all the putative promoter regions. It summarized the relationship between each promoter and various transcription data. A promoter was considered to be putatively novel if it was not near (from -2kb to 200 bp) the 5’-end of a gene in the Known Genes track on the UCSC genome browser. We also computationally assessed each promoter’s functional potential based on its distance to nearby transcriptional activity as detected by transfrags / TARs, CAGE tags and GIS-PET. A promoter was considered to be functional if a transfrag, a CAGE tag or the 5’ tag of a GIS-PET was detected within this promoter region or in its close proximity (± 1.5kb). This comparison clearly separated our predicted promoters
17
into lists with or without transcriptional support.
Some of the putative promoters were then chosen for experimental validation based on the above matrix describing an individual promoter’s relationship with transcriptional data (including known TSS) and the number of methods predicting it. Whenever possible, the candidates from each group were selected randomly with one half predicted to be highly novel (i.e. not near GENCODE TSS). 5’-RACE Experiments (Rapid Amplification of cDNA 5’-Ends) We selected primers in two TARs (transcriptional active regions) within 3kb of the distance to the putative novel promoter sites predicted via the above method. We designed four primers for each TAR – two Gene Specific Primers (GSP1, GSP2) and two Nested Gene Specific Primers (NGSP1, NGSP2) on both plus and minus strand. When there was CAGE or GIS-PET information, the strand information of the gene expression was known and in these cases only two primers were picked for each TAR. The primers were mapped against the genome to make sure they mapped to only one location (with identity <80% to other locations). The primers are 23-28nt long, with GC content of 50-70% and with Tm>70°C, optimally 73°C -74°C.
Total RNA from human NB4 cell line was used in cDNA amplification by SMART RACETM kit (Clontech, CA, USA). First strand cDNA was synthesized using PowerScript Reverse Transcriptase. A total of 1μg RNA was used in a final volume of 10μl Reverse Transcription (RT) reaction (100ng/μl). RACE was followed by PCR amplification using Advantage™ 2 PCR Enzyme System (Clontech, CA, USA). 0.5μl RT reaction from the above was used in 50μl of PCR reaction. Nested PCRs were performed using 1ul of RACE PCR product in 50ul reaction. The PCR program was 94°C for 30 seconds and 72°C 3 minutes for 5 cycles, then 94°C for 30 seconds, 70°C for 30 seconds and 72°C 3 minutes, 5 cycles, followed by 25 cycles of 94°C for 30 seconds, 68°C for 30 seconds, concluded by an extension cycle of 72°C for 3 minutes. PCR products were gel-purified with QIAquick 96 well PCR purification kit (QIAGEN, CA, USA) and subsequently treated with Taq polymerase to add ‘A’ overhang. These PCR products were then cloned into TOPO® XL PCR cloning vectors (Invitrogen, CA, USA). Transformation was performed with One shot® Top10 ultracompetent cells (Invitrogen, CA, USA) in 96 well format. 5-6 subclones were produced for each specific RACE PCR product. The DNA of each subclone was prepared and digested with EcoRI. The digestions were analyzed by agarose gel electrophoresis in order to determine the approximate size of the insert. All subclones were end sequenced using M13 forward and reverse primers. Supplementary Figure 2 shows examples of RACE PCR products. Assignment of RACE Products to Putative Promoters Because for each tested promoter multiple primer sets were often used, each primer set typically produced 3-4 bands on the gel, and each band was cloned into 5-6 clones and then sequenced in both directions, each promoter therefore contributed between 30 and
18
100 raw RACE sequences. Due to the large number of clones obtained and the multiplicity of products obtained from each experiment, the manually kept record of direct connection between a RACE-cDNA sequence and the promoter it was testing was prone to potential annotation errors. Thus we decided to determine the relationship directly from the sequence data. The sequence data itself comes as read pairs (forward and reverse) from each clone and is the raw sequencing product (containing the parts of the sequencing vector, various primers and the actual insert).
To evaluate the activity success rate of the predicted promoters, we first constructed a genomic promoter-vicinity library by extracting the genomic DNA sequence from 5kb upstream to 5kb downstream around each of the 62 promoters, from the hg17 release of the human genome (NCBI build 35). All further mapping used BLAT (REF PMID 11932250) against this library. Searching within the vicinity of a target promoter is sufficient since the goal of the experiment was to validate the activity of the promoter and thus hits that map too far from the predicted site (either due to BLAT errors or PCR cross-amplification) would not support the validity of the promoter activity and hence would have to be dropped anyway. In addition, none of the primers designed were from a repeat region and no repeats overlapped the mapped inserts that were used in prediction validation. The default settings of BLAT have been tuned for high specificity and speed, considering its primary application on mapping a query sequence against large vertebrate genomes (REF PMID 11932250). Applying default setting failed to map many of the raw sequences from 5’-RACE, due to a combination of their short length, sequencing error and the inclusion of non-human sequences from the cloning vector and RACE primers. Thus, we used non-default settings of BLAT, aiming at maximizing sensitivity and sequencing error tolerance. The decreased specificity is compensated by applying a filtering algorithm (below).
We then mapped all the RACE-cDNA sequences against the library and also confirmed the position and orientation of the primers by mapping them to the library. In addition, we mapped three essential features of the RACE product onto the cDNA sequence itself: The linker/adaptor and the two regions of the TopoXL cloning vector immediately upstream and downstream of the insert.
Finally we applied a filtering algorithm to validate the association between a RACE-cDNA sequence and a promoter by requiring that the mapped part of the sequence start at the primer site and extend towards the promoter. The algorithm also ensured that the mapped part of the sequence was the full length of the insert by requiring that the TopoXL sequences be immediately adjacent (on the cDNA) to the part that BLAT could map to the genomic library, and in the correct orientation relative to each other and to the primer site. The 5’-end of the insert is that opposite to the primer site and typically should have the linker sequence upstream of it (on the cDNA). This end is taken as the TSS of the transcript. The filtering algorithm utilizes the presence of the forward and reverse reads and combines them to reconstruct the RACE-insert. This is important since the insert can be long and the two complementary reads might not overlap but only cover the two ends of the insert, leaving the actual length of the insert unknown without using
19
additional cues (as the algorithm does). A clone is considered a positive evidence for promoter activity if the TSS falls within the region of the predicted promoter plus 1kb on either end. ACKNOWLEDGEMENTS We thank the ENCODE Project Consortium for making their data publicly available, the Genes and Transcript analysis group for providing transcription datasets, Transcriptional Regulation analysis group for providing ChIP-chip and ChIP-sequencing datasets, and the ENCODE Chromatin/Replication analysis group for providing the DHS and FAIRE dataset. This work was funded by the ENCODE grant R01HG03110 from NHGRI, NIH to ZW; the ENCODE grant U01HG003162 from NHGRI, NIH to RMM and the ENCODE grant U01HG003156 from NHGRI, NIH to MS. PJC was supported by the Stanford Genome Training Program grant T32HG00044 from NHGRI.
20
LEGENDS Figure 1. Summary of predicted regions and experimental validation by transient transfection assays and 5'-RACE experiments. Numbers in parentheses indicate the number of validated and tested but un-validated regions in each category. A region is considered tested if it was tested by either transient transfection assays or 5’-RACE experiments; the validated status is similarly defined. Common4 are regions common to all four methods. Shared are regions predicted by two or three methods. NB, Z, V and TW indicate regions uniquely predicted by Naïve Bayes, Z-score, Voting, and Tree-Weighting methods respectively. Each class is represented by two pieces of the pie, with the darker colored one indicating novel regions and the lighter colored one indicating known regions. Note that due to the substantially different validation rates of the two experimental approaches and the uneven selection of method-unique regions, there is not sufficient data to directly compare the performances of the methods. Figure 2. The significance of the overlap of predicted regions in different categories with various genomic features. See Methods for their definitions and origins, as well as details on randomization. The significance is given in terms of the number of standard deviations away from the mean number of overlaps between a set of predicted regions and a set of randomly placed, size-matched regions corresponding to the genomic features. (A) Regions unique to the Naïve Bayes method. (B) Regions unique to the Tree Weighting method. (C) Regions unique to the Voting method. (D) Regions unique to the Z-score method. (E) Regions shared by two or three methods (Shared). (F) Regions supported by all the methods (Common4). Figure 3. Distance of predicted regions from annotated transcripts. Black bars: the number of regions at various distances from 5’-ends (A) and 3’-ends (B) for all predicted regions. White bars: the number of regions expected by a randomization process as used in Figure 2. Figure 4. Antisense examples of RACE products. Each of the three panels shows a UCSC genome browser graph. The Predicted Promoters track show the regions predicted by any of the four methods. The Designed Primers track shows the nested primer pairs used to perform the 5’-RACE experiments. For 5'-RACE, the transcripts are oriented opposite to the primers and end at the nested primer. The Mapped RACE products track shows the validated results of sequencing the RACE products. Only the properly oriented RACE products are considered fully valid and the TSSs should be at their 5’-ends (see Methods for more details). Other standard tracks from the May 2004 (hg17) assembly are shown to give the context of the promoter. Note the empty pseudogene tracks indicating that the identified transcripts are unlikely to be pseudogenes, and the histone modifications tracks which constitute a large fraction of the experiments used to make the predictions. Panel (A) shows results for prediction 1.14, a region on Chr.5 identified by all four methods. Two clusters of transcripts were found. The cluster on the left is likely to be antisense to the second exon of AC116366.4 and is different from the putative AC116366.5. The cluster on the right could be a distinct transcript or connected to the

21
cluster on the left. Interestingly, the antisense-targeted exon contains the translation start site of the gene only in some variants. Panel (B) shows results for prediction 1.4, a region on Chr.11 also identified by all four methods. Two clusters were found. The cluster on the right appears to be a 3'-UTR antisense transcript to GENCODE putative AC051649.7. The cluster on the left appears to be a 5'-UTR antisense transcript to a novel gene currently only identified by a GIS-PET. Panel (C) shows results for prediction 2.15, a region on Chr.9 identified by three methods. Here three clusters are seen. The cluster in the middle arises from an exon of C9orf54. The cluster on the right is likely to be a 3’-UTR antisense transcript to the last exon of C9orf54. The cluster on the left is likely another antisense transcript to an internal exon of C9orf54. Figure 5. Classification of validated promoters with respect to the nearest GENCODE-annotated gene. Exons are indicated by boxes and arrows indicate the 5’ to 3’ direction. A. 1. Known: the promoter appears within 1kb upstream of the first exon of any variant of the gene and the transcribed strand is the same as the gene. In case of RACE, the sequence, if spliced, should match the gene splice sites. 2. Pseudogene: like known, but the gene is a pseudogene. 3. 5'-exon antisense: the promoter is within 1kb of the first exon of some variant of the gene and the transcription is antisense to the gene. The transcripts if not present or if short, should at least have a reasonable potential to overlap the exon. 4. 3'-exon antisense: like 5'-exon antisense but for the last exon of some variant. 5. Internal exon antisense: like 5'-exon antisense but for an internal exon. 6. Intron embedded (sense): the promoter overlaps the gene span and transcription is on the same strand as the gene but the transcripts do not appear to interact with any exons from any variant. 7. Intron embedded (antisense): like 5 but for antisense direction. 8. New TSS or variant: transcription is on the same strand as the gene and the transcribed product overlaps one or more exons of some variant but does not share the same splice sites. 9. Immediate downstream: the promoter is within 2kb downstream of the last exon and transcription is on the same strand, but the transcripts do not overlap any exons of any variant of the gene. 10. Immediate upstream: the promoter is within 2kb upstream of the first exon and transcription is on the opposite strand and the transcripts can not overlap with the first exon of any variant. 11. Intergenic: more than 2kb away from any annotated transcript. B. The 41 regions validated by transient transfection assays. The total number of cases is 48, as some classes (notably intron embedded) can be interpreted as other classes (e.g. new TSS or antisense). C. The 49 regions validated by 5’-RACE. The total number of cases is 59. Supplementary Table 1. Full list of predicted regions and experimental results for all the regions tested by transfection assay and 5’-RACE. Supplementary Table 2. Weights used in the Voting method. Supplementary Figure 1. Box plots showing the length distributions of the predicted regions in six categories (defined in Methods). Mean length is show by a left-pointing arrow and 95% confidence intervals are indicated by gray areas. Upper and lower edges of the boxes correspond to upper and lower quartiles. Outliers (data points outside upper

22
or lower adjacent value) are shown in red squares. Supplementary Figure 2. Example gel photos of 5’-RACE PCR products.
23
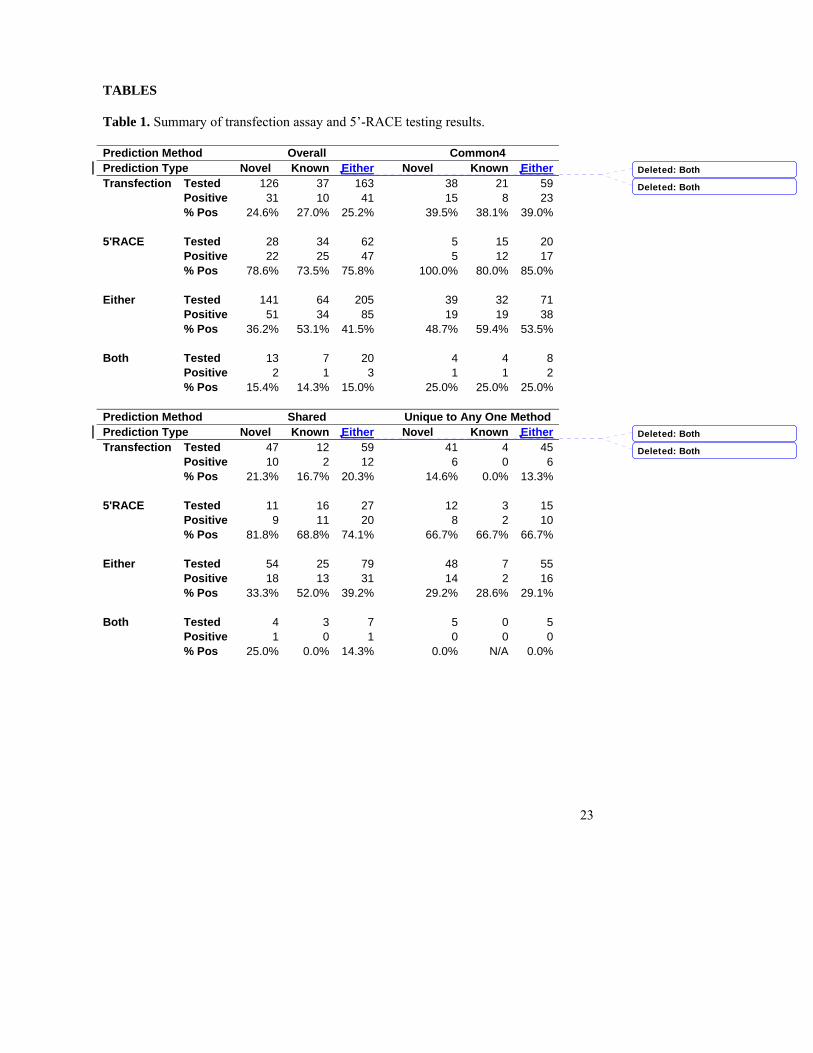
TABLES Table 1. Summary of transfection assay and 5’-RACE testing results. Prediction Method Overall Common4 Prediction Type Novel Known Either Novel Known EitherTransfection Tested 126 37 163 38 21 59 Positive 31 10 41 15 8 23 % Pos 24.6% 27.0% 25.2% 39.5% 38.1% 39.0% 5'RACE Tested 28 34 62 5 15 20 Positive 22 25 47 5 12 17 % Pos 78.6% 73.5% 75.8% 100.0% 80.0% 85.0% Either Tested 141 64 205 39 32 71 Positive 51 34 85 19 19 38 % Pos 36.2% 53.1% 41.5% 48.7% 59.4% 53.5% Both Tested 13 7 20 4 4 8 Positive 2 1 3 1 1 2 % Pos 15.4% 14.3% 15.0% 25.0% 25.0% 25.0% Prediction Method Shared Unique to Any One Method Prediction Type Novel Known Either Novel Known EitherTransfection Tested 47 12 59 41 4 45 Positive 10 2 12 6 0 6 % Pos 21.3% 16.7% 20.3% 14.6% 0.0% 13.3% 5'RACE Tested 11 16 27 12 3 15 Positive 9 11 20 8 2 10 % Pos 81.8% 68.8% 74.1% 66.7% 66.7% 66.7% Either Tested 54 25 79 48 7 55 Positive 18 13 31 14 2 16 % Pos 33.3% 52.0% 39.2% 29.2% 28.6% 29.1% Both Tested 4 3 7 5 0 5 Positive 1 0 1 0 0 0 % Pos 25.0% 0.0% 14.3% 0.0% N/A 0.0%
Deleted: Both
Deleted: Both
Deleted: Both
Deleted: Both

24
REFERENCES Balakirev, E.S. and F.J. Ayala. 2003. Pseudogenes: are they "junk" or functional DNA?
Annu Rev Genet 37: 123-151. Bertone, P., V. Stolc, T.E. Royce, J.S. Rozowsky, A.E. Urban, X. Zhu, J.L. Rinn, W.
Tongprasit, M. Samanta, S. Weissman, M. Gerstein, and M. Snyder. 2004. Global identification of human transcribed sequences with genome tiling arrays. Science 306: 2242-2246.
Cooper, S.J., N.D. Trinklein, E.D. Anton, L. Nguyen, and R.M. Myers. 2006. Comprehensive analysis of transcriptional promoter structure and function in 1% of the human genome. Genome Res 16: 1-10.
Gerstein, M., E.L. Sonnhammer, and C. Chothia. 1994. Volume changes in protein evolution. J Mol Biol 236: 1067-1078.
Giardine, B., C. Riemer, R.C. Hardison, R. Burhans, L. Elnitski, P. Shah, Y. Zhang, D. Blankenberg, I. Albert, J. Taylor, W. Miller, W.J. Kent, and A. Nekrutenko. 2005. Galaxy: a platform for interactive large-scale genome analysis. Genome Res 15: 1451-1455.
Karolchik, D., R. Baertsch, M. Diekhans, T.S. Furey, A. Hinrichs, Y.T. Lu, K.M. Roskin, M. Schwartz, C.W. Sugnet, D.J. Thomas, R.J. Weber, D. Haussler, and W.J. Kent. 2003. The UCSC Genome Browser Database. Nucleic Acids Res 31: 51-54.
Kim, T.H. and B. Ren. 2006. Genome-Wide Analysis of Protein-DNA Interactions. Annu Rev Genomics Hum Genet.
Lee, C.K., Y. Shibata, B. Rao, B.D. Strahl, and J.D. Lieb. 2004. Evidence for nucleosome depletion at active regulatory regions genome-wide. Nat Genet 36: 900-905.
Ng, P., C.L. Wei, W.K. Sung, K.P. Chiu, L. Lipovich, C.C. Ang, S. Gupta, A. Shahab, A. Ridwan, C.H. Wong, E.T. Liu, and Y. Ruan. 2005. Gene identification signature (GIS) analysis for transcriptome characterization and genome annotation. Nat Methods 2: 105-111.
Shiraki, T., S. Kondo, S. Katayama, K. Waki, T. Kasukawa, H. Kawaji, R. Kodzius, A. Watahiki, M. Nakamura, T. Arakawa, S. Fukuda, D. Sasaki, A. Podhajska, M. Harbers, J. Kawai, P. Carninci, and Y. Hayashizaki. 2003. Cap analysis gene expression for high-throughput analysis of transcriptional starting point and identification of promoter usage. Proc Natl Acad Sci U S A 100: 15776-15781.
The ENCODE Project Consortium. 2004. The ENCODE (ENCyclopedia Of DNA Elements) Project. Science 306: 636-640.
Trinklein, N.D., S.J. Aldred, A.J. Saldanha, and R.M. Myers. 2003. Identification and functional analysis of human transcriptional promoters. Genome Res 13: 308-312.
Wingender, E., X. Chen, R. Hehl, H. Karas, I. Liebich, V. Matys, T. Meinhardt, M. Pruss, I. Reuter, and F. Schacherer. 2000. TRANSFAC: an integrated system for gene expression regulation. Nucleic Acids Res 28: 316-319.
Zheng, D., Z. Zhang, P.M. Harrison, J. Karro, N. Carriero, and M. Gerstein. 2005. Integrated pseudogene annotation for human chromosome 22: evidence for transcription. J Mol Biol 349: 27-45.
Formatted: Font: Bold
18
LEGENDS Figure 1. Summary of predicted regions and experimental validation by transient transfection assays and 5'-RACE experiments. Numbers in parentheses indicate the number of validated and tested but un-validated regions in each category. A region is considered tested if it was tested by either transient transfection assays or 5’-RACE experiments; the validated status is similarly defined. Common4 are regions common to all four methods. Shared are regions predicted by two or three methods. NB, Z, V and TW indicate regions uniquely predicted by Naïve Bayes, Z-score, Voting, and Tree-Weighting methods respectively. Each class is represented by two pieces of the pie, with the darker colored one indicating novel regions and the lighter colored one indicating known regions. Note that due to the substantially different validation rates of the two experimental approaches and the uneven selection of method-unique regions, there is not sufficient data to directly compare the performances of the methods. Figure 2. The significance of the overlap of predicted regions in different categories with various genomic features. See Methods for their definitions and origins, as well as details on randomization. The significance is given in terms of the number of standard deviations away from the mean number of overlaps between a set of predicted regions and a set of randomly placed, size-matched regions corresponding to the genomic features. (A) Regions unique to the Naïve Bayes method. (B) Regions unique to the Tree Weighting method. (C) Regions unique to the Voting method. (D) Regions unique to the Z-score method. (E) Regions shared by two or three methods (Shared). (F) Regions supported by all the methods (Common4). Figure 3. Distance of predicted regions from annotated transcripts. Black bars: the number of regions at various distances from 5’-ends (A) and 3’-ends (B) for all predicted regions. White bars: the number of regions expected by a randomization process as used in Figure 2. Figure 4. Antisense examples of RACE products. Each of the three panels shows a UCSC genome browser graph. The Predicted Promoters track show the regions predicted by any of the four methods. The Designed Primers track shows the nested primer pairs used to perform the 5’-RACE experiments. For 5'-RACE, the transcripts are oriented opposite to the primers and end at the nested primer. The Mapped RACE products track shows the validated results of sequencing the RACE products. Only the properly oriented RACE products are considered fully valid and the TSSs should be at their 5’-ends (see Methods for more details). Other standard tracks from the May 2004 (hg17) assembly are shown to give the context of the promoter. Note the empty pseudogene tracks indicating that the identified transcripts are unlikely to be pseudogenes, and the histone modifications tracks which constitute a large fraction of the experiments used to make the predictions. Panel (A) shows results for prediction 1.14, a region on Chr.5 identified by all four methods. Two clusters of transcripts were found. The cluster on the left is likely to be antisense to the second exon of AC116366.4 and is different from the putative AC116366.5. The cluster on the right could be a distinct transcript or connected to the
19
cluster on the left. Interestingly, the antisense-targeted exon contains the translation start site of the gene only in some variants. Panel (B) shows results for prediction 1.4, a region on Chr.11 also identified by all four methods. Two clusters were found. The cluster on the right appears to be a 3'-UTR antisense transcript to GENCODE putative AC051649.7. The cluster on the left appears to be a 5'-UTR antisense transcript to a novel gene currently only identified by a GIS-PET. Panel (C) shows results for prediction 2.15, a region on Chr.9 identified by three methods. Here three clusters are seen. The cluster in the middle arises from an exon of C9orf54. The cluster on the right is likely to be a 3’-UTR antisense transcript to the last exon of C9orf54. The cluster on the left is likely another antisense transcript to an internal exon of C9orf54. Figure 5. Classification of validated promoters with respect to the nearest GENCODE-annotated gene. Exons are indicated by boxes and arrows indicate the 5’ to 3’ direction. A. 1. Known: the promoter appears within 1kb upstream of the first exon of any variant of the gene and the transcribed strand is the same as the gene. In case of RACE, the sequence, if spliced, should match the gene splice sites. 2. Pseudogene: like known, but the gene is a pseudogene. 3. 5'-exon antisense: the promoter is within 1kb of the first exon of some variant of the gene and the transcription is antisense to the gene. The transcripts if not present or if short, should at least have a reasonable potential to overlap the exon. 4. 3'-exon antisense: like 5'-exon antisense but for the last exon of some variant. 5. Internal exon antisense: like 5'-exon antisense but for an internal exon. 6. Intron embedded (sense): the promoter overlaps the gene span and transcription is on the same strand as the gene but the transcripts do not appear to interact with any exons from any variant. 7. Intron embedded (antisense): like 5 but for antisense direction. 8. New TSS or variant: transcription is on the same strand as the gene and the transcribed product overlaps one or more exons of some variant but does not share the same splice sites. 9. Immediate downstream: the promoter is within 2kb downstream of the last exon and transcription is on the same strand, but the transcripts do not overlap any exons of any variant of the gene. 10. Immediate upstream: the promoter is within 2kb upstream of the first exon and transcription is on the opposite strand and the transcripts can not overlap with the first exon of any variant. 11. Intergenic: more than 2kb away from any annotated transcript. B. The 41 regions validated by transient transfection assays. The total number of cases is 48, as some classes (notably intron embedded) can be interpreted as other classes (e.g. new TSS or antisense). C. The 49 regions validated by 5’-RACE. The total number of cases is 59. Supplementary Table 1. Full list of predicted regions and experimental results for all the regions tested by transfection assay and 5’-RACE. Supplementary Table 2. Weights used in the Voting method. Supplementary Figure 1. Box plots showing the length distributions of the predicted regions in six categories (defined in Methods). Mean length is show by a left-pointing arrow and 95% confidence intervals are indicated by gray areas. Upper and lower edges of the boxes correspond to upper and lower quartiles. Outliers (data points outside upper

20
or lower adjacent value) are shown in red squares. Supplementary Figure 2. Example gel photos of 5’-RACE PCR products.

21
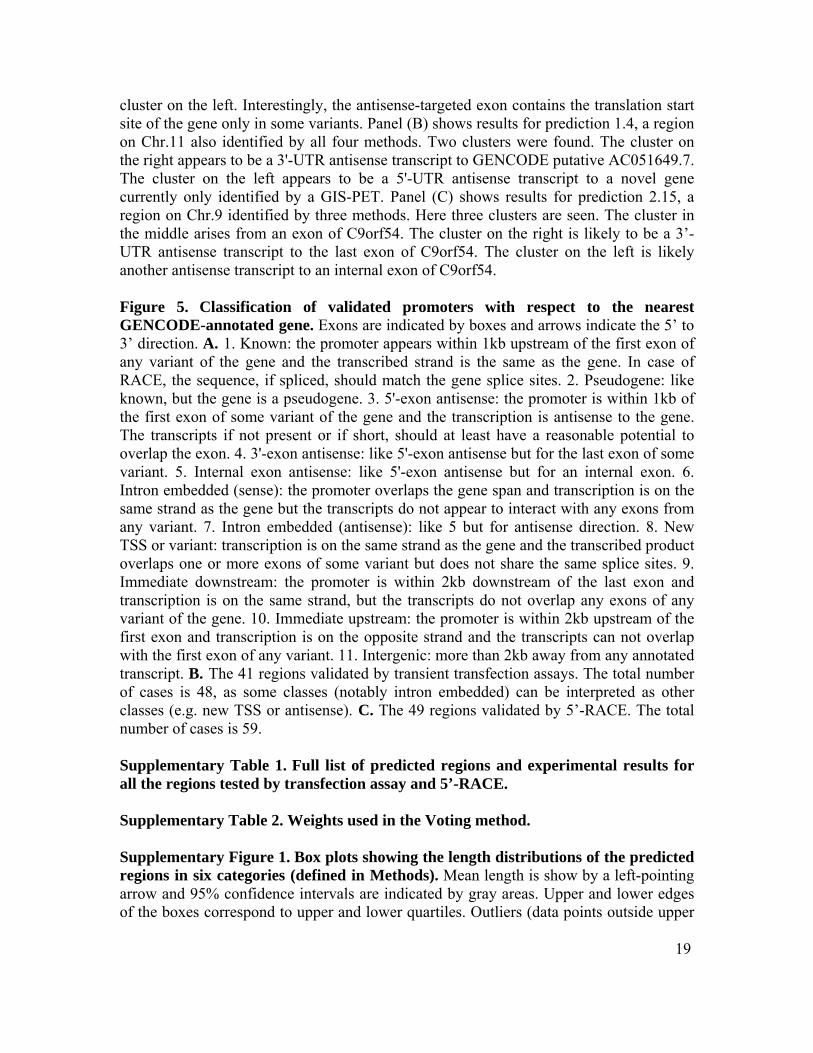
TABLES Table 1. Summary of transfection assay and 5’-RACE testing results. Prediction Method Overall Common4 Prediction Type Novel Known Both Novel Known Both Transfection Tested 126 37 163 38 21 59 Positive 31 10 41 15 8 23 % Pos 24.6% 27.0% 25.2% 39.5% 38.1% 39.0% 5'RACE Tested 28 34 62 5 15 20 Positive 22 25 47 5 12 17 % Pos 78.6% 73.5% 75.8% 100.0% 80.0% 85.0% Either Tested 141 64 205 39 32 71 Positive 51 34 85 19 19 38 % Pos 36.2% 53.1% 41.5% 48.7% 59.4% 53.5% Both Tested 13 7 20 4 4 8 Positive 2 1 3 1 1 2 % Pos 15.4% 14.3% 15.0% 25.0% 25.0% 25.0% Prediction Method Shared Unique to Any One Method Prediction Type Novel Known Both Novel Known Both Transfection Tested 47 12 59 41 4 45 Positive 10 2 12 6 0 6 % Pos 21.3% 16.7% 20.3% 14.6% 0.0% 13.3% 5'RACE Tested 11 16 27 12 3 15 Positive 9 11 20 8 2 10 % Pos 81.8% 68.8% 74.1% 66.7% 66.7% 66.7% Either Tested 54 25 79 48 7 55 Positive 18 13 31 14 2 16 % Pos 33.3% 52.0% 39.2% 29.2% 28.6% 29.1% Both Tested 4 3 7 5 0 5 Positive 1 0 1 0 0 0 % Pos 25.0% 0.0% 14.3% 0.0% N/A 0.0%

22
References Balakirev, E.S. and F.J. Ayala. 2003. Pseudogenes: are they "junk" or functional DNA?
Annu Rev Genet 37: 123-151. Bertone, P., V. Stolc, T.E. Royce, J.S. Rozowsky, A.E. Urban, X. Zhu, J.L. Rinn, W.
Tongprasit, M. Samanta, S. Weissman, M. Gerstein, and M. Snyder. 2004. Global identification of human transcribed sequences with genome tiling arrays. Science 306: 2242-2246.
Cooper, S.J., N.D. Trinklein, E.D. Anton, L. Nguyen, and R.M. Myers. 2006. Comprehensive analysis of transcriptional promoter structure and function in 1% of the human genome. Genome Res 16: 1-10.
Gerstein, M., E.L. Sonnhammer, and C. Chothia. 1994. Volume changes in protein evolution. J Mol Biol 236: 1067-1078.
Giardine, B., C. Riemer, R.C. Hardison, R. Burhans, L. Elnitski, P. Shah, Y. Zhang, D. Blankenberg, I. Albert, J. Taylor, W. Miller, W.J. Kent, and A. Nekrutenko. 2005. Galaxy: a platform for interactive large-scale genome analysis. Genome Res 15: 1451-1455.
Karolchik, D., R. Baertsch, M. Diekhans, T.S. Furey, A. Hinrichs, Y.T. Lu, K.M. Roskin, M. Schwartz, C.W. Sugnet, D.J. Thomas, R.J. Weber, D. Haussler, and W.J. Kent. 2003. The UCSC Genome Browser Database. Nucleic Acids Res 31: 51-54.
Kim, T.H. and B. Ren. 2006. Genome-Wide Analysis of Protein-DNA Interactions. Annu Rev Genomics Hum Genet.
Lee, C.K., Y. Shibata, B. Rao, B.D. Strahl, and J.D. Lieb. 2004. Evidence for nucleosome depletion at active regulatory regions genome-wide. Nat Genet 36: 900-905.
Ng, P., C.L. Wei, W.K. Sung, K.P. Chiu, L. Lipovich, C.C. Ang, S. Gupta, A. Shahab, A. Ridwan, C.H. Wong, E.T. Liu, and Y. Ruan. 2005. Gene identification signature (GIS) analysis for transcriptome characterization and genome annotation. Nat Methods 2: 105-111.
Shiraki, T., S. Kondo, S. Katayama, K. Waki, T. Kasukawa, H. Kawaji, R. Kodzius, A. Watahiki, M. Nakamura, T. Arakawa, S. Fukuda, D. Sasaki, A. Podhajska, M. Harbers, J. Kawai, P. Carninci, and Y. Hayashizaki. 2003. Cap analysis gene expression for high-throughput analysis of transcriptional starting point and identification of promoter usage. Proc Natl Acad Sci U S A 100: 15776-15781.
The ENCODE Project Consortium. 2004. The ENCODE (ENCyclopedia Of DNA Elements) Project. Science 306: 636-640.
Trinklein, N.D., S.J. Aldred, A.J. Saldanha, and R.M. Myers. 2003. Identification and functional analysis of human transcriptional promoters. Genome Res 13: 308-312.
Wingender, E., X. Chen, R. Hehl, H. Karas, I. Liebich, V. Matys, T. Meinhardt, M. Pruss, I. Reuter, and F. Schacherer. 2000. TRANSFAC: an integrated system for gene expression regulation. Nucleic Acids Res 28: 316-319.
Zheng, D., Z. Zhang, P.M. Harrison, J. Karro, N. Carriero, and M. Gerstein. 2005. Integrated pseudogene annotation for human chromosome 22: evidence for transcription. J Mol Biol 349: 27-45.
Common4 340 (39; 33)
Shared 395(32;47)
NB 195 (3;25)
TW 38 (7;3)
V 276 (2;0)
Z 149 (5;11)
Trinklein et al. F ig. 1
Inte
rgen
ic P
roxi
mal
Inte
rgen
ic D
ista
l
Intr
onic
Pro
xim
al
Intr
onic
Dis
tal
DH
S
FA
IRE
TA
Rs/
Tra
nsf
rags
F . C ommon4
-10
0
10
20
30
40
Sta
nd
ard
dev
iati
on f
rom
mea
n o
f ra
nd
om
E . Shar ed
-10
0
10
20
30
40
D. Unique to Z -scor e
Sta
nd
ard
dev
iati
on f
rom
mea
n o
f ra
nd
om
-10
0
10
20
30
40
Sta
nd
ard
dev
iati
on f
rom
mea
n o
f ra
nd
om
C . Unique to V oting
-10
0
10
20
30
40
A . Unique to Naive B ayesS
tan
dar
d d
evia
tion
fro
m m
ean
of
ran
dom
-10
0
10
20
30
40
Sta
nd
ard
dev
iati
on f
rom
mea
n o
f ra
nd
om
B . Unique to T r ee-W eigthing
Trinklein et al. F ig. 2
GT
-TS
S(+
/-2k
b)
5' U
TR
3' U
TR
Pse
ud
ogen
es
Rac
efra
gs
EC
S
Sta
nd
ard
dev
iati
on f
rom
mea
n o
f ra
nd
om
-10
0
10
20
30
40
Nu
mb
er o
f p
red
icte
d r
egio
ns
0
100
200
300
400
500
600
0- 2kb 2kb- 4kb 4kb- 6kb 6kb- 8kb 8kb- 10kb10kb- 20kb >20kb
A. Distance from the nearest annotated 5' end
0
100
200
300
400
500
600
700
0- 2kb 2kb- 4kb 4kb- 6kb 6kb- 8kb 8kb- 10kb10kb- 20kb >20kb
B. Distance from the nearest annotated 3' end
Nu
mb
er o
f p
red
icte
d r
egio
ns
Trinklein et al. F ig. 3
chr5:
RepeatMasker
131783000 131783500 131784000 131784500 131785000 131785500Predicted Promoters
Designed Primers
Mapped RACE products
UCSC Known Genes (June, 05) Based on UniProt, RefSeq, and GenBank mRNA
Repeating Elements by RepeatMasker
Encyclopedia of DNA Elements (ENCODE) Regions
Gencode Reference Genes
Gencode Putative Genes
Gencode PseudogenesConsensus of Yale, Havana-Gencode, UCSC and GIS ENCODE Pseudogenes
Havana-Gencode Annotated Pseudogenes and Immunoglobulin SegmentsYale Pseudogene PredictionsUCSC Retrogene Predictions
UCSC Pseudogene PredictionsGenome Institute of Singapore (GIS) Pseudogenes
Known and Predicted RNA Transcription in the ENCODE RegionsEvoFold Predictions of RNA Secondary Structure Using TBA23
Sanger ChIP/Chip (histones H3,H4 ab in GM06990, K562, HeLa, and HFL-1 cells)
1.14
LOC441108
ENm002
AC116366.4AC116366.4AC116366.4AC116366.4AC116366.4
AC116366.5
SI H3K4m1 GM6990SI H3K4m2 GM6990SI H3K4m3 GM6990
SI H3ac GM06990SI H4ac GM06990SI H3K4me2 K562SI H3K4me3 K562
SI H3ac K562SI H4ac K562
SI H3K4me1 HeLaSI H3K4me2 HeLaSI H3K4me3 HeLa
SI H3ac HeLaSI H4ac HeLa

chr11:
RepeatMasker
1958500 1959000 1959500 1960000 1960500 1961000 1961500 1962000 1962500 1963000 1963500Predicted Promoters
Designed Primers
Mapped RACE products
UCSC Known Genes (June, 05) Based on UniProt, RefSeq, and GenBank mRNARepeating Elements by RepeatMasker
Encyclopedia of DNA Elements (ENCODE) Regions
Gencode Reference GenesGencode Putative Genes
Gencode PseudogenesConsensus of Yale, Havana-Gencode, UCSC and GIS ENCODE Pseudogenes
Havana-Gencode Annotated Pseudogenes and Immunoglobulin SegmentsYale Pseudogene PredictionsUCSC Retrogene Predictions
UCSC Pseudogene PredictionsGenome Institute of Singapore (GIS) Pseudogenes
Genome Institute of Singapore PET of PolyA+ RNA (log phase MCF7)Genome Institute of Singapore PET of PolyA+ RNA (estrogen-stim MCF7)
Genome Institute of Singapore PET of PolyA+ RNA (5FU-stim HCT116)Known and Predicted RNA Transcription in the ENCODE Regions
EvoFold Predictions of RNA Secondary Structure Using TBA23Sanger ChIP/Chip (histones H3,H4 ab in GM06990, K562, HeLa, and HFL-1 cells)
1.4
ENm011
AC051649.7
216144-1-1216143-1-197809-1-1
184616-1-1263331-1-189714-1-190091-1-1
224803-1-1
SI H3K4m1 GM6990SI H3K4m2 GM6990SI H3K4m3 GM6990
SI H3ac GM06990SI H4ac GM06990SI H3K4me2 K562SI H3K4me3 K562
SI H3ac K562SI H4ac K562
SI H3K4me1 HeLaSI H3K4me2 HeLaSI H3K4me3 HeLa
SI H3ac HeLaSI H4ac HeLa

chr9:
RepeatMasker
128910000 128910500 128911000 128911500 128912000 128912500Predicted Promoters
Designed Primers
Mapped RACE products
UCSC Known Genes (June, 05) Based on UniProt, RefSeq, and GenBank mRNA
Repeating Elements by RepeatMasker
Encyclopedia of DNA Elements (ENCODE) Regions
Gencode Reference Genes
Gencode Putative GenesGencode Pseudogenes
Consensus of Yale, Havana-Gencode, UCSC and GIS ENCODE PseudogenesHavana-Gencode Annotated Pseudogenes and Immunoglobulin Segments
Yale Pseudogene PredictionsUCSC Retrogene Predictions
UCSC Pseudogene PredictionsGenome Institute of Singapore (GIS) Pseudogenes
Known and Predicted RNA Transcription in the ENCODE RegionsEvoFold Predictions of RNA Secondary Structure Using TBA23
Sanger ChIP/Chip (histones H3,H4 ab in GM06990, K562, HeLa, and HFL-1 cells)
2.15
AK075421C9orf54
BC009114AK054974
ENr232
C9orf54C9orf54C9orf54C9orf54 C9orf54
C9orf54
SI H3K4m1 GM6990SI H3K4m2 GM6990SI H3K4m3 GM6990
SI H3ac GM06990SI H4ac GM06990SI H3K4me2 K562SI H3K4me3 K562
SI H3ac K562SI H4ac K562
SI H3K4me1 HeLaSI H3K4me2 HeLaSI H3K4me3 HeLa
SI H3ac HeLaSI H4ac HeLa
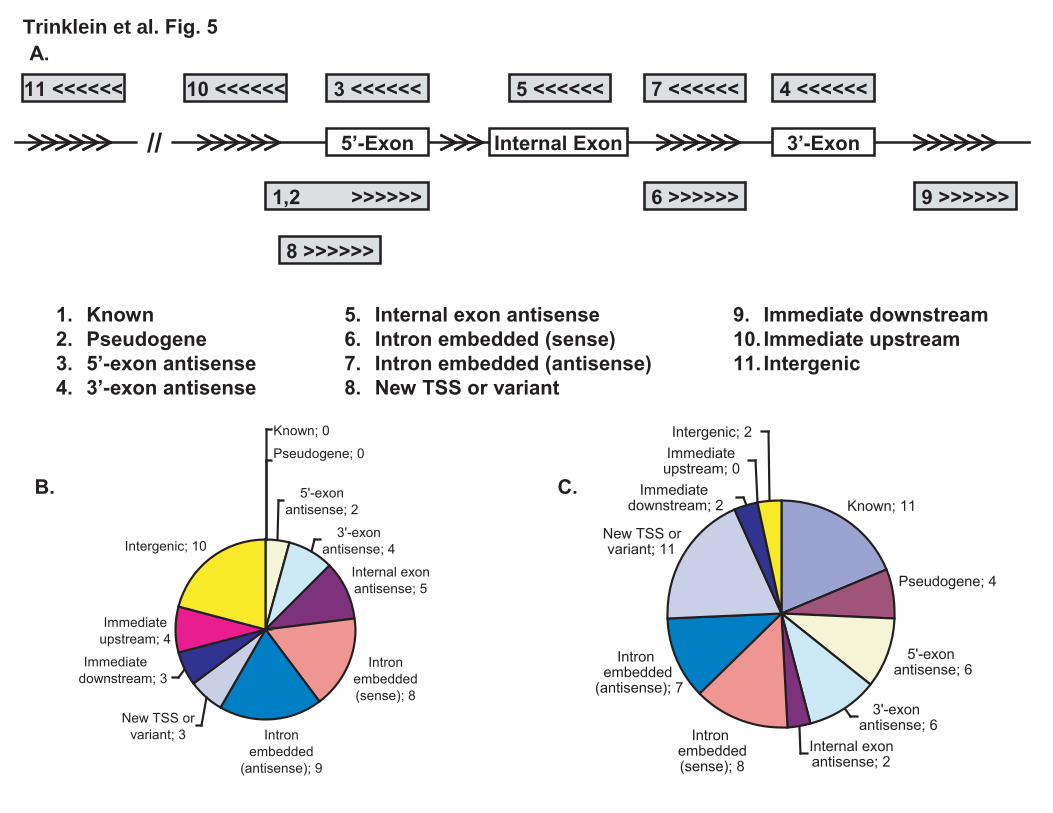
5’-Exon 3’-ExonInternal Exon
3 <<<<<<
1,2 >>>>>>
4 <<<<<<5 <<<<<< 7 <<<<<<
6 >>>>>>
8 >>>>>>
9 >>>>>>
10 <<<<<<11 <<<<<<
//
1. Known2. Pseudogene3. 5’-exon antisense4. 3’-exon antisense
5. Internal exon antisense6. Intron embedded (sense)7. Intron embedded (antisense)8. New TSS or variant
9. Immediate downstream10. Immediate upstream11. Intergenic
A.
B. C.
Trinklein et al. Fig. 5
Known; 0
Pseudogene; 0
5'-exon antisense; 2
3'-exon antisense; 4
Internal exon antisense; 5
Intron embedded (sense); 8
Intron embedded
(antisense); 9
New TSS or variant; 3
Immediate downstream; 3
Immediate upstream; 4
Intergenic; 10
Known; 11
Pseudogene; 4
5'-exon antisense; 6
3'-exon antisense; 6
Internal exon antisense; 2
Intron embedded (sense); 8
Intron embedded
(antisense); 7
New TSS or variant; 11
Immediate downstream; 2
Immediate upstream; 0
Intergenic; 2
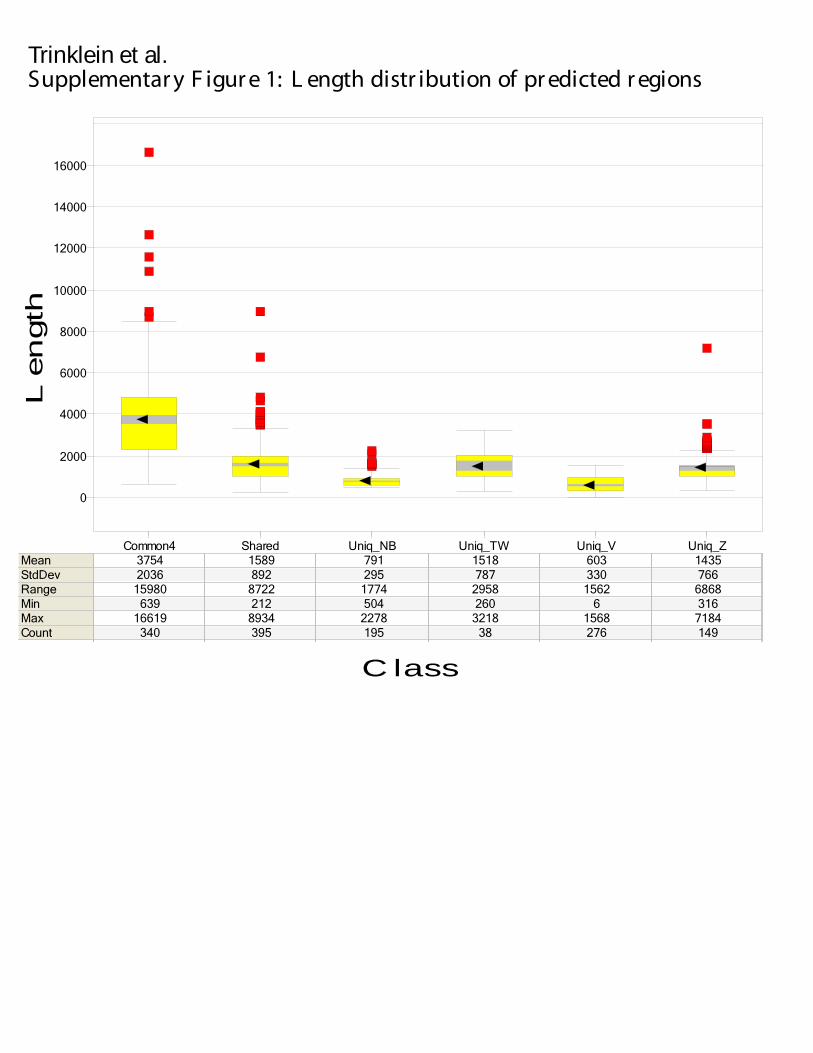
Trinklein et al.Supplementar y F igur e 1: L ength distr ibution of pr edicted r egions
0
2000
4000
6000
8000
10000
12000
14000
16000
Common4 Shared Uniq_NB Uniq_TW Uniq_V Uniq_ZMeanStdDevRangeMinMaxCount
3754 1589 791 1518 603 14352036 892 295 787 330 766
15980 8722 1774 2958 1562 6868639 212 504 260 6 316
16619 8934 2278 3218 1568 7184340 395 195 38 276 149
Len
gth
C lass
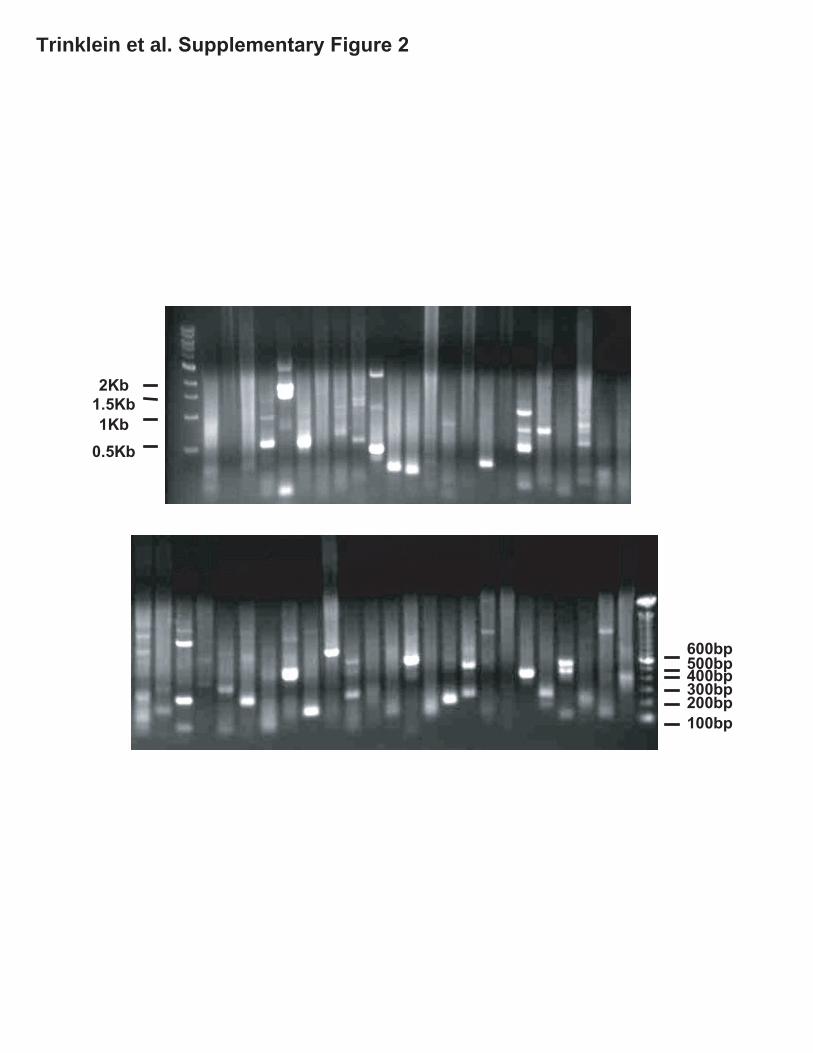
0.5Kb1Kb
1.5Kb2Kb
100bp200bp300bp500bp400bp600bp
Trinklein et al. Supplementary Figure 2