integrated analysis of metabolite and transcript …...integrated analysis of metabolite and...
TRANSCRIPT

Integrated Analysis of Metabolite and Transcript LevelsReveals the Metabolic Shifts That Underlie Tomato FruitDevelopment and Highlight Regulatory Aspectsof Metabolic Network Behavior1[W]
Fernando Carrari, Charles Baxter, Bjorn Usadel, Ewa Urbanczyk-Wochniak, Maria-Ines Zanor,Adriano Nunes-Nesi, Victoria Nikiforova, Danilo Centero, Antje Ratzka, Markus Pauly, Lee J. Sweetlove,and Alisdair R. Fernie*
Max-Planck-Institut fur Molekulare Pflanzenphysiologie, 14476 Golm-Postdam, Germany (F.C., B.U., E.U.-W.,M.-I.Z., A.N.-N., V.N., D.C., A.R., M.P., A.R.F.); Instituto de Biotecnologıa, CICVyA, Instituto Nacional deTecnologıa Agrıcola Argentina, Buenos Aires, Argentina (F.C.); and Department of Plant Sciences, Universityof Oxford, Oxford OX1 3RB, United Kingdom (C.B., L.J.S.)
Tomato (Solanum lycopersicum) is a well-studied model of fleshy fruit development and ripening. Tomato fruit development iswell understood from a hormonal-regulatory perspective, and developmental changes in pigment and cell wall metabolism arealso well characterized. However, more general aspects of metabolic change during fruit development have not been studieddespite the importance of metabolism in the context of final composition of the ripe fruit. In this study, we quantified theabundance of a broad range of metabolites by gas chromatography-mass spectrometry, analyzed a number of the principalmetabolic fluxes, and in parallel analyzed transcriptomic changes during tomato fruit development. Metabolic profiling revealedpronounced shifts in the abundance of metabolites of both primary and secondary metabolism during development. Themetabolite changes were reflected in the flux analysis that revealed a general decrease in metabolic activity during ripening.However, there were several distinct patterns of metabolite profile, and statistical analysis demonstrated that metabolites in thesame (or closely related) pathways changed in abundance in a coordinated manner, indicating a tight regulation of metabolicactivity. The metabolite data alone allowed investigations of likely routes through the metabolic network, and, as an example, weanalyze the operational feasibility of different pathways of ascorbate synthesis. When combined with the transcriptomic data,several aspects of the regulation of metabolism during fruit ripening were revealed. First, it was apparent that transcriptabundance was less strictly coordinated by functional group than metabolite abundance, suggesting that posttranslationalmechanisms dominate metabolic regulation. Nevertheless, there were some correlations between specific transcripts andmetabolites, and several novel associations were identified that could provide potential targets for manipulation of fruitcompositional traits. Finally, there was a strong relationship between ripening-associated transcripts and specific metabolitegroups, such as TCA-cycle organic acids and sugar phosphates, underlining the importance of the respective metabolic pathwaysduring fruit development.
Fruits are not only colorful and flavorsome compo-nents of human and animal diets, but they also are animportant source of minerals, vitamins, fibers, andantioxidants in food and animal feed. For this reason, afuller comprehension of the biosynthetic pathways for
the production of these nutrients is of applied as wellas fundamental importance (Carrari and Fernie, 2006).While plant model systems such as Arabidopsis (Arabi-dopsis thaliana) may be a suitable starting point in thesearch for key regulatory mechanisms acting in fruitdevelopment and ripening (Liljegren et al., 2004), it mustbe borne in mind that the term ‘‘fruit’’ encompassesan enormous range of morphologies and anatomies.Thus, although fundamental developmental processesmay be shared among species, this cannot be blithelyassumed since there are also dramatic developmentaldifferences, even between species of the same family(Fernie and Willmitzer, 2001). This is one major reasonwhy considerable effort is being put into genomic andpostgenomic study of species other than Arabidopsis(Goff et al., 2002; Carrari et al., 2004; Desbrosses et al.,2005; Mueller et al., 2005). One example of this is theuse of tomato (Solanum lycopersicum) as a model sys-tem for plants bearing fleshy fruits. Several features ofthe fruit make it a highly interesting system to study,
1 This work was supported by the Max Planck Society (in the formof a Max-Planck partner laboratory grant to F.C. and A.R.F.) and twoindependent grants in the BMBF GABI Program (to B.U. and toA.R.F. and M.-I.Z.), as well as by the Biotechnology and BiologicalSciences Research Council (to C.B. and L.J.S.), CONICET, INTA, andEMBO (to F.C.).
* Corresponding author; e-mail [email protected]; fax49–331–5678408.
The author responsible for distribution of materials integral to thefindings presented in this article in accordance with the policydescribed in the Instruction for Authors (www.plantphysiol.org) is:Alisdair R. Fernie ([email protected]).
[W] The online version of this article contains Web-only data.www.plantphysiol.org/cgi/doi/10.1104/pp.106.088534
1380 Plant Physiology, December 2006, Vol. 142, pp. 1380–1396, www.plantphysiol.org � 2006 American Society of Plant Biologists www.plantphysiol.orgon May 5, 2020 - Published by Downloaded from
Copyright © 2006 American Society of Plant Biologists. All rights reserved.

by and large all of them being linked to the dramaticmetabolic changes that occur during development.The most obvious of these changes is the transitionfrom partially photosynthetic to fully heterotrophicmetabolism that occurs coincidentally with the differ-entiation of chloroplasts into chromoplasts (Bartleyet al., 1994), marked shifts in cell wall composition(Rose et al., 2004; Scheible and Pauly, 2004), and thestrict hormonal control of climacteric ripening (Albaet al., 2005; Barry et al., 2005). However, despite theclear importance of metabolism in the developmentalprocess, a comprehensive analysis of metabolic eventsalong the developmental period has yet to be presen-ted, with studies to date being limited either in thescope of metabolites measured or with respect to thenumber of different developmental stages analyzed, orboth (Boggio et al., 2000; Chen et al., 2001; Roessner-Tunali et al., 2003).
Given the recent development of an extensive arrayof tools to characterize the various molecular entitiesof the cell (Alba et al., 2004; Fei et al., 2004; Fernie et al.,2004; Rose et al., 2004), it is now possible to access vastdata sets at the level of transcript abundance (Albaet al., 2004), protein abundance (Rose et al., 2004), meta-bolite accumulation (Roessner-Tunali et al., 2003; Fernieet al., 2004) and metabolic flux analysis (Roessner-Tunali et al., 2004; Ratcliffe and Shachar-Hill, 2006).Integration of genomics data sets resulting fromthe application of such diverse technology platformsis currently being attempted in plants (Urbanczyk-Wochniak et al., 2003; Rohde et al., 2004; Fernie andSweetlove, 2005; Tohge et al., 2005; Tieman et al., 2006).As a first step in this direction, a recent study thatperformed transcript profiling across tomato fruitdevelopment was combined with selected metaboliteanalysis (carotenoids, ethylene, and ascorbate), toclassify points of regulatory control of developmentthat were dependent on ethylene (Alba et al., 2005).
In this study, we take a similar approach but on abroader scale, measuring a total of 92 metabolites com-prising sugars, sugar alcohols, organic acids, aminoacids, vitamins, and a select few secondary metabo-lites in addition to pigments and the monosaccharidecomposition of the cell wall, in parallel to transcriptlevels. We evaluated temporal changes in these pa-rameters utilizing the recently developed SolanaceousMapMan (Urbanczyk-Wochniak et al., 2006). Thesedata form a relatively comprehensive picture of changesin gene expression and chemical composition of pri-mary metabolism during fruit development and fur-thermore give important insight into metabolic andtranscriptional programs underlying this process.
RESULTS
Experimental Design
The two experiments described here were designedto cover the developmental transition of fruit ripeningprocesses in tomato. Under our greenhouse condi-
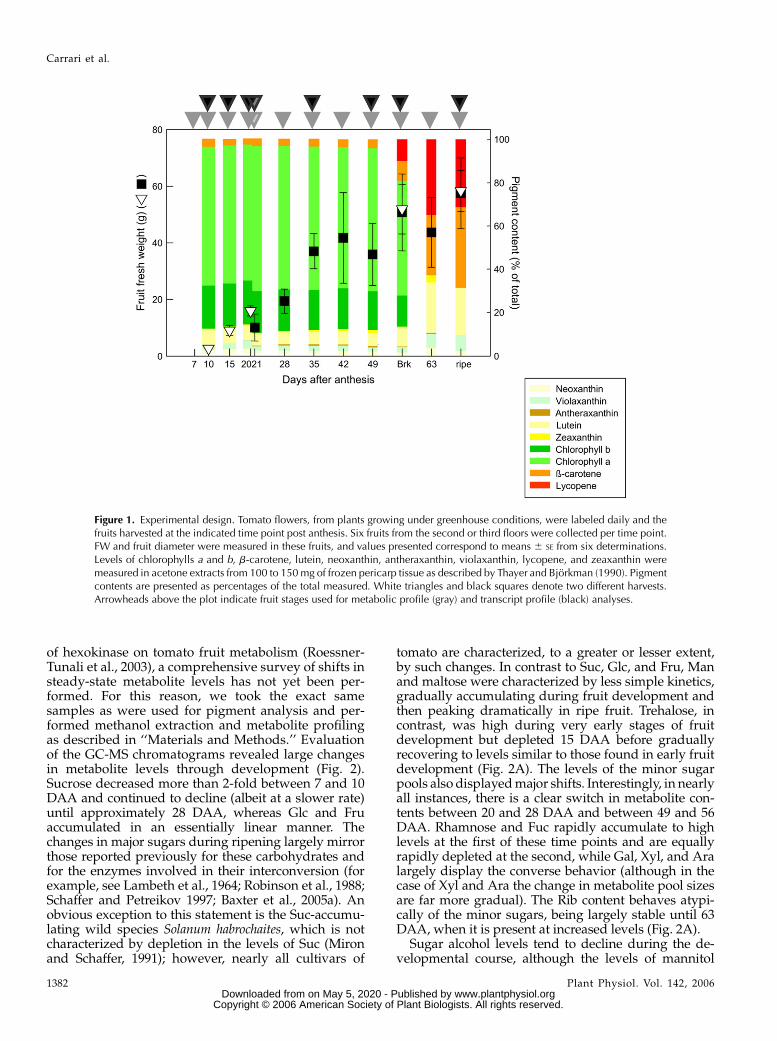
tions, these processes occurred in a period of 70 d forfruits set from flowers of the second and third floors.Fruits grew up until 35 d after anthesis (DAA) withmaximum fruit weight and size of 57 g and 5 cmdiameter per fruit, respectively (Fig. 1). According toGillaspy et al. (1993), the developmental pattern oftomato fruits can be divided in four defined phases:cell differentiation (P I), division (P II), expansion(P III), and ripening (P IV). In the experiments describedhere and according to Seymour et al. (1993), thesephases correspond to small green fruits harvestedfrom 10 to 21 DAA (P II), to fruits of 28 DAA up tofirst visible carotenoid accumulation (56 DAA [breakerstage], P III), and to red fruits with a peak in respira-tion rate and ethylene biosynthesis (63–70 DAA [ripestage], P IV). Fruits harvested during the experimentswere divided longitudinally in two halves and peri-carp samples were used for metabolite and transcriptdeterminations at the indicated time points (Fig. 1,arrowheads at top).
Pigment Content during Fruit Development
Changes in fruit color are the most obvious visualcharacter to define processes occurring during tomatodevelopment (Pecker et al., 1992). Overall color changeis the combined result of differential pigment accu-mulation. To stage fruit development, we thereforeevaluated the pigment composition of the fruit samples,analyzing chlorophylls a and b, b-carotene, lutein,neoxanthin, violaxanthin, zeaxanthin, antheraxanthin,and lycopene (Fig. 1). About 85% of the total pigmentcontents of fruits harvested from 10 to 49 DAA con-sisted of chlorophyll, with chlorophyll a being the mosthighly represented (65%). The remainder was comprisedof neoxanthin (2%), violaxanthin (2.5%), b-carotene(3.5%), lutein (6.3%), antheraxanthin (0.4%), and zea-xanthin (0.8%). No lycopene was detected in samplesfrom these development stages. However, from 56 DAAonward, there was a dramatic change in the pigmentcomposition of the fruits harvested; total chlorophylllevels decreased to 68%, whereas the relative pro-portion of violaxanthin, lutein, b-carotene, lycopene,antheraxanthin, and zeaxanthin reached levels in theripe fruit that were 2, 5, 10, 12, 9, and 9 times higherthan those at 56 DAA, respectively.
Small Molecule Metabolite Content duringFruit Development
Having determined the pigment profile and, thus,developmental stage of the fruit, we next turned ourattention to evaluating shifts in the contents of solublecarbohydrates using an established GC-MS method(Fernie et al., 2004). While the levels of a limited num-ber of metabolites across fruit development has beenreported previously (for example, see Boggio et al.,2000; Chen et al., 2001) and a broad range analysis wascarried out at three defined developmental time pointsin our previous assessment of the temporal influence
The Metabolism of Fruit Development
Plant Physiol. Vol. 142, 2006 1381 www.plantphysiol.orgon May 5, 2020 - Published by Downloaded from
Copyright © 2006 American Society of Plant Biologists. All rights reserved.
of hexokinase on tomato fruit metabolism (Roessner-Tunali et al., 2003), a comprehensive survey of shifts insteady-state metabolite levels has not yet been per-formed. For this reason, we took the exact samesamples as were used for pigment analysis and per-formed methanol extraction and metabolite profilingas described in ‘‘Materials and Methods.’’ Evaluationof the GC-MS chromatograms revealed large changesin metabolite levels through development (Fig. 2).Sucrose decreased more than 2-fold between 7 and 10DAA and continued to decline (albeit at a slower rate)until approximately 28 DAA, whereas Glc and Fruaccumulated in an essentially linear manner. Thechanges in major sugars during ripening largely mirrorthose reported previously for these carbohydrates andfor the enzymes involved in their interconversion (forexample, see Lambeth et al., 1964; Robinson et al., 1988;Schaffer and Petreikov 1997; Baxter et al., 2005a). Anobvious exception to this statement is the Suc-accumu-lating wild species Solanum habrochaites, which is notcharacterized by depletion in the levels of Suc (Mironand Schaffer, 1991); however, nearly all cultivars of
tomato are characterized, to a greater or lesser extent,by such changes. In contrast to Suc, Glc, and Fru, Manand maltose were characterized by less simple kinetics,gradually accumulating during fruit development andthen peaking dramatically in ripe fruit. Trehalose, incontrast, was high during very early stages of fruitdevelopment but depleted 15 DAA before graduallyrecovering to levels similar to those found in early fruitdevelopment (Fig. 2A). The levels of the minor sugarpools also displayed major shifts. Interestingly, in nearlyall instances, there is a clear switch in metabolite con-tents between 20 and 28 DAA and between 49 and 56DAA. Rhamnose and Fuc rapidly accumulate to highlevels at the first of these time points and are equallyrapidly depleted at the second, while Gal, Xyl, and Aralargely display the converse behavior (although in thecase of Xyl and Ara the change in metabolite pool sizesare far more gradual). The Rib content behaves atypi-cally of the minor sugars, being largely stable until 63DAA, when it is present at increased levels (Fig. 2A).
Sugar alcohol levels tend to decline during the de-velopmental course, although the levels of mannitol
Figure 1. Experimental design. Tomato flowers, from plants growing under greenhouse conditions, were labeled daily and thefruits harvested at the indicated time point post anthesis. Six fruits from the second or third floors were collected per time point.FW and fruit diameter were measured in these fruits, and values presented correspond to means 6 SE from six determinations.Levels of chlorophylls a and b, b-carotene, lutein, neoxanthin, antheraxanthin, violaxanthin, lycopene, and zeaxanthin weremeasured in acetone extracts from 100 to 150 mg of frozen pericarp tissue as described by Thayer and Bjorkman (1990). Pigmentcontents are presented as percentages of the total measured. White triangles and black squares denote two different harvests.Arrowheads above the plot indicate fruit stages used for metabolic profile (gray) and transcript profile (black) analyses.
Carrari et al.
1382 Plant Physiol. Vol. 142, 2006 www.plantphysiol.orgon May 5, 2020 - Published by Downloaded from
Copyright © 2006 American Society of Plant Biologists. All rights reserved.

recover somewhat at late stages of ripening, and those ofglycerol and the peak corresponding to sorbitol andgalactitol displayed considerable variation throughoutdevelopment (Fig. 2B). In contrast, the levels of the phos-phorylated intermediates and fatty acids that were reli-ably detectable displayed essentially hyperbolic decreaseswith respect to developmental time (Fig. 2, C and D).
The levels of organic acids of the TCA cycle showedsimilar trends to the phosphorylated intermediateswith the exception that there was a second peak intheir levels at around 56 DAA. In most cases, this was arelatively minor increase, but for citrate the increasewas substantial (Fig. 2E). These changes largely mirrorthe changes in activities of TCA-cycle enzymes, whichdecline during the chloroplast-chromoplast transitionin tomato fruit (Jeffery et al., 1986), and previousreports that document changes in the major acidscitrate and malate (Davies, 1965, 1966; Stevens, 1972).However, it is worth noting that the magnitudes ofthese changes in organic acid content are somewhat
variable between American and European cultivars.Irrespective of the cultivar, though, the levels of citrateand isocitrate keep high until later stages. When takentogether with the fact that NADP-ICDH activity peaksin ripe pericarp (Gallardo et al., 1995), it would appearthat this is most probably to supply the 2-oxoglutaratefor amino acid biosynthesis and ammonia assimilation(Chen and Gadal, 1990; Galvez et al., 1999). Levels oforganics acids that are not associated with the TCAcycle generally displayed different behavior with re-spect to developmental stage. While the levels ofsaccharate, phosphorate, gluconate, threonate, benzo-ate, nicotinate, c-caffeate, shikimate, and quinate alsorevealed hyperbolic decay over time, in contrast to theTCA-cycle intermediates, there was generally no clearsecond peak of these metabolites correlating with theonset of ripening (this was only apparent in the case ofglycerate). In contrast, t-caffeate, ascorbate, dehydroxy-ascorbate, galacturonate, and galactonate-1,4-lactoneincreased either gradually or rapidly during later
Figure 2. Metabolic profiles of tomato fruit along development. Relative metabolite contents of fruits harvested from 7 DAA untilpostripening (70 DAA). Metabolite contents were identified and quantified by GC-MS, and their relative amounts werecalculated as described by Roessner-Tunali et al. (2003) relative to 7 DAA. Histograms show the relative amounts of solublesugars (A), sugar alcohols (B), sugar phosphates (C), fatty acids (D), organic acids (E), TCA-cycle intermediates (F), amino acids(G), and cell wall components (H).
The Metabolism of Fruit Development
Plant Physiol. Vol. 142, 2006 1383 www.plantphysiol.orgon May 5, 2020 - Published by Downloaded from
Copyright © 2006 American Society of Plant Biologists. All rights reserved.

stages of fruit development, and maleate and gulo-nate-1,4-lactone displayed variable behavior duringthe course of the experiment (Fig. 2F).
The levels of amino acids were also highly variableduring the time course of development (Fig. 2G).Gradual declines in metabolite levels were observedfor GABA, b-Ala, Arg, Asn, Gln, pyroglutamate, Orn,Leu, and Val, while the levels of Ser, Ala, and Prodecreased sharply. In contrast, Trp, Cys, Glu, Asp, Lys,Met, and putrescine increase to peak at fruit ripening.One of the most prominent changes associated withthese processes in ripening tomatoes is the increase inGlu content (Grierson et al., 1985), which has beenreported to increase by up to 20-fold in tomato peri-carp during ripening (Gallardo et al., 1993). Thechange observed here was far less dramatic, only2-fold, but this may be due to use of different cultivarsin the two studies; notably, an increase of approximately8-fold was documented during ripening of the pro-cessing cultivar M82 (Baxter et al., 2005a). Given thatGlu is a direct precursor for chlorophyll biosynthe-sis, its accumulation, during a time period when themajority of compounds associated with nitrogen as-similation decrease, make it tempting to speculate thatthis increase is, at least in part, due to the down-regulation of chlorophyll biosynthesis at this timepoint. The remaining amino acid and high nitrogencompounds, Tyr, Phe, Thr, and tyramine, increasetransiently and peak at between 15 and 35 DAA, whileIso is invariant throughout development. Interesting,those amino acids that increase during developmentcan act as alternative respiratory substrates at timeswhen sugar supply is low (Ishizaki et al., 2005). Theirdecline could therefore imply a partial reliance of themitochondrial electron transport chain on these poolsduring later stages of development in which carbondemand is met entirely by source leaves of the plants.
Cell Wall Matrix Monosaccharide Composition duringFruit Development
Given that it is well documented that cell wallmetabolism is developmentally regulated in ripeningfruit (Hadfield and Bennett, 1998; Rose et al., 2004), weevaluated the monosaccharide composition of the cellwall in the exact same extracts. As would be expectedfrom previous studies, these data suggested a dra-matic shift in the relative proportion of monosaccha-ride composition. The most prominently observablechange was a decrease in the amount of Glc, whichwas diminished to 20% of that recorded during earlyfruit development. Most of this Glc can probably beattributed to starch since no starch-removing proce-dure was employed. Since most of the starch dimin-ished, the remaining material had a higher proportionof the wall sugars Man and Xyl and uronic acids.However, Fuc was only abundant at very low levels,Ara and Rha were invariant throughout development,while a decrease in the levels of Gal was observed (Fig.2H). This trend in this data is consistent with earlier
work that indicated, particularly, a degradation ofpectin-derived arabinan and galactans during fruitdevelopment (Sakurai and Nevins, 1993).
Correlative Behavior in Metabolite Levels SuggestsConcerted Regulation of Distinct Metabolic Pathways
Results described above allow a quantitative inter-pretation of the patterns of metabolite levels duringtomato fruit development and ripening. However, thedata also allow a more sophisticated assessment of thebehavior of the metabolic network. As a second objec-tive, we were interested in the combinatorial analysisof metabolites by running all data points throughpairwise correlation analysis. Of the 4,140 possiblepairs analyzed, 2,527 resulted in significant correla-tions (P # 0.05). Out of this number, 763 correlationsshowed high correlation coefficients, 614 positive (r2 .0.65) and 149 negative (r2 , 20.65). The full data set ofcorrelation coefficients is presented in the heatmap ofFigure 3. To simplify the interpretation, metabolitesare grouped by compound class and we will restrictdiscussion here to those correlations that showedcoefficients above (and below) 0.65. When these cor-relations are scrutinized, several trends become ap-parent. Phosphorylated intermediates display by farthe greatest number of significant correlations to othermetabolites, most probably indicating their centralityin primary metabolism. The phosphorylated interme-diates are followed by fatty acids, organic and aminoacids, sugar alcohols, cell wall components, and solu-ble sugars. The pigments displayed the lowest num-ber of significant correlations. Within each group ofmetabolites, sugars and cell wall components showedmore negative than positive correlations, while theopposite occurred with sugar phosphates, fatty acids,sugar alcohols, amino acids, organic acids, and pig-ments. All the metabolites measured presented sig-nificant correlations to compounds outside of theircompound class (with the exception of amino acidsand the pigments). The individual metabolites thatshowed the highest number of correlations werelinoleic acid, glycerol-1-P, a-ketoglutarate, myoinositolphosphate, GABA, shikimate, Glc-6-P, quinate, andFru-6-P with 27, 26, 25, 25, 24, 23, 23, 20, and 20 as-sociations, respectively, while Fuc, glycerol, cis-caffeate,gulonate-1,4-lactone, aconitate, maleate, nicotinate, Tyr,Orn, and the cell wall components Gal and Fucshowed no significant correlation. Moreover, thereare several clusters of highly correlated metabolitesthat are conserved between metabolites of similarchemical composition. For example, organic acids cor-related positively with sugar phosphates, sugar alco-hols, cell wall sugars, and with other organic acids.Furthermore, they tended to correlate negatively withfree sugars (especially Man). Similarly, myoinositoland myoinositol phosphate negatively correlated withall monosaccharides (with the exception of Ara) butpositively correlate with the disaccharide Suc. Thatsaid, almost all metabolite classes showed negative
Carrari et al.
1384 Plant Physiol. Vol. 142, 2006 www.plantphysiol.orgon May 5, 2020 - Published by Downloaded from
Copyright © 2006 American Society of Plant Biologists. All rights reserved.

correlation with free sugars, with the exception of theminor organic acids.
Changes in the Major Carbon Fluxes duringFruit Development
To relate the information obtained from the analysisof steady-state levels of metabolites to actual metabolicchange, we next assessed the major fluxes of carbonmetabolism at three time points of development: 21,35, and 49 DAA. For this purpose, pericarp discs werecut from the fruit and incubated in 10 mM MES-KOH,pH 6.5, supplemented with 20 mM cold Glc and 2 mCi(3 mCi/mmol) [U-14C]Glc. The fruits were metaboli-cally active, with the dominant flux being that of Suc
synthesis (Table I). This finding is in keeping withprevious reports that suggest a considerable cycle ofSuc synthesis and degradation occurs in tomato fruitsor cells derived from them (Nguyen-Quoc and Foyer,2001; Rontein et al., 2002). In contrast, the glycolyticflux rate is relatively minor, as are those of starch, cellwall, and protein synthesis. Interesting trends wereobserved in label incorporation, with that recovered inorganic acids decreasing at 35 DAA before peaking at49 DAA; a similar trend was also observed in theamino acid levels. In contrast, starch, cell wall, andcarbon dioxide evolution all declined through devel-opment, and the recovery of radiolabel in proteinincreased during this period. Given the relative sta-bility of the hexose-P pool size, its specific activity was
Figure 3. Visualization of metabolite-metabolite correlations. Heatmap of metabolite-metabolite correlations along develop-mental period of tomato fruits (from 7–70 DAA). Metabolites were grouped by compound class, and each square represents thecorrelation between the metabolite heading the column with the metabolite heading the row. Correlation coefficients andsignificances (two tailed) were calculated by applying Spearman algorithm using SSPS software. Out of 4,232 pairs analyzed,2,430 resulted in significant correlations (P # 0.05). Each square indicates a given r value resulting from a Spearman correlationanalysis in a false color scale. The Web version of this figure allows mouse-over annotation that facilitates point-by-pointevaluation of the data to facilitate its detailed interrogation.
The Metabolism of Fruit Development
Plant Physiol. Vol. 142, 2006 1385 www.plantphysiol.orgon May 5, 2020 - Published by Downloaded from
Copyright © 2006 American Society of Plant Biologists. All rights reserved.

largely invariant at all three time points. On esti-mating fluxes (using the assumptions described inGeigenberger et al., 2000), a similar trend in Suc, starch,and cell wall biosynthesis was apparent, while the rateof protein synthesis appeared to drop 35 DAA beforepeaking at 49 DAA. Glycolytic flux (estimated usingthe summed label accumulation in carbon dioxide,protein, and organic and amino acids) declined sharplybetween 21 and 35 DAA, but fell no further thereafter.In addition, to assess whether the disc-feeding systemyielded results that were representative of the in vivosituation, radiolabel was injected into the columella offruit at 21 DAA. Estimated fluxes were highly similarbetween these experiments (with in vivo fluxes esti-mated at 2,002 6 504, 59 6 28, 305 6 106, 163 6 48, and726 6 108 nmol hexose equivalents g fresh weight[FW]21 2 h21 for Suc, starch, cell wall, protein, andglycolysis, respectively), validating the experimentalsetup chosen.
Transcript Levels during Fruit Development
We chose to profile transcript abundance in fruit at10, 15, 20, 21, 35, 49, 56 (breaker stage), and 70 (ripestage) DAA, as these represent well-defined phasesduring the developmental process (Seymour et al.,1993). To obtain a well-represented variation inherentto fruits at each stage and to facilitate comparison to themetabolome data sets presented above, we pooledRNA extracted from exactly the same samples used
above. We used pools of RNAs coming from six differ-ent fruits and performed two to six array hybridiza-tions for each stage. Using 2.5-fold background as athreshold, we flagged those spots showing mediansabove the local background in all replicates (Alba et al.,2005; Baxter et al., 2005b; Carbone et al., 2005). Out ofthe 12,900 expressed sequence tag (EST) clones arrayedon TOM1 (Van der Hoeven et al., 2002; Alba et al., 2004),5,184; 4,230; 2784; 3,383; 4,941; 2,798; 6,486; and 4,308spots displayed signals above the threshold at 10, 15,20, 21, 35, 49, 56, and 70 DAA, respectively. A Venndiagram representation of the number of spots detectedat each stage grouped by developmental phases can beviewed online (Supplemental Fig. S1). During thisperiod of analysis, 1,420 spots showed signals abovethe threshold, representing 810 different genes ex-pressed at all stages during fruit development. Byapplying hierarchical cluster analysis, we orderedthese genes by their expression patterns across devel-opment (Supplemental Fig. S2A). Nine major clusterscontaining 784 genes were differentiated by this anal-ysis (Supplemental Fig. S2B). Approximately 50% ofthese genes could not be assigned to any of the previ-ously defined MapMan functional ontologies (Thimmet al., 2004; Usadel et al., 2005). This group includesthose genes annotated by similarity with Arabidopsispredicted proteins and those showing no similaritieswith any known protein (unknowns). Despite this fact,each cluster showed a specific category composition;the 245 genes showing a relatively high and constant
Table I. Redistribution of radiolabel and absolute fluxes in pericarp discs isolated from developing fruits at varying DAA
Discs were cut, washed three times in buffer, and then incubated for 2 h in 10 mM MES-KOH, pH 6.5, supplemented with 10 mM [U-14C]Glc(specific activity 1.4 MBq mmol21). At the end of the incubation, discs were again washed three times, extracted, and analyzed for radiolabel inorganic and amino acids, starch, protein, cell wall, phosphoesters, and sucrose. In addition, 14CO2 evolved during the experiment was trapped in KOHand the level of radiolabel determined by liquid scintillation counting. Absolute rates of flux were calculated from the label incorporation data usingthe specific activity of the hexose-P pool to account for isotopic dilution factors. Data presented are the mean 6 SE, n 5 4. Values were determined tobe significantly different from fruit harvested at 21 DAA (P , 0.05).
ParameterDAA
21 35 49
Total uptake (Bq g FW21) 565 6 137 362 6 18 1,372 6 200Metabolized (Bq g FW21) 160 6 35 197 6 10 352 6 50Label incorporation (Bq g FW21)
Sucrose 111 6 28 183 6 9 184 6 27Organic acids 8.4 6 0.4 5.5 6 0.5 17.20 6 1.88Amino acids 6.5 6 0.1 4.3 6 0.5 9.96 6 2.39Starch 12.6 6 1.2 6.3 6 0.4 6.91 6 0.66Protein 1.5 6 0.4 3.2 6 0.3 4.49 6 0.62Cell wall 7.9 6 0.8 3.9 6 0.8 4.26 6 0.33Carbon dioxide 2.2 6 0.1 0.5 6 0.1 0.31 6 0.03Hexose-P 17.0 6 3.7 14.1 6 4.2 16.1 6 2.7
Specific activity, hexose-P (Bq nmol21) 0.06 6 0.01 0.05 6 0.01 0.08 6 0.01Metabolic flux (nmol hexose equivalents g FW21)
Sucrose synthesis 1,809 6 294 3,540 6 966 1,875 6 316Starch synthesis 168 6 32 121 6 41 95 6 17Cell wall synthesis 157 6 52 67 6 22 62 6 16Protein synthesis 41 6 11 33 6 3 61 6 11Glycolytic 510 6 143 315 6 96 385 6 52
Carrari et al.
1386 Plant Physiol. Vol. 142, 2006 www.plantphysiol.orgon May 5, 2020 - Published by Downloaded from
Copyright © 2006 American Society of Plant Biologists. All rights reserved.

expression level (cluster 1) were mainly represented bygenes (46%) that fell into BIN29 (protein), 8% fell intoBIN34 (transport), 6% into BIN27 (RNA), and 5% intoBIN26 (miscellaneous enzyme families). Clusters 2 and13 grouped 64 and 44 genes, respectively, with similarexpression patterns: a high relative expression level atthe beginning of the analyzed period and decliningafter on. Sixteen percent and 21% of the genes clusteredhere fell into BIN1 (photosynthesis), and 14% and 11%fell into BIN13 (amino acid metabolism). Clusters 4 and12 grouped those genes (164) with depressed levelsbetween 20 and 56 DAA, which mainly fell into RNA,DNA, transport, cell, protein, and stress BINs. Stress-related genes (BIN20) were highly represented in clus-ters 7 (26%), 9 (9%), and 11 (8%). Cluster 14 groupedthose genes expressed at constant low levels into BINs29 (protein: 29%), 27 (RNA: 19%), 17 (hormones: 11%),and 1 (photosynthesis: 7%). To facilitate the identifica-tion of patterns of transcriptional change in pathwaysassociated with the metabolites that we determinedabove, we visualized these data in the recently releasedSolanaceous MapMan (Urbanczyk-Wochniak et al.,2006). All the Maps can be viewed at www.mpimp-golm.mpg.de/fernie; here, we highlight changes in thetranscript levels of transcripts associated with energy,starch, and amino acid metabolism (Fig. 4). As wouldbe expected, photosynthetic gene expression shutsdown during fruit development (illustrated here withthe light reactions); however, it appears to exhibit abiphasic response, with a massive decrease occurringrelatively early on followed by a secondary decline.This pattern of change is largely unique to the photo-synthetic genes, with expression of other genes associ-ated with metabolism generally exhibiting restrictionsin expression only at later stages. However, during fruitdevelopment there is a clear tendency of transcriptlevels of metabolically associated genes to be reduced.For example, this is also the case for starch synthesis(and degradation for that matter), as would be expected
in an organ displaying transient starch synthesis (Beckleset al., 2001). However, perhaps surprisingly, this is alsotrue for genes associated with amino acid synthesis,glycolysis, and the TCA cycle, despite the dependence ofat least the latter pathways for energy metabolismunder conditions where these pathways are not aug-mented by fruit photosynthesis.
Correlative Behavior in Transcript Levels SuggestsFewer Functionally Concerted Changes throughoutDevelopment Than Observed in the Metabolite Levels
As would be anticipated from the fact that the levelsof so many transcripts displayed similar patterns ofchange across fruit development, the overall level ofcorrelation in transcript levels is much greater than thatof the metabolite data set. This is illustrated in Figure 5by utilizing a subset of the transcript data set, selectedon the basis of involvement of genes in processespreviously described to be important in fruit develop-ment (see Giovannoni, 2004; Carrari and Fernie, 2006).However, a similar pattern emerges when the entiredata set is queried, indicating that the conclusion madeabove is not overly influenced by the process of tran-script selection (data not shown). This finding aside,when the transcripts are analyzed from the perspectiveof functional groupings, they display a far less con-certed pattern of change than that displayed by themetabolites. Despite the relative paucity of correlationsbetween functionally similar transcripts, close inspec-tion of the correlations presented in Figure 5 revealedsome interesting features, especially with respect toethylene pathway and cell wall-associated genes. Theethylene pathway-associated genes clearly displayed alarge degree of both positive and negative correlationswith the other ripening-associated genes. Intriguingly,the correlations observed for the transcript corre-sponding to the ethylene receptor 1 showed opposingbehavior to the rest of the ethylene receptor transcripts.
Figure 4. Differences in transcript levels during tomato fruit development for genes associated with the photosynthetic lightreactions, the TCA cycle, glycolysis, amino acid synthesis and degradation, and starch synthesis and degradation. All materialwas harvested in the middle of the day. Red and blue represent a decrease and an increase, respectively, of expression withrespect to the average of all time points. Here each unigene that has been assigned to a process is represented by a single coloredbox. The color scale that was used is reproduced in the figure. This data are best viewed and all data point annotations providedat http://gabi.rzpd.de/projects/MapMan (see ‘‘Materials and Methods’’). This Web site also gives simple instructions to facilitateits ease of use.
The Metabolism of Fruit Development
Plant Physiol. Vol. 142, 2006 1387 www.plantphysiol.orgon May 5, 2020 - Published by Downloaded from
Copyright © 2006 American Society of Plant Biologists. All rights reserved.

While this observation is currently difficult to interpretsince ethylene receptors 1 and 2 exhibit constitutiveand stable expression patterns, it may not be greatlysignificant from a functional viewpoint since at laterstages of development receptors 3 and 4 are expressedat much higher levels (see Alba et al., 2005; this study).
Some dramatic changes in the expression level of cellwall metabolism-related genes were observed duringfruit development (including in those encoding struc-tural glycoproteins, cellulose synthases and nucleotidesugar conversion enzymes, xyloglucan endotransgly-cosylases, and other glycosylhydrolases). More than
Figure 5. Heatmap of correlations between selected transcripts on the basis of involvement of processes previously describedto be important in fruit development. Transcripts were grouped by functionality on the basis of MapMan gene ontology. Inanalogy to Figure 3, each square represents the correlation between the transcript heading the column with the transcriptheading the row. Correlation coefficients and significances (two tailed) were calculated by applying Spearman algorithm usingSSPS software. Each dot indicates a given r value resulting from a Spearman correlation analysis in a false color scale. RI TFsTDR, Ripening-related transcription factors (TDR family). CHO-AGPses, Carbohydrate metabolism-ADP-Glc pyrophosphor-ylases. The Web version of this figure allows mouse-over annotation that facilitates point-by-point evaluation of the data tofacilitate its detailed interrogation.
Carrari et al.
1388 Plant Physiol. Vol. 142, 2006 www.plantphysiol.orgon May 5, 2020 - Published by Downloaded from
Copyright © 2006 American Society of Plant Biologists. All rights reserved.

50% of the genes were related to pectin degradation, inparticular endopolygalacturonases and pectinmethyl-esterases, whose activities are known to become dom-inant during fruit ripening (Cheng and Huber, 1997).Interestingly, even when analyzed at a higher level ofresolution, there was nearly no correlation within genefamilies of wall metabolic enzymes, e.g. polygalactu-ronases (Fig. 5); instead, single members of those genefamilies correlated with other single members of othergene families postulated to be of importance in ripen-ing. This finding therefore implies a low level of func-tional redundancy within these gene families duringtomato fruit metabolism and development. That said,almost all of the wall-related transcripts correlatedpositively with at least one ADP-Glc pyrophosphory-lase isoform, while ascorbate reductases and peroxidasesalso showed positive correlations with the transcriptlevels of this enzyme. In contrast, ADP-Glc pyrophos-phorylase correlated negatively with ACC oxidase andethylene receptor and responsive genes. Surprisingly,the transcript levels of MAP kinases appear to exhibitvery low correlations with genes associated to ripening.However, several unigenes representing the ripening-inducible transcription factor TDR4 and other MADS-box genes displayed dramatic negative correlation witha high number of previously defined ripening-relatedgenes (represented in Fig. 5). These results thus cor-roborate previous genetic evidence for the importanceof this class of genes in the ripening process (Vrebalovet al., 2002).
Transcript to Metabolite Correlations Reveals CertainTypes of Metabolites Have Very Strong Correlationsto a Large Number of Transcripts
We next turned our attention to analyzing the corre-lation between metabolites and transcripts. For thispurpose, we evaluated the correlations between thelevels of all measured metabolites and the subset oftranscripts defined above (Fig. 6). The general level ofcorrelation was relatively low; however, there were anumber of clusters that indicated highly positive ornegative correlations among functionally similar mo-lecular entities. When assessed from the metaboliteviewpoint, these clusters were most prominent in thecase of sugar phosphates, organic acids of the TCAcycle, and pigments. Of particular note from a func-tional perspective is the fact that the acids galacturo-nate, L-ascorbate, and dehydroascorbate positivelycorrelated with ACC oxidase, ethylene receptor, andwith the ripening-inducible transcription factor TDR4expression, while shikimate showed high positive cor-relation coefficients with ethylene response genes,ADP-Glc pyrophosphorylase, dehydroascorbate re-ductase, and several wall-related genes but negativecorrelation with ACC oxidase and with an ethylenereceptor gene. From a more general perspective, or-ganic acids of the TCA cycle also exhibited significantcorrelation with many ripening-associated transcripts.Analysis of the pigments revealed that the levels of
neoxanthin, violaxanthin, lutein, and the chlorophyllsare very highly correlated with transcript levels. In-triguingly, these pigments all display similar correla-tions with the exact same genes.
Analysis of this data matrix from the transcript pointof view identified genes associated with the ethylenepathway, carbohydrate metabolism, and cell wall dis-playing a high number of associations (for example,cellulose synthases correlate negatively with free hex-ose and sugar constituents of the cell wall but posi-tively with myoinositol levels). However, surprisingly,there was very little correlation between cell wall poly-saccharide content and genes associated with cell wallmetabolism, although some of the pectin-degradingenzymes exhibited strong correlations with sugar phos-phates, suggesting that the degraded wall componentsare taken back up into the cell to feed the carbon meta-bolic network of the cell.
Thus far, we have only considered correlationsbetween known metabolites and/ or transcripts in anattempt to discern regulatory motifs during ripening.We next analyzed the behavior of transcript levels ofunknown genes, throughout the developmental series,relative to that of metabolites (Supplemental Fig. S3)and of known genes (Supplemental Fig. S4). Thepurpose of this was 2-fold: (1) Such approaches havebeen reported to by highly useful in the prediction oreven the proof of gene function (Broeckling et al., 2005;Tohge et al., 2005; Morikawa et al., 2006), and (2) thisapproach can provide an alternative to the QTL ap-proach in the identification of candidate genes forbiotechnological improvement (Urbanczyk-Wochniaket al., 2003). Here, we were able to identify genes thatcorrelated with specific metabolites; for example, threegenes (SGN-U147356, -U144736, and -U155430) homo-logous to Arabidopsis membrane proteins (At1g72480and At1g64720) and to a putative Glu permease dis-played high negative correlation coefficients with Suc.Interestingly, the Arabidopsis homologs of these geneswere also recently identified as Suc responsive (Blasinget al., 2005). However, two of these genes (SGN-U147356 and -U147061) correlate negatively with sev-eral soluble sugars, all sugar phosphate measured, andseveral organic acids. The lack of specificity in corre-lation was a common feature in the data, with manygenes showing strong correlation with a wide range ofmetabolites (Supplemental Fig. S3); for example, a genesimilar to a zinc ion-binding protein (SGN-U155837), agene similar to an Arabidopsis protein phosphatase(At2g27210; SGN-U154577), and a gene similar to aFagus Glu permease (SGN-U146076) correlated posi-tively with chlorophylls a and b, lutein, neoxanthin,Val, b-Ala, Gln, and myoinositol levels. The vast ma-jority of genes, however, exhibited associations withmany different metabolites; for example, gene SGN-U143517 (which a BLAST search revealed as similar tothe vtc2 gene of ascorbate biosynthesis; Muller-Mouleet al., 2003) correlated with zeaxanthin, citrate, Ara,oxo-Pro, mannitol, and Fru-6-P and with an unknownmetabolite that coelutes with isoascorbate. To further
The Metabolism of Fruit Development
Plant Physiol. Vol. 142, 2006 1389 www.plantphysiol.orgon May 5, 2020 - Published by Downloaded from
Copyright © 2006 American Society of Plant Biologists. All rights reserved.

aid in categorization of gene function, we additionallylooked through the expression data to see which of thesegenes were coexpressed with genes that had beenassigned a MapMan category, throughout ripening(Supplemental Fig. S4). This analysis revealed that theunknown genes analyzed also displayed a large pro-portion of connections with categorized genes (rang-ing from 22–190 significant correlations). Transcriptsassociated with RNA and protein are highly represen-ted here; however, metabolism-associated transcriptsalso show highly correlative behavior. SGN-U155430(a putative Glu permease) showed a high number ofconnections with photosynthesis-related genes (with12% of all correlating transcripts falling into this func-tional category), and SGN-U143484 (a putative nucle-oside-diphosphate-sugar epimerase) showed a high
number of correlations with major carbohydrate-related genes (7% of all correlating transcripts), aminoacid metabolism (6% of all correlating transcripts), andalso with photosynthesis-related genes (14% of allcorrelating transcripts). Interestingly, SGN-U167243showed a relatively high number of connections withamino acid-related genes (31%). This unknown genealso correlates negatively with the levels of the aminoacids Pro, Gln, and b-Ala, and also with a high numberof organic acids (gluconate, quinate, shikimate, fuma-rate, phosphorate, a-ketoglutarate, malate, and succi-nate). Such analyses should aid in assigning putativefunctions for the many nonannotated ESTs availablefor tomato.
In addition to looking at the data point-by-point onthe basis of a priori knowledge, we also attempted to
Figure 6. Selected transcript-metabolite correlation visualizations. Heatmap surface of selected transcript-metabolite correla-tions was drawn and correlation coefficients were calculated as described for Figures 3 and 5. Each dot indicates a given r valueresulted from a Spearman correlation analysis in a false color scale. RI TFs TDR, Ripening-related transcription factors (TDRfamily). CHO-AGPses, Carbohydrate metabolism-ADP-Glc pyrophosphorylases. The Web version of this figure allows mouse-over annotation that facilitates point-by-point evaluation of the data to facilitate its detailed interrogation.
Carrari et al.
1390 Plant Physiol. Vol. 142, 2006 www.plantphysiol.orgon May 5, 2020 - Published by Downloaded from
Copyright © 2006 American Society of Plant Biologists. All rights reserved.

analyze network connections that persist during fruitdevelopment. Networks, similar to those obtainedfrom combined metabolite and transcript profiling ofsulfur starvation in Arabidopsis (Nikiforova et al.,2005), can be constructed from the data set presentedhere (Supplemental Fig. S5, A and B). However, whenelements that have been suggested to be important inthe developmental process are demarcated, few cleartrends emerge. One reason for this could be the sheersize of data set analyzed. To circumvent this problem,analyses of correlation subclusters also were carriedout (Supplemental Fig. S5B). These analyses revealedclose associations indicative of specialist functions, i.e.between the sugar Xyl in its free form and as a cellwall constituent, between pectin-degrading enzymesand cell wall Fuc or merely between pectin methyl-esterases themselves and between inositol phosphateand other sugar phosphates, as well as between eth-ylene, ascorbate, and constituents of the cell wall ma-chinery. While these data are currently difficult tointerpret, it is likely that this network will provide auseful foundation for future research looking intofruit developmental processes, as well as a usefulreference tool that could aid in future gene functionalannotation studies.
DISCUSSION
Fruit development is a highly complex process thathas received much research attention in recent yearswith the vast majority of these studies being focusedtoward hormonal regulation (Lanahan et al., 1994;Adams-Phillips et al., 2004; Barry and Giovannoni,2006), aspects of pigmentation (Giuliano et al., 1993;Fraser et al., 1994; Ronen et al., 2000), or sugar and cellwall metabolism (Yelle et al., 1991; Fridman et al., 2004;Rose et al., 2004), with only a handful of studieslooking at more general aspects of metabolism. In thisarticle, we report a comprehensive analysis of changes inmetabolism occurring during tomato fruit developmentusing a combination of transcriptomic and GC-MS-based metabolite profiling approaches. This revealedthat metabolism is very tightly regulated during thetransition of the fruit from a partially photosynthetic toa fully heterotrophic organ. Moreover, the pattern ofmetabolite accumulation provides information that isimportant for understanding what defines the metab-olite composition of the ripe fruit but also reveals theunderlying developmental shifts in metabolism thatlead to this composition.
The kinetic nature of the metabolite data presentedhere facilitates the evaluation of the potential routesthrough the metabolic network. As an example of thisapproach, we investigated the possible routes of as-corbate biosynthesis within the fruit. To date, fourputative pathways of ascorbate biosynthesis have beenpostulated in plants (Ishikawa et al., 2006). The bestcharacterized of these, the Smirnoff-Wheeler pathway,has been resolved to a fairly high degree with genes
now identified that encode almost every reaction steppostulated (Conklin et al., 2006). Such strong evidencedoes not exist for the alternative pathway, which wasproposed merely on the observation of GDP-L-guloseas an alternative product of the GDP Man epimerasereaction (Wolucka and Van Montagu, 2003); however,the conversion of L-gulose to ascorbate in whole tissuehas been demonstrated (Jain and Nessler, 2000). Re-cently, the overexpression of a strawberry (Fragariaspp.) d-GalUA reductase in Arabidopsis led to 2- to3-fold increase in the ascorbate content of foliar tissue(Agius et al., 2003), leading the authors to suggest thatthe degradation of pectins facilitated ascorbate accu-mulation. Finally, biochemical evidence has been pre-sented to suggest that myoinositol oxygenase couldpotentially be a further entry point into plant ascorbatebiosynthesis (Lorence et al., 2004). Evidence presentedin this study suggests that the D-GalUA and myoino-sitol routes are unlikely to be major precursors forascorbate biosynthesis in the tomato given their kineticprofiles relative to that of ascorbate, dehydroascorbate,and threonate. In contrast, the pool sizes of galacto-nolactone and gulonolactone are considerable prior tothe large increase in ascorbate content. The presence ofhomologs of all enzymes of the Smirnoff-Wheelerpathway in tomato strengthens the suggestion thatthe GDP-Man pathways are the predominant routeof ascorbic acid biosynthesis in the tomato. Whiled-GalUA reductase has purportedly been mapped in thetomato genome (Zou et al., 2006), this claim was notsupported by functional evidence. Despite our beliefthat it is unlikely to be of high importance in ascorbatemetabolism, the fact that both myoinositol and myo-inositol phosphate negatively correlate with all mon-osaccharides (with the exception of Ara) but positivelycorrelate with the disaccharide Suc suggest it is po-tentially interesting. Correlation of myoinositol phos-phate with Suc has previously been observed across anintrogression population of tomato (Schauer et al.,2006) and during a diurnal period in Arabidopsis(Morgenthal et al., 2005). Given the involvement ofmyoinositol phosphates in diverse processes span-ning, among others, signal transduction, osmoprotec-tion, and auxin metabolism (Gomez-Merino et al.,2005), it is important that their levels are highlyregulated and would appear to follow very closelythe momentary level of Suc. The fact that its levelsappear to be highly responsive to those of Suc there-fore implicates inositol and its derivatives as poten-tially important molecules in the regulation of fruitdevelopment. In keeping with this suggestion, myo-inositol phosphate levels were one of only a handful ofmetabolites that were strongly linked to yield-associatedtraits in the Zamir introgression line population, withother metabolites of such high importance being Suc,sugar phosphates, and GABA (Schauer et al., 2006).Interestingly, all of these molecules have been postu-lated to be signal metabolites in plants and, with theexception of GABA, all were shown in this study todisplay high correlations with transcript levels of genes
The Metabolism of Fruit Development
Plant Physiol. Vol. 142, 2006 1391 www.plantphysiol.orgon May 5, 2020 - Published by Downloaded from
Copyright © 2006 American Society of Plant Biologists. All rights reserved.

thought to be important in fruit development. Thatsimilar results emerged from a radically different wayof approaching phenotype association goes a long wayto validating them and also suggests that the ‘‘guilt byassociation’’ approach represents a viable alternativeapproach for identifying candidate genes for traitimprovement.
In addition to providing potential targets for theengineering of metabolism, this data set also allows ageneral assessment of metabolic regulation during to-mato fruit development. The levels of metabolites ofthe same compound class display closely coordinatedchanges throughout development (Fig. 3), despite thefact that, generally speaking, structurally similar me-tabolites do not display the same correlations withtranscript levels (Fig. 6). This fact suggests that a largeproportion of the regulation of metabolism occurs atthe posttranslational level. This is not a highly sur-prising finding since similar conclusions have beenreached in several recent studies in plant and nonplantsystems (Gibon et al., 2004; Urbanczyk-Wochniak et al.,2005; Kummel et al., 2006). Previously, experimentslooking at the diurnal regulation of primary metabo-lism have documented that there is generally very littlecorrelation between changes in transcript and changesin enzyme levels (Gibon et al., 2004), and even lessbetween transcript and metabolite levels (Urbanczyk-Wochniak et al., 2005). Similarly, tandem profiling ofthese molecular entities in microbial systems (Pir et al.,2006) is in support of theoretical assessments (TerKuile and Westerhoff, 2001) that in these systems, too,metabolic regulation occurs predominantly at theposttranslational level. Moreover, a recent study usinga combination of metabolome data and computation ofreaction thermodynamics indicated that the majorityof metabolic regulation is likely to be related to allo-stery (Kummel et al., 2006).
Despite the apparent dominance of posttranslationalregulation of metabolism, we were able to identifyseveral correlation hotspots between transcripts andmetabolites. For example, sugar phosphates, organicacids, and pigments are all highly correlated to se-lected ripening-associated transcripts. This observa-tion has important biotechnological implications giventhat the manipulation of cellular levels of transcriptsis now relatively facile. It must be borne in mind thatthe correlation of metabolite and transcript levels byno means proves that the metabolite level is undertranscriptional control (it could equally imply thatgene transcription or transcript stability is under me-tabolite control). However, the fact that such chemicallydiverse compounds correlate to the same ripening-associated transcripts leads us to contend that the lev-els of these metabolites are developmentally regulatedat the level of gene transcript. Irrespective of whetherthis is indeed the case, the strong correlative behaviorbetween organic acids, sugar phosphates, and pigmentswith genes associated to the ethylene and cell wall path-ways underscore the importance of these metabolicintermediates in the process of ripening.
Understanding of pigment composition of fruits isof high commercial importance, and considerable ad-vances have been made in defining and understandingthe metabolic pathways underlying their regulation(Lewinsohn et al., 2005; Fernie et al., 2006).That said, ashighlighted by a recent QTL and positional mappingstudy, not all the genes that are responsible for theaccumulation of pigments in tomato have yet beenidentified (Liu et al., 2003). Moreover, there have beenfew studies to date that attempt to integrate changes inprimary metabolism to those in pigment composition.While this study reveals that the levels of few of theprimary metabolites correlate strongly with pigmentcontents, it also shows that several organic acidsdisplay considerable correlation with many of thesame transcripts. This result is particularly interestinggiven the fact that several tomato genotypes deficientin TCA-cycle function exhibit elevated pigment con-tent (Carrari et al., 2003; C.R. Studart-Guimeraes, A.Fait, A. Nunes-Nesi, F. Carrari, B. Usadel, and A.R.Fernie, unpublished data), providing support that thisapproach can be readily utilized as a means of iden-tifying candidate genes for biotechnology. That theorganic acids and sugar phosphates also show suchconsiderable correlative behavior with similar or eventhe same transcripts is intriguing. Ethylene-regulatedrespiratory changes are a dominant feature of climac-teric fruit ripening (Herner and Sink, 1973; Giovannoni,2004); as a rule the TCA-cycle intermediates declinegradually, however, a second peak in their levels isclearly observable 56 DAA. While we favor the hy-pothesis that the TCA-cycle intermediates are regu-lated at the transcriptional level, we cannot currentlyexclude the possibility that in plants, as in animals (Heet al., 2004), these intermediates could play a key rolein mediating retrograde-regulated gene expression(Doicinovic et al., 2004; Zarkovic et al., 2005).
Thus far, we have only considered correlative be-havior between single entities or at most betweengroups of similar entities. This is largely due to inher-ent difficulties in the complexity of interpretation oflarger networks (Sweetlove and Fernie, 2005). Theapplication of network analysis to plant metabolismand development is in its infancy. That said, the firsttranscript profiles of fruit developmental mutants oftomato have been published (Alba et al., 2005), and thetomato genome sequencing project is well under way(Mueller et al., 2005). Given the advances that can beanticipated in gene annotation, it is likely that the datapresented here will also prove a useful reference dataset for future data interpretation and allow us toproceed further in functional annotation than wewere able to in this study. Nevertheless, from thisstudy we were able to draw several important conclu-sions concerning metabolic regulation during tomatofruit development. First, our data demonstrate thatprimary metabolism is highly coordinately regulatedthroughout this period, with up- and down-regulationof the accumulation of compounds of the same chem-ical class prevalent. Second, metabolite abundance
Carrari et al.
1392 Plant Physiol. Vol. 142, 2006 www.plantphysiol.orgon May 5, 2020 - Published by Downloaded from
Copyright © 2006 American Society of Plant Biologists. All rights reserved.

appears to be strictly controlled, whereas transcriptabundance is more variable. This suggests that duringtomato fruit development, as was observed in theresponse of Arabidopsis to extended darkness (Gibonet al., 2004), the transcriptional response does notalways equate to a proportional functional response.Detailed point-by-point analysis was however able toidentify the likely pathway of ascorbate metabolism inthe fruit as well as to identify areas of metabolism thatseem to be of high importance to the ripening process.Future studies in our laboratories will focus both onanalyzing the consequences on fruit development ofreverse genetic manipulation of organic acid and sugarphosphate metabolism and on determining the broadmetabolic consequences of perturbing fruit ripeningand development.
MATERIALS AND METHODS
Plant and Chemical Materials
Except where otherwise stated, all enzymes and materials were purchased
from Roche. Tomato (Solanum lycopersicum cv Moneymaker) plants were
obtained from Meyer Beck (Berlin) and were handled as described in the
literature (Carrari et al., 2003).
Sampling of Fruits
Individual flowers were tagged at anthesis to accurately follow fruit ages
through development. Fruits were harvested in the middle of the light period
in two separate experiments; first, at 10, 15, and 20 DAA and at breaker (56 DAA)
and ripe (70 DAA) stages, and, second, at 7-d intervals from 21 DAA to 70 DAA
(ripe). These periods fully covered the transition from green to fully ripe red
fruit. The fruits were weighed and measured immediately upon harvesting.
Harvested fruits were cut in two with a scalpel blade and the pericarp was
separated from the placental tissue. The pericarp was immediately frozen in
liquid nitrogen before being kept at 280�C until use.
Pigment Determination
The determination of the levels of chlorophylls a and b, lutein, neoxanthin,
violaxanthin, antheraxanthin, and zeaxanthin were performed in acetone
extracts, essentially as described by Thayer and Bjorkman (1990). The pig-
ments were separated in extracts (100-mL injection volume) by HPLC on a
5-mm nonendcapped 25- 3 4.5-mm Zorbax-ODS reverse-phase column. Pig-
ments were detected by their A450 and identified by cochromatography with
authentic standards. The quantity of each pigment was determined by
comparison of the sample peak areas to a standard curve. Mobile phases
were (A) 88% (v/v) acetonitrile, 10% (v/v) methanol, 2% (v/v) 100 mM Tris-
HCl, pH 8.0, and (B) 67% (v/v) methanol, 33% (v/v) acetic acid ethylester. The
gradient employed was 21 min at 100% (A), followed by a linear gradient to
100% (B) over 6 min at a flow rate of 0.8 mL min21. At 29 min, the flow rate was
increased to 1.0 mL min21; on 37 min a linear gradient over 14 min to 100% (A)
was applied and these conditions were maintained for 10 min.
Metabolite Analysis
The relative levels of metabolites were determined from frozen pericarp
samples as described by Roessner et al. (2001a), with the modifications for
tomato tissue documented by Roessner-Tunali et al. (2003). Data are presented
normalized to the control (7 DAA), as described by Roessner et al. (2001b).
Cell Wall Analysis
Cell wall analysis was carried out essentially as described by Baxter et al.
(2005a). In brief, the insoluble residue after metabolite extraction was washed
with ice-cold 70% (v/v) ethanol followed by a washing step with a 1:1 (v/v)
methanol:chloroform. The dried residue was then subjected to 2 M trifluoro-
acetic acid hydrolysis for 1 h at 121�C to release the monosaccharides of the
wall matrix polysaccharides. The released monosaccharides were quantified
as their alditol acetate derivatives by GC-MS (Albersheim et al., 1967), with the
exception that data are presented normalized to the control (7 DAA), as per
the soluble metabolite analysis.
Incubation of Plant Material with [U-14C]Glc
Developing fruits were removed at 21, 35, and 49 DPA, and a 10-mm-
diameter latitudinal core was taken. Both cuticular and locular tissues were
removed, and the residual pericarp material was sliced into 2-mm slices and
washed three times in fresh incubation medium (10 mM MES-KOH, pH 6.5)
and then incubated (eight discs in 5 mL incubation medium containing
[U-14C]Glc [1.4 MBq mmol21]) to a final concentration of 10 mM. Samples
were then incubated for 2 h before washing again three times in unlabeled
incubation medium and freezing in liquid N2 until further analysis. All
incubations were performed in a sealed 100-mL flask at 25�C and shaken at
150 rpm. The evolved 14CO2 was collected in 0.5 mL of 10% (w/v) KOH.
In Vivo Labeling of Tomato Fruit
Labeling experiments were carried out following modification of the
conditions for intact potato (Solanum tuberosum) tubers described by Bologa
et al. (2003). A fine channel (1–2 mm in diameter) was bored into the columella
tissue directly to the abscission zone of the pedicel and 7.4 MBq/mL of
[U-14C]Glc (specific activity 11.5 GBq/mmol), equivalent to approximately
37 MBq per fruit, was injected into the borehole. After 2 h the fruit was re-
moved from the plant dissected and frozen in liquid N2 until further analysis.
Fractionation of 14C-Labeled Material
Tissue was fractionated exactly as described by Fernie et al. (2001), with the
exception that hexoses were fractionated enzymatically rather than utilizing
thin-layer chromatography. Labeled Suc levels were determined after 4-h
incubation of 200 mL of total neutral fraction with 4 units/mL of hexokinase in
50 mM Tris-HCl, pH 8.0, containing 13.3 mM MgCl2 and 3.0 mM ATP at 25�C.
For labeled Glc and Fru levels, 200 mL of neutral fraction were incubated with
1 unit/mL of Glc oxidase and 32 units/mL of peroxidase in 0.1 M potassium
phosphate buffer, pH 6, for a period of 6 h at 25�C. After the incubation time,
all reactions were stopped by heating at 95�C for 5 min. The label was
separated by ion-exchange chromatography as described by Fernie et al.
(2001). The reliability of these fractionation techniques have been thoroughly
documented (Runquist and Kruger, 1999; Fernie et al., 2001) previously, with
the exception of the hexose fractionation. Recovery experiments performed in
the current study determined that the quantitative recovery of radiolabel fol-
lowing this novel method of hexose fractionation was acceptable (90%–105%).
RNA Isolation
Total RNA from tomato pericarp was isolated as described by Obiadalla-
Ali et al. (2004). RNA was hybridized against glass slide microarrays as
defined below.
Glass Slide Microarray
Glass slides containing arrayed tomato ESTs were obtained directly from
the Center for Gene Expression Profiling at the Boyce Thompson Institute,
Cornell University, the Geneva Agricultural Experiment Station, and the U.S.
Department of Agriculture Federal Plant and Nutrition Laboratory. The
tomato array (TOM1) contains approximately 12,000 unique elements ran-
domly selected from cDNA libraries isolated from a range of tissues, including
leaf, root, fruit, and flowers, and representing a broad range of metabolic and
developmental processes. Technical details of the spotting are provided as
MIAME (http://www.mpimp-golm.mpg.de/fernie). Further annotation of
this file was carried out to provide gene identities and putative functions
for the ESTs described on the Solanaceae Genomics Network (http://soldb.
cit.cornell.edu/) Web site. Fluorescent probe preparation and microarray
hybridization were exactly as described previously (Baxter et al., 2005b;
Urbanczyk-Wochniak et al., 2005). In brief, microarrays were scanned using an
Affymetrix 428 Array scanner and acquisition software according to the
The Metabolism of Fruit Development
Plant Physiol. Vol. 142, 2006 1393 www.plantphysiol.orgon May 5, 2020 - Published by Downloaded from
Copyright © 2006 American Society of Plant Biologists. All rights reserved.

manufacturer’s instructions. After scanning, images were analyzed in Gene-
pix Pro Version 4.1 software (Axon Instruments) and raw data collected and
incorporated into Microsoft Excel for further analysis. Data was normalized
and quality controlled exactly as described previously (Baxter et al., 2005b);
values were then transformed (log base 2) prior to comparison between other
sampling points. Detailed information is included in MIAME (http://
www.mpimp-golm.mpg.de/fernie).
MAPMAN Analyses
The 34 MapMan BINs currently used for the Arabidopsis (Arabidopsis
thaliana) MapMan classification (Thimm et al., 2004; Usadel et al., 2005) have
been adopted for tomato as defined by Urbanczyk-Wochniak et al. (2006). For
visualization, the data were loaded into MapMan, which displays individual
genes mapped on their pathways as false color-coded rectangles. The software
can be downloaded, as well as help obtained, from http://gabi.rzpd.de/
projects/MapMan. Moreover, its use is documented in the aforementioned
publications.
To facilitate comparison of the different colors, a legend explaining the
changes is included by MapMan, which associates the color representation
with the log fold changes in expression. Since MapMan uses an ontology to
display data, it sorts data by biological processes and displays them in a
group-wise format. For the time-course analysis presented here, we selected
some major processes and collated them in Figure 4. For our analysis, the
Mapping file SGN-UnigeneR2_commodity was used, which is freely avail-
able from within MapMan or from http://gabi.rzpd.de/database/java-bin/
MappingDownloader or converted to Excel format on request.
Heatmaps
Heatmaps were created using the ‘‘heatmap’’ module of the statistical
software Python IDLE (http://www.python.org/IDLE) version 1.1.1. False
color imaging was performed to visualize correlations between metabolites,
transcripts, and between metabolites and transcripts by applying Spearman
algorithm using SSPS software. Expression profile data clustering was done
on the log2-based relative expression values of the genes using EPCLUST
(http://ep.ebi.ac.uk/EP/EPCLUST/) with the correlation-based distance
measure and the average linkage clustering method. These are also available
as interactive figures at http://mapman.mpimp-golm.mpg.de/pageman/
outerspace/; these are zoomable if the Adobe SVG viewer is installed.
Moreover, moving the mouse over a given square reveals the parameters
under consideration.
Statistical Analysis
Microarray experiment slides were normalized with print tip loess and
moving minimum background subtraction using the Bioconductor limma
package framework (Gentleman et al., 2004). Microarray slides were subse-
quently scale normalized, adjusting the log ratios to have the same median
absolute deviation across arrays (Yang et al., 2002; Smyth and Speed, 2003).
Moderated t statistics were used to detect any genes likely to be differentially
expressing (Smyth, 2004). MAPMAN files were constructed from resulting
analysis log2 fold change values, where any poor quality spots created during
the experimental process were down-weighted essentially as described by
Urbanczyk-Wochniak et al. (2006). Gene-metabolite network analysis was
performed as described by Nikiforova et al. (2005).
Supplemental Data
The following materials are available in the online version of this article.
Supplemental Figure S1. Venn diagrams grouping flagged spots (if
median signal .2.5-fold local background) detected within the micro-
array experiment at different points of fruit development (P II, cell
division phase; P III, cell expansion phase; and P – IV using the
classification of Gillaspy et al. [1993]).
Supplemental Figure S2. Hierarchical cluster analysis of ubiquitous
transcripts.
Supplemental Figure S3. Heatmap surface of unknown transcript-metabolite
correlations.
Supplemental Figure S4. Heatmap surface of correlations between unknown
and categorized transcripts.
Supplemental Figure S5. Causally directed gene-metabolite correlation
network based of fruit development.
ACKNOWLEDGMENT
We thank Christian Kristukat for help with the Python IDLE software.
Received August 26, 2006; accepted October 17, 2006; published October 27,
2006.
LITERATURE CITED
Adams-Phillips L, Barry C, Giovannoni J (2004) Signal transduction
systems regulating fruit development. Trends Plant Sci 9: 331–338
Agius F, Gonzalez-Lemothe R, Caballero JL, Munoz-Blanco J, Botella MA,
Valpuesta V (2003) Engineering increased vitamin C levels in plants by
overexpression of a D-galacturonic acid reductase. Nat Biotechnol 21:
177–181
Alba R, Fei ZJ, Payton P, Liu Y, Moore SL, Debbie P, Cohn J, D’Ascenzo M,
Gordon JS, Rose JK, et al (2004) ESTs, cDNA microarrays, and gene
expression profiling: tools for dissecting plant physiology and devel-
opment. Plant J 39: 697–714
Alba R, Payton P, Fei Z, McQuinn R, Debbie P, Martin G, Tanksley SD,
Giovannoni JJ (2005) Transcriptome and selected metabolite analysis
reveal multiple points of ethylene regulatory control during tomato fruit
development. Plant Cell 17: 2954–2965
Albersheim P, Nevins DJ, English PD, Karr A (1967) A method for the
analysis of sugars in plant cell wall polysaccharides by gas-liquid
chromatography. Carbohydr Res 5: 340–345
Barry CS, Giovannoni JJ (2006) Ripening in the tomato Green-ripe mutant
is inhibited by ectopic expression of a protein that disrupts ethylene
signalling. Proc Natl Acad Sci USA 103: 7923–7928
Barry CS, McQuinn RP, Thompson AJ, Seymour GB, Grierson D, Giovannoni
JJ (2005) Ethylene insensitivity conferred by the Green-ripe and Never-ripe 2
ripening mutants of tomato. Plant Physiol 138: 267–275
Bartley GE, Scolnik PA, Giuliano G (1994) Molecular biology of carote-
noid biosynthesis in plants. Annu Rev Plant Physiol Plant Mol Biol 45:
287–301
Baxter CJ, Carrari F, Bauke A, Overy S, Hill SA, Quick PW, Fernie AR,
Sweetlove LJ (2005a) Fruit carbohydrate metabolism in an introgression
line of tomato with increased fruit soluble solids. Plant Cell Physiol 46:
425–437
Baxter CJ, Sabar M, Quick WP, Sweetlove LJ (2005b) Comparison of
changes in fruit gene expression in tomato introgression lines provides
evidence of genome wide transcriptional changes and reveals links to
mapped QTLs and described traits. J Exp Bot 56: 1591–1604
Beckles DM, Craig J, Smith AM (2001) ADPglucose pyrophosphorylase
is located in the plastid in developing tomato fruit. Plant Physiol 126:
261–266
Blasing OE, Gibon Y, Gunther M, Hohne M, Morcuende R, Osuna D,
Thimm O, Usadel B, Scheible WR, Stitt M (2005) Sugars and circadian
regulation make major contributions to the global regulation of diurnal
gene expression in Arabidopsis. Plant Cell 17: 3257–3281
Boggio SB, Palatnik JF, Heldt HW, Valle EM (2000) Changes in amino acid
composition and nitrogen metabolising enzymes in ripening fruits of
Lycopersicum esculentum Mill. Plant Sci 159: 125–133
Bologa KL, Fernie AR, Leisse A, Loureiro ME, Geigenberger P (2003) A
bypass of sucrose synthase leads to low internal oxygen and impaired
metabolic performance in growing potato tubers. Plant Physiol 132:
2058–2072
Broeckling CD, Huhman DV, Farag MA, Smith JT, May GD, Mendes P,
Dixon RA, Sumner LW (2005) Metabolic profiling of Medicago trunca-
tula cell cultures reveals the effects of biotic and abiotic elicitors on
metabolism. J Exp Bot 56: 323–336
Carbone F, Pizzichini D, Giuliano G, Rosati C, Perrotta G (2005) Com-
parative profiling of tomato fruits and leaves evidences a complex
modulation of global transcript profiles. Plant Sci 169: 165–175
Carrari et al.
1394 Plant Physiol. Vol. 142, 2006 www.plantphysiol.orgon May 5, 2020 - Published by Downloaded from
Copyright © 2006 American Society of Plant Biologists. All rights reserved.

Carrari F, Fernie AR (2006) Metabolic regulation underlying tomato fruit
development. J Exp Bot 57: 1883–1897
Carrari F, Fernie AR, Iusem ND (2004) Heard it through the grapevine?
ABA and sugar cross-talk: the ASR story. Trends Plant Sci 9: 57–59
Carrari F, Nunes-Nesi A, Gibon Y, Lytovchenko A, Ehlers-Lourario M,
Fernie AR (2003) Reduced expression of aconitase results in an enhanced
rate of photosynthesis and marked shifts in carbon partitioning in
illuminated leaves of Lycopersicon pennellii. Plant Physiol 133: 1322–1335
Chen RD, Gadal P (1990) Do the mitochondria provide the 2-oxoglutarate
needed for glutamate synthesis in higher plant chloroplasts? Plant
Physiol Biochem 28: 141–145
Chen GP, Wilson ID, Kim SH, Grierson D (2001) Inhibiting expression of a
tomato ripening associated membrane protein increases organic acids
and reduces sugar levels of fruit. Planta 212: 799–807
Cheng GW, Huber DJ (1997) Carbohydrate solubilisation of tomato locule
tissue cell walls: parallels with locule tissue liquefaction during ripen-
ing. Physiol Plant 101: 51–58
Conklin PL, Gatzek S, Wheeler GL, Dowdle J, Raymond MJ, Rolinski S,
Isupov M, Littlechild JA, Smirnoff N (2006) Arabidopsis thaliana vtc4
encodes L-galactose-1-P phosphatase, a plant ascorbic acid biosynthetic
enzyme. J Biol Chem 281: 15662–15670
Davies JN (1965) The effect of the variety on the malic and citric acid content
of tomato fruit. Annu Rep Glasshouse Crops Res Inst 1964: 139–159
Davies JN (1966) Changes in the non-volatile organic acids of tomato fruit
during ripening. J Sci Food Agric 17: 396–340
Desbrosses GC, Kopka J, Udvardi MK (2005) Lotus japonicus metabolite
profiling: development of mass-spectral resources for the study of plant
microbe interactions. Plant Physiol 137: 1302–1318
Doicinovic D, Krosting J, Harris AJ, Wagner DJ, Rhoads DM (2004)
Identification of a region of the Arabidopsis AtAOX1 promoter neces-
sary for mitochondrial retrograde regulation of expression. Plant Mol
Biol 58: 159–175
Fei ZJ, Tang X, Alba RM, White JA, Ronning CM, Martin GB, Tanksley SD,
Giovannoni JJ (2004) Comprehensive EST analysis of tomato and
comparative genomics of fruit ripening. Plant J 40: 47–59
Fernie AR, Roscher A, Ratcliffe RG, Kruger NJ (2001) Fructose 2,6-
bisphosphate activates pyrophosphate: fructose-6-phosphate 1-phos-
photransferase and increases triose phosphate to hexose phosphate
cycling in heterotrophic cells. Planta 212: 250–263
Fernie AR, Tadmor Y, Zamir D (2006) Natural variation for improving crop
quality. Curr Opin Plant Biol 9: 196–202
Fernie AR, Trethewey RN, Krotzky AJ, Willmitzer L (2004) Metabolite
profiling: from diagnostics to systems biology. Nat Rev Mol Cell Biol 5:
763–769
Fernie AR, Willmitzer L (2001) Molecular and biochemical triggers of
potato tuber development. Plant Physiol 127: 1459–1465
Fraser P, Truesdale M, Bird C, Schuch W, Bramley P (1994) Carotenoid
biosynthesis during tomato fruit development: evidence for tissue-
specific gene expression. Plant Physiol 105: 405–413
Fridman E, Carrari F, Liu YS, Fernie AR, Zamir D (2004) Zooming in on a
quantitative trait for tomato yield using interspecific introgressions.
Science 305: 1786–1789
Gallardo F, Canton FR, GarciaGutierrez A, Canovas FM (1993) Changes in
photorespiratory enzymes and glutamate synthases in ripening toma-
toes. Plant Physiol Biochem 31: 189–196
Gallardo F, Galvez S, Gadal P, Canovas FM (1995) Changes in NADP1-
linked isocitrate dehydrogenase during tomato fruit ripening. Charac-
terization of the predominant cytosolic enzyme from green and ripe
pericarp. Planta 196: 148–154
Galvez S, Lancien M, Hodges M (1999) Are isocitrate dehydrogenases and
2-oxoglutarate involved in the regulation of glutamate synthesis?
Trends Plant Sci 4: 484–490
Geigenberger P, Fernie AR, Gibon Y, Christ M, Stitt M (2000) Metabolic
activity decreases as an adaptive response to low internal oxygen in
growing potato tubers. Biol Chem 270: 723–740
Gentleman RC, Carey VJ, Bates DM, Bolstad B, Dettling M, Dudoit S,
Ellis B, Gautier L, Ge Y, Gentry J, et al (2004) Bioconductor: open
software development for computational biology and bioinformatics.
Genome Biol 5: Article 80
Gibon Y, Blasing OE, Hannemann J, Carillo P, Hohne M, Hendriks JHM,
Palacios N, Cross J, Selbig J, Stitt M (2004) A robot-based platform
to measure multiple enzyme activities in Arabidopsis using a set of
cycling assays: comparison of changes of enzyme activities and tran-
script levels during diurnal cycles and in prolonged darkness. Plant Cell
16: 3304–3325
Gillaspy G, Ben-David HM, Gruissem W (1993) Fruits: a developmental
perspective. Plant Cell 5: 1439–1451
Giovannoni J (2004) Genetic regulation of fruit development and ripening.
Plant Cell (Suppl) 16: S170–S180
Giuliano G, Bartley G, Scholnik P (1993) Regulation of carotenoid bio-
synthesis during tomato fruit development. Plant Cell 5: 379–393
Goff SA, Ricke D, Lan TH, Presting G, Wang RL, Dunn M, Glazebrook J,
Sessions A, Oeller P, Varma H, et al (2002) A draft sequence of the rice
genome (Oryza sativa L. ssp. japonica). Science 296: 92–100
Gomez-Merino FC, Arana-Ceballos FA, Trejo-Tellez LI, Skirycz A,
Brearley CA, Mueller-Roeber B (2005) Arabidopsis AtDGK7, the
smallest member of plant diacylglycerol kinases (DGKs), displays
unique biochemical features and saturates at low substrate concentra-
tion: The DGK inhibitor R59022 differentially affects AtDGK2 and
AtDGK7 activity in vitro and alters plant growth and development.
J Biol Chem 280: 34888–34899
Grierson D, Slater A, Maunders M, Crookes P, Tucker GA, Schuch W,
Edwards K (1985) Control of ethylene synthesis and ripening by sense
and antisense genes in transgenic plants. In JA Roberts, GA Tucker, eds,
Ethylene and Plant Development. Butterworth, London, pp 147–161
Hadfield KA, Bennett AB (1998) Polygalacturonases: many genes in search
of a function. Plant Physiol 117: 337–343
He W, Miao F, Lin DC, Schwandner RT, Wang Z, Gao J, Chen JL, Tian H,
Ling L (2004) Citric acid cycle intermediates as ligands for orphan
G-protein-coupled receptors. Nature 429: 188–193
Herner R, Sink K (1973) Ethylene production and respiratory behaviour of
the rin mutant. Plant Physiol 52: 38–42
Ishikawa T, Dowdle J, Smirnoff N (2006) Progress in manipulating
ascorbic acid biosynthesis and accumulation in plants. Physiol Plant
126: 343–355
Ishizaki K, Larson TR, Schauer N, Fernie AR, Graham IA, Leaver CJ
(2005) The critical role of Arabidopsis electron-transfer flavoprotein:
ubiquinone oxidoreductase during dark-induced starvation. Plant Cell
17: 2587–2600
Jain AK, Nessler CL (2000) Metabolic engineering of an alternative path-
way for ascorbic acid biosynthesis in plants. Mol Breed 6: 73–78
Jeffery D, Goodenough PW, Weitzman PDJ (1986) Enzyme activities in
mitochondria isolated from ripening tomato fruit. Planta 168: 390–394
Kummel A, Panke S, Heinemann M (2006) Putative regulatory sites
unraveled by network-embedded thermodynamic analysis of metabo-
lome data. Mol Syst Biol (in press)
Lambeth VN, Fields ML, Huecker DG (1964) The sugar-acid ratio of
selected tomato varieties. Mo Agric Exp Stn Bull 850: 421–423
Lanahan M, Yen H, Giovannoni J, Klee H (1994) The never-ripe mutation
blocks ethylene perception in tomato. Plant Cell 6: 521–530
Lewinsohn E, Sitrit Y, Bar E, Azulay Y, Meir A, Zamir D, Tadmor Y (2005)
Carotenoid pigmentation affects the volatile composition of tomato and
watermelon fruits, as revealed by comparative genetic analysis. J Agric
Food Chem 53: 3142–3148
Liljegren SJ, Roeder AHK, Kempin SA, Gremski K, Ostergaard L, Guimil S,
Reyes DK, Yanofsky MF (2004) Control of fruit patterning in Arabi-
dopsis by INDEHISCENT. Cell 116: 843–853
Liu YS, Gur A, Ronen G, Causse M, Damidaux R, Buret M, Hirschberg J,
Zamir D (2003) There is more to tomato fruit colour than candidate
carotenoid genes. Plant Biotechnol J 1: 195–207
Lorence A, Chevone BI, Mendes P, Nessler CL (2004) myo-Inositol oxy-
genase offers a possible entry point into plant ascorbate biosynthesis.
Plant Physiol 134: 1200–1205
Miron D, Schaffer AA (1991) Sucrose phosphate synthase, sucrose syn-
thase, and invertase activities in developing fruit of Lycopersicum
esculentum Mill. and the sucrose accumulating Lycopersicon hirsutum
Humb. and Bonpl. Plant Physiol 95: 623–627
Morgenthal K, Wienkoop S, Scholz M, Selbig J, Weckwerth W (2005)
Correlative GC-TOF-MS based metabolite profiling and LC-MS based
protein profiling reveal time-related systemic regulation of metabolite-
protein networks and improve pattern recognition for multiple bio-
marker selection. Metabolomics 1: 109–121
Morikawa T, Mizutani M, Aoki N, Watanabe B, Saga H, Saito S, Oikawa A,
Suzuki H, Sakaurai N, Shibata D, et al (2006) Cytochrome
P450CYP710A encodes the sterol C-22 desaturase in Arabidopsis and
tomato. Plant Cell 18: 1008–1022
The Metabolism of Fruit Development
Plant Physiol. Vol. 142, 2006 1395 www.plantphysiol.orgon May 5, 2020 - Published by Downloaded from
Copyright © 2006 American Society of Plant Biologists. All rights reserved.
Mueller AL, Solow TH, Taylor N, Skwarecki B, Buels R, Bins J, Lin C,
Wright MH, Ahrens R, Wang Y, et al (2005) The SOL Genomics Network
(SGN): a comparative resource for Solanaceous biology and beyond.
Plant Physiol 138: 1310–1317
Muller-Moule P, Havaux M, Niyogi KK (2003) Zeaxanthin deficiency
enhances the high light sensitivity of an ascorbate-deficient mutant of
Arabidopsis. Plant Physiol 133: 748–760
Nikiforova V, Daub CO, Hesse H, Willmitzer L, Hoefgen R (2005)
Integrative gene-metabolite network with implemented causality deci-
phers informational fluxes of sulphur stress response. J Exp Bot 56:
1887–1896
Nguyen-Quoc B, Foyer CH (2001) A role for ‘‘futile cycles’’ involving
invertase and sucrose synthase in sucrose metabolism of tomato fruit. J
Exp Bot 52: 881–889
Obiadalla-Ali H, Fernie AR, Kossmann J, Lloyd JR (2004) Developmental
analysis of carbohydrate metabolism in tomato (Lycopersicon esculentum
cv. Micro-Tom) fruits. Physiol Plant 120: 1–9
Pecker I, Chamovitz D, Linden H, Sandmann G (1992) A single polypep-
tide catalyzing the conversion of phytoene to zeta-carotene is transcrip-
tionally regulated during tomato fruit ripening. Proc Natl Acad Sci USA
89: 4962–4966
Pir P, Kirdar B, Hayes A, Onsan ZY, Ulgen KO, Oliver SG (2006)
Integrative investigation of metabolic and transcriptomic data. BMC
Bioinformatics 7: Article 203
Ratcliffe RG, Shachar-Hill Y (2006) Measuring multiple fluxes through
plant metabolic networks. Plant J 45: 490–511
Robinson NL, Hewitt JD, Bennett AB (1988) Sink metabolism in tomato
fruit. 1. Developmental changes in carbohydrate metabolising enzymes.
Plant Physiol 87: 727–730
Roessner U, Luedemann A, Brust D, Fiehn O, Linke T, Willmitzer L,
Fernie AR (2001a) Metabolic profiling and phenotyping of genetically
and environmentally modified systems. Plant Cell 13: 131–142
Roessner U, Willmitzer L, Fernie AR (2001b) High-resolution metabolic
profiling: identification of phenocopies. Plant Physiol 127: 749–764
Roessner-Tunali U, Hegemann B, Lytovchenko A, Carrari F, Bruedigam C,
Granot D, Fernie AR (2003) Metabolic profiling of transgenic tomato
plants overexpressing hexokinase reveals that the influence of hexose
phosphorylation diminishes during fruit development. Plant Physiol
133: 84–99
Roessner-Tunali U, Liu J, Leisse A, Balbo I, Perez-Melis A, Willmitzer L,
Fernie AR (2004) Kinetics of labelling of organic and amino acids in
potato tubers by gas chromatography-mass spectrometry following
incubation in 13C labelled isotopes. Plant J 39: 668–679
Rohde A, Morreel K, Ralph J, Goeminne G, Hostyn V, de Rycke R,
Kushin S, van Doorsselaere J, Joseleau JP, Vuylsteke M, et al (2004)
Molecular phenotyping of the pal1 and pal2 mutants of Arabidopsis
thaliana reveals far-reaching consequences on carbohydrate metabo-
lism. Plant Cell 16: 2749–2771
Ronen G, Camel-Goren L, Zamir D, Hirschberg J (2000) An alternative
pathway to b-carotene formation in plant chromoplasts discovered by
map-based cloning of Beta and old-gold color mutations in tomato. Proc
Natl Acad Sci USA 97: 11102–11107
Rontein D, Dieuaide-Noubhani M, Dufourc EJ, Raymond P (2002) The
metabolic architecture of plant cells. Stability or central metabolism and
flexibility of anabolic pathways during the growth cycle of tomato cells.
J Biol Chem 277: 43948–43960
Rose JKC, Bashir S, Giovannoni JJ, Jahn MM, Saravanan RS (2004)
Tackling the plant proteome: practical approaches, hurdles and exper-
imental tools. Plant J 39: 715–733
Runquist M, Kruger NJ (1999) Control of gluconeogenesis by isocitrate
lyase in endosperm of germinating castor bean seedlings. Plant J 19:
423–431
Sakurai N, Nevins DJ (1993) Changes in physical properties and cell wall
polysaccharides of tomato (Lycopersicon esculentum) pericarp tissues.
Physiol Plant 89: 681–686
Schaffer AA, Petreikov M (1997) Sucrose to starch metabolism in tomato
fruit undergoing transient starch accumulation. Plant Physiol 113: 84–99
Schauer N, Semel Y, Roessner U, Gur A, Balbo I, Carrari F, Pleban T,
Perez-Melis A, Bruedigam C, Kopka J, et al (2006) Comprehensive
metabolic profiling and phenotyping of intraspecific introgression lines
for tomato improvement. Nat Biotechnol 24: 447–454
Scheible WR, Pauly M (2004) Glucosyltransferases and cell wall biosyn-
thesis: novel players and insights. Curr Opin Plant Biol 7: 285–295
Seymour G, Taylor J, Tucker G (1993) Biochemistry of Fruit Ripening.
Chapman and Hall, London
Smyth GK (2004) Linear models and empirical Bayes methods for assess-
ing differential expression in microarray experiments. Stat Appl Genet
Mol Biol 3: Article 3
Smyth GK, Speed TP (2003) Normalization of cDNA microarray data.
Methods 31: 265–273
Stevens MA (1972) Relationships between components contributing to
quality variation among tomato lines. J Am Soc Hortic Sci 97: 70–76
Sweetlove LJ, Fernie AR (2005) Regulation of metabolic networks: under-
standing metabolic complexity in the systems biology era. New Phytol
168: 9–23
Ter Kuile BH, Westerhoff HV (2001) Transcriptome meets metabolome:
hierarchical and metabolic regulation of the glycolytic pathway. FEBS
Lett 500: 169–171
Thayer SS, Bjorkman O (1990) Leaf xanthophylls content and composi-
tion in sun and shade determined by HPLC. Photosynth Res 23:
331–343
Thimm O, Blassing O, Gibon Y, Nagel A, Meyer S, Kruger P, Selbig J,
Muller LA, Rhee SY, Stitt M (2004) MAPMAN: a user-driven tool to
display genomics data sets onto diagrams of metabolic pathways and
other biological processes. Plant J 37: 914–939
Tieman D, Taylor M, Schauer N, Fernie AR, Hanson AD, Klee HJ (2006)
Tomato aromatic amino acid decarboxylases participate in synthesis of
the flavor volatiles 2-phenylethanol and 2-phenylacetaldehyde. Proc
Natl Acad Sci USA 103: 8287–8292
Tohge T, Nishiyama Y, Hirai MY, Yano M, Nakajima J, Awazuhara M,
Inoue E, Takahashi H, Goodenowe DB, Kitayama M, et al (2005)
Functional genomics by integrated analysis of metabolome and tran-
scriptome of Arabidopsis plants over-expressing an MYB transcription
factor. Plant J 42: 218–235
Urbanczyk-Wochniak E, Baxter C, Kolbe A, Kopka J, Sweetlove LJ,
Fernie AR (2005) Profiling of diurnal patterns of metabolite and tran-
script abundance in potato (Solanum tuberosum) leaves. Planta 221:
891–903
Urbanczyk-Wochniak E, Luedemann A, Kopka J, Selbig J, Roessner-
Tunali U, Willmitzer L, Fernie AR (2003) Parallel analysis of transcript
and metabolite profiles: a new approach in systems biology. EMBO Rep
4: 989–993
Urbanczyk-Wochniak E, Usadel B, Thimm O, Nunes-Nesi A, Carrari F,
Davy M, Blasing O, Kowalczyk M, Weicht D, Polinceusz A, et al (2006)
Conversion of MapMan to allow the analysis of transcript data from
Solanaceous species: effects of genetic and environmental alterations in
energy metabolism in the leaf. Plant Mol Biol 60: 773–792
Usadel B, Nagel A, Thimm O, Redestig H, Blaesing OE, Palacios-Rojas N,
Selbig J, Hannemann J, Piques MC, Steinhauser D, et al (2005)
Extension of the visualization tool MapMan to allow statistical analysis
of arrays display of corresponding genes and comparison with known
responses. Plant Physiol 138: 1195–1204
Van der Hoeven R, Ronning C, Giovannoni J, Martin G, Tanksley S (2002)
Deductions about the number, organization, and evolution of genes in
the tomato genome based on analysis of a large expressed sequence tag
collection and selective genomic sequencing. Plant Cell 14: 1441–1456
Vrebalov J, Ruezinsky D, Padmanabhan V, White R, Medrano D, Drake R,
Schuch W, Giovannoni J (2002) A MADS-box gene necessary for fruit
ripening at the tomato ripening-inhibitor (Rin) locus. Science 296: 343–346
Wolucka BA, Van Montagu M (2003) GDP-mannose 3#,5#-epimerase forms
GDP-L-gulose, a putative intermediate for the de novo biosynthesis of
vitamin C in plants. J Biol Chem 278: 47483–47490
Yang YH, Dudoit S, Luu P, Lin DM, Peng V, Ngai J, Speed TP (2002)
Normalization for cDNA microarray data: a robust composite method
addressing single and multiple slide systematic variation. Nucleic Acids
Res 30: e15
Yelle S, Chetelat RT, Dorais M, Deverna JW, Bennett AB (1991) Sink
metabolism in tomato fruit. 4. Genetic and biochemical analysis of
sucrose accumulation. Plant Physiol 95: 1026–1035
Zarkovic J, Anderson SL, Rhoads DM (2005) A reporter system used to
study developmental expression of alternative oxidase and isolate
mitochondrial retrograde regulation mutants in Arabidopsis. Plant
Mol Biol 57: 871–888
Zou LP, Li HX, Ouyang B, Zhang JH, Ye ZB (2006) Cloning and mapping of
genes involved in tomato ascorbic acid biosynthesis and metabolism.
Plant Sci 170: 120–127
Carrari et al.
1396 Plant Physiol. Vol. 142, 2006 www.plantphysiol.orgon May 5, 2020 - Published by Downloaded from
Copyright © 2006 American Society of Plant Biologists. All rights reserved.