integrated assessment modelling activities in india in 2014-15 · 2020. 2. 6. · integrated...
TRANSCRIPT

Integrated Assessment Modelling Activities in India in 2014-15
P.R. ShuklaIndian Institute of ManagementAhmedabad, India
Shivika MittalNational Institute for Environmental StudiesTsukuba, Japan
Presented in The 21th AIM International WorkshopNational Institute for Environment Studies, Tsukuba, Japan Nov 13-14, 2015

Overview of Activities (2014-15)
1. Research and Dissemination• Modelling exercises
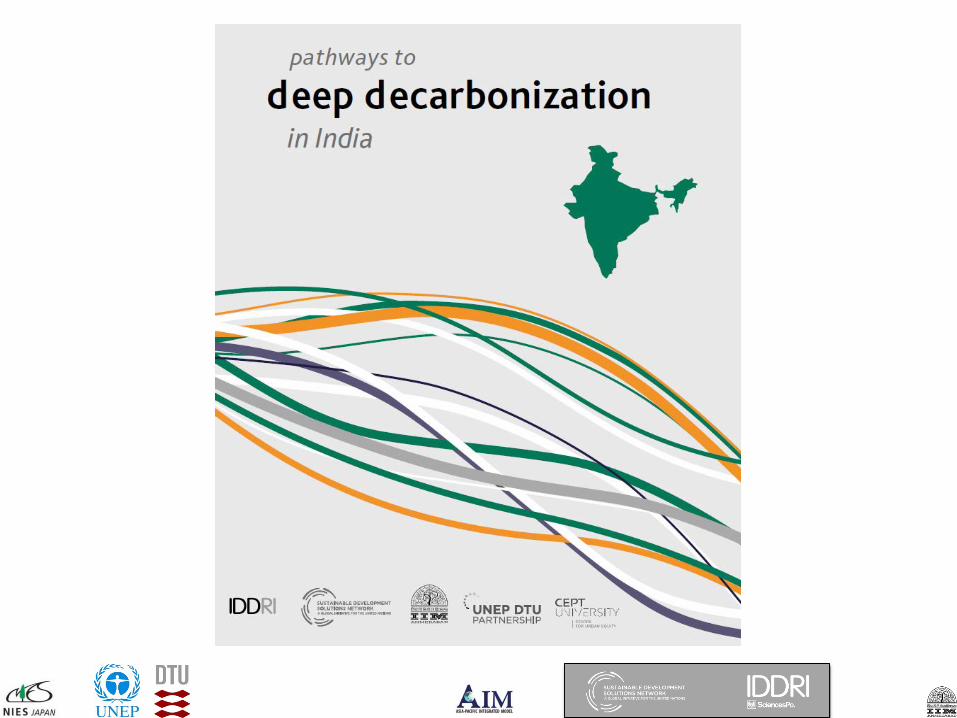
INDC National Level-Deep Decarbonization Pathways Project (DDPP) Sectoral & Sub-National Level Assessments
• LCS-RNet and LOCAR-Net: Linking Research & International Policymaking
2. Year 2015-16: Way Forward

INDC Target (Quantitative)
Base year: 2005Target year: 2030
Quantitative Features:1. 33-35% reduction of CO2 Intensity of GDP
2. 40% Electric Power Capacity from non-fossil sources
3. Additional Carbon Sink (2.5 to 3 Bil. Ton of CO2 by 2030)
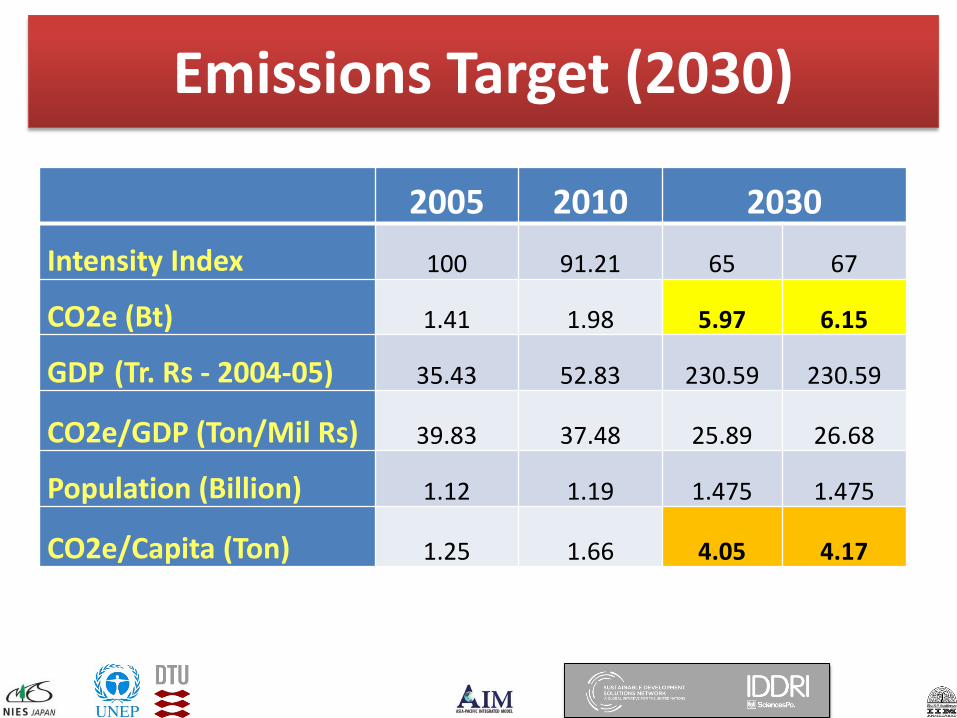
Emissions Target (2030)
2005 2010 2030Intensity Index 100 91.21 65 67
CO2e (Bt) 1.41 1.98 5.97 6.15
GDP (Tr. Rs - 2004-05) 35.43 52.83 230.59 230.59
CO2e/GDP (Ton/Mil Rs) 39.83 37.48 25.89 26.68
Population (Billion) 1.12 1.19 1.475 1.475
CO2e/Capita (Ton) 1.25 1.66 4.05 4.17
NATIONAL LEVEL
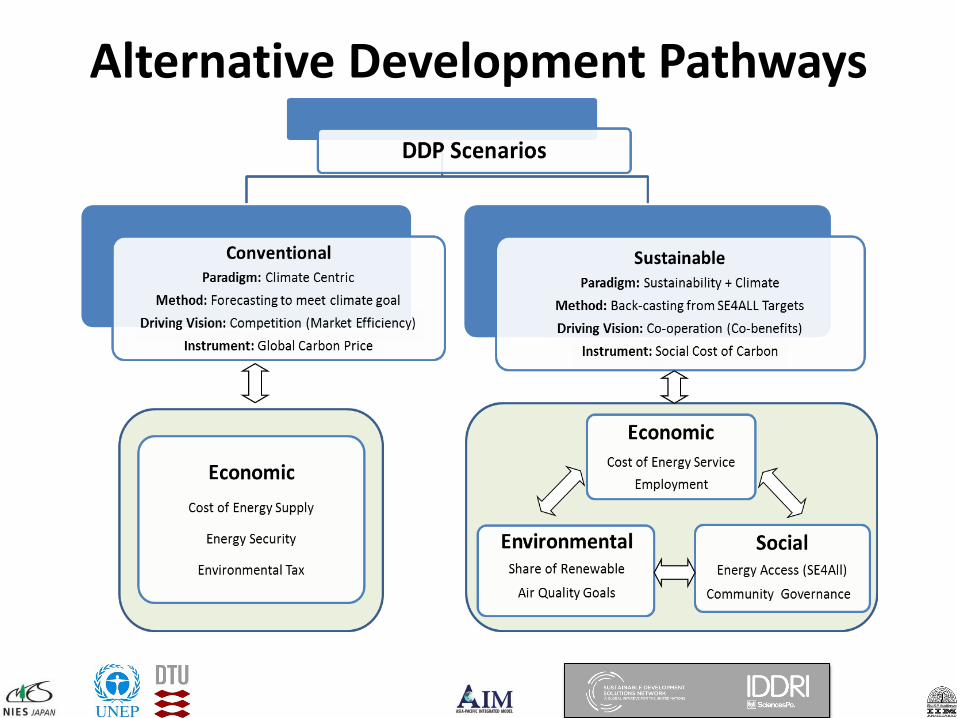
Alternative Development Pathways
0
500
1000
1500
2000
2500
3000
3500
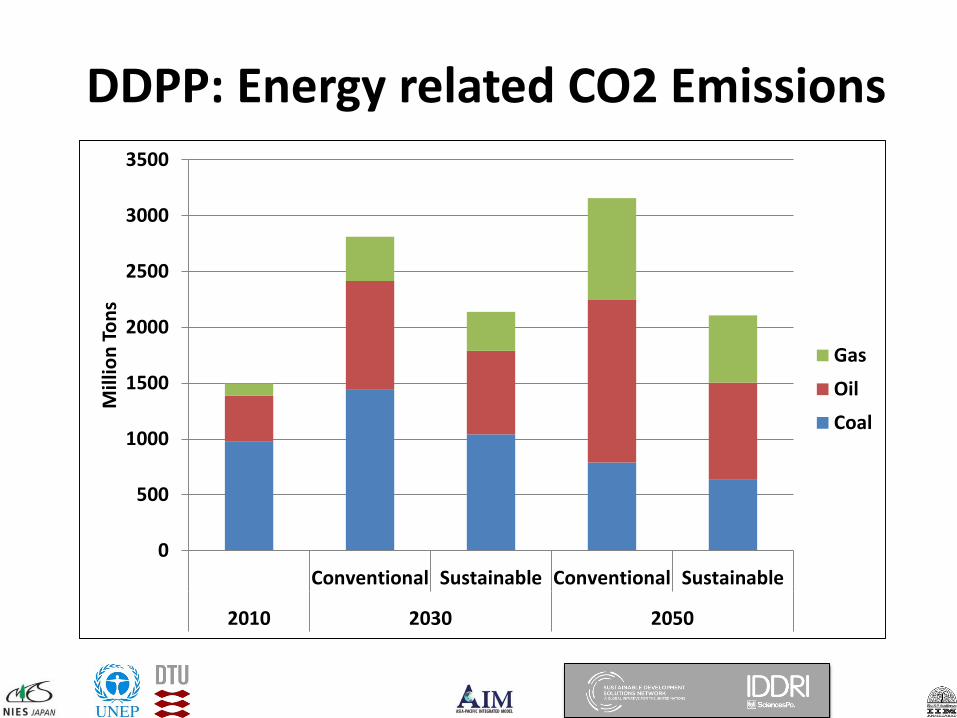
Conventional Sustainable Conventional Sustainable
2010 2030 2050
Mill
ion
Tons
Gas
Oil
Coal
DDPP: Energy related CO2 Emissions

0
500
1000
1500
2000
2500
3000
3500
Conventional Sustainable Conventional Sustainable
2010 2030 2050
Mt C
O2 Agriculture
Transport
Industry
Commercial
Residential
DDPP: CO2 Emissions by Sector

Air Pollution & Energy Security Co-benefitss

2020 2030 2040 2050
CO2 saved (Million tCO2) 370.6 671.8 918.9 1049.4Revenue from CO2 saved(Bn US $ 2010) 16.6 45.1 82.3 152.9
Revenue as % of GDP 0.6% 0.8% 0.8% 0.7%
Revenues from carbon saved in Sustainable Scenario
Co-benefits: Social Value of Carbon

SECTORAL & SUB-NATIONAL LEVEL

Air pollution co-benefits of low carbon policies in road transport : a subnational assessment for India

Industrialized and economically Advanced
regionsLess developed regions
Passenger Transport Demand
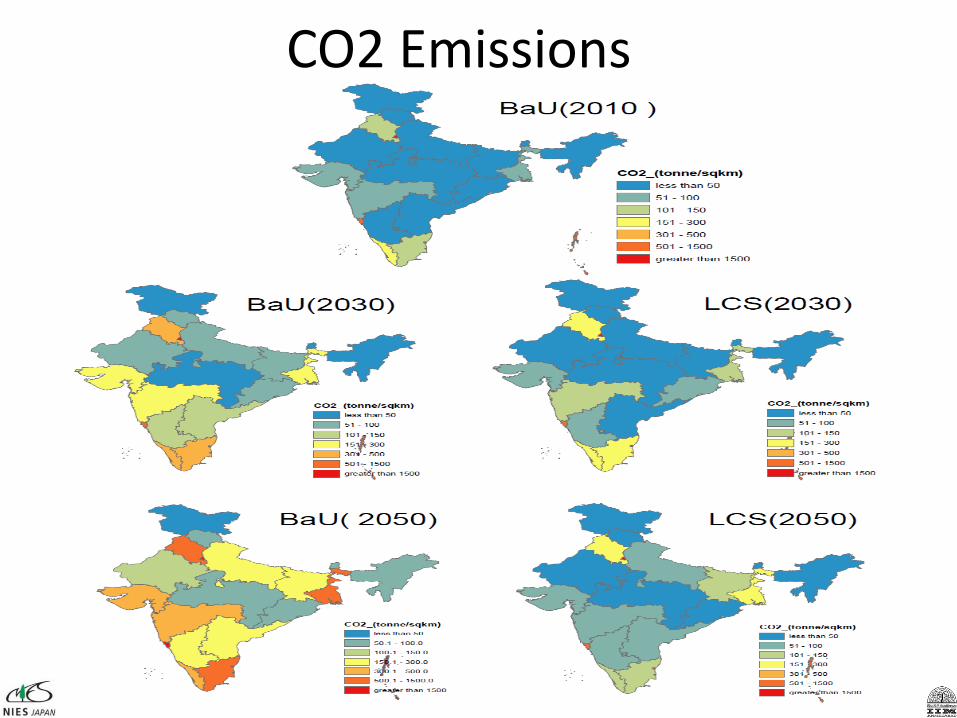
CO2 Emissions
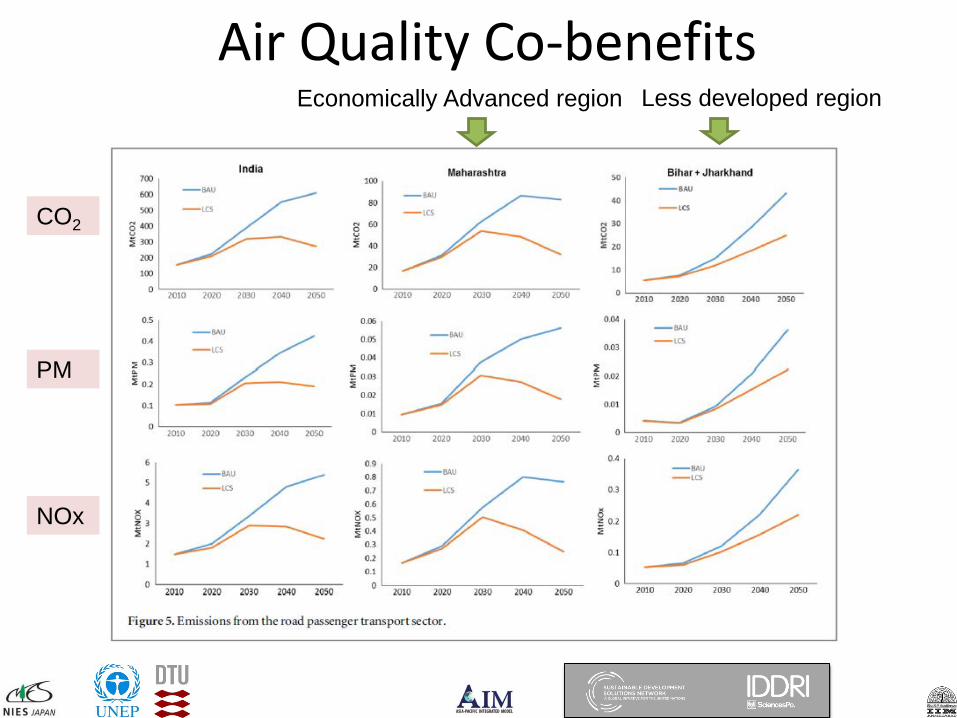
Economically Advanced region Less developed region
CO2
PM
NOx
Air Quality Co-benefits

Low carbon urban transport scenarios for China and India: A comparative assessment

Urban Passenger Transport Demand

Technology Mix

Energy MixChina India

Year 2015-16: Way Forward1. India national and subnational Low Carbon Scenarios and Plans to align
with Global Stabilization Target
2. Comparative Cross-country Assessments
3. Cooperation during Participation in International Projects
• MILES Project• Deep Decarbonization Pathways Project (DDPP)• CD-Links Project
4. New research agenda related to sustainable development and climate change
5. Capacity Building and Dissemination
Thank You