integrated assessment of the tameside local plan metropolitan borough council integrated assessment...
TRANSCRIPT
Tameside Metropolitan Borough Council
Integrated Assessment of the Tameside Local Plan
Scoping Report
March 2017
Amec Foster Wheeler Environment
& Infrastructure UK Limited


ii © Amec Foster Wheeler Environment & Infrastructure UK Limited
March 2017 Doc Ref. bri005ir
Non-Technical Summary
Introduction
This Non-Technical Summary (NTS) provides an overview of the Scoping Report produced as part of the
Integrated Assessment (IA) of the new Tameside Local Plan (the Local Plan) that is currently being prepared
by Tameside Metropolitan Borough Council (the Council). The IA will include a Sustainability Appraisal (SA),
Strategic Environmental Assessment (SEA), Equalities Impact Assessment (EqIA) and Health Impact
Assessment (HIA) and will assess the environmental, social and economic performance of the Local Plan.
The Scoping Report sets out the proposed approach to undertaking the IA of the emerging Local Plan. It
provides an opportunity for statutory consultees (Natural England, the Environment Agency and Historic
England) as well as other bodies and the public to comment on the scope of the IA and the level of detail that
should be included within the assessment and subsequent IA Reports.
The following sections of this NTS:
provide an overview of the Local Plan;
describe the scope of the IA and the key stages in the IA process;
summarise the key economic, social and environmental issues relevant to the assessment of
the Local Plan;
outline the proposed approach to undertaking the assessment of the Local Plan; and
set out the next steps in the IA process including how to respond to consultation on the
Scoping Report.
The Scoping Report and this NTS have been prepared by Amec Foster Wheeler Environment and
Infrastructure UK Ltd (Amec Foster Wheeler).
What is The Tameside Local Plan?
The Tameside Local Plan will reflect National Policy, guidance and the strategic context provided by the
emerging Greater Manchester Spatial Framework (GMSF) as it evolves. It will set out the vision, objectives,
local planning policies and site allocations that will guide development in the Borough up to at least 2035.
Once adopted, the Local Plan will replace the saved policies of the Tameside Unitary Development Plan
(UDP) 2004.
Development of the Local Plan will be informed by ongoing consultation, evidence gathering and
assessment (including IA) before it is submitted for Examination in Public. The Council expects to adopt the
Local Plan in Autumn 2019.
The Council’s timetable for preparation of the Local Plan is contained in Table NTS.1.

iii © Amec Foster Wheeler Environment & Infrastructure UK Limited
March 2017 Doc Ref. bri005ir
Table NTS.1 Local Plan Preparation Milestones
Local Plan Development Stage Timetable
Regulation 18 Notification January to March 2017
Consultation on Draft Local Plan August 2017 to September 2017
Publication of Submission Draft Local Plan and Public Consultation
May 2018 to June 2018
Submission of the Local Plan November 2018
Public Examination March to April 2019
Formal Adoption Autumn 2019
Further information in respect of the preparation of the Local Plan is set out in Section 1.3 of the
Scoping Report and is available via the Council’s website:
http://www.tameside.gov.uk/planning/tamesidelocalplan
What is Integrated Assessment?
Consistent with the approach being taken to the development of the GMSF, the Council has determined to
undertake an IA of the Local Plan that is to include SA, SEA, EqIA and HIA. The requirements relating to
each assessment are discussed in-turn below.
Sustainability Appraisal and Strategic Environmental Assessment
National planning policy1 states that local plans are key to delivering sustainable development and that they
must be prepared with the objective of contributing to the achievement of sustainable development.
Sustainable development is that which seeks to strike a balance between economic, environmental and
social factors to enable people to meet their needs without compromising the ability of future generations to
meet their own needs.
It is therefore very important that the Local Plan contributes to a sustainable future for the Borough. To
support this objective, the Council is required to carry out a Sustainability Appraisal (SA) of the Local Plan2.
SA is a means of ensuring that the likely social, economic and environmental effects of the Local Plan are
identified, described and appraised and also incorporates a process set out under a European Directive3 and
related UK regulations4 called Strategic Environmental Assessment (SEA).
Equalities Impact Assessment
The Public Sector Equality Duty contained in Section 149 of the Equality Act 2010 requires public authorities
to have due regard to a number of equality considerations when exercising their functions. EqIA is not
required by law, but it is a way of ensuring that the Public Sector Equality Duty, alongside requirements
under the Race Relations (Amendment) Act 2000 and Disability Discrimination Act 2005, have been
complied with by considering the effect of Council services, practices and policies (such as the Local Plan)
on different groups protected from discrimination by the Equality Act. It is a tool that can help local
authorities ensure that their policies and decisions do not discriminate, that they promote equality wherever
possible and that they foster good community relations.
1 See paragraph 150-151 of the National Planning Policy Framework (Department for Communities and Local Government, 2012). 2 The requirement for SA of local plans is set out under section 19(5) of the Planning and Compulsory Purchase Act 2004. 3 Directive 2001/42/EC on the assessment of the effects of certain plans and programmes on the environment. 4 Environmental Assessment of Plans and Programmes Regulations 2004 (statutory instrument 2004 No. 1633).
iv © Amec Foster Wheeler Environment & Infrastructure UK Limited
March 2017 Doc Ref. bri005ir
Carrying out EqIA involves assessing the likely effects of policies on “protected characteristics” as defined in
the Equality Act (the protected characteristics or groups are: age; disability; gender reassignment; marriage
and civil partnership; pregnancy and maternity; race; religion or belief; sex; and sexual orientation).
To ensure the IA meets the requirements of EqIA, it will consider whether there is potential for the Local Plan
to affect people differently based on the protected characteristics. This is reflected in the considerations for
IA assessment and in the IA Framework. Furthermore, consideration of equality issues within the IA will be
supported by an equality screening assessment that will be presented as an appendix to the subsequent IA
Reports.
Health Impact Assessment
There is no statutory requirement to undertake HIA as part of the plan-making process. However, HIA can
support decision making by predicting the health consequences of proposals, helping to ensure that plans
and policies avoid or minimise negative, and maximise positive, health impacts.
Department of Health (DOH) guidance5 on HIA states that “the determinants of health are the focus of HIA.
They are the social, economic, environmental and cultural factors that indirectly influence health and
wellbeing. They include what we eat and drink; where we live and work; and the social relationships and
connections we have with other people and organisations”. The determinants of health referred to in the
DOH guidance have been used to inform the IA Framework, guiding how the IA will assess the health
impacts of the Local Plan. Subsequent HIA stages align with those of the IA. As such, by including
consideration of health alongside other environmental, sustainability and equality considerations, the IA will
cover the scope of a HIA. Additionally, the Local Plan will be subject to initial HIA screening.
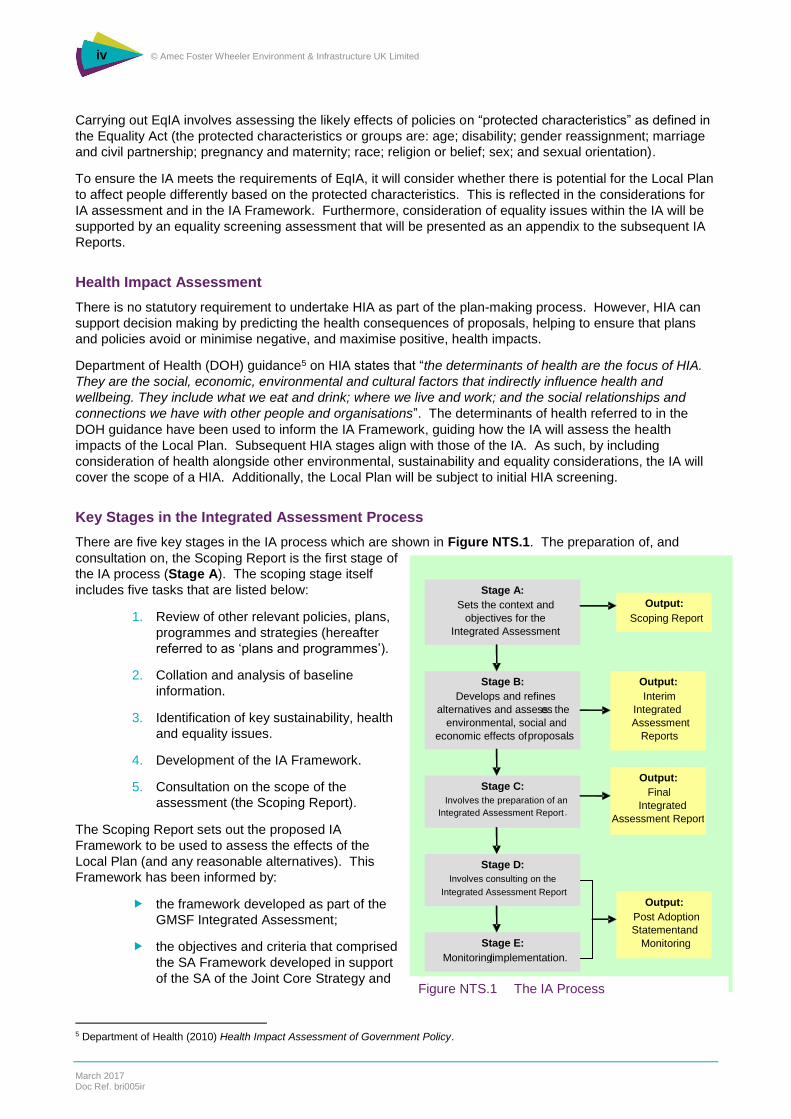
Key Stages in the Integrated Assessment Process
There are five key stages in the IA process which are shown in Figure NTS.1. The preparation of, and
consultation on, the Scoping Report is the first stage of
the IA process (Stage A). The scoping stage itself
includes five tasks that are listed below:
1. Review of other relevant policies, plans,
programmes and strategies (hereafter
referred to as ‘plans and programmes’).
2. Collation and analysis of baseline
information.
3. Identification of key sustainability, health
and equality issues.
4. Development of the IA Framework.
5. Consultation on the scope of the
assessment (the Scoping Report).
The Scoping Report sets out the proposed IA
Framework to be used to assess the effects of the
Local Plan (and any reasonable alternatives). This
Framework has been informed by:
the framework developed as part of the
GMSF Integrated Assessment;
the objectives and criteria that comprised
the SA Framework developed in support
of the SA of the Joint Core Strategy and
5 Department of Health (2010) Health Impact Assessment of Government Policy.
Stage A:
Sets the context and objectives for the
Integrated Assessment
Stage B: Develops and refines
alternatives and assess es the environmental, social and
economic effects of proposals .
Stage C: Involves the preparation of an
Integrated Assessment Report .
Output: Scoping Report
Stage E: Monitoring / implementation.
Stage D: Involves consulting on the
Integrated Assessment Report
Output: Interim
Integrated Assessment
Reports
Output: Post Adoption Statement and
Monitoring
Output: Final
Integrated Assessment Report
Figure NTS.1 The IA Process

v © Amec Foster Wheeler Environment & Infrastructure UK Limited
March 2017 Doc Ref. bri005ir
Development Management Policies DPD;
a review of plans and programmes;
baseline analysis and the identification of key sustainability (including health and equality)
issues;
the determinants of health; and
the equality considerations set out in the Equality Act 2010.
Following the conclusion of scoping consultation, the IA Framework will be amended to take into account
consultation responses as appropriate.
The revised IA Framework will be used to assess the effects of the emerging Local Plan (Stage B). This
stage is iterative and will involve the development and refinement of the Local Plan by testing the
sustainability, health and equality strengths and weaknesses of the emerging Plan options. In this respect,
IA will be undertaken throughout the preparation of the Local Plan with the findings presented in a series of
interim IA Reports to accompany the publication of, and consultation on, the various iterations of the draft
Local Plan.
At Stage C, a final IA Report will be prepared to accompany the submission draft Local Plan. This will be
available for consultation alongside the draft Local Plan itself prior to consideration by an independent
planning inspector at an Examination in Public (Stage D).
Following Examination in Public, and subject to any significant changes to the draft Local Plan that may
require assessment, the Council will issue a Post Adoption Statement as soon as reasonably practicable
after the adoption of the Local Plan. This will set out the results of the consultation and IA processes and the
extent to which the findings of the IA have been accommodated in the adopted Local Plan. During the
period of the Local Plan, the Council will monitor its implementation and any significant social, economic and
environmental effects (Stage E).
Section 1.4 of the Scoping Report describes in further detail the scope of the IA and the key stages in
the assessment process.
What are the Key Sustainability, Health and Equality Issues for the Local Plan?
Based on a review of other plans and programmes relevant to the Local Plan and an analysis of the
characteristics of the Borough, a number of key sustainability, health and equality issues relevant to the
Local Plan have been identified. These issues are summarised in Table NTS.2 below.
Table NTS.2 Key Sustainability, Health and Equality Issues Relevant to the Local Plan
Topic Key Sustainability, Health and Equality Issues
Population and Demographics The need to meet future requirements for housing including for a mix of accommodation types and tenures.
The need to meet the needs of an ageing population.
The need to ensure that the needs of different ethnic groups are met and that community cohesion is fostered.
Housing The need to provide an adequate supply of land for housing to meet the requirements set out in the GMSF.
The need to ensure the delivery of an appropriate range of housing types and tenures to meet local needs.
The need to make best use of, and where appropriate improve, the quality of the existing housing stock including bringing empty properties back into use.
The need to address homelessness in the Borough.
The need to make appropriate provision for Gypsies, Travellers and Travelling Showpeople.

vi © Amec Foster Wheeler Environment & Infrastructure UK Limited
March 2017 Doc Ref. bri005ir
Topic Key Sustainability, Health and Equality Issues
Economy The need to provide sufficient employment land in locations well served by transport and other infrastructure and in locations attractive to the market, particularly in the key growth sectors.
The need to facilitate the growth of an appropriately educated and skilled workforce.
The need to support the development of innovative and knowledge-based businesses.
The need to support the growth and development of existing businesses.
The need to increase local employment opportunities.
The need to support the expansion of the manufacturing sector.
The need to maintain and enhance the vitality and viability of the Borough's town centres.
Health and Wellbeing The need to enhance the health and wellbeing of Tameside's population.
The need to tackle inequalities in health.
The need to ensure appropriate open space provision across Tameside.
The need to reduce crime levels, minimise risk and increase community safety.
The need to ensure appropriate health care facilities and services are available and accessible to meet needs arising from new development and anticipated population growth.
The need to plan for an ageing population.
Education and Skills The need to raise educational attainment and skills.
The need to ensure that educational facilities meet the changing demands of the population and the economy.
Deprivation The need to address the many causes of deprivation within the Borough.
The need to specifically tackle deprivation and promote regeneration in the Borough's most deprived communities.
The need to promote social inclusion and reduce inequality.
Transport and Accessibility The need to ensure timely investment in transport infrastructure and services to accommodate anticipated growth.
The need to support proposals contained in the TFGM Greater Manchester Transport Strategy 2040 and those identified by Highways England to address highways capacity issues in the Borough.
The need to capitalise on the Borough's good transport accessibility links to Manchester Airport and the proposed transport interchange and potential new Droylsden railway station.
The need to encourage alternative modes of transport to the private car.
The need to ensure that new development is accessible to community facilities and services and jobs so as to reduce the need to travel.
The need to encourage walking and cycling.
The need to protect and enhance the PRoW network in the Borough.
Biodiversity and Green Infrastructure
The need to conserve and enhance biodiversity including sites with international, national and local designations for their nature conservation value.
The need to maintain, restore and expand, where appropriate, the Borough's priority habitats.
The need to recognise the key role that green infrastructure plays in supporting wellbeing and climate change resilience.
The need to enhance the green infrastructure network, ensuring adequate provision, improving accessibility and encouraging multiple uses where appropriate.
Land Use, Geology and Soil The need to encourage development on previously developed (brownfield) land.
The need to make best use of existing buildings and infrastructure.
The need to protect the limited areas of best and most versatile agricultural land in the Borough from inappropriate development.
The need to protect and enhance sites designated for their geological interest.
Water The need to protect and enhance the quality of the Borough's water resources.
The need to promote the efficient use of water resources.
The need to ensure the timely provision of new water services infrastructure to meet demand arising from new development.
The need to locate new development away from areas of flood risk, taking into account the effects of climate change.
The need to encourage the use of Sustainable Drainage Systems.
The need to appropriately manage surface water.
Air Quality The need to minimise the emission of pollutants to air.
The need to improve air quality, particularly in the Greater Manchester AQMA.

vii © Amec Foster Wheeler Environment & Infrastructure UK Limited
March 2017 Doc Ref. bri005ir
Topic Key Sustainability, Health and Equality Issues
Climate Change The need to ensure that new development is able to adapt to the effects of climate change.
The need to mitigate climate change including through increased renewable energy provision.
The need to contribute to the Greater Manchester target of reducing CO2 emissions by 48% by 2020.
Material Assets The need to minimise waste arisings and encourage reuse and recycling.
The need to promote the efficient use of mineral resources, recognising that the Greater Manchester area is reliant on minerals won in other MPAs.
The need to ensure the protection of the Borough's mineral resources in accordance with the Great Manchester Joint Minerals Plan (2013).
The need to promote resource efficiency through sustainable design and construction techniques to minimise resource depletion and waste creation.
Cultural Heritage The need to protect and enhance Tameside's cultural heritage assets, including industrial heritage assets, and their settings.
The need to avoid harm to designated heritage assets and their settings.
The need to recognise the value of non-designated heritage assets where appropriate.
The need to tackle heritage at risk.
The need to recognise the positive contribution made by the historic environment to the character of landscapes and townscapes.
Landscape and Townscape The need to conserve and enhance Tameside's distinctive landscape and townscape character.
The need to promote high quality design that respects local character.
The need to maximise opportunities associated with new development to enhance townscape character and the quality of urban environments.
The key sustainability, health and equality issues listed in Table NTS.2 above have informed the framework
that will be used to assess the effects of the Local Plan.
Section 2 of the Scoping Report summarises the review of plans and programmes relevant to the
Local Plan that is contained at Appendix B. Section 3 and Appendix C present the socio-economic
and environmental baseline conditions for the Borough, along with how these conditions are likely to
change in the future without the Local Plan.
What is the Proposed IA Framework?
The main purpose of the scoping stage of the IA is to identify the framework for the assessment of the Local
Plan. The framework contains a series of objectives and guide questions developed to reflect both the
current socio-economic and environmental issues which may affect (or be affected by) the Local Plan and
the objectives contained within other plans and programmes. Table NTS.3 presents the proposed IA
Framework for the Local Plan.
Table NTS.3 Proposed IA Framework
IA Objective Guide Questions
Will the Local Plan…
SEA Directive
Topic(s)
1. Housing: To provide a sustainable supply of housing land and an appropriate mix of sizes, types and tenures to meet housing need.
Meet the Borough’s objectively assessed housing need (consistent with the requirements of the Greater Manchester Spatial Framework), providing a range of housing types, tenures and sizes to meet current and emerging need for market and affordable housing?
Reduce homelessness?
Reduce the number of unfit homes?
Make best use of the Borough’s existing housing stock?
Help to ensure the provision of good quality, well designed homes?
Population
viii © Amec Foster Wheeler Environment & Infrastructure UK Limited
March 2017 Doc Ref. bri005ir
IA Objective Guide Questions
Will the Local Plan…
SEA Directive
Topic(s)
Ensure housing land is well-connected with employment land, centres and green space or co-located where appropriate?
Deliver pitches/plots required for Gypsies, Travellers and Travelling Showpeople?
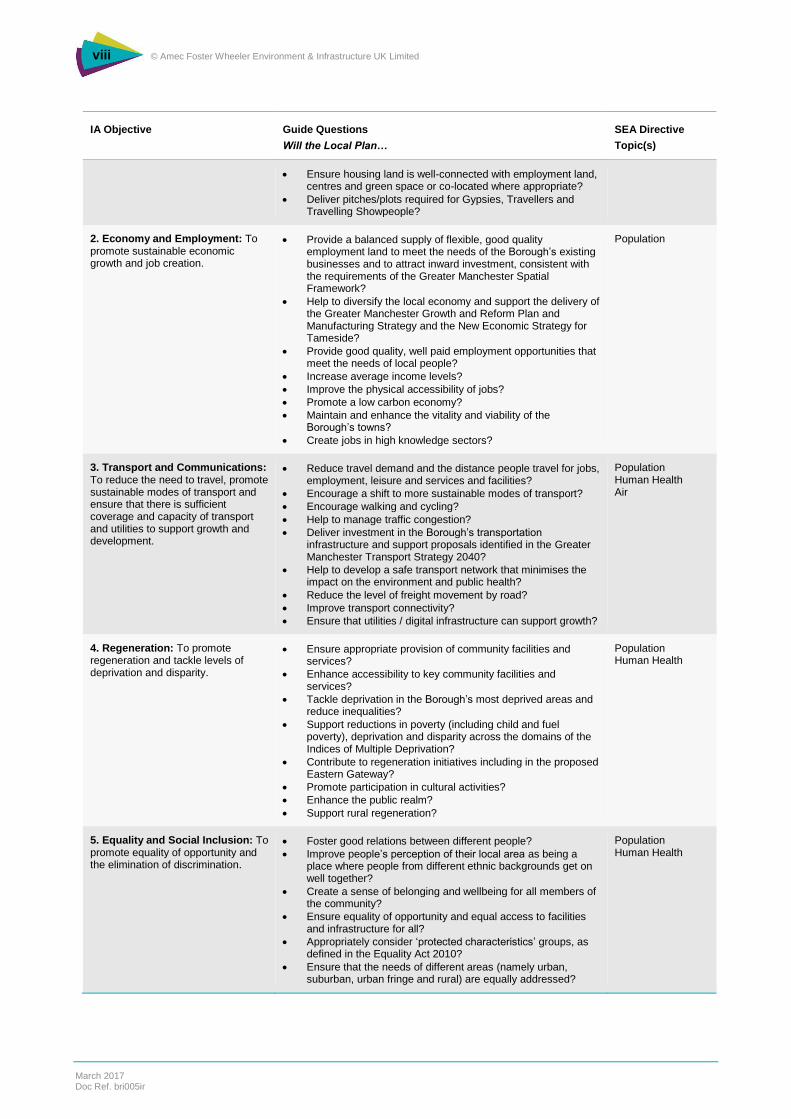
2. Economy and Employment: To promote sustainable economic growth and job creation.
Provide a balanced supply of flexible, good quality employment land to meet the needs of the Borough’s existing businesses and to attract inward investment, consistent with the requirements of the Greater Manchester Spatial Framework?
Help to diversify the local economy and support the delivery of the Greater Manchester Growth and Reform Plan and Manufacturing Strategy and the New Economic Strategy for Tameside?
Provide good quality, well paid employment opportunities that meet the needs of local people?
Increase average income levels?
Improve the physical accessibility of jobs?
Promote a low carbon economy?
Maintain and enhance the vitality and viability of the Borough’s towns?
Create jobs in high knowledge sectors?
Population
3. Transport and Communications: To reduce the need to travel, promote sustainable modes of transport and ensure that there is sufficient coverage and capacity of transport and utilities to support growth and development.
Reduce travel demand and the distance people travel for jobs, employment, leisure and services and facilities?
Encourage a shift to more sustainable modes of transport?
Encourage walking and cycling?
Help to manage traffic congestion?
Deliver investment in the Borough’s transportation infrastructure and support proposals identified in the Greater Manchester Transport Strategy 2040?
Help to develop a safe transport network that minimises the impact on the environment and public health?
Reduce the level of freight movement by road?
Improve transport connectivity?
Ensure that utilities / digital infrastructure can support growth?
Population Human Health Air
4. Regeneration: To promote regeneration and tackle levels of deprivation and disparity.
Ensure appropriate provision of community facilities and services?
Enhance accessibility to key community facilities and services?
Tackle deprivation in the Borough’s most deprived areas and reduce inequalities?
Support reductions in poverty (including child and fuel poverty), deprivation and disparity across the domains of the Indices of Multiple Deprivation?
Contribute to regeneration initiatives including in the proposed Eastern Gateway?
Promote participation in cultural activities?
Enhance the public realm?
Support rural regeneration?
Population Human Health
5. Equality and Social Inclusion: To promote equality of opportunity and the elimination of discrimination.
Foster good relations between different people?
Improve people’s perception of their local area as being a place where people from different ethnic backgrounds get on well together?
Create a sense of belonging and wellbeing for all members of the community?
Ensure equality of opportunity and equal access to facilities and infrastructure for all?
Appropriately consider ‘protected characteristics’ groups, as defined in the Equality Act 2010?
Ensure that the needs of different areas (namely urban, suburban, urban fringe and rural) are equally addressed?
Population Human Health

ix © Amec Foster Wheeler Environment & Infrastructure UK Limited
March 2017 Doc Ref. bri005ir
IA Objective Guide Questions
Will the Local Plan…
SEA Directive
Topic(s)
6. Health and Wellbeing: To improve health and wellbeing and reduce health inequalities.
Avoid locating development in locations that could adversely affect people’s health?
Reduce death rates and negative health impacts in key vulnerable groups?
Ensure adequate provision of, and access to, green infrastructure, open space, leisure and recreational facilities?
Enhance the opportunities for physical activity?
Improve access to healthcare facilities and services?
Reduce health inequalities?
Meet the needs of the elderly?
Support those with disabilities?
Promote community safety?
Reduce actual levels of crime and anti-social behaviour?
Reduce the fear of crime?
Promote design that discourages crime?
Align healthcare facilities and services with growth?
Help to improve mental health and wellbeing?
Improve living conditions?
Support the aims and objectives of the Greater Manchester Mental Health and Wellbeing Strategy, Tameside and Glossop Mental Wellbeing Strategy and Our Life in Tameside?
Population Human Health
7. Education and Skills: To improve educational attainment and skills for all.
Improve access to training to raise employment potential?
Promote investment in the Borough’s educational establishments?
Improve education levels of children, regardless of their background?
Improve educational and skill levels of the population of working age?
Provide access to work experience, apprenticeships and training?
Support the priorities of the Greater Manchester Work and Skills Strategy?
Population Human Health
8. Air Quality: To improve air quality. Maintain and improve air quality, particularly within the Greater Manchester Combined Authority Air Quality Management Area?
Avoid locating development in areas of existing poor air quality?
Minimise emissions to air from new development?
Air Human Health
9. Biodiversity and Geodiversity: To conserve and enhance biodiversity and geodiversity.
Conserve and enhance European designated nature conservation sites?
Conserve and enhance nationally designated nature conservation sites such as Sites of Special Scientific Interest?
Conserve and enhance Local Nature Reserves and Sites of Biological Importance?
Conserve and enhance species diversity, and in particular avoid harm to indigenous species of principal importance, or priority species and habitats?
Enhance ecological connectivity, providing green spaces that are well connected and biodiversity rich?
Maintain and enhance woodland cover?
Avoid damage to, and protect, Regionally Important Geological Sites (as they are designated)?
Provide opportunities for people to access the natural environment including green and blue infrastructure?
Enhance the resilience of the natural environment to the impacts of climate change?
Biodiversity, Fauna and Flora Human Health
10. Climate Change: To minimise greenhouse gas emissions and ensure communities, developments and infrastructure are resilient to the effects of expected climate change.
Minimise energy use and reduce or mitigate greenhouse gas emissions?
Plan for adaptation measures for the likely effects of climate change?
Climatic Factors

x © Amec Foster Wheeler Environment & Infrastructure UK Limited
March 2017 Doc Ref. bri005ir
IA Objective Guide Questions
Will the Local Plan…
SEA Directive
Topic(s)
Support the delivery of renewable and low carbon energy in the Borough and reduce dependency on non-renewable sources?
Ensure that communities, existing and new developments and infrastructure systems are resilient to the predicted effects of climate change?
11. Flood Risk: To minimise flood risk and reduce the impact of flooding to people and property, taking into account the effects of climate change.
Help to minimise the risk of flooding to existing and new developments/infrastructure?
Ensure that development does not unacceptably increase flood risk?
Ensure adequate measures are in place to manage existing flood risk?
Restrict inappropriate development in areas at risk from flooding?
Deliver sustainable urban drainage systems and promote investment in flood defences that reduce vulnerability to flooding?
Ensure development is appropriately future proof to accommodate future levels of flood risk including from climate change?
Climatic Factors Water
12. Water: To protect and improve the quality and availability of water resources.
Help to achieve the objective of good status under the Water Framework Directive?
Promote management practices that will protect surface and ground water from pollution?
Reduce water consumption and encourage water efficiency?
Ensure that new water/wastewater management infrastructure is delivered to support new development?
Water
13. Cultural Heritage: To conserve and enhance the Borough’s historic environment, cultural heritage, character and setting.
Help to conserve and enhance existing features of the historic built environment and their settings, including archaeological assets?
Reduce the instances and circumstances where heritage assets are identified as being ‘at risk’?
Promote sustainable repair and reuse of heritage assets?
Protect or enhance the significance of designated heritage assets?
Protect or enhance the significance of non-designated heritage assets?
Help to conserve historic buildings, places and spaces that enhance local distinctiveness, character and appearance through sensitive adaptation and re-use?
Provide opportunities for people to value and enjoy the Borough’s cultural heritage?
Improve and promote access to buildings of historic/cultural value?
Encourage heritage-led regeneration?
Cultural Heritage
14. Landscape and Townscape: To conserve and enhance the Borough’s landscape character and townscapes.
Conserve and enhance the Borough’s landscape character and townscapes?
Promote high quality design in context with its urban and rural landscape?
Protect and enhance visual amenity?
Improve the character of open spaces and the public realm?
Landscape
15. Land Use and Soils: To encourage the efficient use of land and conserve and enhance soils.
Promote the use of previously developed (brownfield) land and minimise the loss of greenfield land?
Avoid the loss of agricultural land including best and most versatile land?
Make best use, and reduce the amount, of derelict, degraded and underused land in the Borough?
Encourage the reuse of existing buildings and infrastructure?
Prevent land contamination and facilitate remediation of contaminated sites?
Maintain and enhance soil quality?
Soil Material Assets

xi © Amec Foster Wheeler Environment & Infrastructure UK Limited
March 2017 Doc Ref. bri005ir
IA Objective Guide Questions
Will the Local Plan…
SEA Directive
Topic(s)
16. Resource Use and Waste: To encourage sustainable resource use and promote the waste hierarchy (reduce, reuse, recycle, recover).
Support the objectives and proposals of the Greater Manchester Joint Minerals Plan?
Minimise the demand for raw materials and assist in maximising the use of recycled and secondary materials (including aggregates)?
Promote the use of local resources?
Reduce minerals extracted and imported?
Increase efficiency in the use of raw materials and promote recycling?
Avoid sterilisation of mineral reserves?
Support the objectives and proposals of the Greater Manchester Joint Waste Development Plan Document?
Assist or facilitate compliance with the waste hierarchy (i.e. reduce first, then reuse, recycle and recover)?
Material Assets
Section 4.2 of the Scoping Report provides further information in relation to the development of the
IA Framework.
How will the IA be Undertaken?
The Council expects that the IA will assess the following key parts of the Local Plan (and reasonable
alternatives where these exist):
Vision and Objectives;
Spatial Strategy (in respect of the distribution of development);
Plan Policies; and
Site Allocations.
It is proposed that each part of the Local Plan will be assessed using the IA Framework set out in Table
NTS.3. The vision and objectives of the Local Plan will be tested for their compatibility with the objectives
that are contained in the IA Framework using a compatibility matrix. The spatial strategy (including
reasonable alternatives) and plan policies (by plan chapter) will be assessed using an assessment matrix.
This matrix will include:
the IA objectives;
a score indicating the nature of the effect for each spatial strategy option/policy;
a commentary on likely significant effects (including consideration of the cumulative, synergistic
and indirect effects as well as the geography, duration, temporary/permanence and likelihood
of any effects) and on any assumptions or uncertainties; and
recommendations, including any mitigation or enhancements measures.
Definitions of significance will be used to guide the assessment and to determine the type and scale of
effects of Local Plan proposals on the IA objectives.
Site allocations (including reasonable alternatives) will be assessed using tailored assessment criteria with
associated thresholds of significance to determine the type and magnitude of effect against each IA
objective.
Section 4.3 of the Scoping Report presents in detail the proposed approach to the IA of the key
components of the Local Plan including the matrices, scoring system and site assessment criteria
that will be used. Appendix D contains the proposed definitions of significance.

xii © Amec Foster Wheeler Environment & Infrastructure UK Limited
March 2017 Doc Ref. bri005ir
What are the Next Steps in the IA Process?
This NTS and the accompanying Scoping Report are being issued for consultation from 6th March to 10th
April 2017. Details of how to respond to the consultation are provided overleaf. Comments and responses
received on this NTS and Scoping Report will be considered by the Council and used to finalise the
approach to the IA of the Local Plan.
The assessment will be an iterative process and will involve the development and refinement of the Local
Plan by testing the sustainability, health and equality strengths and weaknesses of the emerging Plan
options with the findings presented in a series of IA Reports. The IA Reports will consist of:
A Non-Technical Summary;
A chapter setting out the scope and purpose of the assessment and including an overview of
the emerging Local Plan;
A chapter summarising the key objectives of other plans and programmes and socio-economic
(including health and equality) and environmental issues relevant to the Local Plan;
A chapter setting out the approach to the assessment and any difficulties encountered;
A chapter outlining the likely effects of the implementation of the Local Plan and reasonable
alternatives, including cumulative effects, mitigating measures, uncertainties and risks. This will
include dedicated sections for EqIA and HIA. The reasons for selecting the preferred Local
Plan options and for the rejection of alternatives will be explained;
A chapter presenting views on implementation and monitoring.
The Council is currently working towards consultation on a Draft Local Plan which is due to take place
between August and September 2017. An interim IA Report will be published for consultation alongside the
Draft Local Plan and will consider the sustainability, health and equality performance of key plan options and
proposals.

xiii © Amec Foster Wheeler Environment & Infrastructure UK Limited
March 2017 Doc Ref. bri005ir
This Consultation: How to Give Us Your Views
We would welcome your views on any aspect of this Scoping Report. However, we would
particularly welcome responses to the following questions:
1. Do you think that this Scoping Report sets out sufficient information to establish the context
for the IA of the Local Plan in terms of the review of plans and programmes and baseline
evidence and analysis? If not, which areas do you think have been missed and where is
information on these topics available from?
2. Are the main economic, social and environmental issues identified in this Scoping Report
relevant to the IA of the Local Plan? If not, which issues do you think need to be included or
excluded?
3. Do you agree with the proposed approach to the IA of the Local Plan? Do the IA objectives
and guide questions that comprise the IA Framework cover a sufficient range of
environmental, social and economic topics? If not, which objectives should be amended and
which other objectives do you believe should be included?
Comments should be made in writing, include the name and address of the respondent and be
returned by email or post. Documents are available to view on the Councils website throughout
the consultation period http://www.tameside.gov.uk/planning/tamesidelocalplan.
Reference copies are also available at all Council Libraries, Customer Service Centre and the
Planning Departments Principal Office during normal opening hours, as per the address details
below.
Please provide your comments by 10th April 2017. Comments should be sent to:
By email: [email protected].
By post: Planning Policy, Tameside MBC, Clarence Arcade, Stamford Street, Ashton-under-Lyne,
OL6 7PT.
Please note all comments will be held by the Council and will be available to view publicly.
Comments cannot be treated as confidential. Your personal information such as your postal and
email address will not be published but your name and organisation (if relevant) will.
Tameside Council maintains a database of consultees who wish to be kept informed about the
Local Plan. In responding to this consultation your contact details will automatically be added to
the consultation database (if not already held). If you do not want to be contacted about future
Local Plan consultations please state this in your response.
xiv © Amec Foster Wheeler Environment & Infrastructure UK Limited
March 2017 Doc Ref. bri005ir
Contents
1. Introduction 1
1.1 Overview 1
1.2 Purpose of this Scoping Report 1
1.3 The Tameside Local Plan – An Overview 1 Requirement to Prepare a Local Plan 1 Scope and Content of the Tameside Local Plan 2 Preparation of the Local Plan 3
1.4 Integrated Assessment 4 Scope 4 Integrating the Different forms of Assessment 7 Stages in the Integrated Assessment Process and the Relationship with the Local Plan 7
1.5 Habitats Regulations Assessment 9
1.6 Scoping Report Structure 10
1.7 How to Comment on this Scoping Report 10
2. Review of Plans and Programmes 12
2.1 Introduction 12
2.2 Review of Plans and Programmes 12
2.3 Key Objectives and Policy Issues 15
3. Baseline Analysis 19
3.1 Introduction 19
3.2 Tameside Metropolitan Borough – An Overview 20
3.3 Population and Demographics 20 Population Trends 20 Age Structure 23 Households 23 Ethnicity 23 Religious Belief 24 Likely Evolution of the Baseline Without the Local Plan 24 Key Issues 25 Links across the Integrated Assessment 25
3.4 Housing 25 Completions 25 Housing Stock – Type and Tenure 26 House Prices and Sales 27 Affordability 29 Overcrowding 31 Vacant Dwellings 32 Homelessness 32 Gypsies, Travellers and Travelling Showpeople 32 Likely Evolution of the Baseline Without the Local Plan 33 Key Issues 33 Links across the Integrated Assessment 33
3.5 Economy 34 Economy 34 Employment 37 Likely Evolution of the Baseline Without the Local Plan 39 Key Issues 39 Links across the Integrated Assessment 40

xv © Amec Foster Wheeler Environment & Infrastructure UK Limited
March 2017 Doc Ref. bri005ir
3.6 Health and Wellbeing 40 Health and Health Services 40 Open Space 41 Crime 42 Likely Evolution of the Baseline without the Local Plan 43 Key Issues 43 Links across the Integrated Assessment 43
3.7 Education and Skills 43 Qualifications 43 Education Infrastructure 45 Likely Evolution of the Baseline Without the Local Plan 46 Key Issues 46 Links across the Integrated Assessment 46
3.8 Deprivation 47 Likely Evolution of the Baseline Without the Local Plan 49 Key Issues 49 Links across the Integrated Assessment 49
3.9 Transport and Accessibility 49 Transportation Infrastructure 49 Movement 50 Likely Evolution of the Baseline Without the Local Plan 52 Key Issues 52 Links across the Integrated Assessment 53
3.10 Biodiversity and Green Infrastructure 53 Biodiversity 53 Green Infrastructure 58 Likely Evolution of the Baseline without the Local Plan 58 Key Issues 58 Links across the Integrated Assessment 59
3.11 Land Use, Geology and Soil 59 Land Use 59 Geology 60 Soil 60 Likely Evolution of the Baseline Without the Local Plan 60 Key Issues 61 Links across the Integrated Assessment 61
3.12 Water 61 Water Resources 61 Water Quality 62 Flood Risk 64 Likely Evolution of the Baseline Without the Local Plan 66 Key Issues 66 Links across the Integrated Assessment 66
3.13 Air Quality 67 Likely Evolution of the Baseline Without the Local Plan 69 Key Issues 69 Links across the Integrated Assessment 69
3.14 Climate Change 69 Likely Evolution of the Baseline Without the Local Plan 71 Key Issues 72 Links across the Integrated Assessment 73
3.15 Material Assets 73 Waste 73 Minerals 75 Links across the Integrated Assessment 77
3.16 Cultural Heritage 77 Likely Evolution of the Baseline Without the Local Plan 80 Key Issues 80 Links across the Integrated Assessment 81
3.17 Landscape and Townscape 81
3.18 Summary of Key Sustainability, Health and Equality Issues 86
4. Integrated Assessment Approach 88
4.1 Introduction 88

xvi © Amec Foster Wheeler Environment & Infrastructure UK Limited
March 2017 Doc Ref. bri005ir
4.2 Integrated Assessment Framework 88
4.3 Methodology 92 Vision and Objectives 93 Spatial Strategy 93 Policies 95 Site Allocations 95 Secondary, Cumulative and Synergistic Effects 100
4.4 EqIA and HIA Screening 100
4.5 Difficulties Encountered in Compiling this Scoping Report 101
5. Next Steps 102
Table 1.1 Local Plan Preparation Milestones 4 Table 2.1 Plans and Programmes Reviewed for the Integrated Assessment of the Local Plan 12 Table 2.2 Key Objectives and Policy Issues Arising from the Review of Plans and Programmes 16 Table 3.1 Male / Female Population Split (2014) 21 Table 3.2 Place of Birth 21 Table 3.3 Population by Age Group 23 Table 3.4 Percentage Change of Household Composition between 2001 and 2011 23 Table 3.5 Ethnicity 24 Table 3.6 Religious Groups 24 Table 3.7 Housing Completions 2006/07 to 2014/15 26 Table 3.8 Housing Tenure 27 Table 3.9 Housing Affordability Ratios 29 Table 3.10 2014 Authorised Gypsy, Traveller and Travelling Showpeople Sites 33 Table 3.11 Enterprise Size (2016) 34 Table 3.12 Gross Employment Completions, Losses and Total Supply 35 Table 3.13 Proportion of Employment Population by Occupation (June 2015 – June 2016) 38 Table 3.14 Employee Jobs in Tameside by Industry (excluding farm-based agriculture) (2015) 39 Table 3.15 Life Expectancy at Birth 40 Table 3.16 Open Space in Tameside (2010) 41 Table 3.17 Tameside Playing Pitches by Type (2015) 42 Table 3.18 State Funded Primary School Capacity (2015) 45 Table 3.19 State Funded Secondary School Capacity (2015) 46 Table 3.20 Distance Travelled to Work 51 Table 3.21 South Pennine Moors SAC and the Peak District Moors (South Pennine Moors Phase I) SPA Features and Conservation Objectives. 55 Table 3.22 Condition of SSSIs within Tameside 56 Table 3.23 Land Use in Tameside 59 Table 3.24 CO2 Emissions Per Capita 2005-2013 (tonnes CO2 per person) 70 Table 3.25 Per Capita CO2 Emissions by Source for Tameside 2005-2013 (tonnes CO2 per person) 70 Table 3.26 North West England Climate Predictions (medium emissions scenario) 72 Table 3.27 Historic Assets ‘At Risk’ 79 Table 3.28 Summary of Key Sustainability, Health and Equality Issues 86 Table 4.1 Proposed IA Framework 88 Table 4.2 Coverage of the SEA Directive Topics by the IA Objectives 92 Table 4.3 Compatibility Matrix 93 Table 4.4 Proposed Assessment Matrix – Spatial Strategy 94 Table 4.5 Proposed Scoring System 94 Table 4.6 Proposed Appraisal Matrix – Policies 95 Table 4.7 Proposed Site Assessment Criteria 95
Figure 1.1 The HIA Process 6 Figure 1.2 The Determinants of Health 7 Figure 1.3 The Sustainability Appraisal Process and Linkages with Local Plan Preparation 8 Figure 3.1 Tameside Metropolitan Borough 20 Figure 3.2 Main Migration from Tameside to other UK Local Authority Areas (year to June 2015) 22 Figure 3.3 Main Migration in to Tameside from other UK Local Authority Areas (year to June 2015) 22 Figure 3.4 Dwelling type 27 Figure 3.5 Average House Price (1995-2016) 28 Figure 3.6 Volume of House Sales (1995-2015) 29 Figure 3.7 Gross Affordable Housing Completions (2005-2015) 30 Figure 3.8 Number of Households on Housing Waiting List (1997-2016) 31 Figure 3.9 Bedroom Occupancy Rating 31 Figure 3.10 Long Term Vacant Dwellings 32

xvii © Amec Foster Wheeler Environment & Infrastructure UK Limited
March 2017 Doc Ref. bri005ir
Figure 3.11 Job Density 2014 36 Figure 3.12 Area of Retail, Leisure and Office Development in Town Centres 36 Figure 3.13 Percentage of Town Commercial Premises Vacant 37 Figure 3.14 Total Number of Offences in Tameside (2003-2016) 42 Figure 3.15 Educational Attainment (2015) 44 Figure 3.16 Change in the Percentage of 16-64 Year Olds with No Qualifications and NVQ Level 4 and Above (2004-2015) 45 Figure 3.17 Indices of Multiple Deprivation (2015) 48 Figure 3.18 Workplace Destinations 52 Figure 3.19 Designated Nature Conservation Sites 54 Figure 3.20 Greater Manchester Biodiversity Action Plan Habitats 57 Figure 3.21 The North West River Basin District 63 Figure 3.22 Areas of Flood Risk 65 Figure 3.23 Greater Manchester Air Quality Management Area (with Tameside area inset) 68 Figure 3.24 Waste Management Facilities and Joint Waste Plan Allocations 74 Figure 3.25 Joint Minerals Plan Allocations 76 Figure 3.26 Designated Cultural Heritage Assets 78 Figure 3.27 Greater Manchester Navigation Waterways 80 Figure 3.28 National Character Areas 83 Figure 3.29 Green Belt and Managed Greenspace 84
Appendix A Quality Assurance Checklist Appendix B Review of Plans and Programmes Appendix C Settlement Constraint Mapping Appendix D Definitions of Significance Appendix E Equality Impact Assessment Template Appendix F Health Impact Assessment Screening Questions

1 © Amec Foster Wheeler Environment & Infrastructure UK Limited
March 2017 Doc Ref. bri005ir
1. Introduction
1.1 Overview
1.1.1 Tameside Metropolitan Borough Council (the Council) is currently preparing a new Local Plan for
the Borough that will, once adopted, replace the saved policies of the Tameside Unitary
Development Plan (UDP) 2004. The Tameside Local Plan will reflect the strategic context provided
by the emerging Greater Manchester Spatial Framework (GMSF), setting out the vision, objectives
and local planning policies that will guide development in the Borough up to at least 2035.
1.1.2 In support of the development of the Local Plan, the Council is undertaking an Integrated
Assessment (IA) that will include a Sustainability Appraisal (SA), Strategic Environmental
Assessment (SEA), Equalities Impact Assessment (EqIA) and Health Impact Assessment (HIA).
The IA will assess the environmental, social and economic performance of the Local Plan and in
doing so, it will help to inform the selection of Plan options concerning (in particular) the distribution
and location of future development in the Borough. The IA process will also identify measures to
avoid, minimise or mitigate any potential negative effects that may arise from the Plan’s
implementation as well as opportunities to improve the contribution of the Local Plan towards
sustainability.
1.2 Purpose of this Scoping Report
1.2.1 This Scoping Report represents the first formal output of the IA of the Local Plan. The purpose of
the Scoping Report is to provide sufficient information to consultees to enable them to comment on
the proposed scope of the assessment. More specifically, the Scoping Report sets out:
an overview of the Tameside Local Plan;
a review of relevant international, national, regional, sub-regional and local plans, policies and
programmes;
baseline information for the Borough across key sustainability (including health and equalities)
topics;
key economic, social and environmental issues relevant to the assessment of the Local Plan;
the proposed approach to undertaking the assessment of the Local Plan including a draft IA
Framework (comprising assessment objectives, guide questions and matrices); and
an overview of the next steps in the IA process including the proposed structure of future IA
Reports.
1.2.2 This Scoping Report has been prepared by Amec Foster Wheeler Environment and Infrastructure
UK Ltd (Amec Foster Wheeler).
1.3 The Tameside Local Plan – An Overview
Requirement to Prepare a Local Plan
1.3.1 The National Planning Policy Framework (NPPF) (March, 2012) sets out (at paragraphs 150-157)
that each local planning authority should prepare a local plan for its area. Local plans should set
out the strategic priorities and policies to deliver:
the homes and jobs needed in the area;
the provision of retail, leisure and other commercial development;
2 © Amec Foster Wheeler Environment & Infrastructure UK Limited
March 2017 Doc Ref. bri005ir
the provision of infrastructure for transport, telecommunications, waste management, water
supply, wastewater and flood risk, and the provision of minerals and energy (including heat);
the provision of health, security, community and cultural infrastructure and other local
facilities; and
climate change mitigation and adaptation and conservation and enhancement of the natural
and historic environment, including landscape.
1.3.2 Planning Practice Guidance (2014) clarifies (at paragraph 002, ‘Local Plans’) that local plans
“should make clear what is intended to happen in the area over the life of the plan, where and
when this will occur and how it will be delivered”.
Scope and Content of the Tameside Local Plan
1.3.3 In accordance with the NPPF, the Council is currently preparing a new Local Plan for Tameside
that will, once adopted, formally replace the adopted UDP. The UDP had previously been
reviewed with the aim of replacing it with a Core Strategy and Development Management Policies
Development Plan Document (DPD). However, this timetable was superseded due to the
collaborative work being undertaken by all the Greater Manchester authorities on the GMSF which
commenced in 2014. As a result, the development of the Core Strategy and Development
Management Policies DPD ceased.
The Greater Manchester Spatial Framework
1.3.4 The GMSF will provide the overarching strategic context for the Greater Manchester conurbation.
The key policy areas of the plan will primarily focus on housing and employment land requirements,
the infrastructure requirements to deliver this and the environmental capacity of the conurbation to
accommodate growth in the most sustainable manner. The GMSF is currently being progressed as
a Joint Association of Greater Manchester Authorities (AGMA) Plan. Once adopted, the GMSF will
be a spatial development strategy and the Tameside Local Plan will need to be in general
conformity with it.
1.3.5 Consultation on the first Draft GMSF took place between 31st October 2016 and 16th January 2017
and set out:
how much housing and employment land is needed up to 2035;
a number of strategic sites across Greater Manchester to assist in meeting these
requirements;
revisions to the Greater Manchester Green Belt to accommodate the identified strategic
sites;
the importance of infrastructure such as health, education, transport, green spaces and
utilities to support neighbourhoods and employment; and
ways to protect and improve the natural environment.
1.3.6 The Draft GMSF makes provision for (inter alia):
2,450,000 m2 of gross new office floorspace, including 35,000 m2 of floorspace in Tameside;
8,126,000 m2 (indicative) of industrial and warehousing floorspace, including 483,000 m2 of
floorspace in Tameside; and
227,200 dwellings (11,360 per annum), including 13,600 dwellings in Tameside (680 per
annum).
1.3.7 To meet the growth requirements for Greater Manchester, the Draft GMSF identifies a number of
strategic locations for development. These locations include the Eastern Gateway, which is to
deliver significant regeneration (linked to a Manchester EXPO 2025 bid), industrial and
manufacturing floorspace and housing growth in Tameside alongside infrastructure such as a new

3 © Amec Foster Wheeler Environment & Infrastructure UK Limited
March 2017 Doc Ref. bri005ir
Droylsden railway station and highways improvements. Sites located outside of the urban area
and to be released from the Green Belt are also (provisionally) allocated including the following six
sites in Tameside:
Little Moss/Ashton Moss (allocated for 1,980 new homes, 200,000 m2 of employment
floorspace and enhanced sports facilities);
Godley Green (allocated for approximately 2,350 new homes alongside supporting
infrastructure and facilities);
Sidebottom Fold (allocated for 650 new homes);
South Tameside (allocated for 935 dwellings);
Mottram M67 North and South (allocated for 70,000 m2 of employment floorspace and 174
dwellings); and
North Ashton-under-Lyne Area (allocated 675 dwellings).
1.3.8 Further information relating to the emerging GMSF is available via the Greater Manchester
Combined Authority (GMCA) website, https://www.greatermanchester-
ca.gov.uk/info/20018/greater_manchester_spatial_framework.
The Tameside Local Plan
1.3.9 The Tameside Local Plan will incorporate the growth options, strategy, policy, site allocations and
Green Belt revisions as they evolve through the GMSF and will, at a local level, set out a
complementary vision, strategy and policy to guide development in the Borough up to at least
2035. The indicative Local Plan subject and scope is set out below:
Overview of the Borough.
Themes and objectives incorporating GMSF strategy and policy.
Overarching principle polices such as urban regeneration, design quality and sustainability.
Strategic allocations and policies incorporating GMSF allocations.
Non-strategic employment policies and allocations.
Non-strategic housing policies and allocations.
Town centre, retail and leisure policies.
Green Belt, countryside, open space, sport and recreation policies.
Infrastructure policies (including, for example, transport, health, education and utilities)
incorporating an infrastructure delivery plan/programme.
Conservation and historic environment policies.
Nature conservation, trees and woodland policies.
Preparation of the Local Plan
1.3.10 The Council approved its latest Local Development Scheme (LDS) in December 2016. The LDS
sets out the timetable for production of the Local Plan in accordance with the requirements for plan
preparation set out in The Town and Country Planning (Local Planning) (England) Regulations
2012. The key plan preparation milestones are detailed in Table 1.1.

4 © Amec Foster Wheeler Environment & Infrastructure UK Limited
March 2017 Doc Ref. bri005ir
Table 1.1 Local Plan Preparation Milestones
Local Plan Development Stage Timetable
Regulation 18 Notification January to March 2017
Consultation on Draft Local Plan August 2017 to September 2017
Publication of Submission Draft Local Plan and Public Consultation
May 2018 to June 2018
Submission of the Local Plan November 2018
Public Examination March to April 2019
Formal Adoption Autumn 2019
1.3.11 Adoption of the Local Plan is due to take place in Autumn 2019 and will be preceded by three
principal periods of consultation during which the Local Plan will be developed and refined prior to
its submission. Consultation on the scope of the Local Plan (Regulation 18)6 is currently taking
place over a six week period from 23rd January to 6th March 2017. This is the first formal
consultation on the Local Plan and will inform the Draft Local Plan that will be subject to
consultation in Summer/Autumn 2017.
1.3.12 Development of the Local Plan will take into account (inter-alia) national planning policy and
guidance, the GMSF, the Council’s evidence base, the outcomes of consultation and the findings of
socio-economic and environmental assessment and appraisal including IA.
1.3.13 Further information in respect of the preparation of the Local Plan is available via the Council’s
website: http://www.tameside.gov.uk/planning/tamesidelocalplan.
1.4 Integrated Assessment
Scope
1.4.1 Consistent with the approach being taken to the development of the GMSF, the Council has
determined to undertake an IA of the Local Plan that is to include SA, SEA, EqIA and HIA. The
requirements relating to each assessment are discussed in-turn below.
Sustainability Appraisal
1.4.2 Under Section 19(5) of the Planning and Compulsory Purchase Act 2004, the Council is required to
carry out a SA of the Local Plan to help guide the selection and development of policies and
proposals in terms of their potential social, environmental and economic effects.
1.4.3 At paragraphs 150-151, the NPPF sets out that local plans are key to delivering sustainable
development and that they must be prepared with the objective of contributing to the achievement
of sustainable development. In this context, paragraph 165 reiterates the requirement for SA/SEA
as it relates to local plan preparation:
“A sustainability appraisal which meets the requirements of the European Directive on
strategic environmental assessment should be an integral part of the plan preparation
process, and should consider all the likely significant effects on the environment, economic
and social factors.”
1.4.4 The Planning Practice Guidance (2014) (paragraph 001 ‘Strategic environmental assessment and
sustainability appraisal’) also makes clear that SA plays an important role in demonstrating that a
local plan reflects sustainability objectives and has considered reasonable alternatives. In this
6 Tameside Local Plan Notification under Regulation 18, The Town and Country Planning (Local Planning) (England) Regulations 2012.

5 © Amec Foster Wheeler Environment & Infrastructure UK Limited
March 2017 Doc Ref. bri005ir
regard, SA will help to ensure that a local plan is “justified”, a key test of soundness that concerns
the extent to which the plan is the most appropriate strategy, when considered against the
reasonable alternatives and available and proportionate evidence.
Strategic Environmental Assessment
1.4.5 In undertaking the requirement for SA, local planning authorities must also incorporate the
requirements of European Union Directive 2001/42/EC on the assessment of the effects of certain
plans and programmes on the environment, referred to as the SEA Directive, and its transposing
regulations, the Environmental Assessment of Plans and Programmes Regulations 2004 (statutory
instrument 2004 No. 1633).
1.4.6 The aim of the Directive is “to contribute to the integration of environmental considerations into the
preparation and adoption of plans and programmes with a view to promoting sustainable
development, by ensuring that, in accordance with this Directive, an environmental assessment is
carried out of certain plans and programmes which are likely to have significant effects on the
environment.”
Equalities Impact Assessment
1.4.7 The Public Sector Equality Duty contained in Section 149 of the Equality Act 2010 requires public
authorities to have due regard to a number of equality considerations when exercising their
functions. The aims of the Duty are:
to eliminate unlawful discrimination, harassment and victimisation and other conduct
prohibited by the Equality Act 2010;
to advance equality of opportunity between people who share a protected characteristic and
those who do not (i.e. to remove or minimise disadvantages or barriers, and to meet the
needs of people from protected groups where these are different from the needs of other
people); and
to foster good relations between people who share a protected characteristic and those who
do not (i.e. to tackle prejudice and promote understanding).
1.4.8 EqIA is not required by law, but it is a way of ensuring that the Public Sector Equality Duty,
alongside requirements under the Race Relations (Amendment) Act 2000 and Disability
Discrimination Act 2005, have been complied with by considering the effect of Council services,
practices and policies (such as the Local Plan) on different groups protected from discrimination by
the Equality Act. It is a tool that can help local authorities ensure that their policies and decisions
do not discriminate, that they promote equality wherever possible and that they foster good
community relations.
1.4.9 Carrying out EqIA involves assessing the likely effects of policies on “protected characteristics” as
defined in the Equality Act (the protected characteristics or groups are: age; disability; gender
reassignment; marriage and civil partnership; pregnancy and maternity; race; religion or belief; sex;
and sexual orientation). It comprises two stages:
Stage 1: Screening - this involves the assessment of impacts of the strategy/plan against
the protected characteristics outlined above. If no direct or indirect impacts are identified
during screening, no further assessment is required. If there are effects that cannot easily
be mitigated, a full EqIA should be undertaken.
Stage 2: Full EqIA - this involves more in-depth assessment of the impacts of the
strategy/plan, the recommendation of mitigation measures, definition of monitoring and
evaluation measures and pubic consultation.
1.4.10 To ensure that the IA meets the requirements of EqIA, it will consider whether there is potential for
the Local Plan to affect people differently based on the protected characteristics. This is reflected
in the considerations for IA assessment and in the IA Framework in Section 4. Furthermore,
consideration of equality issues within the IA will be supported by an equality screening

6 © Amec Foster Wheeler Environment & Infrastructure UK Limited
March 2017 Doc Ref. bri005ir
assessment (in line with Stage 1 above) which will be presented as an appendix to the IA Reports
(see Section 4.4 for further information).
Health Impact Assessment
1.4.11 There is no statutory requirement to undertake HIA as part of the plan-making process. However,
HIA can support decision making by predicting the health consequences of proposals, helping to
ensure that plans and policies avoid or minimise negative, and maximise positive, health impacts.
1.4.12 The HIA process is well-established and comprises five stages which are show in Figure 1.1.
Figure 1.1 The HIA Process
Source: Department of Health (2010) Health Impact Assessment of Government Policy.
1.4.13 Department of Health (DOH) guidance7 on HIA states that “the determinants of health are the focus
of HIA. They are the social, economic, environmental and cultural factors that indirectly influence
health and wellbeing. They include what we eat and drink; where we live and work; and the social
relationships and connections we have with other people and organisations”.
7 Department of Health (2010) Health Impact Assessment of Government Policy.
7 © Amec Foster Wheeler Environment & Infrastructure UK Limited
March 2017 Doc Ref. bri005ir
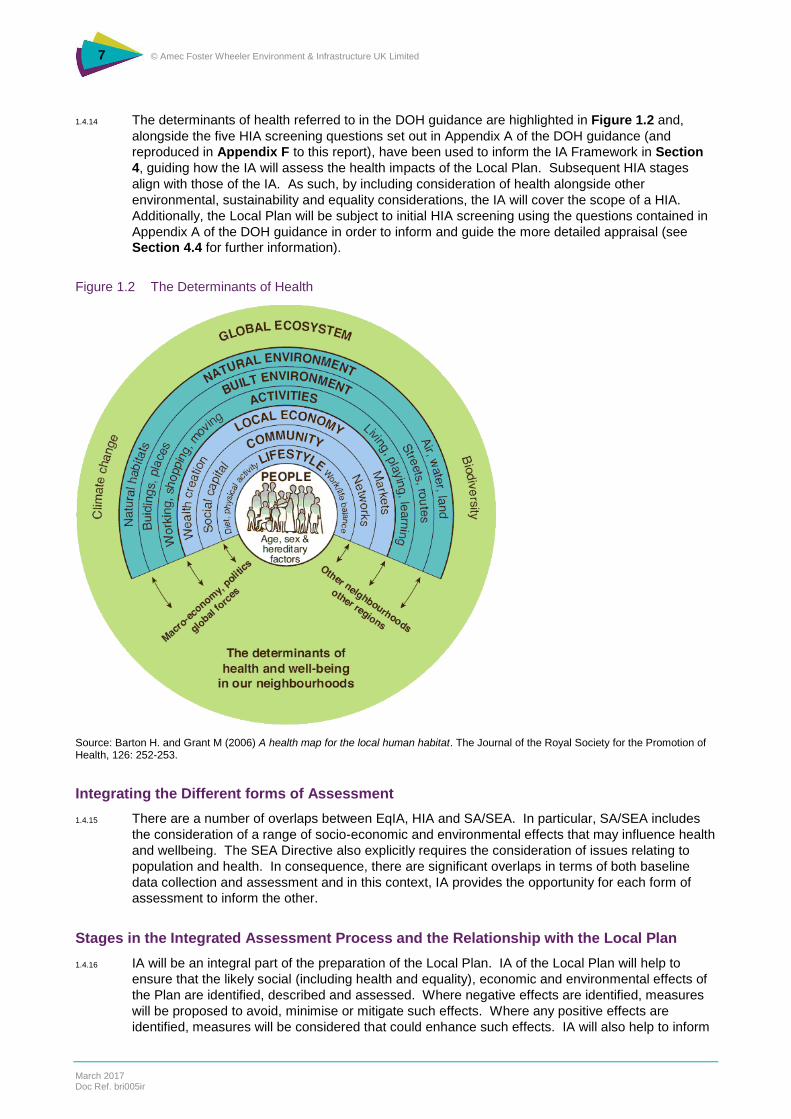
1.4.14 The determinants of health referred to in the DOH guidance are highlighted in Figure 1.2 and,
alongside the five HIA screening questions set out in Appendix A of the DOH guidance (and
reproduced in Appendix F to this report), have been used to inform the IA Framework in Section
4, guiding how the IA will assess the health impacts of the Local Plan. Subsequent HIA stages
align with those of the IA. As such, by including consideration of health alongside other
environmental, sustainability and equality considerations, the IA will cover the scope of a HIA.
Additionally, the Local Plan will be subject to initial HIA screening using the questions contained in
Appendix A of the DOH guidance in order to inform and guide the more detailed appraisal (see
Section 4.4 for further information).
Figure 1.2 The Determinants of Health
Source: Barton H. and Grant M (2006) A health map for the local human habitat. The Journal of the Royal Society for the Promotion of Health, 126: 252-253.
Integrating the Different forms of Assessment
1.4.15 There are a number of overlaps between EqIA, HIA and SA/SEA. In particular, SA/SEA includes
the consideration of a range of socio-economic and environmental effects that may influence health
and wellbeing. The SEA Directive also explicitly requires the consideration of issues relating to
population and health. In consequence, there are significant overlaps in terms of both baseline
data collection and assessment and in this context, IA provides the opportunity for each form of
assessment to inform the other.
Stages in the Integrated Assessment Process and the Relationship with the Local Plan
1.4.16 IA will be an integral part of the preparation of the Local Plan. IA of the Local Plan will help to
ensure that the likely social (including health and equality), economic and environmental effects of
the Plan are identified, described and assessed. Where negative effects are identified, measures
will be proposed to avoid, minimise or mitigate such effects. Where any positive effects are
identified, measures will be considered that could enhance such effects. IA will also help to inform

8 © Amec Foster Wheeler Environment & Infrastructure UK Limited
March 2017 Doc Ref. bri005ir
the selection of plan options by assessing reasonable alternatives in respect of, in particular,
different spatial distributions and land allocations whilst at the same time helping to make the
decision making process more transparent.
1.4.17 The stages of SA/SEA, EqIA and HIA are similar and therefore the IA of the Local Plan will follow
the five key stages of the SA process set out in the Planning Practice Guidance, as shown in
Figure 1.3.
Figure 1.3 The Sustainability Appraisal Process and Linkages with Local Plan Preparation
Source: Department for Communities and Local Government (DCLG) (2014) Planning Practice Guidance. NB: Stages B and C will be repeated for each iteration of the draft Local Plan that is issued for consultation.
9 © Amec Foster Wheeler Environment & Infrastructure UK Limited
March 2017 Doc Ref. bri005ir
1.4.18 The first stage (Stage A) of the IA process has led to the production of this Scoping Report. The
scoping stage itself comprises five tasks that are listed below:
i. Review of other relevant policies, plans, programmes and strategies (hereafter referred to
as ‘plans and programmes’).
ii. Collation and analysis of baseline information.
iii. Identification of key sustainability, health and equality issues.
iv. Development of the IA Framework.
v. Consultation on the scope of the assessment (this Scoping Report).
1.4.19 Based on the review of other plans and programmes, baseline analysis and identification of key
sustainability, health and equality issues, this Scoping Report sets out the proposed IA Framework
which, when finalised, will be used to assess the effects of the Local Plan (and any reasonable
alternatives). Following the conclusion of scoping consultation, the IA Framework will be amended
to take into account consultation responses as appropriate.
1.4.20 The revised IA Framework will be used to assess the effects of the emerging Local Plan in terms of
the key plan components (the Plan vision, objectives, spatial strategy and policies including
reasonable alternatives) (Stage B). This stage is iterative and will involve the development and
refinement of the Local Plan by testing the sustainability, health and equality strengths and
weaknesses of the emerging Plan options. In this respect, IA will be undertaken throughout the
preparation of the Local Plan with the findings presented in a series of interim IA Reports to
accompany the publication of, and consultation on, the various iterations of the draft Local Plan.
1.4.21 At Stage C, a final IA Report will be prepared to accompany the submission draft Local Plan. This
will be prepared to meet the reporting requirements of the SEA Directive and will be available for
consultation alongside the draft Local Plan itself prior to consideration by an independent planning
inspector at Examination in Public (EiP) (Stage D).
1.4.22 Following EiP, and subject to any significant changes to the draft Local Plan that may require
assessment as a result of the EiP, the Council will issue a Post Adoption Statement as soon as
reasonably practicable after the adoption of the Local Plan. This will set out the results of the
consultation and IA process and the extent to which the findings of the IA have been
accommodated in the adopted Local Plan. During the period of the Local Plan, the Council will
monitor its implementation and any significant social, economic and environmental effects (Stage
E).
1.5 Habitats Regulations Assessment
1.5.1 Regulation 102 of the Conservation of Habitats and Species Regulations 2010 (as amended) (the
‘Habitats Regulations’) requires that competent authorities assess the potential impacts of land use
plans on the Natura 2000 network of European protected sites8 to determine whether there will be
any ‘likely significant effects’ on any European site as a result of the plan’s implementation (either
alone or ‘in combination’ with other plans or projects); and, if so, whether these effects will result in
any adverse effects on that site’s integrity with reference to the site’s conservation objectives. The
8 Strictly, ‘European sites’ are any Special Area of Conservation (SAC) from the point at which the European Commission and the UK Government agree the site as a ‘Site of Community Importance’ (SCI); any classified Special Protection Area (SPA); any candidate SAC (cSAC); and (exceptionally) any other site or area that the Commission believes should be considered as an SAC but which has not been identified by the Government. However, the term is also commonly used when referring to potential SPAs (pSPAs), to which the provisions of Article 4(4) of Directive 2009/147/EC (the ‘new wild birds directive’) are applied; and to possible SACs (pSACs) and listed Ramsar Sites, to which the provisions of the Conservation of Habitats and Species Regulations 2010 (as amended) are applied a matter of Government policy when considering development proposals that may affect them (NPPF para 118). ‘European site’ is therefore used in this report in its broadest sense, as an umbrella term for all of the above designated sites.

10 © Amec Foster Wheeler Environment & Infrastructure UK Limited
March 2017 Doc Ref. bri005ir
process by which the effects of a plan or programme on European sites are assessed is known as
‘Habitats Regulations Assessment’ (HRA)9.
1.5.2 In accordance with the Habitats Regulations, what is commonly referred to as a HRA screening
exercise will be undertaken to identify whether the Local Plan has any likely significant effects on
any European sites, either alone or ‘in combination’ with other projects or plans. Where there are
likely significant effects, a more detailed Appropriate Assessment will be required to consider any
adverse effects on the integrity of any European site.
1.5.3 The HRA screening exercise will be reported separately from the IA of the Local Plan but
importantly will help inform the assessment process, particularly in respect of the potential effects
of proposals on biodiversity.
1.6 Scoping Report Structure
1.6.1 Reflecting the five scoping tasks set out in Section 1.4 above, this Scoping Report is structured as
follows:
Non-Technical Summary - Provides a summary of the Scoping Report, including
information on both the Local Plan and the proposed approach to the IA;
Section 1: Introduction - Includes a summary of the Local Plan, an overview of IA, report
contents and an outline of how to respond to the consultation;
Section 2: Review of Plans and Programmes - Provides an overview of the review of
those plans and programmes relevant to the Local Plan and IA that is contained at
Appendix B;
Section 3: Baseline Analysis - Presents the baseline analysis of the Borough’s social,
economic and environmental characteristics and identifies the key sustainability, health and
equality issues that have informed the IA Framework;
Section 4: IA Approach - Outlines the proposed approach to the IA of the Local Plan
including the IA Framework;
Section 5: Next Steps - Details the next steps in the assessment process including a
proposed IA Report structure.
1.6.2 This Scoping Report has been prepared to meet the requirements of the SEA Directive and
associated Regulations. It fulfils the requirements of Stage A, as outlined within the Quality
Assurance Checklist presented at Appendix A.
1.7 How to Comment on this Scoping Report
1.7.1 This Scoping Report will be subject to a 5 week consultation period from 6th March to 10th April
2017. Details of how to respond to the consultation are provided below.
9 ‘Appropriate Assessment’ has been historically used as an umbrella term to describe the process of assessment as a whole. The whole process is now more usually termed ‘Habitats Regulations Assessment’ (HRA), and ‘Appropriate Assessment’ is used to indicate a specific stage within the HRA.

11 © Amec Foster Wheeler Environment & Infrastructure UK Limited
March 2017 Doc Ref. bri005ir
This Consultation: How to Give Us Your Views
We would welcome your views on any aspect of this Scoping Report. However, we would
particularly welcome responses to the following questions:
4. Do you think that this Scoping Report sets out sufficient information to establish the context
for the IA of the Local Plan in terms of the review of plans and programmes and baseline
evidence and analysis? If not, which areas do you think have been missed and where is
information on these topics available from?
5. Are the main economic, social and environmental issues identified in this Scoping Report
relevant to the IA of the Local Plan? If not, which issues do you think need to be included or
excluded?
6. Do you agree with the proposed approach to the IA of the Local Plan? Do the IA objectives
and guide questions that comprise the IA Framework cover a sufficient range of
environmental, social and economic topics? If not, which objectives should be amended and
which other objectives do you believe should be included?
Comments should be made in writing, include the name and address of the respondent and be
returned by email or post. Documents are available to view on the Councils website throughout
the consultation period http://www.tameside.gov.uk/planning/tamesidelocalplan.
Reference copies are also available at all Council Libraries, Customer Service Centre and the
Planning Departments Principal Office during normal opening hours, as per the address details
below.
Please provide your comments by 10th April 2017. Comments should be sent to:
By email: [email protected].
By post: Planning Policy, Tameside MBC, Clarence Arcade, Stamford Street, Ashton-under-Lyne,
OL6 7PT.
Please note all comments will be held by the Council and will be available to view publicly.
Comments cannot be treated as confidential. Your personal information such as your postal and
email address will not be published but your name and organisation (if relevant) will.
Tameside Council maintains a database of consultees who wish to be kept informed about the
Local Plan. In responding to this consultation your contact details will automatically be added to
the consultation database (if not already held). If you do not want to be contacted about future
Local Plan consultations please state this in your response.

12 © Amec Foster Wheeler Environment & Infrastructure UK Limited
March 2017 Doc Ref. bri005ir
2. Review of Plans and Programmes
2.1 Introduction
2.1.1 One of the first steps in undertaking IA is to identify and review other relevant plans and
programmes that could influence the Local Plan. The requirement to undertake a plan and
programme review and to identify the environmental and wider sustainability objectives relevant to
the plan being assessed is set out in the SEA Directive. An ‘Environmental Report’ required under
the SEA Directive should include:
“An outline of the contents, main objectives of the plan or programme and relationship with
other relevant plans and programmes” to determine “the environmental protection
objectives, established at international (European) community or national level, which are
relevant to the plan or programme…and the way those objectives and any environmental
considerations have been taken into account during its preparation” (Annex 1 (a), (e)).
2.1.2 Plans and programmes relevant to the Local Plan may be those at an international/ European, UK,
national, regional, sub-regional or local level, as relevant to the scope of the document. The review
of relevant plans and programmes aims to identify the relationships between the Local Plan and
these other documents i.e. how the Local Plan could be affected by the other plans’ and
programmes’ aims, objectives and/or targets, or how it could contribute to the achievement of their
sustainability objectives. The review also ensures that the relevant environmental protection and
sustainability (including health and equality) objectives are integrated into the IA. Additionally,
reviewing plans and programmes can provide appropriate information on the baseline for the plan
area and help identify the key sustainability, health and equality issues.
2.1.3 The completed review of plans and programmes will be used to provide the policy context for the
subsequent assessment process and has helped to inform the development of the objectives and
guide questions that comprise the IA Framework (see Section 4).
2.2 Review of Plans and Programmes
2.2.1 Over 100 international/European, national, regional/sub-regional and local level plans and
programmes have been reviewed in preparing this Scoping Report. These are listed in Table 2.1,
with the results of the review provided in Appendix B.
Table 2.1 Plans and Programmes Reviewed for the Integrated Assessment of the Local Plan
Plan/Programme
International/European Plans and Programmes
The Cancun Agreement (2011)
The Convention for the Protection of the Architectural Heritage of Europe (Granada Convention)
The European Convention on the Protection of Archaeological Heritage (Valetta Convention)
Council Directive 91/271/EEC for Urban Waste-water Treatment
European Commission (EC) (2011) A Resource- Efficient Europe- Flagship Initiative Under the Europe 2020 Strategy, Communication from the Commission to the European Parliament, the Council, the European Economic and Social Committee and the Committee of the Regions (COM 2011/21)
European Landscape Convention 2000 (became binding March 2007)
European Union (EU) Nitrates Directive (91/676/EEC)
EU Directive on the Conservation of Natural Habitats and of Wild Fauna and Flora (92/43/EEC) & Subsequent Amendments
EU Packaging and Packaging Waste Directive (94/62/EC)
EU Drinking Water Directive (98/83/EC)
EU Directive on the Landfill of Waste (99/31/EC)
EU Water Framework Directive (2000/60/EC)
EU 2001/42/EC Directive on the Assessment of the Effects of Certain Plans and Programmes on the Environment (SEA Directive)

13 © Amec Foster Wheeler Environment & Infrastructure UK Limited
March 2017 Doc Ref. bri005ir
Plan/Programme
EU Directive 2002/91/EC (2002) Directive 2002/91/EC on the Energy Performance of Buildings
EU Environmental Noise Directive (Directive 2002/49/EC)
EU Bathing Waters Directive 2006/7/EC
EU (2006) European Employment Strategy
EU (2006) Mining Waste Directive (2006/21/EC)
EU (2006) Renewed EU Sustainable Development Strategy
EU Floods Directive 2007/60/EC
EU Air Quality Directive (2008/50/EC) and previous directives (96/62/EC; 99/30/EC; 2000/69/EC & 2002/3/EC)
EU Integrated Pollution Prevention and Control Directive (2008/1/EC)
EU Directive on Waste (Directive 75/442/EEC, 2006/12/EC 2008/98/EC as amended)
EU Directive on the Conservation of Wild Birds (09/147/EC) (codified version of Council Directive 79/409/EEC as amended)
EU Renewable Energy Directive (2009/28/EC)
EU Industrial Emissions Directive (2010/75/EU)
EU (2011) EU Biodiversity Strategy to 2020 – towards implementation
EU Directive 2016/2284/EU on the Reduction of National Emissions of Certain Atmospheric Pollutants
United Nations (2015) United Nations Climate Change Conference (COP 21) Paris Agreement
UNESCO World Heritage Convention (1972)
UNFCCC (1997) The Kyoto Protocol to the UNFCCC
World Commission on Environment and Development (1987) Our Common Future (The Brundtland Report)
The World Summit on Sustainable Development (WSSD), Johannesburg, September 2002 - Commitments arising from Johannesburg Summit (2002)
National Plans and Programmes
Department for Culture, Media and Sport (DCMS) (2001) The Historic Environment: A Force for our Future
DCMS (2007) Heritage Protection for the 21st Century - White Paper
DCMS (2008) Play Strategy for England
Department for Communities and Local Government (DCLG) (2011) Planning for Schools Development
DCLG (2012) National Planning Policy Framework (including proposed changes)
DCLG (2014) Planning Practice Guidance
DCLG (2014) National Planning Policy for Waste
DCLG (2014) Witten Statement on Sustainable Drainage Systems
DCLG (2015) Planning Policy for Traveller Sites
Department for Education (2014) Home to School Travel and Transport Guidance
Department of Energy and Climate Change (DECC) (2009) The UK Low Carbon Transition Plan: National Strategy for Climate and Energy
Department for Food and Rural Affairs (Defra) (2007) The Air Quality Strategy for England, Scotland, Wales and Northern Ireland
Defra (2007) Strategy for England's Trees, Woods and Forests
Defra (2009) Safeguarding Our Soils: A Strategy for England
Defra (2011) Biodiversity 2020: A Strategy for England’s Wildlife and Ecosystem Services
Defra (2011) Natural Environment White Paper: The Natural Choice: Securing the Value of Nature
Defra (2012) UK Post 2010 Biodiversity Framework
Defra (2013) The National Adaptation Programme – Making the Country Resilient to a Changing Climate
Defra (2013) Waste Management Plan for England
Department of Health (2009) Living Well with Dementia: A National Dementia Strategy
Department of Health (2015/2016) Prime Minister’s Challenge on Dementia 2020 and Implementation Plan
Department of Health and NHS England (2015) Future in Mind: Promoting, Protecting and Improving Our Children and Young People’s Mental Health and Wellbeing
Environment Agency (2013) Managing Water Extraction
Environment Agency (2013) Water Stressed Areas – Final Classification
Forestry Commission (2005) Trees and Woodlands Nature's Health Service
Historic England (2015) Historic Environment Good Practice Advice in Planning Note 1
HM Government (1974) Control of Pollution Act 1974
HM Government (1979) Ancient Monuments and Archaeological Areas Act
HM Government (1981) Wildlife and Countryside Act 1981
HM Government (1990) Environmental Protection Act 1990
HM Government (1990) Planning (Listed Building and Conservation Areas) Act 1990
HM Government (1991) Water Resources Act 1991
HM Government (2000) Countryside and Rights of Way Act 2000
HM Government (2004) Housing Act 2004
HM Government (2005) Securing the Future - Delivering UK Sustainable Development Strategy
HM Government (2006) The Natural Environment and Rural Communities (NERC) Act 2006
HM Government (2008) The Climate Change Act 2008
HM Government (2009) The Flood Risk Regulations 2009
HM Government (2009) The UK Renewable Energy Strategy
HM Government (2010) The Conservation of Habitats and Species Regulations 2010
HM Government (2010) Flood and Water Management Act 2010

14 © Amec Foster Wheeler Environment & Infrastructure UK Limited
March 2017 Doc Ref. bri005ir
Plan/Programme
HM Government (2011) Carbon Plan: Delivering our Low Carbon Future
HM Government (2011) No Health Without Mental Health: A Cross-government Mental Health Outcomes
Strategy for People of All Ages
HM Government (2011) Water for Life, White Paper
HM Government (2012) Health and Social Care Act 2012
HM Government (2012) Preventing Suicide in England: A Cross-government Outcomes Strategy to Save Lives
HM Government (2013) The Community Infrastructure Levy (Amendment) Regulations 2013
HM Government (2015) English Apprenticeships: Our 2020 Vision
HM Government (2016) Childhood Obesity: A Plan for Action
NHS England (2014) Five Year Forward View
Regional Plans and Programmes
Defra and Environment Agency (2015) North West District River Basin Management Plan
Environment Agency (2016) North West River Basin District Flood Risk Management Plan 2015-2021
HM Government (2014) Greater Manchester Growth Deal
HM Government (2016) The Northern Powerhouse: One Agenda, One Economy, One North
HM Government (2016) Northern Powerhouse Strategy
United Utilities (2014) Final Drought Plan
United Utilities (2015) Water Resources Management Plan
Sub-Regional (County) Plans and Programmes
Association of Greater Manchester Authorities (AGMA) (2008) An Ecological Framework for Greater Manchester
AGMA and Natural England (2008) Towards a Green Infrastructure Framework for Greater Manchester
AGMA (2011) Greater Manchester Climate Change Strategy 2011-2020
AGMA (2012) Greater Manchester Joint Waste Development Plan Document
AGMA (2012) Greater Manchester Surface Water Management Plan
AGMA (2013) Greater Manchester Joint Minerals Plan
Environment Agency (2009) Irwell Catchment Flood Management Plan
Environment Agency (2009) Upper Mersey Catchment Flood Management Plan
Environment Agency (2013) Northern Manchester Abstraction Licensing Strategy
Environment Agency (2013) Upper Mersey Abstraction Licensing Strategy
Greater Manchester Biodiversity Project (2009) Greater Manchester Biodiversity Action Plan
Greater Manchester Biodiversity Project (2011) Greater Manchester Biodiversity and Geodiversity Action Plan for Quarries
Greater Manchester Combined Authority (GMCA) (2016) Climate Change and Low Emission Strategies’ Whole Place Implementation Plan for Greater Manchester (2016-2020)
GMCA (2016) Draft Greater Manchester Spatial Framework (emerging)
GMCA (2016) Greater Manchester Work & Skills Strategy and Priorities 2016 to 2019
GMCA and AGMA (2013) Strong Together: Greater Manchester Strategy 2013
GMCA, Greater Manchester Local Enterprise Partnership (GMLEP) and AGMA (2014) Greater Manchester Growth and Reform Plan
GMCA and GMLEP (2015) Greater Manchester Manufacturing Strategy
GMCA and NHS (2015) Taking Charge of Our Health and Social Care in Greater Manchester
GMCA and NHS (2016) Greater Manchester Mental Health and Wellbeing Strategy
GMCA and TGM (2016) Greater Manchester Air Quality Action Plan
GMCA and TGM (2016) Greater Manchester Low-Emission Strategy
GMCA and TGM (2017) Greater Manchester Transport Strategy 2040
Greater Manchester Economic Advisory Panel (2011) Greater Manchester Growth Plan
Greater Manchester Mayor and Police & Crime Commissioner (2016) Police and Crime Plan Greater Manchester
NHS Tameside and Glossop (2010) Tameside and Glossop Healthy Weight Strategy (2010-2015)
NHS Tameside and Glossop Tameside et al (2010) and Tameside and Glossop Mental Wellbeing Strategy 2011-2013
NHS Tameside and Glossop Commissioning Group (2015) Tameside and Glossop Locality Plan
TGM (2012) Greater Manchester Rail Policy 2012 – 2024
Local Plans and Programmes (including neighbouring authority local plans)
High Peak Borough Council (2016) High Peak Local Plan Adopted April 2016
Manchester City Council (2012) Core Strategy Development Plan Document Adopted July 2012
Oldham Council (2011) Joint Core Strategy and Development Management Policies Adopted November 2011
Peak District National Park Authority (2011) Core Strategy Development Plan Document Adopted October 2011
Stockport Metropolitan Borough Council (2011) Core Strategy DPD Adopted March 2011
Tameside Children’s Trust (2013) Interim Statement for a Children and Young People’s Plan 2013 – 2016
Tameside and Glossop Single Commission (2016) Care Together: Commissioning for Reform Strategy 2016 - 2020
Tameside Metropolitan Borough Council (undated) Equal Opportunities Policy
Tameside Metropolitan Borough Council (2004) The Tameside Unitary Development Plan Adopted November 2004
Tameside Metropolitan Borough Council (2005) Brookbottom Mossley Supplementary Planning Guidance

15 © Amec Foster Wheeler Environment & Infrastructure UK Limited
March 2017 Doc Ref. bri005ir
Plan/Programme
Tameside Metropolitan Borough Council (2005) Tameside Sustainable Design and Construction Guide Supplementary Planning Document (SPD)
Tameside Metropolitan Borough Council (2007) Draft Public Rights of Way Improvement Plan 2007-2016
Tameside Metropolitan Borough Council (2007) Trees and Landscaping on Development Sites SPD
Tameside Metropolitan Borough Council (2009) Employment Land SPD
Tameside Metropolitan Borough Council (2009) Tameside Countryside Strategy 2009-2019
Tameside Metropolitan Borough Council (2010) Ashton Town Centre SPD
Tameside Metropolitan Borough Council (2010) Residential Design SPD
Tameside Metropolitan Borough Council (2010) Tameside Housing Strategy 2010-16
Tameside Metropolitan Borough Council (2011) Hyde Town Centre SPD (emerging)
Tameside Metropolitan Borough Council (emerging) Haughton Green SPD (emerging)
Tameside Metropolitan Borough Council (2012) Tenancy Strategy 2013-2016
Tameside Metropolitan Borough Council (2013) Homelessness Prevention Strategy 2013-2018
Tameside Metropolitan Borough Council et al (2013) Tameside Joint Health and Wellbeing Strategy 2013-2016
Tameside Metropolitan Borough Council (2013) Tameside Domestic Abuse Strategy 2013-2016
Tameside Metropolitan Borough Council (2013) Tameside Empty Property Strategy 2013-2015
Tameside Metropolitan Borough Council (2014) Tameside Poverty Strategy 2014-2017
Tameside Metropolitan Borough Council (2015) Corporate Equality Scheme 2015-19
Tameside Metropolitan Borough Council et al (2015) Tameside and Glossop Children and Young People’s Emotional Wellbeing and Mental Health Transformation Plan 2015-2020
Tameside Metropolitan Borough Council (2016) Corporate Plan 2016-21
Tameside Metropolitan Borough Council (2016) Playing Pitch Strategy 2015
Tameside Metropolitan Borough Council (2016) Tameside Pledges 2016
Tameside Metropolitan Borough Council (2016) Tameside Flood Risk Management Strategy
Tameside Safeguarding Children Board (2015) Learning and Improvement Framework
Tameside Safeguarding Children Board (undated) Tameside Multi-agency Neglect Strategy
Tameside Strategic Partnership (2004) Tameside Neighbourhood Renewal Strategy
Tameside Strategic Partnership (2009) Our Life in Tameside 2009 – 2019: Tackling Health Inequalities and Improving Health
Tameside Strategic Partnership (2010) Sustainable Use of Resources Strategy and Action Plan 2010-20
Tameside Strategic Partnership (2012) Enterprising Tameside: A New Economic Strategy for Tameside 2012-26 and Action Plan
2.3 Key Objectives and Policy Issues
2.3.1 The review of plans and programmes presented in Appendix B has identified a number of
objectives and policy issues relevant to the Local Plan and the scope of the IA across the following
topic areas:
Population and Community (including housing, economy, education and skills and
deprivation);
Equality;
Health and Wellbeing;
Transport and Accessibility;
Biodiversity and Green Infrastructure;
Land Use, Geology and Soil;
Water;
Air Quality;
Climate Change;
Materials Assets;
Cultural Heritage; and
Landscape and Townscape.
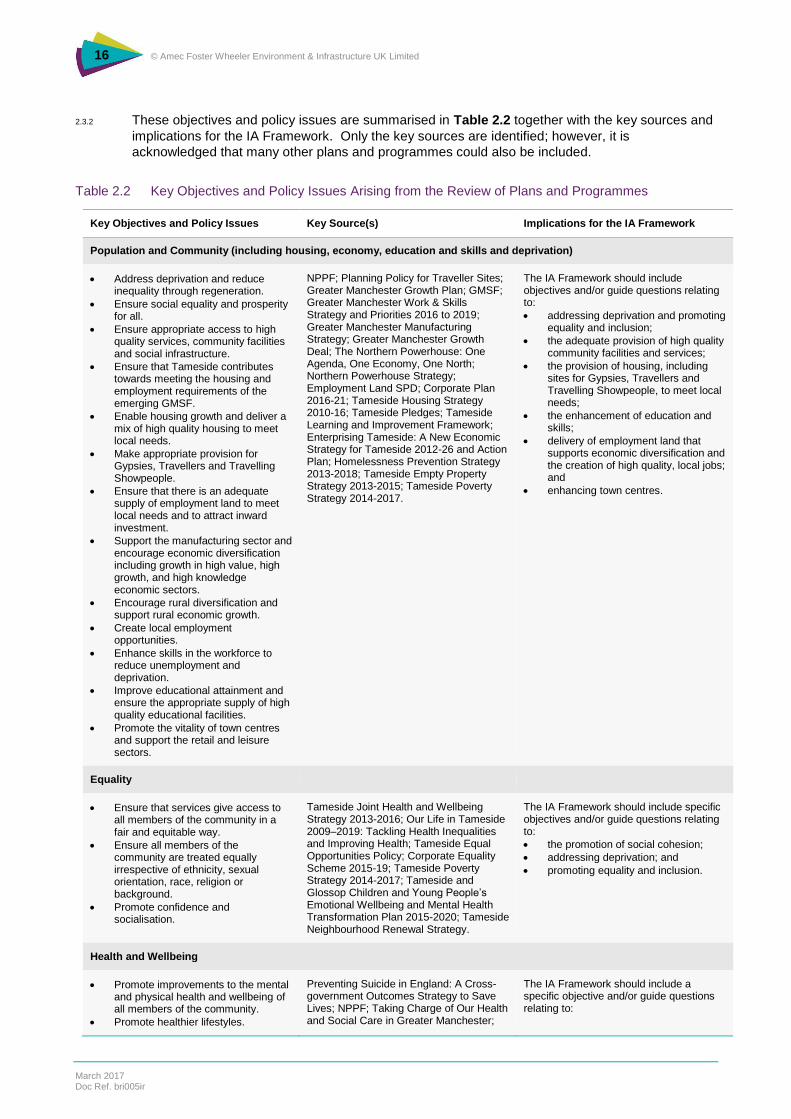
16 © Amec Foster Wheeler Environment & Infrastructure UK Limited
March 2017 Doc Ref. bri005ir
2.3.2 These objectives and policy issues are summarised in Table 2.2 together with the key sources and
implications for the IA Framework. Only the key sources are identified; however, it is
acknowledged that many other plans and programmes could also be included.
Table 2.2 Key Objectives and Policy Issues Arising from the Review of Plans and Programmes
Key Objectives and Policy Issues Key Source(s) Implications for the IA Framework
Population and Community (including housing, economy, education and skills and deprivation)
Address deprivation and reduce inequality through regeneration.
Ensure social equality and prosperity for all.
Ensure appropriate access to high quality services, community facilities and social infrastructure.
Ensure that Tameside contributes towards meeting the housing and employment requirements of the emerging GMSF.
Enable housing growth and deliver a mix of high quality housing to meet local needs.
Make appropriate provision for Gypsies, Travellers and Travelling Showpeople.
Ensure that there is an adequate supply of employment land to meet local needs and to attract inward investment.
Support the manufacturing sector and encourage economic diversification including growth in high value, high growth, and high knowledge economic sectors.
Encourage rural diversification and support rural economic growth.
Create local employment opportunities.
Enhance skills in the workforce to reduce unemployment and deprivation.
Improve educational attainment and ensure the appropriate supply of high quality educational facilities.
Promote the vitality of town centres and support the retail and leisure sectors.
NPPF; Planning Policy for Traveller Sites; Greater Manchester Growth Plan; GMSF; Greater Manchester Work & Skills Strategy and Priorities 2016 to 2019; Greater Manchester Manufacturing Strategy; Greater Manchester Growth Deal; The Northern Powerhouse: One Agenda, One Economy, One North; Northern Powerhouse Strategy; Employment Land SPD; Corporate Plan 2016-21; Tameside Housing Strategy 2010-16; Tameside Pledges; Tameside Learning and Improvement Framework; Enterprising Tameside: A New Economic Strategy for Tameside 2012-26 and Action Plan; Homelessness Prevention Strategy 2013-2018; Tameside Empty Property Strategy 2013-2015; Tameside Poverty Strategy 2014-2017.
The IA Framework should include objectives and/or guide questions relating to:
addressing deprivation and promoting equality and inclusion;
the adequate provision of high quality community facilities and services;
the provision of housing, including sites for Gypsies, Travellers and Travelling Showpeople, to meet local needs;
the enhancement of education and skills;
delivery of employment land that supports economic diversification and the creation of high quality, local jobs; and
enhancing town centres.
Equality
Ensure that services give access to all members of the community in a fair and equitable way.
Ensure all members of the community are treated equally irrespective of ethnicity, sexual orientation, race, religion or background.
Promote confidence and socialisation.
Tameside Joint Health and Wellbeing Strategy 2013-2016; Our Life in Tameside 2009–2019: Tackling Health Inequalities and Improving Health; Tameside Equal Opportunities Policy; Corporate Equality Scheme 2015-19; Tameside Poverty Strategy 2014-2017; Tameside and Glossop Children and Young People’s Emotional Wellbeing and Mental Health Transformation Plan 2015-2020; Tameside Neighbourhood Renewal Strategy.
The IA Framework should include specific objectives and/or guide questions relating to:
the promotion of social cohesion;
addressing deprivation; and
promoting equality and inclusion.
Health and Wellbeing
Promote improvements to the mental and physical health and wellbeing of all members of the community.
Promote healthier lifestyles.
Preventing Suicide in England: A Cross-government Outcomes Strategy to Save Lives; NPPF; Taking Charge of Our Health and Social Care in Greater Manchester;
The IA Framework should include a specific objective and/or guide questions relating to:

17 © Amec Foster Wheeler Environment & Infrastructure UK Limited
March 2017 Doc Ref. bri005ir
Key Objectives and Policy Issues Key Source(s) Implications for the IA Framework
Minimise noise pollution.
Reduce crime including the fear of crime.
Reduce anti-social behaviour.
Reduce instances of domestic abuse.
Ensure that there are appropriate facilities for the disabled and elderly.
Deliver safe and secure networks of green infrastructure and open space.
Greater Manchester Mental Health and Wellbeing Strategy; Police and Crime Plan Greater Manchester; Tameside Joint Health and Wellbeing Strategy 2013-2016; Corporate Plan 2016-21; Tameside and Glossop Locality Plan; Tameside and Glossop Children and Young People’s Emotional Wellbeing and Mental Health Transformation Plan 2015-2020; Tameside Countryside Strategy 2009-2019; Tameside Playing Pitch Strategy; Tameside Domestic Abuse Strategy 2013-2016.
the promotion of health and wellbeing including mental health;
appropriate provision of health facilities and services;
the adequate provision of open space and recreational facilities;
the adequate provision of facilities and ensuring access for the disabled and elderly; and
reducing crime, the fear of crime and anti-social behaviour.
Transport and Accessibility
Encourage sustainable transport and reduce the need to travel.
Manage traffic and congestion.
Improve public transport provision.
Encourage walking and cycling.
Enhance accessibility to key community facilities, services and jobs for all.
Ensure timely investment in transportation infrastructure to accommodate new development.
Reduce road freight movements.
NPPF; Greater Manchester Transport Strategy 2040: Greater Manchester Rail Policy 2012–2024; Our Vision; Tameside Countryside Strategy 2009-2019
The IA Framework should include objectives and/or guide questions relating to:
reducing the need to travel, particularly by car;
the promotion of sustainable forms of transport;
encouraging walking and cycling;
maintaining and enhancing accessibility to key facilities, services and jobs;
investment in transportation infrastructure to meet future needs.
Biodiversity and Green Infrastructure
Protect and enhance biodiversity, including designated sites, priority species, habitats and ecological networks.
Identify opportunities for green infrastructure provision.
Identify opportunities for open space provision.
Natural Environment White Paper: The Natural Choice: Securing the Value of Nature; Biodiversity 2020: A Strategy for England’s Wildlife and Ecosystem Services; UK post 2010 Biodiversity Framework; NPPF; Greater Manchester Biodiversity Action Plan; Greater Manchester Biodiversity and Geodiversity Action Plan for Quarries; GMSF; Trees and Landscaping on Development Sites SPD; Tameside Countryside Strategy 2009-2019.
The IA Framework should include a specific objective relating to the protection and enhancement of biodiversity including appropriate green infrastructure provision.
Land Use, Geology and Soil
Encourage the use of previously developed (brownfield) land.
Promote the re-use of derelict land and buildings.
Reduce land contamination.
Protect soil quality and minimise the loss of Best and Most Versatile agricultural land.
Promote high quality design.
Avoid damage to, and protect, geologically important sites.
Encourage mixed use development.
Safeguarding Our Soils: A Strategy for England; NPPF; GMSF; Tameside Empty Property Strategy 2013-2015; Residential Design SPD.
The IA Framework should include objectives and/or guide questions relating to:
encouraging the use of previously developed land and buildings;
reducing land contamination;
avoiding the loss of Best and Most Versatile agricultural land;
promoting high quality design including mixed use development;
protecting and avoiding damage to geologically important sites.
Water
Protect and enhance surface and groundwater quality.
Improve water efficiency.
Avoid development in areas of flood risk.
Reduce the risk of flooding arising from new development.
Water Framework Directive; Drinking Water Directive; Floods Directive; The Flood Risk Regulations 2009; Flood and Water Management Act 2010; Water for Life, White Paper; NPPF; North West District River Basin Management Plan; North West River Basin District Flood Risk
The IA Framework should include specific objectives relating to the protection and enhancement of water quality and quantity, avoidance of flood risk and minimising surface water run-off.

18 © Amec Foster Wheeler Environment & Infrastructure UK Limited
March 2017 Doc Ref. bri005ir
Key Objectives and Policy Issues Key Source(s) Implications for the IA Framework
Ensure timely investment in water management infrastructure to accommodate new development.
Promote the use of Sustainable Urban Drainage Systems.
Management Plan 2015-2021; United Utilities Final Drought Plan; United Utilities Water Resources Management Plan; Greater Manchester Surface Water Management Plan; Irwell Catchment Flood Management Plan; Upper Mersey Catchment Flood Management Plan; Northern Manchester Abstraction Licensing Strategy; Upper Mersey Abstraction Licensing Strategy; Tameside Floodrisk Management Strategy.
Air Quality
Ensure that air quality is maintained or enhanced and that emissions of air pollutants are kept to a minimum.
Air Quality Directive; Air Quality Strategy for England, Scotland, Wales and Northern Ireland; NPPF; Greater Manchester Air Quality Action Plan; Greater Manchester Low-Emission Strategy.
The IA Framework should include a specific objective and/or guide question relating to air quality.
Climate Change
Minimise the effects of climate change.
Reduce emissions of greenhouse gases that may cause climate change.
Encourage the provision of renewable energy.
Move towards a low carbon economy.
Promote adaptation to the effects of climate change.
Climate Change Act 2008; Carbon Plan: Delivering our Low Carbon Future; UK Renewable Energy Strategy; NPPF; Greater Manchester Climate Change Strategy 2011-2020; Climate Change and Low Emission Strategies’ Whole Place Implementation Plan for Greater Manchester 2016-2020.
The IA Framework should include a specific objective relating to climate change mitigation and adaptation.
Material Assets
Promote the waste hierarchy (reduce, reuse, recycle, recover).
Ensure the adequate provision of local waste management facilities.
Promote the efficient and sustainable use of mineral resources.
Promote the use of local resources.
Avoid the sterilisation of mineral reserves.
Promote the use of substitute or secondary and recycled materials and minerals waste.
Waste Framework Directive; Landfill Directive; Waste Management Plan for England; NPPF; National Planning Policy for Waste; Greater Manchester Joint Waste Plan; Greater Manchester Joint Minerals Plan; Sustainable Use of Resources Strategy and Action Plan 2010-20.
The IA Framework should include objectives and/or guide questions relating to:
promotion of the waste hierarchy; and
the sustainable use of minerals.
Cultural Heritage
Conserve and enhance cultural heritage assets and their settings.
Maintain and enhance access to cultural heritage assets.
Respect, maintain and strengthen local character and distinctiveness.
Improve the quality of the built environment.
NPPF; Historic Environment Good Practice Advice in Planning Note 1; GMSF; Tameside Sustainable Design and Construction Guide SPD; Residential Design SPD.
The IA Framework should include a specific objective relating to the conservation and enhancement of the Borough’s cultural heritage.
Landscape and Townscape
Protect and enhance the quality and distinctiveness of natural landscapes and townscapes.
Promote access to the countryside.
Promote high quality design that respects and enhances local character.
NPPF; GMSF; Trees and Landscaping on Development Sites SPD; Tameside Countryside Strategy 2009-2019; Draft Public Rights of Way Improvement Plan 2007-2016; Tameside Sustainable Design and Construction Guide SPD; Residential Design SPD; Hyde Town Centre SPD.
The IA Framework should include a specific objective relating to:
the protection and enhancement of the Borough’s distinctive landscapes and townscapes.

19 © Amec Foster Wheeler Environment & Infrastructure UK Limited
March 2017 Doc Ref. bri005ir
3. Baseline Analysis
3.1 Introduction
3.1.1 An essential part of the IA scoping process is the identification of the current baseline conditions
and their likely evolution. It is only with a knowledge of existing conditions, and a consideration of
their likely evolution, that the effects of the Local Plan can be identified and assessed and its
subsequent success or otherwise be monitored. The SEA Directive also requires that the evolution
of the baseline conditions of the plan area (that would take place without the plan or programme) is
identified, described and taken into account. Consideration of the baseline and its subsequent
evolution without the Local Plan is also useful in determining the key issues for each topic that
should be taken forward in the IA, through the IA objectives and guide questions that comprise the
IA Framework (see Section 4).
3.1.2 This section of the Scoping Report identifies and characterises current socio-economic (including
health and equality) and environmental baseline conditions for Tameside, along with how these are
likely to change in the future. The analysis is presented for the following topic areas:
Population and Demographics;
Housing;
Economy;
Health and Wellbeing;
Education and Skills;
Deprivation;
Transport and Accessibility;
Biodiversity and Green Infrastructure;
Land Use, Geology and Soil;
Water;
Air Quality;
Climate Change;
Materials Assets;
Cultural Heritage; and
Landscape and Townscape.
3.1.3 Additionally, this section (with reference to Appendix C) presents a high level overview of the
characteristics of the Borough’s key settlements in terms of key environmental constraints.
3.1.4 To inform the baseline analysis, data has been drawn from a variety of sources, including: 2011
Census; Nomis; the Council’s existing plan evidence base including the Authority Monitoring
Report (AMR); the Environment Agency; Historic England; Index of Multiple Deprivation 2015;
Department for Environment, Food and Rural Affairs (Defra); and the Department for Business,
Energy and Industrial Strategy (BEIS).
3.1.5 The key sustainability, health and equality issues arising from the review of baseline conditions are
summarised at the end of each topic together with the linkages between the topics considered.

20 © Amec Foster Wheeler Environment & Infrastructure UK Limited
March 2017 Doc Ref. bri005ir
3.2 Tameside Metropolitan Borough – An Overview
3.2.1 Tameside is one of ten Metropolitan Boroughs that make up the Greater Manchester conurbation.
The Borough is located in the east of Greater Manchester (see Figure 3.1), bordering the borough
of Oldham at its northern boundaries, the borough of Stockport at its southern boundary and
Manchester City to the west. At its eastern boundary, Tameside neighbours the Derbyshire
borough of High Peak and the Peak District National Park.
Figure 3.1 Tameside Metropolitan Borough
3.2.2 As with much of Greater Manchester, the industrial revolution has played a key part in shaping
Tameside’s urban and rural landscapes, with the historic mill towns of Ashton-under-Lyne, Hyde,
Denton, Droylsden, Stalybridge, Mossley, Dukinfield and Audenshaw, together with the villages of
Longdendale, retaining their status as urban centres and/or settlements today. With it remains the
industrial heritage of terraced housing, mills and industrial infrastructure characterising much of the
Borough. High level constraint mapping for each of the Borough’s key settlements is contained in
Appendix C.
3.2.3 The Borough has a great number of strengths which enhance the area’s uniqueness as a Greater
Manchester authority. There are, however, also a number of key issues which need to be
addressed to improve sustainability within the Borough. These issues are discussed further in the
sections that follow.
3.3 Population and Demographics
Population Trends
3.3.1 At the 2011 Census, Tameside had a population of 219,324, an increase of 2.9% since the 2001
Census when the population stood at 213,043. 2015 Office for National Statistics (ONS) mid-year

21 © Amec Foster Wheeler Environment & Infrastructure UK Limited
March 2017 Doc Ref. bri005ir
population estimates indicate that the population had risen to 221,700, a 1.1% increase since 2011.
The estimated population growth in Tameside between 2011 and 2015 is lower than for Greater
Manchester as a whole (2.6%) and the North West (1.7%).
3.3.2 Of the total resident population, 49.1% are male and 50.9% are female. This percentage split has
remained the same between 2011 and 2014. The proportion of males and females in Tameside is
similar to both the North West and England, but with Tameside having a slightly higher percentage
of females and lower percentage of males (see Table 3.1).
Table 3.1 Male / Female Population Split (2014)
Tameside (%) Greater Manchester (%) North West (%) England (%)
Male 49.1 49.6 49.2 49.3
Female 50.9 50.4 50.8 50.7
Source: ONS (2014) Population and Migration.
3.3.3 The 2011 Census shows that the majority of the Borough’s population (93%) were born in the UK,
higher than the averages for the North West and England (91.8% and 86.2% respectively) (see
Table 3.2). Only 0.5% of the Borough’s population had been resident in the UK for less than 2
years, lower than the percentage for England as a whole (which stood at 1.8% in 2011).
Table 3.2 Place of Birth
Tameside (%) North West (%) England (%)
UK 93 91.8 86.2
England 91.4 89.0 83.5
Northern Ireland 0.3 0.5 0.4
Scotland 0.9 1.4 1.3
Wales 0.4 0.9 1.0
Europe (excluding UK) 2.3 2.7 4.4
Africa 1.0 1.2 2.4
Middle East and Asia 3.1 3.5 4.8
The Americas and the Caribbean 0.2 0.5 1.3
Antarctica and Oceania 0.1 0.1 0.3
Source: ONS (2011) 2011 Census.
3.3.4 Net migration for the year ending June 2015 was fairly balanced with a total of 6,750 residents
moving from the Borough to other areas within the UK and 6,810 people moving to the Borough
from within the UK10. Migration, both in and out of Tameside, is primarily to/from other parts of the
Greater Manchester conurbation and particularly the Manchester City Council, Stockport and
Oldham local authority areas. Figure 3.2 and Figure 3.3 show principal migration
origins/destinations.
10 ONS (2016) Internal migration datasets. Available from https://www.ons.gov.uk/peoplepopulationandcommunity/populationandmigration/migrationwithintheuk/datasets/internalmigrationbyoriginanddestinationlocalauthoritiessexandsingleyearofagedetailedestimatesdataset [Accessed January 2017].
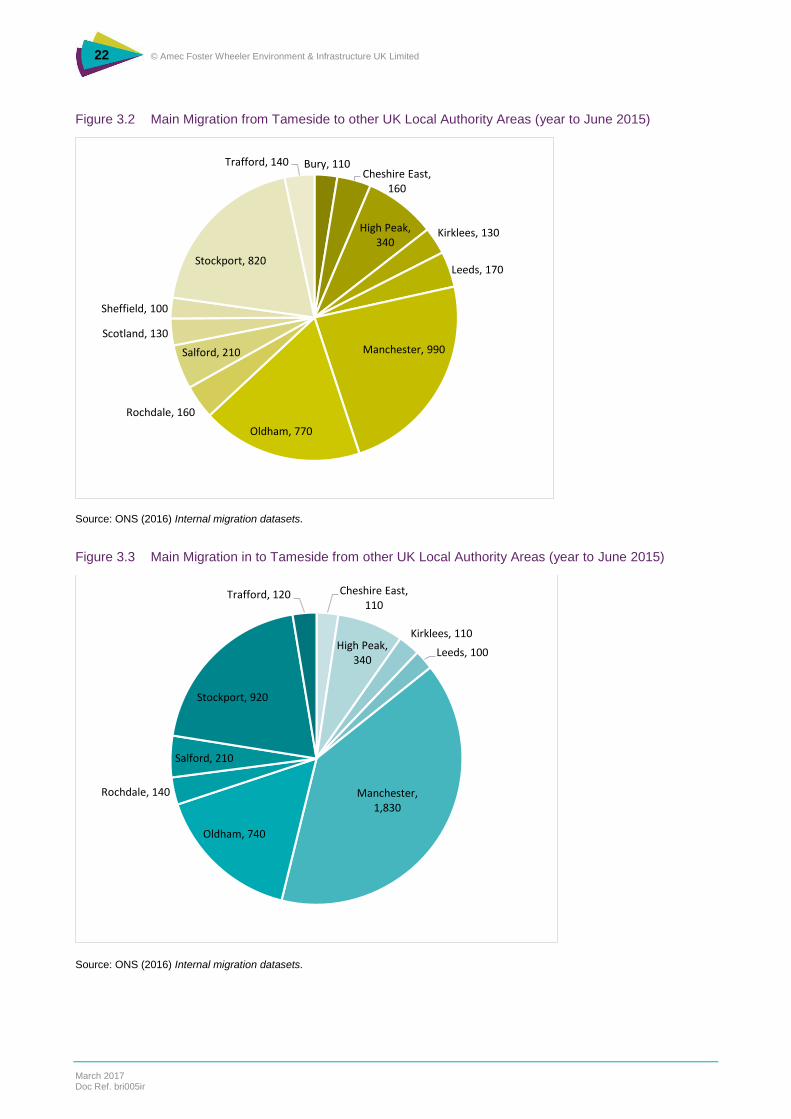
22 © Amec Foster Wheeler Environment & Infrastructure UK Limited
March 2017 Doc Ref. bri005ir
Figure 3.2 Main Migration from Tameside to other UK Local Authority Areas (year to June 2015)
Source: ONS (2016) Internal migration datasets.
Figure 3.3 Main Migration in to Tameside from other UK Local Authority Areas (year to June 2015)
Source: ONS (2016) Internal migration datasets.
Bury, 110Cheshire East,
160
High Peak, 340
Kirklees, 130
Leeds, 170
Manchester, 990
Oldham, 770
Rochdale, 160
Salford, 210
Scotland, 130
Sheffield, 100
Stockport, 820
Trafford, 140
Cheshire East, 110
High Peak, 340
Kirklees, 110
Leeds, 100
Manchester, 1,830
Oldham, 740
Rochdale, 140
Salford, 210
Stockport, 920
Trafford, 120

23 © Amec Foster Wheeler Environment & Infrastructure UK Limited
March 2017 Doc Ref. bri005ir
Age Structure
3.3.5 The age structure of the Borough’s population is similar to that of the North West region, although
trends are closer to the age structure of England (see Table 3.3). The percentage of those 15 or
under is slightly above the regional and national averages whereas the percentage of those who
are 65 and over is slightly lower.
Table 3.3 Population by Age Group
Age Group Tameside (%) North West (%) England (%)
0 – 15 years 19.5 18.6 18.9
16 – 24 years 11.4 12.1 11.9
25 – 44 years 27.0 26.4 27.5
45 – 59 years 20.2 19.8 19.4
60 – 64 years 6.3 6.2 6.0
65 and over 15.6 16.6 16.4
Source: ONS (2011) 2011 Census (Note: Totals taken directly from ONS data but North West and England percentages do not total
100% due to the effect of rounding).
Households
3.3.6 As at the 2011 Census, there were 94,953 households11 in Tameside, an increase of 5.5% from
2001 when the number stood at 89,981. Over the same period, the North West experienced a
7.0% increase in households and England a 7.9% increase.
3.3.7 Household composition in Tameside has also changed between 2001 and 2011 (see Table 3.4).
In particular, there has been an increase in the number of one person households which, at 11.3%,
is similar to the increase in one person households across the North West (11.4%) but higher than
for England (8.4%) over the same period. The rate of increase of family and other household types
in the Borough, meanwhile, was lower than for the North West and England.
Table 3.4 Percentage Change of Household Composition between 2001 and 2011
Tameside (%) North West (%) England (%)
All Households 5.5 7.0 7.9
One Person Households 11.3 11.4 8.4
One Family Only Households 1.8 3.4 5.4
Other Households 18.4 23.4 28.9
Source: ONS (2001 & 2011) 2001 and 2011 Census.
Ethnicity
3.3.8 Using ONS category descriptions, the population of Tameside is predominantly White (90.9% of
the population) with the second largest ethnic group being Asian/Asian British (6.6%). The
percentage split of all ethnicities is largely similar to the North West region (see Table 3.5),
11 ‘Household’ is defined as one person living alone, or a group of people (not necessarily related) living at the same address who share cooking facilities and share a living room, sitting room or dining area (ONS 2011 definition).
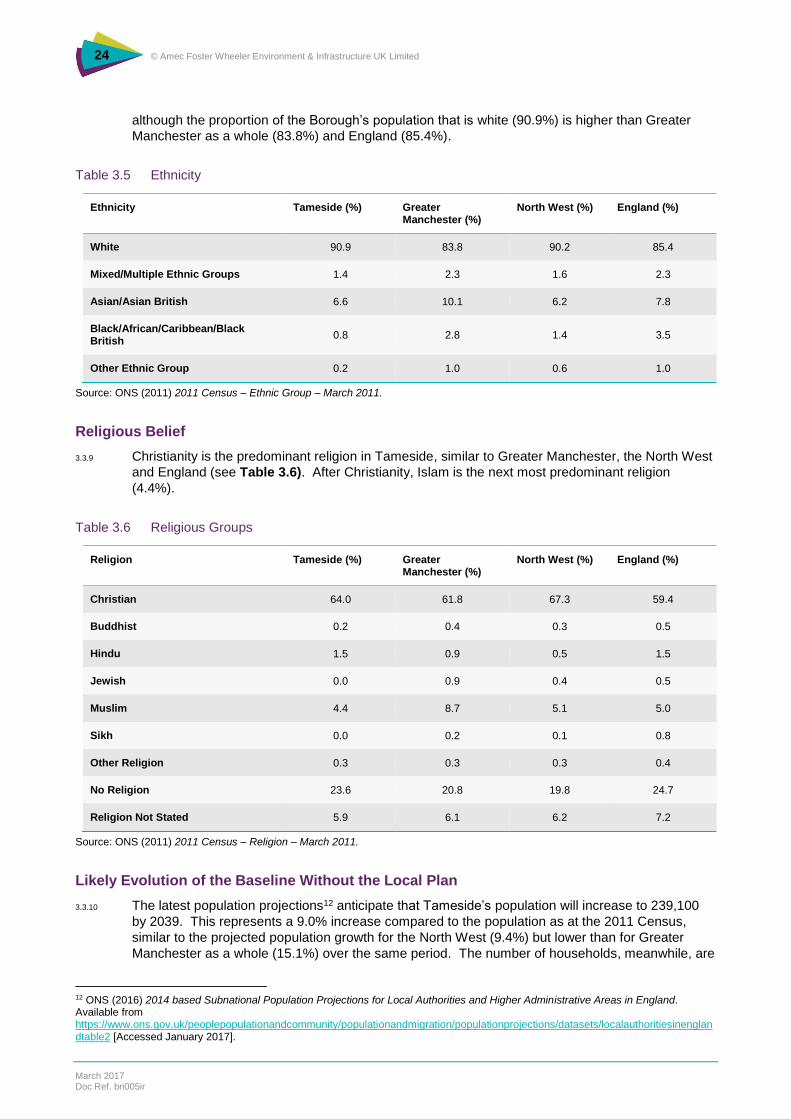
24 © Amec Foster Wheeler Environment & Infrastructure UK Limited
March 2017 Doc Ref. bri005ir
although the proportion of the Borough’s population that is white (90.9%) is higher than Greater
Manchester as a whole (83.8%) and England (85.4%).
Table 3.5 Ethnicity
Ethnicity Tameside (%) Greater Manchester (%)
North West (%) England (%)
White 90.9 83.8 90.2 85.4
Mixed/Multiple Ethnic Groups 1.4 2.3 1.6 2.3
Asian/Asian British 6.6 10.1 6.2 7.8
Black/African/Caribbean/Black British
0.8 2.8 1.4 3.5
Other Ethnic Group 0.2 1.0 0.6 1.0
Source: ONS (2011) 2011 Census – Ethnic Group – March 2011.
Religious Belief
3.3.9 Christianity is the predominant religion in Tameside, similar to Greater Manchester, the North West
and England (see Table 3.6). After Christianity, Islam is the next most predominant religion
(4.4%).
Table 3.6 Religious Groups
Religion Tameside (%) Greater Manchester (%)
North West (%) England (%)
Christian 64.0 61.8 67.3 59.4
Buddhist 0.2 0.4 0.3 0.5
Hindu 1.5 0.9 0.5 1.5
Jewish 0.0 0.9 0.4 0.5
Muslim 4.4 8.7 5.1 5.0
Sikh 0.0 0.2 0.1 0.8
Other Religion 0.3 0.3 0.3 0.4
No Religion 23.6 20.8 19.8 24.7
Religion Not Stated 5.9 6.1 6.2 7.2
Source: ONS (2011) 2011 Census – Religion – March 2011.
Likely Evolution of the Baseline Without the Local Plan
3.3.10 The latest population projections12 anticipate that Tameside’s population will increase to 239,100
by 2039. This represents a 9.0% increase compared to the population as at the 2011 Census,
similar to the projected population growth for the North West (9.4%) but lower than for Greater
Manchester as a whole (15.1%) over the same period. The number of households, meanwhile, are
12 ONS (2016) 2014 based Subnational Population Projections for Local Authorities and Higher Administrative Areas in England. Available from https://www.ons.gov.uk/peoplepopulationandcommunity/populationandmigration/populationprojections/datasets/localauthoritiesinenglandtable2 [Accessed January 2017].

25 © Amec Foster Wheeler Environment & Infrastructure UK Limited
March 2017 Doc Ref. bri005ir
forecast to rise to 110,43413, an increase of 15,481 households or 16.3% since 2011. This
compares to a projected household growth of 22.6% across Greater Manchester.
3.3.11 The dependency ratio (the proportion of children and older people per 100 people of working age
(16-64)) is projected to increase significantly from 55 per 100 in 2014 to 72 per 100 in 2039, largely
as a result of the increase in the number of older people.
3.3.12 Whilst existing national policy set out in the NPPF and the GMSF (once adopted) would provide the
basis to ensure that new housing is delivered in the Borough, the absence of a Local Plan would
restrict the ability of the Council to set specific requirements regarding the particular type, size and
tenure of housing. Further, opportunities to deliver community facilities and services to meet local
needs may not be realised. The changing needs of the Borough’s population (with a growing
ageing population and one person households) might therefore not be adequately met by new
development.
Key Issues
The need to meet future requirements for housing including for a mix of accommodation types
and tenures.
The need to meet the needs of an ageing population.
The need to ensure that the needs of different ethnic groups are met and that community
cohesion is fostered.
Links across the Integrated Assessment
3.3.13 Changes in population and household numbers alongside a change in age structure will relate to,
and impact upon, other topic areas. A growth in population is likely to increase employment
demand which could in turn increase economic growth as people move to the area to take up
employment.
3.3.14 The change in population dynamics drives demand for housing, health services, education, social,
transport and utility infrastructure, linking closely to resource consumption and greenhouse gas
emissions. The age structure, especially in an ageing population, can alter how these demands
are met, and also the pressures put on service levels, including provision of social and other
(including green) infrastructure.
3.4 Housing
3.4.1 The Greater Manchester Strategic Housing Market Assessment (2016)14 identifies that the sub-
region as a whole shares a number of characteristics that mean it is a suitable basis to define a
housing market area but the functioning of housing and labour markets within Greater Manchester
means that there is no simple way of subdividing the sub-region into identifiable housing market
areas.
Completions
3.4.1 At the time of the 2011 Census, there were 99,146 dwellings in Tameside, a 5.6% increase on
2001 when there were 93,876 dwellings. In the nine year period from 2006/07 to 2014/15, there
were a total of 4,275 net new dwellings completed, equivalent to around 475 per year on average
(see Table 3.7).
13 ONS (2016) 2014-based household projections: detailed data for modelling and analytical purposes. Available from https://www.gov.uk/government/statistical-data-sets/2014-based-household-projections-detailed-data-for-modelling-and-analytical-purposes [Accessed January 2017]. 14 Greater Manchester Combined Authority (2016) Strategic Housing Market Assessment Available from http://gmsf.objective.co.uk/portal/2016consultation/supp_docs?pointId=1477921277859#1477921277859 [Accessed January 2017].

26 © Amec Foster Wheeler Environment & Infrastructure UK Limited
March 2017 Doc Ref. bri005ir
Table 3.7 Housing Completions 2006/07 to 2014/15
Year Gross Completions Loss Net Completions
2006/07 675 112 563
2007/08 1164 375 789
2008/09 921 269 652
2009/10 347 94 253
2010/11 321 35 286
2011/12 355 5 350
2012/13 573 51 522
2013/14 411 45 366
2014/15 563 69 494
Source: Tameside Metropolitan Borough Council (2014) Authority’s Monitoring Report and recent Tameside Metropolitan Borough
Council monitoring data.
3.4.2 The AMR 2013/1415 set out that the Council proposed to take forward the target identified in the
suspended Joint Core Strategy and Development Management Policies DPD Preferred Options
document of 11,000 net additional dwellings over the 17 year Local Plan period 2012‐2029. The
Council formerly considered the most appropriate means to deliver this housing would be to adopt
a phased approach with 5 yearly intervals over the plan period, equivalent to an annual average
residual requirement between 2014 and 2029 of 650 dwellings per year when completions are
taken into account.
3.4.3 Following on from the above approach a Strategic Housing Market Assessment (SHMA) has been
produced for the Greater Manchester Combined Authority in order to develop a robust
understanding of housing market dynamics and an assessment for future needs over the period
2015-2035. The SHMA sets out the overall housing requirement for Greater Manchester and also
for the individual ten local authorities. The SHMA has been published alongside the draft GMSF
which sets out the overall housing land requirement for Tameside of 13,579 additional dwellings
between 2015 and 2035, an average of 679 dwellings per annum. In the draft GMSF this has been
rounded to 13,600 and 680 respectively
3.4.4 The Tameside Strategic Housing Land Availability Assessment (SHLAA) (2014) provided evidence
on the availability of housing land across the Borough for the 15 year period 2014-2029. The
findings of the SHLAA indicated that there were 718 sites within Tameside with the potential to
deliver 8,812 net additional dwellings over the 15 year period, suggesting a shortfall of available
land to meet longer term housing requirements. The SHLAA is due to be updated in 2017 by the
Council as part of the preparation of the Local Plan. This will provide an up-to-date assessment of
the amount of land available for housing development within the Borough.
Housing Stock – Type and Tenure
3.4.5 In 2011, the majority (63.8%) of the Borough’s housing stock was owned either outright or with a
mortgage. Just over a fifth of housing tenures (21.5%) were social rented and 13.2% privately
rented. As can be seen in Table 3.8, the percentage of households owned outright or with a
mortgage is higher in Tameside than across Greater Manchester as a whole, but both are lower
than the North West average.
15 Tameside Metropolitan Borough Council (2014) Authority’s Monitoring Report 2013/14.

27 © Amec Foster Wheeler Environment & Infrastructure UK Limited
March 2017 Doc Ref. bri005ir
Table 3.8 Housing Tenure
Tenure Tameside (%) Greater Manchester (%)
North West (%) England (%)
Owned
Owned outright or with mortgage
63.8 60.1 64.5 63.4
Shared Ownership (part owned, part rented)
0.3 0.5 0.5 0.8
Rented
Social rented 21.5 21.9 7.7 9.4
Private rented 13.2 16.1 10.6 8.3
Living rent free 1.1 1.4 15.4 16.8
Source: ONS (2011) 2011 Census.
3.4.6 2011 Census data shows that semi-detached houses comprised the largest proportion of the
Borough’s housing stock (37.5% of all stock) followed by terraced houses (35.7%) (see Figure
3.4). The percentage of the stock that were flats in the Borough, meanwhile, stood at 15.5% and
detached houses 11.3%.
Figure 3.4 Dwelling type
Source: ONS (2011) 2011 Census.
House Prices and Sales
3.4.7 House prices in Tameside have broadly followed the same trends seen regionally and nationally
(see Figure 3.5) and in 2016, the average house price was £122,445. However, the recovery from
the 2008 decline in prices has been slower in Tameside than across Greater Manchester, the North
West and England and in 2016 average house prices in Greater Manchester was £143,135
11.3%
37.5%35.7%
15.5%
0.0%
Detached
Semi-detached
Terraced
Flat, maisonette orapartment
Caravan or othertemporary structure

28 © Amec Foster Wheeler Environment & Infrastructure UK Limited
March 2017 Doc Ref. bri005ir
compared to £143,297 regionally. All are significantly lower than the average house price in
England of £220,581.16
Figure 3.5 Average House Price (1995-2016)
Source: Land Registry data. Available via http://landregistry.data.gov.uk/app/ukhpi [Accessed January 2017].
3.4.8 House sales in the Borough follow a similar trend to those of house prices. Figure 3.6 shows that
sales are increasing again since 2008 but have not yet reached pre-recession levels. The trends
seen in house sales for Tameside are generally the same for Greater Manchester, the North West
and England.17
16 Land Registry data. Available via http://landregistry.data.gov.uk/app/ukhpi [Accessed January 2017]. 17 Land Registry data. Available via http://landregistry.data.gov.uk/app/ukhpi [Accessed January 2017].
£0
£50,000
£100,000
£150,000
£200,000
£250,000
Tameside Greater Manchester North West England
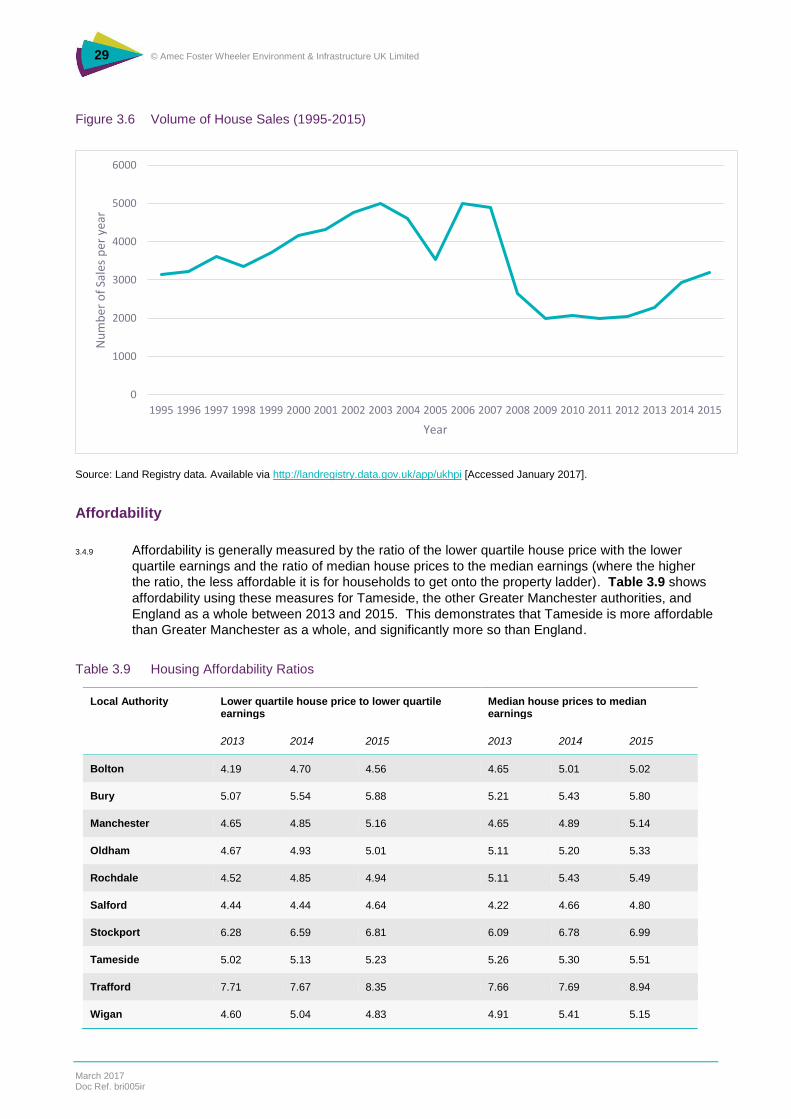
29 © Amec Foster Wheeler Environment & Infrastructure UK Limited
March 2017 Doc Ref. bri005ir
Figure 3.6 Volume of House Sales (1995-2015)
Source: Land Registry data. Available via http://landregistry.data.gov.uk/app/ukhpi [Accessed January 2017].
Affordability
3.4.9 Affordability is generally measured by the ratio of the lower quartile house price with the lower
quartile earnings and the ratio of median house prices to the median earnings (where the higher
the ratio, the less affordable it is for households to get onto the property ladder). Table 3.9 shows
affordability using these measures for Tameside, the other Greater Manchester authorities, and
England as a whole between 2013 and 2015. This demonstrates that Tameside is more affordable
than Greater Manchester as a whole, and significantly more so than England.
Table 3.9 Housing Affordability Ratios
Local Authority Lower quartile house price to lower quartile earnings
Median house prices to median earnings
3.4.10 2013 3.4.11 2014 3.4.12 2015 3.4.13 2013 3.4.14 2014 3.4.15 2015
Bolton 4.19 4.70 4.56 4.65 5.01 5.02
Bury 5.07 5.54 5.88 5.21 5.43 5.80
Manchester 4.65 4.85 5.16 4.65 4.89 5.14
Oldham 4.67 4.93 5.01 5.11 5.20 5.33
Rochdale 4.52 4.85 4.94 5.11 5.43 5.49
Salford 4.44 4.44 4.64 4.22 4.66 4.80
Stockport 6.28 6.59 6.81 6.09 6.78 6.99
Tameside 5.02 5.13 5.23 5.26 5.30 5.51
Trafford 7.71 7.67 8.35 7.66 7.69 8.94
Wigan 4.60 5.04 4.83 4.91 5.41 5.15
0
1000
2000
3000
4000
5000
6000
1995 1996 1997 1998 1999 2000 2001 2002 2003 2004 2005 2006 2007 2008 2009 2010 2011 2012 2013 2014 2015
Nu
mb
er o
f Sa
les
per
yea
r
Year

30 © Amec Foster Wheeler Environment & Infrastructure UK Limited
March 2017 Doc Ref. bri005ir
Local Authority Lower quartile house price to lower quartile earnings
Median house prices to median earnings
3.4.10 2013 3.4.11 2014 3.4.12 2015 3.4.13 2013 3.4.14 2014 3.4.15 2015
Greater Manchester 5.11 5.37 5.54 5.29 5.58 5.82
England 6.66 6.95 7.02 6.92 7.25 7.63
Source: Greater Manchester Strategic Housing Market Assessment (2016) using CLG data18.
3.4.16 The number of new affordable dwellings completed in Tameside since 2005 has fluctuated
annually19 (see Figure 3.7) but peaking in 2008/09 and 2013/14 when over 100 affordable units
were completed.
Figure 3.7 Gross Affordable Housing Completions (2005-2015)
Source: Tameside Metropolitan Borough Council (2014) Authority’s Monitoring Report 2013/14 and recent monitoring data for 2014/15.
3.4.17 The number of households on the housing waiting list has also fluctuated and in 2016, there were
3,363 households in Tameside on the list20 (see Figure 3.8).
18 GMCA (2016) Strategic Housing Market Assessment. Available from http://gmsf.objective.co.uk/portal/2016consultation/supp_docs?pointId=1477921277859#1477921277859 [Accessed January 2017]. 19 Tameside Metropolitan Borough Council (2014) Authority’s Monitoring Report 2013/14. 20 DLCG (2016) Numbers of households on local authorities housing waiting lists by district: England 1997-2016. Available from https://www.gov.uk/government/statistical-data-sets/live-tables-on-rents-lettings-and-tenancies [Accessed January 2017].
4448
54
102
56
41
72
88
107
78
0
20
40
60
80
100
120
2005/2006 2006/2007 2007/2008 2008/2009 2009/2010 2010/2011 2011/2012 2012/2013 2013/2014 2014/2015

31 © Amec Foster Wheeler Environment & Infrastructure UK Limited
March 2017 Doc Ref. bri005ir
Figure 3.8 Number of Households on Housing Waiting List (1997-2016)
Source: CLG (2016) Numbers of households on local authorities housing waiting lists by district: England 1997-2016.
Overcrowding
3.4.18 Information on bedroom occupancy was collected in the 2011 Census for the first time and
provides a measure of whether a household’s accommodation is overcrowded or under occupied21.
An occupancy rating of -1 implies that a household has one fewer bedroom than required, whereas
+1 implies that they have one more bedroom than the standard requirements.
3.4.19 In 201122, there were 3,737 households (4% of all households) in Tameside classified as being
overcrowded (see Figure 3.9). This is lower than the overcrowding rate for Greater Manchester
(4.7%) and England (4.6%). A total of 63,991 households (67.4% of all households), meanwhile,
were classified as being under-occupied. This is very similar to the under-occupied figures for
Greater Manchester (67.0%) and England (68.7%).
Figure 3.9 Bedroom Occupancy Rating
21 The ages of the household members and their relationships to each other are used to derive the number of bedrooms they require, based on a standard formula. The number of bedrooms required is subtracted from the number of bedrooms in the household’s accommodation to calculate the occupancy rating. The occupancy rating can then indicate overcrowding or under-occupation within the household. 22 ONS Occupancy Rating (Bedrooms), 2011 (QS412EW). Available from http://www.neighbourhood.statistics.gov.uk/dissemination/LeadTableView.do?a=7&b=6275272&c=Tameside&d=13&e=7&g=6347026&i=1001x1003x1004&m=0&r=1&s=1485862592366&enc=1&dsFamilyId=2557 [Accessed January 2017].
0
2000
4000
6000
8000
10000
1997 1998 1999 2000 2001 2002 2003 2004 2005 2006 2007 2008 2009 2010 2011 2012 2013 2014 2015 2016
Nu
mb
er o
f H
ou
seh
old
s
Year
27.8%+2 or more bedrooms
39.6%+1 bedrooms
28.7%0 bedrooms
3.5
0.5
Occupancy Rating (Bedrooms) of -1 or less
Occupancy Rating (Bedrooms) of -2 or Less (Households)
Under Occupied Standard Occupancy

32 © Amec Foster Wheeler Environment & Infrastructure UK Limited
March 2017 Doc Ref. bri005ir
Source: ONS (2011) Census 2011.
Vacant Dwellings
3.4.20 A proportion of vacant dwellings is part of the normal operation of the housing market; however,
long term vacant dwellings represent an unused resource that can deteriorate over time and
negatively impact upon the local housing market.
3.4.21 The annual average of vacant dwellings has decreased steadily in the Borough since 2004, as
shown in Figure 3.1023. In 2015, a total of 1,042 dwellings were vacant in Tameside which
represents 1.0% of the total dwelling stock.
Figure 3.10 Long Term Vacant Dwellings
Homelessness
3.4.22 The number of homeless people in 2015/16 was significantly higher than that for previous years
with 162 people accepted as being homeless and in priority need (1.65 per 1,000 households).
There were 999 cases where positive action to prevent or relieve homelessness was undertaken.
For comparison, in 2014/15, 64 people were accepted as being homeless and in priority need (0.7
per 1,000 households) and in 2013/14 this stood at 65 (0.67 per 1,000 households). However, in
these years the number of cases where positive action to prevent or relieve homelessness was
higher (1,270 in 2014/15 and 1,369 in 2013/14)24.
Gypsies, Travellers and Travelling Showpeople
3.4.23 In the 2011 Census, 19 households identified themselves as being of ‘White: Gypsy or Irish
Traveller’ ethnicity. A total of 11 stated that they lived in a house or bungalow, two in a flat or
apartment and six in a caravan or other mobile temporary structure. The Greater Manchester
Gypsy and Traveller Accommodation Assessment25 (GMGTAA) highlights that in 2014, there were
three authorised sites within Tameside (see Table 3.10). Of these sites, all are in private
ownership and there were nine vacant plots for Travelling Showpeople.
23 DLCG (2012) Table 615: vacant dwellings by local authority district: England, from 2004. Available from https://www.gov.uk/government/statistical-data-sets/live-tables-on-dwelling-stock-including-vacants [Accessed January 2017]. 24 DLCG (2016) Live tables on homelessness. Available from https://www.gov.uk/government/statistical-data-sets/live-tables-on-homelessness [Accessed January 2017]. 25 GMCA (2014) Greater Manchester Gypsy and Traveller Accommodation Assessment. Final Report. December 2014. Available from https://gmsf-consult.objective.co.uk/portal/options_consultation/strategic_options?tab=files [Accessed January 2017].
0
500
1,000
1,500
2,000
2,500
2004 2005 2006 2007 2008 2009 2010 2011 2012 2013 2014 2015
Nu
mb
er o
f d
wel
lings
vac
ant

33 © Amec Foster Wheeler Environment & Infrastructure UK Limited
March 2017 Doc Ref. bri005ir
Table 3.10 2014 Authorised Gypsy, Traveller and Travelling Showpeople Sites
Site Type of site Ownership Total number of pitches/plots
No of households
Vacant
Watson Street, Denton
Temporary Authorised: Gypsy and Traveller
Private 5 2 0
Fairhaven, Mill Lane, Denton
Permanent: Travelling Showpeople
Private 38 29 9
Wilton Street, Denton
Permanent: Travelling Showpeople
Private 9 9 0
Source: Greater Manchester Gypsy and Traveller Accommodation Assessment (2014).
Likely Evolution of the Baseline Without the Local Plan
3.4.24 As highlighted in Section 3.3, the number of households is projected to increase to 110,434 by
2039, equivalent to a 2.3% increase since 2011, whilst the average household size will decrease to
2.14 (from 2.27 in 2014).
3.4.25 The Draft GMSF sets out a housing requirement for Tameside of 13,600 new dwellings, equivalent
to an annual average requirement of 680 dwellings per year. The indicative split of new
development is for 80% to be houses and 20% to be apartments. The requirement represents
around 6% of the overall housing requirement across Greater Manchester.
3.4.26 The GMGTAA projects the need for an additional 23 plots for Travelling Showpeople by 2033. The
study identified the need for two additional permanent pitches for Gypsies and Travellers. The
need for 6 transit pitches in the Borough was also identified.
3.4.27 The absence of a Local Plan for the Borough would not halt the delivery of housing as emerging
policies in the Draft GMSF would help to deliver new development. However, without specific and
detailed local policy relating to (in particular) the type, tenure and location of new housing, the
extent to which new development meets the needs of Tameside’s communities would be more
uncertain. This could (inter alia) undermine the potential for new development to deliver affordable
housing and provide the tenure and type of housing required. Further, the lack of more detailed
local planning policy could result in the objectives of other plans and programmes, including the
Tameside Housing Strategy, Tameside Empty Property Strategy and Homelessness Prevention
Strategy being unfilled.
Key Issues
The need to provide an adequate supply of land for housing to meet the requirements set out in
the GMSF.
The need to ensure the delivery of an appropriate range of housing types and tenures to meet
local needs.
The need to make best use of, and where appropriate improve, the quality of the existing
housing stock including bringing empty properties back into use.
The need to address homelessness in the Borough.
The need to make appropriate provision for Gypsies, Travellers and Travelling Showpeople.
Links across the Integrated Assessment
3.4.28 Housing is fundamentally linked to many areas of the baseline. The relationship between
population, the economy and employment is complex with growth in these areas driving the needs

34 © Amec Foster Wheeler Environment & Infrastructure UK Limited
March 2017 Doc Ref. bri005ir
for more and different types of housing. A range of housing types (to include sheltered and
affordable) can contribute to reducing poverty, deprivation and the number of homeless. Housing
delivery underpins economic growth by providing a number of jobs, directly and indirectly through
construction, whilst it is vital to supporting employment development by providing accommodation
for employees.
3.4.29 The energy efficiency of housing stock impacts on greenhouse gas emissions and can help reduce
levels of fuel poverty thereby supporting the health and wellbeing of communities. The distribution
of housing can also impact transport choices and availability.
3.4.30 Pressure to find new locations for land to meet the projected housing demand could reduce land
available for other economic or social requirements. In addition, environmental impacts may be felt
on landscapes and biodiversity.
3.5 Economy
Economy
3.5.1 Tameside is an important part of the Great Manchester economy, the strongest economic centre
outside of London with an annual economic output of £50 billion. Although the area has historically
been a strong manufacturing centre, in recent years Greater Manchester has experienced a large-
scale expansion of the service sector, specifically the financial and professional services.
3.5.2 There are economic disparities across the Greater Manchester area. Enterprising Tameside: A
New Economic Strategy for Tameside 2012-26 (2012)26 highlights that the Borough suffered more
than most authorities in the Greater Manchester area during the recession from 2008 to 2010 and
experienced a slower recovery. Within the Borough, there has traditionally been a dependence on
declining traditional industries coupled with an overreliance on the public sector. Future
opportunities for economic growth in the Borough are linked to the UK Government’s Northern
Powerhouse designation and encapsulated in the Greater Manchester Growth and Reform Plan
(2014)27.
3.5.3 Nomis data28 shows that in 2016, there were 5,960 business enterprises within Tameside. This
represents a 16.4% increase since 2010 (when there were 5,120 enterprises) and reflects the
general economic upturn experienced across the country. In the last year, 925 new enterprises
were created and 590 ended in Borough, a net increase of 335 businesses29.
3.5.4 As can be seen in Table 3.11, Tameside has a similar proportion of micro to large enterprises as
Greater Manchester, the North West and Great Britain as a whole.
Table 3.11 Enterprise Size (2016)
Enterprise size (number of employees)
Tameside Greater Manchester North West Great Britain
Micro (0 to 9) 88.2% 88.1% 88.3% 89.2%
Small (10 to 49) 10.0% 9.7% 9.6% 8.9%
Medium (50 to 249) 1.6% 1.7% 1.7% 1.6%
26 Tameside Strategic Partnership (2012) Enterprising Tameside: A New Economic Strategy for Tameside 2012-26. 27 GMCA, Greater Manchester Local Enterprise Partnership (GMLEP) and AGMA (2014) Greater Manchester Growth and Reform Plan. 28 Available via: https://www.ons.gov.uk/businessindustryandtrade/business/activitysizeandlocation/bulletins/ukbusinessactivitysizeandlocation/2016 [Accessed January 2017]. 29 ONS Business Demography Data. Available via: https://www.ons.gov.uk/businessindustryandtrade/business/activitysizeandlocation/datasets/businessdemographyreferencetable [accessed January 2017]
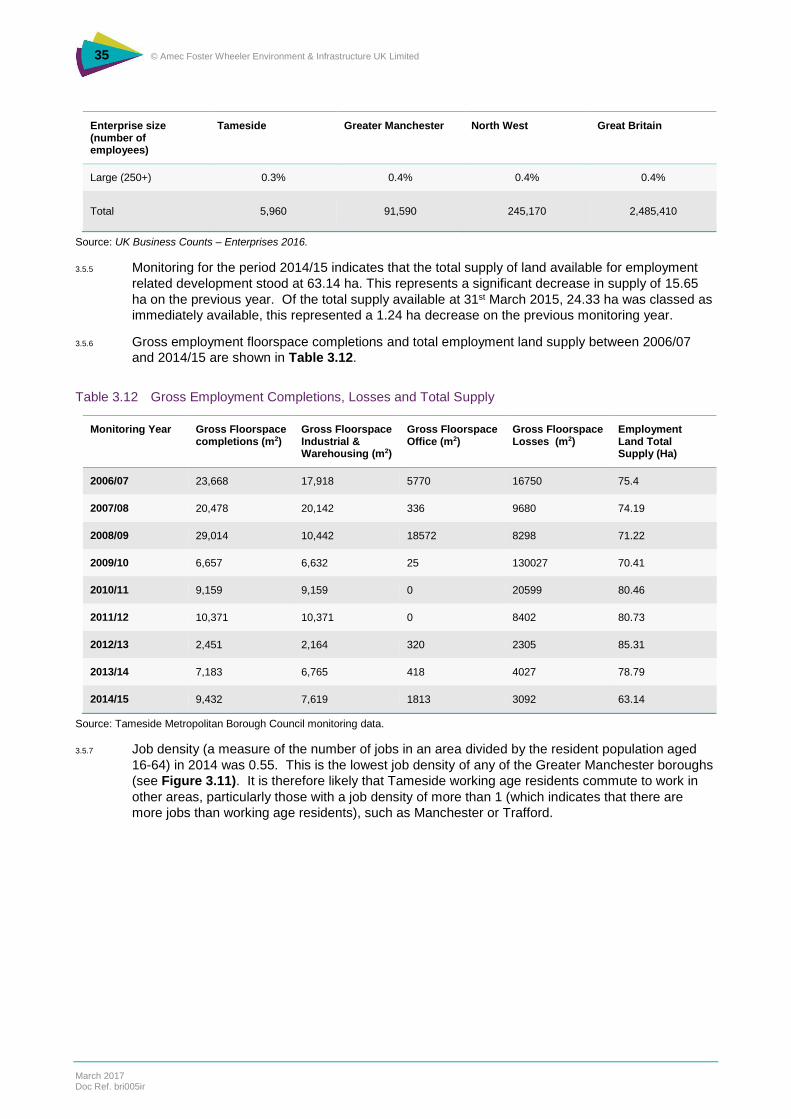
35 © Amec Foster Wheeler Environment & Infrastructure UK Limited
March 2017 Doc Ref. bri005ir
Enterprise size (number of employees)
Tameside Greater Manchester North West Great Britain
Large (250+) 0.3% 0.4% 0.4% 0.4%
Total 5,960 91,590 245,170 2,485,410
Source: UK Business Counts – Enterprises 2016.
3.5.5 Monitoring for the period 2014/15 indicates that the total supply of land available for employment
related development stood at 63.14 ha. This represents a significant decrease in supply of 15.65
ha on the previous year. Of the total supply available at 31st March 2015, 24.33 ha was classed as
immediately available, this represented a 1.24 ha decrease on the previous monitoring year.
3.5.6 Gross employment floorspace completions and total employment land supply between 2006/07
and 2014/15 are shown in Table 3.12.
Table 3.12 Gross Employment Completions, Losses and Total Supply
Monitoring Year Gross Floorspace completions (m2)
Gross Floorspace Industrial & Warehousing (m2)
Gross Floorspace Office (m2)
Gross Floorspace Losses (m2)
Employment Land Total Supply (Ha)
2006/07 23,668 17,918 5770 16750 75.4
2007/08 20,478 20,142 336 9680 74.19
2008/09 29,014 10,442 18572 8298 71.22
2009/10 6,657 6,632 25 130027 70.41
2010/11 9,159 9,159 0 20599 80.46
2011/12 10,371 10,371 0 8402 80.73
2012/13 2,451 2,164 320 2305 85.31
2013/14 7,183 6,765 418 4027 78.79
2014/15 9,432 7,619 1813 3092 63.14
Source: Tameside Metropolitan Borough Council monitoring data.
3.5.7 Job density (a measure of the number of jobs in an area divided by the resident population aged
16-64) in 2014 was 0.55. This is the lowest job density of any of the Greater Manchester boroughs
(see Figure 3.11). It is therefore likely that Tameside working age residents commute to work in
other areas, particularly those with a job density of more than 1 (which indicates that there are
more jobs than working age residents), such as Manchester or Trafford.

36 © Amec Foster Wheeler Environment & Infrastructure UK Limited
March 2017 Doc Ref. bri005ir
Figure 3.11 Job Density 2014
Source: Nomis.
3.5.8 The Tameside Retail Study 201030 showed that, in 2009, the resident population generated £312m
in convenience goods (food and groceries) expenditure and £502m in comparison (non-food)
goods expenditure. Retail markets change according to demographic shifts and technology
advancements (such as online retailing). As noted in the Study, these changes have impacted
upon the format of retail and leisure floorspace and indicates retail development is increasingly
being directed towards town centres where supply exceeds demand. The economic recession
between 2008 and 2010 impacted retail markets and their growth, with a number of high street
retailers suffering. Existing high street and supermarket retailers face greater competition from out
of town shopping centres and the internet. However, discount retailers have thrived.
3.5.9 The impact of the recession on the Tameside retail sector is apparent and the AMR31 highlights
that many commercial schemes have consisted of only small extensions or alterations to existing
retailing locations. As shown in Figure 3.12, the completed area of retail space has decreased
significantly from pre-2008 levels, however there has been an increase since 2012.
Figure 3.12 Area of Retail, Leisure and Office Development in Town Centres
Source: Authority’s Monitoring Report 2013/14.
30 The Tameside Retail Study 2010. Available online: http://www.tameside.gov.uk/planning/ldf/retailstudy2010 [Accessed January 2017] 31 Tameside Metropolitan Borough Council (2014) Authority’s Monitoring Report 2013/14.
0.68 0.65
1.05
0.61 0.61
0.82 0.8
0.55
1.06
0.58
0.78 0.78 0.82
0
0.2
0.4
0.6
0.8
1
1.2
37 © Amec Foster Wheeler Environment & Infrastructure UK Limited
March 2017 Doc Ref. bri005ir
3.5.10 Another measure of the health of town centre economies is the number of vacant units. Whilst the
number of vacant commercial premises in town centres in Tameside has generally decreased
slightly, figures for Droylsden have increased with nearly a quarter of units being identified as
vacant in 2013/14 (see Figure 3.13). Denton and Mossley, meanwhile, had the lowest percentage
of vacant units.
Figure 3.13 Percentage of Town Commercial Premises Vacant
Source: Authority Monitoring Report 2013/14
Employment
3.5.11 Between April 2012 and March 2013, there were 96,500 residents in employment in Tameside,
equivalent to 68.7% of the 16-64 year old population (those considered economically active). 32
This employment rate was lower than that for the North West (69.2%) and England (71.1%), but
higher than the rate for Greater Manchester (67.6%). During the period from July 2015 to June
2016, the level of 16-64 year olds in employment rose to 71.0%. This was mirrored across both
Greater Manchester (increase to 75.5%) and the North West (increase to 75.8%).
3.5.12 During the period July 2015 to June 2016, the unemployment rate for 16-64 year olds in Tameside
was 5.7%, lower than for Greater Manchester as a whole (which stood at 6.5%) and the North
West (5.3%).
3.5.13 The split of people employed in the different socio-economic classification (SOC) groups is similar
to both regional and national trends (see Table 3.13). However, the Borough has lower
proportions of people employed in occupations in the SOC major groups 1-3 (35.9%) compared to
Greater Manchester as a whole (42.8%), the North West (42.2%) and Great Britain (44.7%). This
suggests that there is a higher level of lower-value added employment and/or lower skilled workers
within Tameside.
32 Nomis Labour Market Profile Data. Available via: https://www.nomisweb.co.uk/reports [Accessed January 2017].
38 © Amec Foster Wheeler Environment & Infrastructure UK Limited
March 2017 Doc Ref. bri005ir
Table 3.13 Proportion of Employment Population by Occupation (June 2015 – June 2016)
Tameside (%) Greater Manchester (%)
North West (%) Great Britain (%)
Soc 2010 Major Group 1-3 1. Managers and Senior Officials 2. Professional Occupations 3. Associate Professionals & Technical
35.9 42.8 42.2 44.7
Soc 2010 Major Group 4-5 4. Administrative & Secretarial 5. Skilled Trades Occupations
23.6 20.2 21.7 21.0
Soc 2010 Major Group 6-7 6. Caring, Leisure and Other Service Occupations 7. Sales and Customer Service Occupations
20.9 18.7 17.7 16.7
Soc 2010 Major Group 8-9 8. Process Plant & Machine Operatives 9. Elementary Occupations
18.8 17.6 17.9 17.1
Source: Labour Market Profile Data (Nomis, 2017).
3.5.14 In 2016, average gross weekly pay for full-time workers residing in Tameside was £460.10. This
was lower than the average for Greater Manchester (£494.20), the North West (£502.10) and Great
Britain (£541.00). Women living in Tameside and working full time earnt, on average, £394.00 per
week in 2016. This is 24.4% less than the average male weekly wage. This difference has
fluctuated since 2002, with a general reduction in the difference between male and female wage
levels, however the trend is not steady and the difference has increased since 2015.
3.5.15 In 2015, the percentage of the population in full time employment (70.8%) and part time
employment (30.8%) were similar to the rates at regional and national levels (see Table 3.14). The
majority of jobs in Tameside are within the public administration, education and health sector
(32.3%), reflecting regional and national trends. The distribution, hotels and restaurant sector is
the second highest employment sector (26.2%) whilst manufacturing is the third highest sector
(15.4%). This percentage of employees in the manufacturing sector is significantly higher than for
Greater Manchester (8.2%), the North West (9.7%) and Great Britain (8.3%) as a whole indicating
that the manufacturing base is still relatively strong in the Borough, despite a decline in this sector.

39 © Amec Foster Wheeler Environment & Infrastructure UK Limited
March 2017 Doc Ref. bri005ir
Table 3.14 Employee Jobs in Tameside by Industry (excluding farm-based agriculture) (2015)
Tameside (%) Greater Manchester (%)
North West (%) Great Britain (%)
Full time 70.833 69.7 68.7 69.1
Part time 30.8 30.3 31.3 30.9
Job Industry
Energy and water 1.1 1.3 1.1 1.3
Manufacturing 15.4 8.2 9.7 8.3
Construction 4.6 4.2 4.4 4.6
Distribution, hotels and restaurants 26.2 22.9 23.9 23.0
Transport and communications 5.0 8.9 8.0 8.9
Banking, finance and insurance 10.7 23.7 20.4 22.6
Public admin. education and health 32.3 26.6 28.2 26.9
Other services 4.6 4.3 4.4 4.4
Source: ONS employee jobs 2015 (Nomis, 2017).
Likely Evolution of the Baseline Without the Local Plan
3.5.16 As noted in para 3.5.3, the number of enterprises in Tameside increased between 2010 and 2016
which broadly reflects the national trend of economic recovery. The number of 16-64 year olds
unemployed has also decreased over this period.
3.5.17 The Tameside Retail Study 2010 projected that convenience goods surplus expenditure would
increase to £144.38m by 2027 with a potential floorspace requirement of 11,460 to 27,855 net m2.
Comparison goods expenditure is predicted to increase to £289.38m by 2027.
3.5.18 The Draft GMSF recognises the importance of Tameside to the wider sub-regional economy and a
number of strategic employment locations in the Borough are identified in the emerging plan. In
total, the Draft GMSF makes provision for the delivery of 35,000 m2 of office floorspace and
483,000 m2 of industrial and warehousing floorspace in the Borough including in the proposed
Eastern Gateway.
3.5.19 The absence of a Local Plan for Tameside would not halt the delivery of employment premises or
prevent economic growth in the Borough. The GMSF as well as the UK Government’s Northern
Powerhouse Strategy would continue to apply, providing a strategic framework for economic
development in the area. However, without local policy provision a sufficient supply of sites to
meet growth requirements and aspirations may not be realised. Further, the lack of up-to-date
local planning policy could result in the objectives of other local plans and strategies including
Enterprising Tameside: A New Economic Strategy for Tameside 2012-26 being unfulfilled.
Key Issues
The need to provide sufficient employment land in locations well served by transport and other
infrastructure and in locations attractive to the market, particularly in the key growth sectors.
The need to facilitate the growth of an appropriately educated and skilled workforce.
33 There is an error in the figures given by the ONS for Tameside full time and part time employment figures for 2015, which is why this percentage totals more than 100%. The total employee jobs is given as 65,000, full time as 46,000 and part time as 20,000.

40 © Amec Foster Wheeler Environment & Infrastructure UK Limited
March 2017 Doc Ref. bri005ir
The need to support the development of innovative and knowledge-based businesses.
The need to support the growth and development of existing businesses.
The need to increase local employment opportunities.
The need to support the expansion of the manufacturing sector.
The need to maintain and enhance the vitality and viability of the Borough’s town centres.
Links across the Integrated Assessment
3.5.20 The level of employment in an area is closely linked to the wider economy, with those in
employment generally spending their wages on goods and services that can drive the local
economy. Employment opportunities in Tameside and the wider Greater Manchester area will
facilitate the need for housing and offer the opportunity to own a home, driving the need for housing
and transport links.
3.5.21 Businesses need access to a skilled workforce and support services, driving the need for suitable
education facilities and social facilities to support the workforce and their families. Employment
also enables the population to purchase goods and services that contribute to an individual’s
wellbeing.
3.5.22 Employment-related development can have adverse environmental impacts and the location of
businesses, their energy efficiency and the resultant commuting activity of their workforce will
impact on greenhouse gas emission levels.
3.6 Health and Wellbeing
Health and Health Services
3.6.1 Average life expectancy at birth in the Borough is slightly below the averages for Greater
Manchester, the North West and England, for both males and females (see Table 3.15). .
Table 3.15 Life Expectancy at Birth
Tameside Greater Manchester
North West England
2010 – 2012 Male 76.3 77.3 77.7 79.2
Female 80.6 81.2 81.7 83.0
2011 – 2013 Male 76.9 77.7 78.0 79.4
Female 80.3 81.3 81.8 83.1
2012 – 2014 Male 77.3 77.8 78.1 79.5
Female 80.6 81.4 81.9 83.2
2013 – 2015 Male 77.3 77.7 78.1 79.5
Female 80.7 81.3 81.8 83.1
Source: ONS (2015) Life Expectancy at Birth and at Age 65 by Local Areas in England and Wales.

41 © Amec Foster Wheeler Environment & Infrastructure UK Limited
March 2017 Doc Ref. bri005ir
3.6.2 The 2015 Health Profile for Tameside produced by Public Health England34 highlights that the
health of Tameside’s population is worse than the average across England. Deprivation is higher
than average and about 10,000 (22.7%) children live in poverty.
3.6.3 The Health Profile highlights that the health of adults is generally worse than the average for
England in relation to the prevalence of those who are overweight, smoke or are not physically
active. At the 2011 Census, 15,993 people in Tameside reported being ‘not in good health’,
equivalent to 7.29% of the Borough’s population.
3.6.4 GP-patient ratio data35 for the NHS Tameside and Glossop Clinical Commissioning Group
highlights that, as at 2014, there was a ratio of 1,870.26 patients per Full Time Equivalent (FTE)
GP. This is above the UK average of 1,580 patients per FTE GP.
3.6.5 The primary care centre for Tameside is in Ashton-under-Lyne, as is the Tameside General
Hospital which serves a population of approximately 250,00036.
Open Space
3.6.6 The provision of open space, sports and recreational facilities can play a significant role in the
promotion of healthy lifestyles. The Council’s Open Space Study (2010)37 identified a total of 1,277
open spaces in the Borough totalling 3,849 ha (see Table 3.16).
3.6.7 The level of open space provision in Tameside is significant and the majority of those surveyed for
the study felt the availability of the open space provision was good. The majority of open space in
the Borough is classified as natural space and accessible countryside, which reflects the Borough’s
location on the urban/rural fringe and the large area of Green Belt. The study also identified 29
formal parks and gardens and 599 areas of amenity space. Anti-social behaviour was identified as
an issue that impacted on the quality of some sites.
Table 3.16 Open Space in Tameside (2010)
Typology Number Area (ha)
Parks and Formal Gardens 29 121.9
Natural space and accessible countryside 408 3,385.7
Amenity Space 599 187.6
Play Areas 140 27.6
Allotment 30 28.1
Cemeteries / graveyards 35 56.5
Civic Space 14 6.5
Green Corridors 22 35.5
Total for Tameside 1,277 3,849
Source: Tameside PPG17 Open Space Study, Final Assessment Report (2010).
34 Available from http://www.apho.org.uk/resource/view.aspx?RID=50215&SEARCH=T* [Accessed January 2017]. 35 See http://www.gponline.com/exclusive-huge-variation-gp-patient-ratio-across-england-revealed/article/1327390 [Accessed January 2017]. 36 Tameside and Glossop Integrated Care NHS Foundation Trust. Hospital/A&E. Available from http://www.tamesideandglossopccg.org/local-services/accident-and-emergency [Accessed January 2017]. 37 Tameside District Council PPG17 Open Space Study, Final Assessment Report, August 2010.

42 © Amec Foster Wheeler Environment & Infrastructure UK Limited
March 2017 Doc Ref. bri005ir
3.6.8 The Council prepared a Playing Pitch Strategy in 201538 which identified a total of 158 pitches in
the Borough, of which 114 are available for community use (see Table 3.17). It highlights that the
majority of pitches were considered to be of standard quality.
Table 3.17 Tameside Playing Pitches by Type (2015)
Type of pitch Total number Number available for community use39
Number with no community use
Grass football 111 75 36
Artificial grass 15 13 2
Rugby Union 11 (over 5 sites) 9 2
Hockey 3 2 1
Cricket 18 15 3
Total 158 114 44
Source: Tameside Playing Pitch Strategy - Assessment Report (2015).
Crime
3.6.9 There has been an overall reduction in crime in the Borough since 2003, from 27,718 offences in
the 12 months to 31 March 2003, to 16,872 offences in the 12 months to 30 June 2016. However,
the number of offences has increased year-on-year since December 2013 (see Figure 3.14).
Criminal damage and arson was the most reported crime in the 12 months up to June 2016 (2,790
offences) whilst violence without injury was the second most reported crime over the same period
(2,391 offences).40
Figure 3.14 Total Number of Offences in Tameside (2003-2016)
Source: ONS (2016) Recorded crime data.
38 Tameside Metropolitan Borough Council (2015) Playing Pitch Strategy - Assessment Report. 39 Community use - pitches in public, voluntary, private or commercial ownership or management (including education sites) recorded as being available for use/hire by teams/clubs. 40 ONS (2016) Recorded crime data at Community Safety Partnership / Local Authority level. Available from https://www.ons.gov.uk/peoplepopulationandcommunity/crimeandjustice/datasets/recordedcrimedataatcommunitysafetypartnershiplocalauthoritylevel [Accessed January 2017].
0
5000
10000
15000
20000
25000
30000
2003 2004 2005 2006 2007 2008 2009 2010 2011 2012 2013 2014 2015 2016
Tota
l Nu
mb
er o
f O
ffen
ces

43 © Amec Foster Wheeler Environment & Infrastructure UK Limited
March 2017 Doc Ref. bri005ir
Likely Evolution of the Baseline without the Local Plan
3.6.10 The Tameside and Glossop Locality Plan (2015)41 recognises that the population of Tameside has
some of the worst health outcomes in the country. The Plan sets the ambition of “raising healthy
life years to the North West average by 2020. We then will continue to drive our ambition to ensure
we achieve the England average over the next five years”. However, it identifies a significant
financial barrier to achieving this.
3.6.11 It is expected that the health of the Borough’s population will improve without the Local Plan.
However, planning policy can facilitate the promotion of healthy lifestyles including through making
appropriate provision for open space, sport and recreational facilities. Local planning policy could
also help to ensure the future provision of social infrastructure and that new development does not
give rise to adverse impacts on human health.
3.6.12 National planning policy and the GMSF would be expected to support crime reduction through, for
example, the promotion of high quality design that includes crime prevention measures. This
would be expected to continue in the absence of the Local Plan.
Key Issues
The need to enhance the health and wellbeing of Tameside’s population.
The need to tackle inequalities in health.
The need to ensure appropriate open space provision across Tameside.
The need to reduce crime levels, minimise risk and increase community safety.
The need to ensure appropriate health care facilities and services are available and accessible
to meet needs arising from new development and anticipated population growth.
The need to plan for an ageing population.
Links across the Integrated Assessment
3.6.13 The factors that contribute to the health and wellbeing of a population include a number of social,
economic, environmental and cultural elements. Health is closely linked to life expectancy,
deprivation and health risk factors, all of which can have a negative effect on individuals and
families, subsequently affecting productivity, ability to work and economic spend. Health is also
affected by environmental factors, such as air quality and the effects of climate change.
3.6.14 A key theme both in Tameside and Greater Manchester is how to deal with an ageing population
and the effects this will have on service provision, housing needs and economics.
3.7 Education and Skills
Qualifications
3.7.1 Figure 3.15 shows levels of educational attainment across Tameside, Greater Manchester, the
North West and England for the 16-64 age group at 2015. It serves to highlight that the Borough
has a higher percentage of 16-64 year olds with no qualifications. Although the percentage of
41 Tameside and Glossop Clinical commissioning Group (2015) A Place-Based Approach to Better Prosperity, Health and Wellbeing Tameside and Glossop Locality Plan. Available from http://www.tamesideandglossopccg.org/~/media/files/news/tameside_and_glossop_locality_plan__november_2015.ashx?la=en [Accessed January 2017].

44 © Amec Foster Wheeler Environment & Infrastructure UK Limited
March 2017 Doc Ref. bri005ir
residents who have gained NVQ Level 1 qualifications (equivalent to 3-4 GCSEs at grade D-E)
(13.4%), NVQ Level 2 (equivalent to 4-5 GCSEs at grade A*-C) (22.1%) and NVQ Level 3
(equivalent to 2 or more A-Levels) (21.0%) is higher than for Greater Manchester, the North West
and England, the proportion of the population with qualifications at NVQ Level 4 (equivalent to a
first degree) and above is lower.
Figure 3.15 Educational Attainment (2015)
Source: ONS (2017) Annual Population Survey.
3.7.2 Between 2004 and 2015, there has been an overall decline in the percentage of the 16-64 year old
population with no qualifications (but with a slight increase between 2014 and 2015) (see Figure
3.16). Over the same period, there has been an overall increase in the percentage of the 16-64
year old population achieving NVQ Level 4 and above (although this declined slightly between
2014 and 2015).
25.1%
33.7%
32.6%
36.8%
21.0%
19.5%
19.6%
18.8%
22.1%
18.4%
19.8%
17.8%
13.4%
11.2%
11.6%
11.6%
5.8%
7.1%
6.6%
6.6%
12.6%
10.1%
9.8%
8.4%
0 10 20 30 40 50 60 70 80 90 100
Tameside
Greater Manchester
North West
England
Percentage of 16-64 age group
NVQ4+ NVQ3 NVQ2 NVQ1 other qualifications no qualifications

45 © Amec Foster Wheeler Environment & Infrastructure UK Limited
March 2017 Doc Ref. bri005ir
Figure 3.16 Change in the Percentage of 16-64 Year Olds with No Qualifications and NVQ Level 4 and Above (2004-2015)
Source: ONS (2017) Annual Population Survey.
Education Infrastructure
3.7.3 As shown in Table 3.18 and Table 3.19, the Borough had 74 state funded primary schools and 15
state funded secondary schools in 2015. As at 2015, 6.7% of the available primary school places
and 14.6% of the available secondary school places were unfilled, lower than for the North West
and England.
Table 3.18 State Funded Primary School Capacity (2015)
Tameside Greater Manchester
North West England
No. of school 74 849 2,448 16,759
No. of school places 20,941 252,768 629,732 4,633,934
No. of pupils 19,670 237,060 578,067 4,210,503
No. of schools that are full or have one+ pupils in excess of capacity
24 274 624 3,807
No. of pupils in excess of school capacity
129 2,647 5,348 30,539
Excess as a percentage of total places 0.6 1.1 0.8 0.7
No. of schools with one + unfilled places
50 575 1,824 12,952
No. of unfilled places 1,400 18,355 57,013 453,970
No. of unfilled places as % of total places
6.7 7.3 9.1 9.8
0
5
10
15
20
25
30
2004 2005 2006 2007 2008 2009 2010 2011 2012 2013 2014 2015
%
NVQ Level 4 and above No qualifications

46 © Amec Foster Wheeler Environment & Infrastructure UK Limited
March 2017 Doc Ref. bri005ir
Source: Education Funding Agency and department for Education 2015 capacity and forecast tables. Information on capacity in primary
and secondary schools in England, forecasts of pupil numbers and future planned places. Available online at:
https://www.gov.uk/government/publications/school-capacity-academic-year-2014-to-2015 [Accessed January 2017]
Table 3.19 State Funded Secondary School Capacity (2015)
Tameside Greater Manchester
North West England
No. of school 15 164 455
3,356
No. of school places 15,127 177,516, 489,133
3,755,545
No. of pupils 12,968 152,941 410,194
3,163,191
No. of schools that are full or have one+ pupils in excess of capacity
3 27 57 500
No. of pupils in excess of school capacity
46 554 1,423 19,790
Excess as a percentage of total places 0.3 0.3 0.3 0.5
No. of schools with one + unfilled places
12 137 398 2,856
No. of unfilled places 2,205 25,129 80,362 612,144
No. of unfilled places as % of total places
14.6 14.2 16.4 16.3
Source: Education Funding Agency and department for Education 2015 capacity and forecast tables. Information on capacity in primary
and secondary schools in England, forecasts of pupil numbers and future planned places. Available online at:
https://www.gov.uk/government/publications/school-capacity-academic-year-2014-to-2015 [Accessed January 2017]
Likely Evolution of the Baseline Without the Local Plan
3.7.4 The Department for Education has forecast that there will be 21,803 pupils requiring a primary
school place in 2017/18 and 15,885 pupils requiring a secondary school place in 2019/20. Without
a Local Plan, opportunities to deliver new educational facilities on development sites and to secure
planning obligations that could contribute to the delivery of school spaces may be not be realised.
Key Issues
The need to raise educational attainment and skills.
The need to ensure that educational facilities meet the changing demands of the population and
the economy.
Links across the Integrated Assessment
3.7.5 Education is linked to a number of social and economic themes. Education is a vital element of a
functioning society and is important for ensuring the future demands of business and the economy
can be met. Increased skill levels will assist economic growth and enable better social inclusion.
In addition, to be sustainable, housing must be supported by the provision of facilities and services
including education.

47 © Amec Foster Wheeler Environment & Infrastructure UK Limited
March 2017 Doc Ref. bri005ir
3.8 Deprivation
3.8.1 The English Index of Deprivation (IMD) measures relative levels of deprivation in small areas of
England called Lower Layer Super Output Areas (LSOA). Deprivation refers to an unmet need,
which is caused by a lack of resources including for areas such as income, employment, health,
education, skills, training, crime, access to housing and services and living environment.
3.8.2 The 2015 IMD ranked Tameside 34th out of 326 local authorities (where a rank of 1 is the most
deprived in the country and a rank of 326 is the least deprived), as measured by the average rank
of LSOAs in the Borough. This places the Borough in the top 15% most deprived local authorities
nationally. Of the ten authorities in the Greater Manchester area, only Manchester (1st), Salford
(27th) and Rochdale (25th) councils are considered to be more deprived than Tameside when using
this measure. The Tameside IMD ranking by this measure is the same as at the previous 2010
IMD.
3.8.3 Another measure of deprivation is the rank of average scores across the LSOAs in an area. By
this measure, the Borough was the 41st most deprived authority nationally. In 2010, Tameside was
ranked 42nd and in 2007 56th, suggesting worsening deprivation across the Borough.
3.8.4 Of the 141 LSOAs in the Borough, 24 are in the 10% most deprived nationally. These LSOAs are
primarily concentrated in the urban wards with St Peter’s and Ashton St Michael’s (Ashton-under-
Lyne), Stalybridge North, Hyde Godley and Longdendale each containing three LSOAs in the 10%
most deprived nationally (see Figure 3.17).
3.8.5 A range of issues which particularly affect the Borough have been identified through the IMD
including crime, education, skills and training and employment.

48 © Amec Foster Wheeler Environment & Infrastructure UK Limited
March 2017 Doc Ref. bri005ir
Figure 3.17 Indices of Multiple Deprivation (2015)

49 © Amec Foster Wheeler Environment & Infrastructure UK Limited
March 2017 Doc Ref. bri005ir
Likely Evolution of the Baseline Without the Local Plan
3.8.6 By some IMD measures, the Borough has experienced worsening deprivation in recent years. A
number of strategies are in place to help address the causes of deprivation including, for example,
the Council’s Poverty Strategy 2014-2017 (2014), Joint Health and Wellbeing Strategy 2013-2016
(2013) and the Greater Manchester Mayor and Police & Crime Commissioner’s Police and Crime
Plan (2016). The Draft GMSF also supports regeneration in the Borough through the proposed
Eastern Gateway. The implementation of these plans and strategies would take place irrespective
of any new Local Plan for the Borough.
3.8.7 However, without specific and detailed local policy, the extent to which new development meets the
needs of Tameside’s communities and supports regeneration would be uncertain. Further, the
potential opportunities for new development to complement other strategies and tackle deprivation
by, for example, providing affordable housing, ensuring adequate open space provision and
meeting the specific need for community facilities and services may not be realised.
Key Issues
The need to address the many causes of deprivation within the Borough.
The need to specifically tackle deprivation and promote regeneration in the Borough’s most
deprived communities.
The need to promote social inclusion and reduce inequality.
Links across the Integrated Assessment
3.8.8 Levels of deprivation are influenced by a number of social, economic and environmental factors.
Deprivation is therefore a cross cutting issue which is influenced by, and influences, many themes
considered in this Scoping Report. These themes include promoting health and wellbeing and
social inclusion, ensuring suitable housing provision of the right type and tenure, attracting and
retaining a range of employers, improving education and skills, addressing crime and the fear of
crime, appropriate open space provision and ensuring access to services and facilities.
3.9 Transport and Accessibility
Transportation Infrastructure
3.9.1 Tameside benefits from excellent connectivity to a wider strategic road network, elements of which
are known as the Key Route Network are managed by Transport for Greater Manchester (TFGM).
The M60 motorway (Manchester Outer Ring Road) runs from north to south in the west of the
Borough whilst the M67 spurs off from the M60 in an easterly direction in the south of the Borough.
The orbital M60 provides access to Manchester Airport and the M62 Trans-Pennine route to
Huddersfield and Leeds in Yorkshire to the east and Liverpool to the west. The A-road network
provides major transport links to the towns surrounding Tameside, Manchester city centre as well
as links between centres within the Borough. The A-roads include the:
A57/A628 Trunk Road which provides a continuation of the strategic transport route between
Manchester and Sheffield from Junction 4 of the M67 in the south of the Borough;
A635 which links Stalybridge and Ashton-under-Lyne to the M60;
A6018 which links Stalybridge to Longdendale; and
A627 which links Ashton-under-Lyne to Oldham in the north.
3.9.2 Tameside is also well served by both local and inter-regional rail services. This includes the
TransPennine Express services with twice hourly trains from Stalybridge providing connections to
Manchester Airport, Manchester Piccadilly and Liverpool in the west and Leeds, Hull, York and
50 © Amec Foster Wheeler Environment & Infrastructure UK Limited
March 2017 Doc Ref. bri005ir
Scarborough to the north east. Northern Rail provides a local train service which links Tameside to
Manchester, Glossop, Huddersfield and Rose Hill, Marple. From Manchester, services are
available to all major cities in the UK including London, Birmingham, Bristol, Leeds and Edinburgh.
The Borough has 13 train stations in total: Ashton; Stalybridge; Mossley; Fairfield; Guide Bridge;
Flowery Field; Newton for Hyde; Godley; Hattersley; Hyde North; Hyde Central; Denton; and
Broadbottom
3.9.3 Local public transport in Tameside is coordinated by TFGM. Tameside has an extensive network of
bus services which provide links to Manchester and neighbouring town centres, as well as between
the town centres of Tameside and the outlying residential areas. This includes a Stagecoach
service between Manchester city centre and Ashton-under-Lyne (every 10 minutes in the day and
15 minutes in the evening).
3.9.4 The Borough also benefits from a Metrolink connection to Manchester city centre (following an
extension of the East Manchester line from Droyslden to Ashton-under-Lyne which opened in
October 2013). Trams run every 12 minutes from Ashton-under-Lyne town centre into the city
centre, with an approximate journey time of 30 minutes and then on to Eccles beyond. The town
centre stop is adjacent to the bus station and is in close proximity to Ashton-under-Lyne rail station.
TFGM are redeveloping the Ashton-under-Lyne bus station to form a new transport interchange
with the Metrolink and Ashton-under-Lyne train station using funding from the Greater Manchester
Local Growth Deal Programme. This is due to open in 2018.
3.9.5 The Borough is well served for air travel. Much of Tameside is within a 15 to 20 minute drive time
of Manchester Airport following the extension of the M60 between Denton and Middleton in 2000.
The international airport provides flights to numerous destinations throughout the world.
3.9.6 With regards to cycling, the Tameside Cycle Facilities Review (2008)42 identified that the Borough’s
strengths include the incorporation of cycling schemes into recent road and highways projects and
the provision of cycle friendly areas with implementation of 20 mph zones. Weaknesses identified
in the Review included a lack of connectivity between existing cycle facilities, poor signage and
poor access to many of the cycle routes.
3.9.7 The Borough does benefit from National Cycle Network (NCN) routes including the Trans Pennine
Trail (NCN Route 62), which starts at Reddish Vale at the Stockport/Denton boundary and follows
the River Tame through Denton and disused railway line in Hyde Godley. This route continues on
to the Tameside boundary with Derbyshire. In addition, there are 264 km of Public Rights of Way
(PRoW) providing public access to attractions and the countryside with 875 Rights of Way recorded
on the Definitive Map. This includes 810 footpaths measuring 233 km, 41 Bridleways at 22 km and
18 Restricted Byways equating to 9 km. There are currently no Byways Open to All Traffic (BOAT)
in Tameside.43
Movement
3.9.8 According to the 2011 Census, the average distance travelled to work by Tameside residents was
11.4 km, which represents a slight increase from 10.17 km at the 2001 Census. Table 3.20
compares the distance travelled to work by the Borough’s residents in 2001 and 2011 and
highlights that the proportion of people travelling less than 10 km has decreased whilst the
proportion travelling over 10 km has increased. The 2011 Census also illustrates that the primary
mode of travelling to work is by car or van as either a driver or passenger (68.9%) but that a
significant proportion of households in the Borough (29.62%) do not own a car, higher than the
regional average of 27.97%.
42 Tameside Metropolitan Borough Council (2008) Tameside Cycle Facilities Review. Available from http://www.tameside.gov.uk/cycling/facilitiesreport.pdf [Accessed January 2017]. 43 Tameside Public Rights of Way information. Available via: http://www.tameside.gov.uk/rightsofway [Accessed January 2017].

51 © Amec Foster Wheeler Environment & Infrastructure UK Limited
March 2017 Doc Ref. bri005ir
Table 3.20 Distance Travelled to Work
Distance Travelled to Work
Number of People (2001)
% of People in Employment (2001)
Number of People (2011)
% of People in Employment (2011)
Less than 2 km 20,132 20.92 18,180 17.84
2 km to less than 5 km 23,491 24.41 23,046 22.62
5 km to less than 10 km 21,335 22.17 22,200 21.79
10 km to less than 20 km
15,184 15.77
16,585 16.28
20 km to less than 30 km
1,839 1.91 2,249 2.21
30 km to less than 40 km
752 0.08 1,197 1.74
40 km to less than 60 km
1,056 0.11 1,494 1.47
60 km and over 1,525 1.58 1,920 1.88
Working from home 7,444 7.73 7,651 7.51
Other 3,495 3.63 7,370 7.23
Total 96,253 101,892
Source: ONS (2001/2011) Census 2001 and 2011.
3.9.9 Commuting flows indicate that in 2011, a total of 46,000 workers commuted out of Tameside to
other local authority areas whilst far fewer workers (23,608) commuted into the Borough. This
represents a significant net outflow of 22,392 workers, showing that there is poor self-containment
in the local economy with the overwhelming majority of workers commuting outside the Borough.
Figure 3.18 shows the workplace origins and destinations of workers and residents travelling to
and from Tameside for 2011. It indicates that the majority of the Borough’s residents commuted to
Manchester (17,483 people), reflecting its city status, and Stockport (8,518 people). Of those
commuting into the Borough, Oldham (4,606 people), Stockport (4,392 people), Manchester (3,729
people) and High Peak (2,735 people) provided the majority of commuters.

52 © Amec Foster Wheeler Environment & Infrastructure UK Limited
March 2017 Doc Ref. bri005ir
Figure 3.18 Workplace Destinations
Source: NOMIS (2014) Location of usual residence and place of work by method of travel to work. Available from
http://www.nomisweb.co.uk/census/2011/WU01UK/chart/1132462277 [Accessed January 2017]
Likely Evolution of the Baseline Without the Local Plan
3.9.10 An increase in population and households in the Borough will in-turn generate additional transport
movements. Based on existing trends, the majority of these movements are likely to be by car with
a continuation of significant (net) out-commuting but also more limited in-commuting. This could
result in increased pressure on the local road network and public transport infrastructure.
3.9.11 The Greater Manchester Transport Strategy 204044 identifies the policies and priority transport
interventions for the conurbation supported by a 5-year Delivery Plan, which sets out TFGMS’ s
short-term delivery priorities. Schemes identified in the Strategy of particular relevance to
Tameside include measures to tackle congestion in the Longdendale area including the Mottram
Moor and A57 Link Roads, a new transport interchange at Ashton-under-Lyne, rail line
electrification and improvements to the M60 (smart motorway schemes). As highlighted in Section
1.3, the Draft GMSF also includes proposals for a new Droylsden railway station and highways
improvements in the Borough whilst the HS2 Phase Two line into Manchester is also likely to
increase the connectivity between the Borough and London.
3.9.12 In this context, it would be expected that some transport improvements would be delivered
independently of local planning policy. However, without an up-to-date Local Plan there would be a
policy gap with regard to the location of future growth in the Borough. This gap could result in
development being located in areas that are not well served by community facilities, services and
jobs thereby leading to an increase in transport movements. Allied to this, without Local Plan
policy coverage, opportunities may be missed to respond appropriately to the Borough’s wider
objectives in respect of economic growth and environmental protection and enhancement.
Key Issues
The need to ensure timely investment in transport infrastructure and services to accommodate
anticipated growth.
The need to support proposals contained in the TFGM Greater Manchester Transport Strategy
2040 and those identified by Highways England to address highways capacity issues in the
Borough.
44 Transport for Greater Manchester (2016) Greater Manchester Transport Strategy 2040. Available from http://www.tfgm.com/2040/Pages/strategy/assets/2017/2-17-0078-GM-2040-Full-Strategy-Document.pdf [Accessed February 2017].

53 © Amec Foster Wheeler Environment & Infrastructure UK Limited
March 2017 Doc Ref. bri005ir
The need to capitalise on the Borough’s good transport accessibility links to Manchester Airport
and the proposed transport interchange and potential new Droylsden railway station.
The need to encourage alternative modes of transport to the private car.
The need to ensure that new development is accessible to community facilities and services
and jobs so as to reduce the need to travel.
The need to encourage walking and cycling.
The need to protect and enhance the PRoW network in the Borough.
Links across the Integrated Assessment
3.9.13 There are clear links across a number of social, economic and environment themes identified in
this Scoping Report. Delivering transport improvements is central to promoting economic growth
by providing the connections required to support new housing and employment development,
reduce travel times and address congestion.
3.9.14 The provision of reliable public transport infrastructure helps to provide more affordable journeys to
work for many and maintain and improve the accessibility of services and facilities, thereby helping
to promote sustainable communities and reduce inequalities.
3.9.15 Sustainable transport measures which support walking and cycling can also provide health benefits
by helping to combat obesity and heart disease. In addition, addressing congestion and reducing
the use of the private car can also help to provide improvements in air quality and lower carbon
emissions and air pollution.
3.10 Biodiversity and Green Infrastructure
Biodiversity
3.10.1 Biodiversity is defined as the variety of plants (flora) and animals (fauna) in an area, and their
associated habitats. The importance of preserving biodiversity is recognised from an international
to a local level. Biodiversity is important in its own right and has value in terms of quality of life and
amenity.
3.10.2 Tameside has a rich and varied natural environment including a range of sites designated for their
habitat and conservation value. Figure 3.19 shows designated nature conservation sites within
and in close proximity to the local authority area.

54 © Amec Foster Wheeler Environment & Infrastructure UK Limited
March 2017 Doc Ref. bri005ir
Figure 3.19 Designated Nature Conservation Sites

55 © Amec Foster Wheeler Environment & Infrastructure UK Limited
March 2017 Doc Ref. bri005ir
3.10.3 Sites of European importance (Special Protection Areas (SPAs) and Special Areas of Conservation
(SACs)) are designated to conserve natural habitats and species of wildlife which are rare,
endangered or vulnerable in the European Community. In the UK, these form part of the ‘Natura
2000’ network of sites protected under the EC Habitats Directive (1992). The South Pennine
Moors SAC and the Peak District Moors (South Pennine Moors Phase 1) SPA both overlap with
the Tameside local authority area in the east, and share the same boundary in this area (see
Figure 3.19). Table 3.21 outlines the qualifying features and conservation objectives for both
these sites.
3.10.4 The Rochdale Canal SAC, whilst not within Tameside, is at its closet point 1.5 km from the
boundary of the Borough. The conservation objective for this SAC is to maintain, in favourable
condition, the habitats for the population of floating water plantain (Luronium natans), the primary
reason for designation.
Table 3.21 South Pennine Moors SAC and the Peak District Moors (South Pennine Moors Phase I) SPA Features and Conservation Objectives.
Site Name Size (ha) Qualifying Features
Conservation Objectives
(Total) (Within Tameside)
South Pennine Moors SAC 65,024 5,485 Northern Atlantic wet heaths European dry heaths Blanket bogs Transition mires and quaking bogs Old sessile oak woods
Ensure that the integrity of the site is maintained or restored as appropriate, and ensure that the site contributes to achieving the Favourable Conservation Status of its Qualifying Features, by maintaining or restoring;
The extent and distribution of the qualifying natural habitats
The structure and function (including typical species) of the qualifying natural habitats, and,
The supporting processes on which the qualifying natural habitats rely
Peak District Moors SPA 45,300
5,485 Merlin; Falco columbarius (breeding) European golden plover; Pluvialis apricaria (breeding) Short-eared owl; Asio flammeus (Breeding)
Ensure that the integrity of the site is maintained or restored as appropriate, and ensure that the site contributes to achieving the aims of the Wild Birds Directive, by maintaining or restoring;
The extent and distribution of the habitats of the qualifying features
The structure and function of the habitats of the qualifying features
The supporting processes on which the habitats of the qualifying features rely
The population of each of the qualifying features, and,
The distribution of the qualifying features within the site.
Source: Natural England (2014) European Site Conservation Objectives for South Pennine Moors Special Area of Conservation Site code: UK0030280. Available online at http://publications.naturalengland.org.uk/publication/6145889668169728?category=4582026845880320 [Accessed January 2017] and Natural England (2014) European Site Conservation Objectives for Peak District Moors (South Pennine Moors Phase 1) Special Protection Area Site Code: UK9007021. Available online at http://publications.naturalengland.org.uk/publication/6145889668169728?category=4582026845880320 [Accessed January 2017]
3.10.5 There are three Sites of Special Scientific Interest (SSSI) located within Tameside. The SSSI are:
Hollinwood Branch Canal SSSI;
Huddersfield Narrow Canal SSSI; and

56 © Amec Foster Wheeler Environment & Infrastructure UK Limited
March 2017 Doc Ref. bri005ir
Dark Peak SSSI.
3.10.6 The Dark Peak SSSI overlaps with the South Pennine Moors SAC and the Peak District Moors
(South Pennine Moors Phase 1) SPA, and only a small part (5,498 ha) of the SSSI is within the
Tameside area. Hollinwood Branch Canal and Huddersfield Narrow Canal SSSIs are wholly within
Tameside. Table 3.22 shows the condition of each SSSI within the Borough.
Table 3.22 Condition of SSSIs within Tameside
SSSI Name Area (ha) No. of Units Condition
Hollinwood Branch Canal 2.43 2 100% unfavourable declining
Huddersfield Narrow Canal 11.65 2 100% unfavourable no change
Dark Peak 31,824
246 4.3% Favourable 93.4% Unfavourable recovering 2.1% unfavourable no change 0.1% unfavourable declining
Source: Natural England (various) Designated Sites Condition Summaries. Available online
https://designatedsites.naturalengland.org.uk/ [Accessed January 2017].
3.10.7 In addition to the international and national level designations, there are ten Local Nature Reserves
(LNRs) within Tameside and 55 Sites of Biological Important (SBI). The LNRs in the Borough are:
Brushes Valley;
Castle Clough and Cowbury Dale;
Great Wood;
Haughton Dale;
Hollinwood Branch Canal;
Hulmes and Hardy Wood and Lower Haughton Meadows;
Hurst Clough;
Knott Hill;
Rocher Vale; and
Werneth Low.
3.10.8 The Greater Manchester Biodiversity Action Plan (BAP) (2009)45 identifies the most important
species and habitats in the Greater Manchester area. The distribution of BAP habitats across the
Borough is shown in Figure 3.20. The BAP notes that Tameside has areas of species rich
(unimproved) neutral grassland and a greater extent of lowland broadleaved woodland with Gower
Hey cited as a particularly good example. Traditionally, much of the open space within the eastern
belt of Tameside has been subject to farming, although areas of heathland and bog still remain.
These areas of heathland and bog make an important contribution to the overall amount of habitats
in Greater Manchester. Other semi-natural habitats that remain within Tameside are mire and
heathland, woodland, acid grassland and open water. Identified UK Priority Habitats in Tameside
include Blanket Bog, Purple Moor Grass and Rush Pasture, Upland Heathland and Wet Woodland.
45 Greater Manchester Biodiversity Project (2009) Greater Manchester Biodiversity Action Plan.

57 © Amec Foster Wheeler Environment & Infrastructure UK Limited
March 2017 Doc Ref. bri005ir
Figure 3.20 Greater Manchester Biodiversity Action Plan Habitats

58 © Amec Foster Wheeler Environment & Infrastructure UK Limited
March 2017 Doc Ref. bri005ir
Green Infrastructure
3.10.9 Green infrastructure encompasses all “green” assets in an authority area, including parks, river
corridors, street trees, managed and unmanaged sites and designed and planted open spaces,
which provide a range of benefits including making a contribution to an area’s image and sense of
place.
3.10.10 The Green Infrastructure Framework for Greater Manchester (2008) report46 sets out an approach
to investment in green infrastructure recognising the multifunctional value of green infrastructure.
3.10.11 The Green Infrastructure to Combat Climate Change report prepared by Community Forests
Northwest (2011) provides a framework for action and to influence and provide evidence for policy
for the region, including Greater Manchester. The report recognises that green infrastructure
provides a range of services that make a substantial contribution towards climate change
adaptation and mitigation.
3.10.12 There are a number of green infrastructure assets in Tameside (many of which are discussed
elsewhere in this Scoping Report). Key assets include the canals of the Greater Manchester
waterways, the significant PRoW network, LNRs, the 29 parks and formal gardens and the 35.5 ha
of green corridors47. This list is not exhaustive as green infrastructure is found at varying scales,
from neighbourhood (such as green roofs) through to regional scale (such as reservoirs or national
trails).
Likely Evolution of the Baseline without the Local Plan
3.10.13 Whilst protected, many of the designated sites within Tameside are in unfavourable condition and
this poses a threat to the maintenance of biodiversity within the Borough. Policy GM8 of the Draft
GMSF seeks to ensure a high quality ecological network across Greater Manchester, providing
significant improvement in biodiversity and enhancing the ability of wildlife to cope with climate
change. Policy GM7, meanwhile, seeks to ensure an integrated network of high quality green
infrastructure. The network will be anchored in five strategic elements, each with their own
supporting emerging policy: trees and woodlands (Policy GM9); the uplands (Policy GM10; lowland
wetlands (Policy GM11); river valleys and canals (Policy GM12); and recreation areas including
major parks and green spaces (Policy GM14).
3.10.14 In this context, it is reasonable to assume that without the Local Plan, existing trends would
continue. However, whilst national planning policy contained in the NPPF and the GMSF would
help to ensure that new development protects and enhances biodiversity, a lack of specific local
policy support may result in the inappropriate location and design of development which could have
a negative effect on overall biodiversity in the Borough. Further, opportunities may be lost to plan
green infrastructure provision which could, for example, provide biodiversity enhancements through
habitat creation schemes, as well as providing various wider social and health benefits to local
communities.
Key Issues
The need to conserve and enhance biodiversity including sites with international, national and
local designations for their nature conservation value.
The need to maintain, restore and expand, where appropriate, the Borough’s priority habitats.
The need to recognise the key role that green infrastructure plays in supporting wellbeing and
climate change resilience.
46 Towards a Green infrastructure Framework for Greater Manchester: Full Report. 2008. Available online: http://www.greeninfrastructurenw.co.uk/resources/1547.058_Final_Report_September_2008.pdf [Accessed January 2017]. 47 Tameside District Council PPG17 Open Space Study, Final Assessment Report, August 2010.

59 © Amec Foster Wheeler Environment & Infrastructure UK Limited
March 2017 Doc Ref. bri005ir
The need to enhance the green infrastructure network, ensuring adequate provision, improving
accessibility and encouraging multiple uses where appropriate.
Links across the Integrated Assessment
3.10.15 Biodiversity and green infrastructure links to wellbeing, economics and resilience of the
environment to mitigate and adapt to the effects of climate change.
3.10.16 Biodiversity is protected through various national and international legislation as recognition of its
specific intrinsic value, highlighting the role it plays within ecosystems and the benefits it offers
populations and society. A variety of habitats and fauna will help support climate change
adaptation and managing flood risk. Biodiversity and its protection enhances the interest of the
local area, providing health benefits for the local population.
3.10.17 Importantly, the protection of biodiversity ensures that new development is sustainable, and that
economic progression is not at the detriment of biodiversity and green infrastructure. Protecting
these assets also contributes towards making Tameside an attractive place to live, work and invest.
3.11 Land Use, Geology and Soil
Land Use
3.11.1 Table 3.23 illustrates the key land uses in Tameside (as at 2005) and highlights that the majority
(63.5%) of the Borough is classified as green space. This reflects the largely rural nature of the
eastern half of the Borough. However, this is significantly lower than across England as a whole
(87.4%) and the North West region (82.9%).48 The main urbanised areas of the Borough are
concentrated in the main settlements of Ashton-under-Lyne, Hyde, Audenshaw, Droylsden,
Dukinfield, Denton, Stalybridge, Mossley and Longdendale.
Table 3.23 Land Use in Tameside
Land Use Area - Square metres (m2)(thousands)
Domestic Buildings 5,025.77
Non Domestic Buildings 3,051.17
Road 8,784.13
Domestic Gardens 14,168.79
Greenspace 70,278.39
Total 110,615.30
Source: Neighbourhood Statistics Key Figures for the Physical Environment (2005)
3.11.2 Government policy set out in the NPPF encourages the effective use of land by re-using land that
has been previously developed. The majority (79%) of all new dwellings completed in the Borough
in the latest monitoring period (2013/14) were on previously developed land (PDL) (often referred
to as brownfield land)49. However, according to recent national land use change statistics published
by CLG50, only 49% of new residential dwellings were delivered on PDL in the Borough in 2016,
lower than for England as a whole (61%).
48 Neighbourhood Statistics Key Figures for the Physical Environment (2007). Available via: http://www.neighbourhood.statistics.gov.uk/dissemination/ [Accessed January 2017]. 49 Tameside Metropolitan Borough Council (2014) Authority’s Monitoring Report. 50 Available from https://www.gov.uk/government/statistical-data-sets/live-tables-on-land-use-change-statistics [Accessed January 2017].

60 © Amec Foster Wheeler Environment & Infrastructure UK Limited
March 2017 Doc Ref. bri005ir
Geology
3.11.3 The geology in Greater Manchester is dominated by rock formations, with those in the north and
east being of Upper Carboniferous sandstones and shales of Millstone Grit. These are overlain by
shales, mudstones, and coals, providing many outcrops in the upland boroughs. These features
are evident in Tameside.
3.11.4 Flat low-lying plains, largely developed for industrial and residential usage, form the central and
western part of the Borough. The geological structure of the area is dominated by the Rossendale
and Pennine anticlines which lie beyond the limits of the Tameside boundary, to the north and east
respectively. The rural east of the Borough is dominated by the Pennines, which rise steeply
forming the western extent of the Peak District.
3.11.5 Some of the most prominent features of the landscape are the incised river valleys of the Medlock,
Tame and Etherow which run through or along the borders of the Borough from north east to south
west, and the steep Pennine foothills to the east. Faulting is heavy and complex in detail in the
Borough and dominantly trends in a north westerly direction. The westerly dip in the solid geology
means that, generally speaking, the oldest rocks are found in the eastern areas with gradually
younger rocks encountered westwards through the Borough.
3.11.6 Rocher Vale, which is on the Borough boundary with Oldham toward Park Bridge Heritage Centre,
is designated as a LNR and SBI. It has a mix of habitats including woodland, heath and riverbanks
and displays many rocky outcrops and geological features. There are ambitions to designate the
site as a Regionally Important Geological Sites (RIGS).51
Soil
3.11.7 The Agricultural Land Classification (ALC) system developed by Defra provides a method for
assessing the quality of farmland. The system divides the quality of land into five categories, as
well as non-agricultural and urban. The ‘best and most versatile land’ is defined by the NPPF as
that which falls into Grades 1, 2 and sub-grade 3a.
3.11.8 The provisional ALC that covers the whole of England was undertaken between 1967 and 1974,
from 1988 selected areas were resurveyed in greater detail and to revised guidelines. 52
3.11.9 The majority of land outside the urban areas of Tameside is classified as either Grade 4 (‘Poor’) or
Grade 5 (‘Very Poor’) quality agricultural land, reflecting the predominance of moorland in the east
of the Borough. However, there are areas of ‘Good to Moderate’ (Grade 3) quality agricultural land
around Longdendale. It is important to note that ALC mapping does not distinguish between sub-
grades 3a and 3b and in consequence, it is not possible to determine the extent to which this land
constitutes that which is ‘best and most versatile’ without more detailed survey work being
undertaken .
Likely Evolution of the Baseline Without the Local Plan
3.11.10 As set out above, national planning policy encourages the effective use of land by re-using land
that has been previously developed. It also seeks to protect the best and most versatile
agricultural land. Alongside a range of existing brownfield sites identified within the Council’s
SHLAA, the Draft GMSF also includes six proposed primarily greenfield allocations that may come
forward without the Local Plan.
3.11.11 Without the Local Plan, national planning policy set out in the NPPF would apply and may help to
ensure that new development is focused on brownfield land. However, without clear and specific
local planning policy relating to the location of future development and the provision of sites to meet
local needs, the Council would have less control over where development takes place. This could
increase the likelihood of development of greenfield sites and loss of high quality agricultural land.
51 Tameside Metropolitan Borough Council (2012) Core Strategy Topic Paper 9. Available from http://www.tameside.gov.uk/corestrategy/topics/paper9.pdf [Accessed January 2017]. 52 MAFF (1988) ALC of England and Wales, Revised Guidelines and Criteria for Grading the Quality of Agricultural Land

61 © Amec Foster Wheeler Environment & Infrastructure UK Limited
March 2017 Doc Ref. bri005ir
3.11.12 With regard to geodiversity, new development could increase pressure on the Borough’s geological
assets; the risk of which could be increased without clear policy seeking to protect and enhance the
Borough’s geodiversity.
Key Issues
The need to encourage development on previously developed (brownfield) land.
The need to make best use of existing buildings and infrastructure.
The need to protect the limited areas of best and most versatile agricultural land in the
Borough from inappropriate development.
The need to protect and enhance sites designated for their geological interest.
Links across the Integrated Assessment
3.11.13 The Local Plan will allocate land for various uses. Balancing the need to provide a suitable
quantity of land for development whilst ensuring the Borough’s natural assets are protected is a
fundamental part of the plan making process. There are clear links with the economy and housing.
Re-using previously developed land can increase the resources available for new housing
development and can positively impact on construction jobs in the local economy.
3.11.14 In addition, re-using land can positively impact on the natural environment aiding the conservation
of ecological and landscape resources. Additionally, retaining greenfield land can aid water
management and storage thereby contributing to mitigating the impacts of climate change.
3.11.15 There are important links between the provision of agricultural land and human health in terms of
the provision of food.
3.12 Water
Water Resources
3.12.1 The main watercourse in the Borough is the River Tame. As well as the Tame, the River Medlock
and River Etherow skirt the north-west and south-east of the Borough respectively. Together,
these rivers cover approximately 50 km in the Borough. The Peak Forrest Canal, Hudderfield
Canal and reservoirs such as Audenshaw, Godley, Higher/Lower Swineshaw, Brushes, Buckton
Vale and Walkerwood also form important water resources in the Borough.
3.12.2 The Northern Manchester Abstraction Licensing Strategy (2013)53, which includes the north-west of
the Borough, identifies that surface water is available across the Northern Manchester catchment
area (although no water is available for abstraction in the Borough). Groundwater is available in
those parts of the Borough within this catchment. The Upper Mersey Abstraction Licensing
Strategy (2013)54, which covers the east of the Borough, identifies that there is surface water and
groundwater available for licensing in this catchment including within the Borough.
3.12.3 United Utilities provides public water supply to the Borough which lies within the Integrated Water
Resource Zone (WRZ). Within the Integrated WRZ, more than 90% of the water supplied comes
from rivers and reservoirs, with the remainder from groundwater.55 Sewerage and wastewater
treatment services are also provided by United Utilities. North Tameside is supplied by Buckton
Castle water treatment works (WwTW) in Mossley, while south Tameside is supplied by Godley
WwTW near Hyde, with support from the Manchester Ring Main.
53 Environment Agency (2013) Northern Manchester Abstraction Licensing Strategy. 54 Environment Agency (2013) Northern Manchester Abstraction Licensing Strategy. 55 United Utilities (2015) Water Resources Management Plan.

62 © Amec Foster Wheeler Environment & Infrastructure UK Limited
March 2017 Doc Ref. bri005ir
3.12.4 The Environment Agency (2013) report ‘Water Stress Areas - Final Classifications’56 identifies that
the United Utilities area (having considered current and future water usage and climate change
scenarios) is only under ‘moderate water stress’. This is not considered to be a serious level of
stress on water resources and is much lower than many other water company areas.
Water Quality
3.12.5 The Borough falls within two catchments; the Irwell in the north-west and Upper Mersey in the
south-east. These catchments are covered by the North West District River Basin Management
Plan (RBMP) (2015) (see Figure 3.21). The North West RBMP (2015)57 reports that in 2009, 30%
of surface waters in the river basin district had ‘Good’ or ‘Better’ ecological status/potential whilst in
2015 this only stood at 22%. As at 2015, 89% of groundwaters were at a ‘Good’ or ‘Better’
quantitative status, an increase from 61% in 2009. However, only 33% were classified as having a
‘Good’ or ‘Better’ chemical status, a decrease from 44% in 2009. The RBMP does note that 584
individual water body elements improved by one or more class over the same period.
3.12.6 The North West RBMP identifies the following issues as affecting water quality in the river basin
district:
physical modifications - affecting 50% of water bodies in this river basin district;
pollution from waste water – affecting 24% of water bodies in this river basin district;
pollution from towns, cities and transport - affecting 13% of water bodies in this river basin
district;
changes to the natural flow and level of water - affecting 2% of water bodies in this river
basin district;
negative effects of invasive non-native species - affecting <1% of water bodies in this river
basin district;
pollution from rural areas - affecting 18% of water bodies in this river basin district; and
pollution from abandoned mines - affecting 3% of water bodies in this river basin district.
56 Environment Agency (2013) Water Stress Areas - Final Classifications. Available from https://www.gov.uk/government/uploads/system/uploads/attachment_data/file/244333/water-stressed-classification-2013.pdf [Accessed January 2017]. 57 Defra and Environment Agency (2015) North West District River Basin Management Plan.

63 © Amec Foster Wheeler Environment & Infrastructure UK Limited
March 2017 Doc Ref. bri005ir
Figure 3.21 The North West River Basin District
Source: Defra and Environment Agency (2015) North West District River Basin District Management Plan.
3.12.7 The Environment Agency has recently completed an exercise to refresh the data related to smaller
operational catchments58. The Borough falls within the Roch Irk Medlock Operational Catchment in
the north-west and Goyt Etherow Tame Catchment to the south-east. In the Medlock Operational
Catchment, ecological status was ‘moderate’ in 23 out of 24 waterbodies with only 1 achieving
‘poor’ status. Chemical status was ‘good’ in 23 of the waterbodies with 1 failing. In the Goyt
Etherow Tame Catchment, ecological status was ‘moderate’, ‘good’ or ‘very good’ in 45 out of 48
waterbodies with only 3 achieving poor status. Chemical status was classified as ‘good’ in every
waterbody.
58 See http://environment.data.gov.uk/catchment-planning [Accessed January 2017].

64 © Amec Foster Wheeler Environment & Infrastructure UK Limited
March 2017 Doc Ref. bri005ir
3.12.8 The main sectors affecting the status of waterbodies (for the Irwell and Upper Mersey Management
Catchments as a whole) have been cited as agriculture and land management (due to changes in
natural flows/levels of water and pollution from rural areas), urban development and transport, local
and regional government, and water industry operations (principally pollution from wastewater).
Flood Risk
3.12.9 The NPPF seeks to ensure that flood risk is taken into account at the plan making stage in order to
avoid inappropriate development in areas at risk of flooding and to direct development away from
areas at highest risk. The Environment Agency categorises flood risk from rivers by identifying
Flood Zones, as follows:
Flood Zone 1 – land assessed as having a less than 1 in 1,000 annual probability of river
flooding (<0.1%);
Flood Zone 2 – land assessed as having between a 1 in 100 and 1 in 1,000 annual
probability of river flooding (1% – 0.1%) in any year; and
Flood Zone 3 - land assessed as having a 1 in 100 or greater annual probability of river
flooding (>1%) in any year.
3.12.10 Figure 3.22 shows the prevalence of Flood Zones 2 and 3 across the Borough.
3.12.11 The Tameside Strategic Flood Risk Assessment (SFRA) (2011)59 highlights that the risk of fluvial
flooding in the Borough is generally low although land close to the River Tame is designated as
Flood Zone 3. The Assessment indicates that in many cases, the extent of flooding is contained
within the river banks; where areas of flooding do extend beyond river banks, the land is
predominantly allocated as Green Belt.
3.12.12 According to land use change statistics published by CLG, no new residential dwellings were built
within Flood Zone 3 in the period 2015 to 2016, compared to a national average of 9% of new
dwellings.
3.12.13 There is a wide distribution of areas at risk of surface water flooding in the Borough. The Tameside
SFRA advises that flooding from surface water is generally a localised issue typified by lower lying
ground conditions and areas below hills and moors.
59 Tameside Metropolitan Borough Council and Stockport Borough Council (2011) Strategic Flood Risk Assessment.

65 © Amec Foster Wheeler Environment & Infrastructure UK Limited
March 2017 Doc Ref. bri005ir
Figure 3.22 Areas of Flood Risk

66 © Amec Foster Wheeler Environment & Infrastructure UK Limited
March 2017 Doc Ref. bri005ir
Likely Evolution of the Baseline Without the Local Plan
3.12.14 The growth in local, as well as sub-regional and regional, populations will result in increased
pressure on water resources which could affect water availability and quality. However, United
Utilities’ current Water Resources Management Plan (WRMP) (2015) does not show a forecast
deficit in supply in the Integrated WRZ over the plan period. Water quality in the North West river
basin district, meanwhile, is expected to improve with 25% of surface waters predicted to be at
good ecological status/potential or better by 2021 and 94% of groundwaters predicted to be at
good quantitative status (based on the North West RBMP).
3.12.15 In the absence of the Local Plan, measures contained in the WRMP together with national planning
policy and the GMSF would be expected to help ensure that future demands for water are met and
that water conservation measures in new development are promoted. Further, other plans and
programmes including the North West RBMP would be expected to help conserve and enhance
waterbodies in the Borough.
3.12.16 Topic Paper 10 prepared in support of the Core Strategy and Development Management Policies
DPD identified that, at the time of publication, there were no known capacity issues with respect to
WwTWs in the Borough 60. However, it did note that there were known issues within the sewer
network. A failure to plan for new development and ensure the timely investment in infrastructure
could place pressure on existing treatment facilities and networks resulting in adverse water quality
and wider environmental effects.
3.12.17 Taking into account national planning policy set out in the NPPF, the GMSF, and the relatively low
level of flood risk within the Borough, it is not expected that the baseline with regard to flood risk
would change significantly without the Local Plan (although flood risk may increase as a result of
climate change). However, any new local policies and site allocations would help to ensure that
new development is located away from flood risk areas, applying the sequential test and exception
test if relevant.
Key Issues
The need to protect and enhance the quality of the Borough’s water resources.
The need to promote the efficient use of water resources.
The need to ensure the timely provision of new water services infrastructure to meet demand
arising from new development.
The need to locate new development away from areas of flood risk, taking into account the
effects of climate change.
The need to encourage the use of Sustainable Drainage Systems.
The need to appropriately manage surface water.
Links across the Integrated Assessment
3.12.18 There are clear links between water and a number of the other themes considered in this Scoping
Report. Ensuring there are sufficient water resources in the Borough, protecting water quality and
minimising the impacts of flood risk is central to achieving a number economic, social and
environmental objectives.
3.12.19 Housing and employment development must be supported by sufficient water resources and be
located in areas where flood risk is minimised or can be suitably mitigated to ensure that
development is sustainable. Flooding can have significant effects on the economy and
communities ranging from temporary road and business closures through to the permanent loss of
homes and businesses in extreme cases. In turn, minimising flood risk and ensuring appropriate
60 Tameside Metropolitan Borough Council (2012) Core Strategy Topic Paper 10. Available from http://www.tameside.gov.uk/corestrategy/topics/paper10.pdf [Accessed January 2017].
67 © Amec Foster Wheeler Environment & Infrastructure UK Limited
March 2017 Doc Ref. bri005ir
water infrastructure is in place supports healthy communities and helps to address the effects of
climate change.
3.12.20 Rivers and canal lines also provide green links, which are important for recreation and often
provide routes for walking and cycling. Green infrastructure can also act as important water
storage areas whilst urban parks and gardens can reduce surface run off.
3.13 Air Quality
3.13.1 Legislative frameworks and guidance in relation to air quality have been established at both the
European and UK level. Policies aim to reduce exposure to specific pollutants by reducing
emissions and setting targets for air quality. Policies are driven by the aims of the EU Air Quality
Directive (2008/50/EC)61. The key objective is to help minimise the negative impacts on human
health and the environment. The Directive sets guidance for member states for the effective
implementation of air quality targets.
3.13.2 The UK’s National Air Quality Strategy62 sets health based standards for eight key pollutants and
objectives for achieving them. This is to ensure a level of ambient air quality in public places that is
safe for human health and quality of life. It also recognises that specific action at the local level
may be needed depending on the scale and nature of the air quality problem.
3.13.3 Local authorities have a duty to undertake a full review and assessment of air quality in accordance
with the National Air Quality Strategy. Where there is a likelihood of a national air quality objective
being exceeded, the relevant council must declare an Air Quality Management Area (AQMA) and
prepare an Air Quality Action Plan (AQAP) setting out the measures it intends to put in place in
pursuit of the objectives.
3.13.4 Tameside declared an AQMA in June 2001 and amended it in 2004. The areas covered by the
AQMA included the A57, A635 and A662 as well as the M60 and M67 and comprised some 1158.2
ha of the Borough. The GMCA AQMA came into effect on 1st May 2016 and superseded the
previous AQMA Order in the Borough; the extent of this AQMA in the Borough is shown in Figure
3.23.
61Available via: http://eur-lex.europa.eu/legal-content/EN/TXT/?uri=celex:32008L0050 [Accessed December 2016]. 62 The Air Quality Strategy for England, Scotland, Wales and Northern Ireland, Volume 1. Available via: https://www.gov.uk/government/uploads/system/uploads/attachment_data/file/69336/pb12654-air-quality-strategy-vol1-070712.pdf [Accessed December 2016].
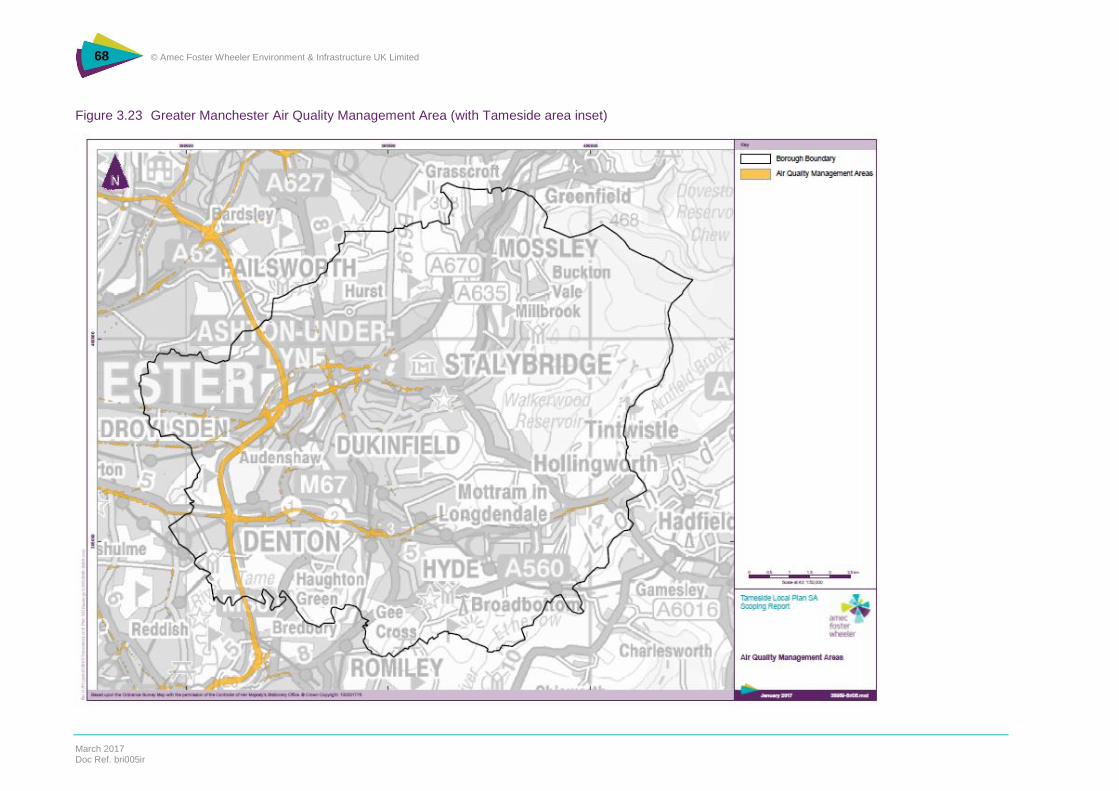
68 © Amec Foster Wheeler Environment & Infrastructure UK Limited
March 2017 Doc Ref. bri005ir
Figure 3.23 Greater Manchester Air Quality Management Area (with Tameside area inset)

69 © Amec Foster Wheeler Environment & Infrastructure UK Limited
March 2017 Doc Ref. bri005ir
3.13.5 The areas around the major highways are designated due to the likely breach of nitrogen dioxide of
35 micrograms per cubic metre (μg m-3), which is a more stringent objective than the 40μg m-3
specified in the Air Quality Regulations (2000). In Greater Manchester, road transport contributes
75% of emissions of nitrogen oxides and 81% of particulates63. The major roads are the largest
source of transport emissions although motorways are also very significant, particularly for nitrogen
oxides.
3.13.6 The GMCA published the Greater Manchester Air Quality Action Plan 2016-2021 in 2016 which
includes a broad range of actions to address air quality ranging from reducing emissions from
freight and cars to supporting walking, cycling and the use of public transport. Monitoring includes
utilising data across a number of monitoring stations in the area, two of which are in Tameside,
Mottram Moor and at the former Two Trees School (Denton). The latest annual monitoring data64
indicates that at the Mottram Moor location, the annual mean objective of 35μg m-3 was exceeded
in 2014 and 2015 (49μg m-3 and 50μg m-3 respectively) whilst at the former Two Trees School, it
has not been exceeded in the last five years of monitoring.
Likely Evolution of the Baseline Without the Local Plan
3.13.7 Improvements to air quality do not solely rely on planning policy as other changes can be made
including undertaking actions set out in the Greater Manchester Air Quality Action Plan 2016-2021
produced on behalf of the Greater Manchester authorities. However, an increase in population and
households in the Borough will in-turn generate additional transport movements and associated
emissions into the air.
3.13.8 Even with development of the GMSF, there would be a policy gap without the Local Plan with
regard to the location of future growth in the Borough and which could result in development being
located in areas that are not well served by community facilities, services and jobs, thereby
increasing traffic movements and associated emissions to air.
Key Issues
The need to minimise the emission of pollutants to air.
The need to improve air quality, particularly in the Greater Manchester AQMA.
Links across the Integrated Assessment
3.13.9 There are clearly close links between air quality and transport. Increasing transport use will worsen
air pollution without significant technological and infrastructure improvements. This is likely to
impact upon the health of Tameside’s communities, particularly vulnerable groups such as those
with pre-existing medical conditions, and therefore also impact upon the delivery of health services
such as GP surgeries and hospitals. Green infrastructure can help mitigate some of these impacts
by diluting the effects of pollution and providing opportunities for walking and cycling.
3.14 Climate Change
3.14.1 Rising global temperatures will bring changes in weather patterns, rising sea levels and increased
frequency and intensity of extreme weather. The effects of climate change will be experienced
internationally, nationally and locally with certain regions being particularly vulnerable.
3.14.2 Carbon dioxide (CO2) is identified as being the most important of the greenhouse gases which are
being produced by human activity and contributing to climate change. According to the
Intergovernmental Panel on Climate Change (IPCC), stabilising CO2 concentrations at 450 parts
per million (ppm) (that is 85 ppm above 2007 levels and 170 ppm above pre-industrial levels) in the
63 GMCA (2016) Low-Emission Strategy and Air Quality Action Plan Public Consultation. Available from http://www.tfgm.com/gmles/Documents/GM%20LES%20AQAP%20public%20consultation%20document.pdf [Accessed January 2017]. 64 GMCA (2016) Air Quality Annual Status Report (ASR) for Greater Manchester. Available from http://www.manchester.gov.uk/downloads/download/4166/air_quality_reports [Accessed January 2017].

70 © Amec Foster Wheeler Environment & Infrastructure UK Limited
March 2017 Doc Ref. bri005ir
long term would require the reduction of emissions worldwide to below 1990 levels within a few
decades.
3.14.3 The policy and legislative context in relation to climate change has been established at the
international level (Kyoto Agreement) and has been transposed into European, national and local
legislation, strategies and policies. Recently, the 2015 United Nations Climate Change Conference
(COP 21) negotiated the Paris Agreement65, a global agreement to (inter-alia) hold the increase in
the global average temperature to well below 2 °C above pre-industrial levels.
3.14.4 Reducing CO2 emissions in the atmosphere is a national target to reduce climatic impact. This is
driven by the Climate Change Act (2008), which sets a legally binding target of at least a 34%
reduction in UK emissions by 2020 and at least an 80% reduction by 2050, against a 1990
baseline. Table 3.24 shows Tameside’s per capita CO2 emissions for the period 2005 to 2013.
The Borough’s emissions have steadily decreased over this period (noting the slight increase in
2010 and 2012) and have consistently been lower than those for the North West and England as a
whole. In 2013 (the latest reporting period), per capita emissions stood at 4.9 tonnes CO2 per
person compared to 6.9 tonnes regionally and 6.7 tonnes nationally.
Table 3.24 CO2 Emissions Per Capita 2005-2013 (tonnes CO2 per person)
Tameside North West England
2005 6.3 8.7 8.5
2006 6.2 8.5 8.4
2007 6.0 8.3 8.2
2008 5.8 8.1 7.9
2009 5.0 7.3 7.1
2010 5.3 7.6 7.3
2011 4.8 6.9 6.6
2012 5.1 7.2 6.9
2013 4.9 6.9 6.7
Source: 2005 to 2013 UK local and regional CO2 emissions full dataset. Available online https://www.gov.uk/government/statistics/uk-
local-authority-and-regional-carbon-dioxide-emissions-national-statistics-2005-2013 [Accessed January 2017].
3.14.5 As Table 3.25 highlights, the largest source of CO2 emissions in Tameside is from the domestic
energy sector (electricity and gas) which produced 2.0 tonnes per person in 2013. In 2005,
industry and domestic source levels were similar; however, over the 2005 to 2013 period there has
been a decrease in industrial CO2 levels, whereas domestic levels have not reduced as
significantly. At a regional level, industry emissions were 2.9 tonnes per person in 2013,
considerably higher than for Tameside. Regional domestic levels, meanwhile, were similar to
Tameside at 2.1 tonnes per person, and transport emissions higher at 1.9 tonnes per person.
Table 3.25 Per Capita CO2 Emissions by Source for Tameside 2005-2013 (tonnes CO2 per person)
Industry Domestic Transport Total
2005 2.4 2.5 1.4 6.3
2006 2.4 2.5 1.4 6.2
2007 2.2 2.4 1.4 6.0
65 See htt2009p://unfccc.int/resource/docs/2015/cop21/eng/l09.pdf [Accessed January 2017].
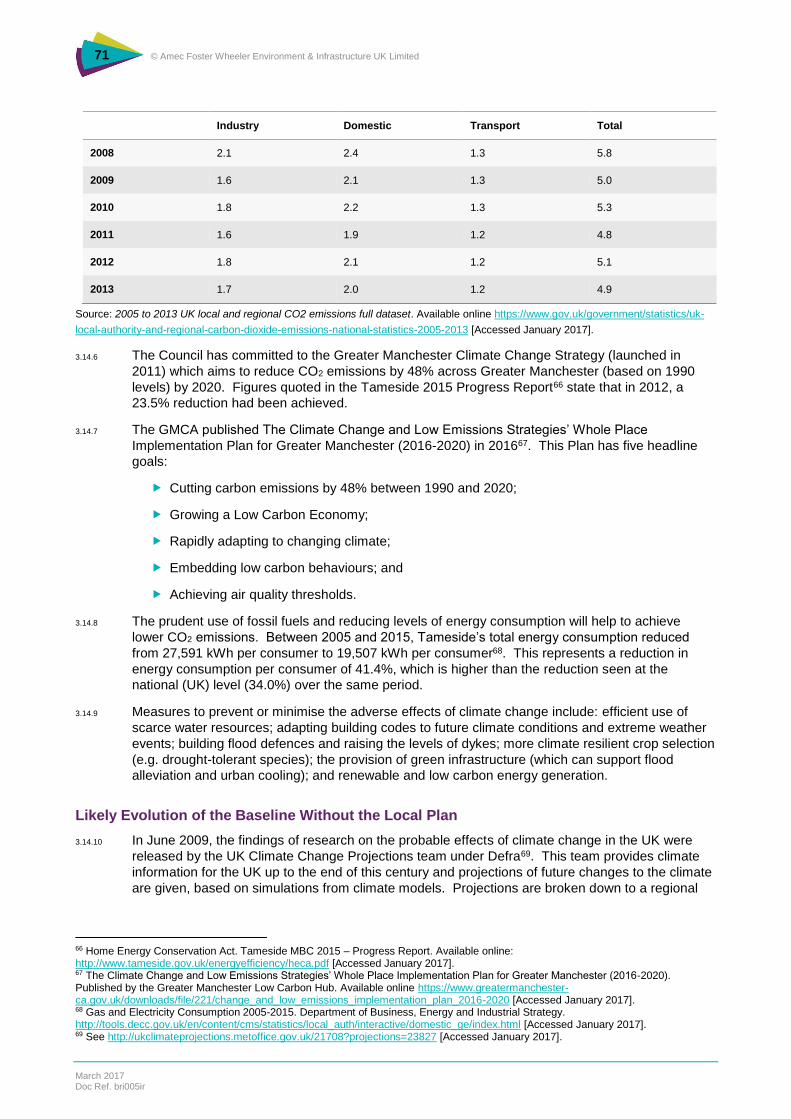
71 © Amec Foster Wheeler Environment & Infrastructure UK Limited
March 2017 Doc Ref. bri005ir
Industry Domestic Transport Total
2008 2.1 2.4 1.3 5.8
2009 1.6 2.1 1.3 5.0
2010 1.8 2.2 1.3 5.3
2011 1.6 1.9 1.2 4.8
2012 1.8 2.1 1.2 5.1
2013 1.7 2.0 1.2 4.9
Source: 2005 to 2013 UK local and regional CO2 emissions full dataset. Available online https://www.gov.uk/government/statistics/uk-
local-authority-and-regional-carbon-dioxide-emissions-national-statistics-2005-2013 [Accessed January 2017].
3.14.6 The Council has committed to the Greater Manchester Climate Change Strategy (launched in
2011) which aims to reduce CO2 emissions by 48% across Greater Manchester (based on 1990
levels) by 2020. Figures quoted in the Tameside 2015 Progress Report66 state that in 2012, a
23.5% reduction had been achieved.
3.14.7 The GMCA published The Climate Change and Low Emissions Strategies’ Whole Place
Implementation Plan for Greater Manchester (2016-2020) in 201667. This Plan has five headline
goals:
Cutting carbon emissions by 48% between 1990 and 2020;
Growing a Low Carbon Economy;
Rapidly adapting to changing climate;
Embedding low carbon behaviours; and
Achieving air quality thresholds.
3.14.8 The prudent use of fossil fuels and reducing levels of energy consumption will help to achieve
lower CO2 emissions. Between 2005 and 2015, Tameside’s total energy consumption reduced
from 27,591 kWh per consumer to 19,507 kWh per consumer68. This represents a reduction in
energy consumption per consumer of 41.4%, which is higher than the reduction seen at the
national (UK) level (34.0%) over the same period.
3.14.9 Measures to prevent or minimise the adverse effects of climate change include: efficient use of
scarce water resources; adapting building codes to future climate conditions and extreme weather
events; building flood defences and raising the levels of dykes; more climate resilient crop selection
(e.g. drought-tolerant species); the provision of green infrastructure (which can support flood
alleviation and urban cooling); and renewable and low carbon energy generation.
Likely Evolution of the Baseline Without the Local Plan
3.14.10 In June 2009, the findings of research on the probable effects of climate change in the UK were
released by the UK Climate Change Projections team under Defra69. This team provides climate
information for the UK up to the end of this century and projections of future changes to the climate
are given, based on simulations from climate models. Projections are broken down to a regional
66 Home Energy Conservation Act. Tameside MBC 2015 – Progress Report. Available online: http://www.tameside.gov.uk/energyefficiency/heca.pdf [Accessed January 2017]. 67 The Climate Change and Low Emissions Strategies’ Whole Place Implementation Plan for Greater Manchester (2016-2020). Published by the Greater Manchester Low Carbon Hub. Available online https://www.greatermanchester-ca.gov.uk/downloads/file/221/change_and_low_emissions_implementation_plan_2016-2020 [Accessed January 2017]. 68 Gas and Electricity Consumption 2005-2015. Department of Business, Energy and Industrial Strategy. http://tools.decc.gov.uk/en/content/cms/statistics/local_auth/interactive/domestic_ge/index.html [Accessed January 2017]. 69 See http://ukclimateprojections.metoffice.gov.uk/21708?projections=23827 [Accessed January 2017].

72 © Amec Foster Wheeler Environment & Infrastructure UK Limited
March 2017 Doc Ref. bri005ir
level across the UK and illustrate the potential range of changes and the level of confidence in
each prediction.
3.14.11 The predicted effects of climate change for the North West region by 2050 (under a medium
emissions scenario) are set out in Table 3.26.
Table 3.26 North West England Climate Predictions (medium emissions scenario)
Climate Record Estimate of Increase/Decrease
Most Likely Range Range of Uncertainty
Winter mean temperature 1.9 °C 1°C to 3°C 0.8°C to 3.3°C
Summer mean temperature 2.6°C 1.2°C to 4.1°C 1.1°C to 4.7°C
Summer mean daily maximum temperature
3.3°C 1°C to 5.8°C 1°C to 6.5°C
Summer mean daily minimum temperature
2.5°C 1°C to 4.4°C 0.9°C to 4.9°C
Annual mean precipitation 0% -6% to 6% -8% to 8%
Winter mean precipitation 13% 3% to 26% -1% to 27%
Summer mean precipitation -18% -36% to 1% -37% to 8%
Source: Defra (2009) The UK Climate Predictions (UKCO09).
3.14.12 Climate change is occurring and will continue regardless of local policy intervention. However,
national policy on climate change and other plans and programmes such as the Greater
Manchester Climate Change Strategy, alongside the progressive tightening up of Building
Regulations, will help to ensure that new development is located and designed to adapt to the
effects of climate change and that measures are in place to mitigate climate change.
Notwithstanding this, without the Local Plan, the Council is likely to have less control over, in
particular, the location of new development which could exacerbate climate change impacts and
mean that opportunities to mitigate effects (for example, through reducing transport movements,
tree planting and district-scale renewable energy solutions) may be missed.
3.14.13 In 2011, the Council published the Tameside Decentralised and Zero Carbon Energy Planning
Study70 to provide an evidence base for emerging energy policies. The Study identified energy
generating opportunities within the Borough for wind power, hydropower, solar power, heating and
cooling systems, biogas and mine water heating as well as for potential biomass production. This
serves to demonstrate that the Borough has a number of options for renewable energy production.
Key Issues
The need to ensure that new development is able to adapt to the effects of climate change.
The need to mitigate climate change including through increased renewable energy provision.
The need to contribute to the Greater Manchester target of reducing CO2 emissions by 48% by
2020.
70 Urbed and Aecom for Tameside Metropolitan Borough Council (2011) Tameside Decentralised and Zero Carbon Energy Planning
Study. Available from http://www.tameside.gov.uk/planning/energystudy.pdf [Accessed January 2017].

73 © Amec Foster Wheeler Environment & Infrastructure UK Limited
March 2017 Doc Ref. bri005ir
Links across the Integrated Assessment
3.14.14 Climate change impacts are linked to a number of different social, economic and environmental
themes considered in this Scoping Report, particularly: air quality; the economy; health and
wellbeing; water; and biodiversity and green infrastructure.
3.14.15 In particular, air pollution and greenhouse gases often share common sources. Further to this,
changes in temperature can affect the way air pollutants behave. For example, increases in
temperature may affect the formation of ozone, increasing the frequency and severity of summer
smogs. During the UK heat-wave of August 2003, between 420 and 770 (depending on the
method of calculation) deaths brought forward were attributable to air pollution in a 15-day period71.
Extreme weather, and in particular heat waves, can affect vulnerable people (children, older
people, those with existing health issues) in society, and often increase the incidence of deaths.
3.14.16 Climate change impacts from the increased likelihood of flash flooding can have extensive
economic, health and environmental impacts. Green infrastructure, including gardens, trees and
parks can help manage rainwater flows, and reduce the likelihood of conventional drainage
infrastructure surcharging after a storm. Planting in the upper reaches of catchments can help to
manage river flows through similar processes.
3.14.17 Increased temperatures and incidences of heat waves can affect human health and biodiversity as
well as the availability of water resources.
3.15 Material Assets
Waste
3.15.1 The Greater Manchester Joint Waste Development Plan Document (Joint Waste Plan) (2012)72
sets out the waste planning strategy for the conurbation to 2027. The aim of the Plan is to enable
the adequate provision of waste management facilities in appropriate locations for the range of
municipal, commercial and industrial, construction and demolition and hazardous wastes.
3.15.2 While the Council is the waste collection authority for the area, the Greater Manchester Waste
Disposal Authority is responsible for waste management. Local authority collected waste statistics
for Great Manchester73 indicate that a total of 1,136,395 tonnes of waste was collected in 2015/16
of which 478,416 tonnes (42%) was recycled/composted/reused. Within Tameside Borough, a
total of 72,414 tonnes of municipal waste was generated in 2015/16 of which 33,326 tonnes (46%)
was sent for recycling/composting/reuse. This is similar to the position in 2013/14 in terms of
waste collected (71,477 tonnes) although the percentage sent for recycling and reuse has
increased (28,248 tonnes was recycled in 2013/14, equivalent to 40%).74
3.15.3 There are a number of waste management facilities in the Borough and these are shown in Figure
3.24. Within the Joint Waste Plan, a site at Shepley Industrial Estate in Audenshaw is also
allocated as being potentially suitable for one of the following waste treatment uses; Material
Recovery Facility, Mechanical Heat Treatment, Mechanical Biological Treatment, Anaerobic
Digestion or In-Vessel Composting.
71 Defra (2010). Air Pollution: Action in a Changing Climate 72 Association of Greater Manchester Authorities (2012) Greater Manchester Joint Waste Development Plan Document. 73 Defra (2014) Local Authority Collected Waste Statistics. Available from https://www.gov.uk/government/statistical-data-sets/env18-local-authority-collected-waste-annual-results-tables [Accessed January 2017]. 74 Tameside Metropolitan Borough Council (2014) Authority’s Monitoring Report.

74 © Amec Foster Wheeler Environment & Infrastructure UK Limited
March 2017 Doc Ref. bri005ir
Figure 3.24 Waste Management Facilities and Joint Waste Plan Allocations

75 © Amec Foster Wheeler Environment & Infrastructure UK Limited
March 2017 Doc Ref. bri005ir
Minerals
3.15.4 Government policy promotes the general conservation of minerals whilst at the same time ensuring
an adequate supply is available to meet needs. Mineral resources are not distributed evenly
across the country and some areas are able to provide greater amounts of certain minerals than
they actually use.
3.15.5 The Joint Authorities’ Monitoring Report (JAMR)75 identifies that within Greater Manchester, there
is a supply of low quality aggregate but a limited resource of high quality aggregates (needed to
ensure continued economic expansion of Greater Manchester) available. The area therefore relies
heavily on imports from Mineral Planning Authorities (MPAs) outside of the plan area to meet high-
quality aggregate needs. Furthermore, the use of recycled aggregates and secondary mineral
products is encouraged wherever possible to reduce the need for imports and promote sustainable
use of raw materials.
3.15.6 The JAMR highlights that production of sand and gravel has averaged 5.89 million tonnes (mt)
between 2005 and 2015, although the amount won in 2014 (3.86 mt) and 2015 (3.70mt) was
significantly lower than earlier in the period (8.91mt in 2005 and 9.89mt in 2006) reflecting a
predominantly downward trend. Total sales between 2006 and 2015 averaged 0.61mt and in line
with production, the general trend has been a decrease in sales over the period. Crushed rock
sales have followed a similar pattern to sand and gravel with the annual amount of sales and
reserves generally declining over the period from 2005 to 2015 (with sales averaging 0.8mt per
year and reserves 16.82mt). The JAMR states that the general fall in sales and reserves may
indicate an increased use of secondary and recycled aggregate.
Likely Evolution of the Baseline Without the Local Plan
3.15.7 Waste generation in the Borough is expected to increase, commensurate with population growth.
For example, the Greater Manchester Joint Waste Plan (2012) forecasts local authority collected
waste arisings to increase from 1,111,271 tonnes per annum in 2009 to 1,114,077 tonnes per
annum in 2027 (across the conurbation). This could place pressure on existing waste
management facilities, although it is envisaged that recycling/reuse rates would also continue to
increase (the Greater Manchester Municipal Waste Management Strategy, for example, includes a
target to increase recycling rates to a minimum of 50% by 2020). The Greater Manchester Joint
Waste Plan (2012) identifies a number of sites across the sub-region to help address forecast
shortfalls in waste management capacity and it is expected that these sites would be delivered
without the Local Plan.
3.15.8 New development (both within the Borough and nationally) may place pressure on local mineral
assets to support construction. The Greater Manchester Joint Minerals Plan (2013)76 sets out the
planning strategy to deliver a steady and sustainable supply of minerals and safeguard mineral
resources up to 2027. It identifies a sub-regional annual requirement of 1.32 million tonnes of
crushed rock and 0.43 million tonnes of sand and gravel between 2005 and 2020. To help meet
this requirement, the Plan includes areas of search for aggregates as well as safeguarding areas;
those which affect the Borough are shown in Figure 3.25.
75 Greater Manchester Combined Authorities (2016) Greater Manchester Joint Minerals Development Plan Authority Monitoring Report 2015-2016. The AMR reports on mineral production in the ten Great Manchester authorities, the five authorities in the Merseyside region and Halton Borough Council, and Warrington Borough Council. 76 Association of Greater Manchester Authorities (2013) Greater Manchester Joint Minerals Plan.
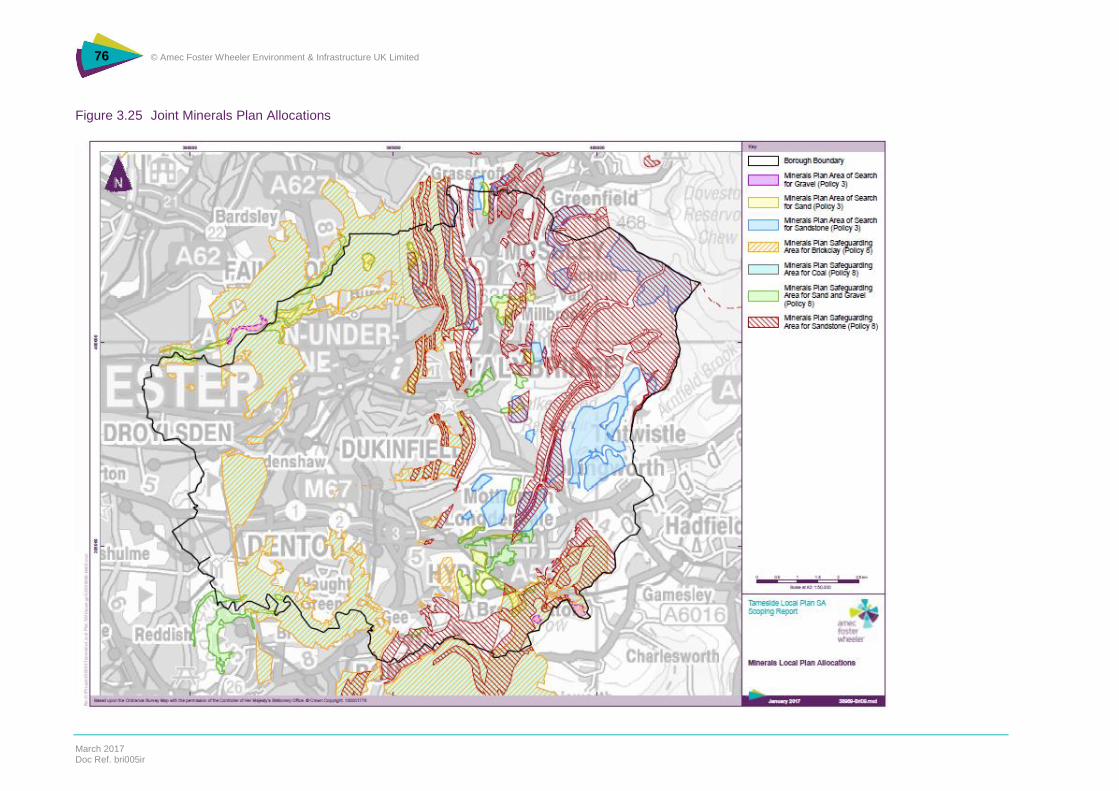
76 © Amec Foster Wheeler Environment & Infrastructure UK Limited
March 2017 Doc Ref. bri005ir
Figure 3.25 Joint Minerals Plan Allocations

77 © Amec Foster Wheeler Environment & Infrastructure UK Limited
March 2017 Doc Ref. bri005ir
3.15.9 Planning for waste and minerals is undertaken at the GMCA level and in consequence, the
baseline would not be expected to change significantly without the Local Plan. Additionally, the
Draft GMSF provides emerging strategic level polices that (inter alia) promote resource efficiency.
However, detailed policies in the Local Plan could support the objectives of the Joint Waste and
Minerals Plans including by, for example, promoting the provision of on-site recycling facilities and
the sustainable use of materials in new development.
Key Issues
The need to minimise waste arisings and encourage reuse and recycling.
The need to promote the efficient use of mineral resources, recognising that the Greater
Manchester area is reliant on minerals won in other MPAs.
The need to ensure the protection of the Borough’s mineral resources in accordance with the
Great Manchester Joint Minerals Plan (2013).
The need to promote resource efficiency through sustainable design and construction
techniques to minimise resource depletion and waste creation.
Links across the Integrated Assessment
3.15.10 Waste generation, disposal and re-use cuts across a number of social, economic and
environmental themes. Re-using materials reduces waste and the need for primary materials,
which has significant positive environmental impacts. Recycling can also bring economic
opportunities for business development whereas landfill is expensive and requires a significant
amount of land.
3.15.11 Environmentally, there can be landscape impacts from waste developments. The location of waste
facilities can also impact on health and wellbeing depending on the nature of the processes
employed (noise, odour, air quality impacts) whilst perceived impacts also have a social dimension.
3.15.12 Mineral and aggregates extraction has clear links to the economy and environment. The use of
minerals is central to the construction industry and it also supports employment opportunities in this
sector. Environmentally, there are clear links to the landscape when sites are in active use and
ecology, especially when mineral sites are reclaimed.
3.16 Cultural Heritage
3.16.1 The character of Tameside remains strongly influenced by the Industrial Revolution and the
development of the mill towns including Ashton-under-Lyne, Dukinfield, Hyde, Mossley and
Stalybridge. The growth and evolution of the Borough was driven through the development of the
textile and, later, the coal industries with the Borough’s towns and villages developing different
characters due to, amongst other things, topography, street pattern, materials and their role in local
industry. The Borough’s strong built heritage is reflected by the number of statutory designations,
the distribution of which is shown in Figure 3.26.

78 © Amec Foster Wheeler Environment & Infrastructure UK Limited
March 2017 Doc Ref. bri005ir
Figure 3.26 Designated Cultural Heritage Assets

79 © Amec Foster Wheeler Environment & Infrastructure UK Limited
March 2017 Doc Ref. bri005ir
3.16.2 The National Heritage List for England77 includes 326 listed building entries for Tameside
(comprising 2 Grade I, 21 Grade II* and 303 Grade II listings).
3.16.3 Tameside has a long history of human activity with some 22 Mesolitic sites identified within the
Borough, the oldest dating to around 8,000 BC. There are four designated scheduled monuments:
Round cairn - west of Hollingworthhall Moor;
Buckton Castle - a ringwork and site of a 17th century beacon 350 m north east of Castle
Farm;
A section of an early medieval boundary ditch known as the Nico Ditch on Denton golf
course -320 m south west of Lodge Farm; and
Post-medieval glassworks – 250 m south east of Clarke's Bridge.
3.16.4 Stamford Park is Tameside’s only registered park and garden and has been a public park since its
official opening in 1873. Official recognition of its significance as a park and garden was given by
its inclusion on the 'Register of Historic Parks and Gardens of Special Historic Interest in England’
in 1986.
3.16.5 Historic groups of buildings and areas of towns and villages within Tameside are recognised for
their special architectural, historic or other rare or distinctive setting or character. Nine such areas
have been designated as Conservation Areas (Ashton Town Centre, Carrbrook, Copley, Fairfield,
Millbrook, Mottram-in-Longdendale, Portland Basin and Stalybridge Town Centre). There are also
many buildings within the Borough which are not listed, but which contribute to the character of the
area. These are identified in the Historic Environment Record maintained by the AGMA (currently
via the University of Salford).
3.16.6 Within Tameside, there are currently 10 listed buildings and two conservation areas on the Historic
England Heritage At Risk Register78. These are listed in Table 3.27.
Table 3.27 Historic Assets ‘At Risk’
Listed Buildings Conservation Areas
Holy Trinity Church, Trinity Street
Dukinfield Old Chapel, Old Road
Church of St John the Baptist, High Street
Holy Trinity Church, Dean Street
Church of St John the Evangelist, King's Road
Church of St John the Baptist, Carrhill Road
Former Municipal Baths, , Henry Square
Old Hall Chapel, Old Hall Street
Apethorn Farmhouse, Apethorn Lane
Hyde Hall, Town Lane
Ashton Town Centre
Stalybridge Town Centre
Source: Historic England (2017) Heritage At Risk Register.
3.16.7 The Greater Manchester area has a number of historic waterways, with strong links to the history of
the region (see Figure 3.27). A report by British Waterways79 states that: “Waterways are a key
driver in the fortunes and success of regional, sub-regional and local economies supporting the
visitor and tourism economy and in many places they continue to contribute to the regeneration of
deprived areas”. It is estimated that around:
13.7 million tourism, recreation and functional visits were made to the canals in Greater
Manchester in 2009;
77 See https://historicengland.org.uk/listing/the-list/ [Accessed January 2017]. 78 Available via: https://historicengland.org.uk/advice/heritage-at-risk/search-register/ [Accessed January 2017]. 79 British Waterways (2011) Waterways: Contributing to the vision for a Greater Manchester. Available from https://canalrivertrust.org.uk/media/library/995.pdf [Accessed January 2017].

80 © Amec Foster Wheeler Environment & Infrastructure UK Limited
March 2017 Doc Ref. bri005ir
some £39 million gross direct expenditure was generated in the local economy through these
visits, which rises to over £50 million if indirect and induced visitor spend is taken into
account;
the canal corridor supports some 1,300 leisure and tourism related jobs in Greater
Manchester.
Figure 3.27 Greater Manchester Navigation Waterways
Likely Evolution of the Baseline Without the Local Plan
3.16.8 It is reasonable to assume that the majority of Tameside’s designated heritage assets would be
protected without the Local Plan (since works that affect their special architectural or historic
interest invariably require consent). However, their significance could be harmed through
inappropriate development within their setting and opportunities to enhance assets may also be
missed. Further, other non-designated heritage assets which contribute to the character of the
area could be harmed without an up-to-date policy framework. Notwithstanding this, it is
recognised that national planning policy set out in the NPPF and the emerging policies of the Draft
GMSF and associated guidance would together provide a high level of protection in this regard.
Key Issues
The need to protect and enhance Tameside’s cultural heritage assets, including industrial
heritage assets, and their settings.
The need to avoid harm to designated heritage assets and their settings.

81 © Amec Foster Wheeler Environment & Infrastructure UK Limited
March 2017 Doc Ref. bri005ir
The need to recognise the value of non-designated heritage assets where appropriate.
The need to tackle heritage at risk.
The need to recognise the positive contribution made by the historic environment to the
character of landscapes and townscapes.
Links across the Integrated Assessment
3.16.9 Balancing the demand and subsequent pressure from housing, employment sites and associated
infrastructure with the protection and enhancement of the historic environment is important for
sustainable development.
3.16.10 Heritage assets and landscapes are important factors in the tourism economy and contribute to the
social and cultural identity of the area. They also contribute towards making Tameside an
attractive place to live, work and invest. Some heritage sites provide a recreational resource,
important for the health and wellbeing of the local population.
3.17 Landscape and Townscape
3.17.1 England has been divided into areas with similar landscape character, which are called National
Character Areas (NCAs). Tameside comprises the following three NCAs and which are shown in
Figure 3.28:
Manchester Conurbation;
Manchester Pennine Fringe; and
Dark Peak.
3.17.2 In the west of the Borough, the Manchester Conurbation NCA is characterised by dense urban and
industrial development, commercial, financial, retail and administrative centres, commuter suburbs
and housing, interspersed with a network of green infrastructure. The conurbation is centred on
low hills, crossed by several river valleys that thread through the urban fabric. The geology is
dominated by sandstones, overlain by thick deposits of glacial till. River valleys form important
corridors of semi-natural habitats and natural greenspace, with open grassland, woodland and
wetland linking urban centres with open countryside. Woodland cover is generally low, but variable
and significant for such a heavily urban location. The Natural England National Character Area
Profile (2014) 80 identifies that although there is not a large area of agricultural land within the NCA,
what there is has decreased significantly between 2000 and 2009. There is also ongoing pressure
for development and regeneration.
3.17.3 The Manchester Pennine Fringe NCA covers the central area of the Borough. The NCA is
characterised as a transitional zone between open moorlands and densely populated urban areas
with an abrupt boundary where towns stop and countryside begins. This transitional area runs
along the edge of the Millstone Grit of the Pennine uplands, and is underlain by Carboniferous
Millstone Grit and the Pennine Coal Measures, which broadly dip to the south-west. The area
owes much of its character to its proximity to the adjacent Pennine moors, and the deeply incised,
steep valleys that characterise the transition from moorland to urban area. Agricultural activities
are characterised by stock rearing and rough grazing on improved grassland between urban areas.
The landscape character is identified as suffering from overspill housing estates forming
unsympathetic elements in the landscape. The Natural England National Character Area Profile
(2013) 81 identifies that in recent years new community woodland has been created in the urban
areas. However, there has also been boundary loss and fragmentation around urban fringes, and
80 Natural England (2014) National Character Area Profiles -. Manchester Conurbation. Available from https://www.gov.uk/government/publications/national-character-area-profiles-data-for-local-decision-making/national-character-area-profiles#ncas-in-north-west-england [Accessed January 2017]. 81 Natural England (2013) National Character Area Profiles - Manchester Pennine Fringe. Available from https://www.gov.uk/government/publications/national-character-area-profiles-data-for-local-decision-making/national-character-area-profiles#ncas-in-north-west-england [Accessed January 2017].
82 © Amec Foster Wheeler Environment & Infrastructure UK Limited
March 2017 Doc Ref. bri005ir
loss of more traditional land management to horsiculture. Much of the area has high recreational
use from the adjacent urban areas and there is evidence of the diversification of farming into a
range of urban related uses.
3.17.4 The Dark Peak NCA covers the area in the east of the Borough. This NCA is characterised by
large-scale sweeping moorlands, in-bye pastures enclosed by drystone walls, and gritstone
settlements, within the Pennine chain. It forms a large part of the Peak District National Park
although no part of the Borough itself falls within the National Park boundary. A characteristic
feature of the NCA are the views towards (and from) the surrounding urban conurbations of
Manchester, Sheffield and West Yorkshire. The views into and out from the NCA provide a clear
illustration of the way in which this NCA ‘fits into’ the surrounding countryside and directly links to
nearby centres of population. The Natural England National Character Area Profile (2015) 82 shows
that between 2000 and 2009, there was very little change in the total number of farms in the NCA
(a decrease of 2%). Historic farm buildings remain a cause for concern (due to the large number
that may be under threat of inappropriate development or neglect) but overall the character has
been maintained. The Countryside Quality Counts data indicates that there has been a significant
increase in the amount of eligible woodland covered by Woodland Grant Schemes (WGS) and
there have been small amounts of planting of new woodland or replanting of woodland within the
NCA.
Landscape and Other Designations
3.17.5 There are no national landscape designations affecting the Borough although the eastern boundary
of the local authority area neighbours the Peak District National Pak. A significant proportion of
land is designated as Green Belt (see Figure 3.29), principally around settlements in the north,
east and south of the Borough. The Greater Manchester Green Belt was originally designated in
1984 and the Tameside UDP (2004) defines its extent within the Borough. Green Belt monitoring
returns to CLG show that the Green Belt covered 5,072 ha of the Borough (approximately 49% of
the land area) as at March 201683. There has been no change in the extent of Green Belt over the
course of the publication of monitoring information by CLG (the earliest information available is
from 2007).
82 Natural England (2015) National Character Area Profiles – Dark Peak. Available from https://www.gov.uk/government/publications/national-character-area-profiles-data-for-local-decision-making/national-character-area-profiles#ncas-in-north-west-england [Accessed January 2017]. 83 CLG Green Belt statistics. Available via: https://www.gov.uk/government/collections/green-belt-statistics [Accessed January 2017].

83 © Amec Foster Wheeler Environment & Infrastructure UK Limited
March 2017 Doc Ref. bri005ir
Figure 3.28 National Character Areas

84 © Amec Foster Wheeler Environment & Infrastructure UK Limited
March 2017 Doc Ref. bri005ir
Figure 3.29 Green Belt and Managed Greenspace

85 © Amec Foster Wheeler Environment & Infrastructure UK Limited
March 2017 Doc Ref. bri005ir
3.17.6 There are a number of locally designated green spaces in the Borough. These spaces are
protected under saved Policy OL4 of the UDP.
Urban Landscapes
3.17.7 The Greater Manchester Urban Historic Landscape Characterisation Tameside District Report
(2011)84 notes that urbanisation is especially marked towards the west of the Borough and
impressive 19th Century urban landscapes remain well preserved in many of Tameside’s towns.
The Report notes that the 20th Century saw a distinct move away from dense terraced streets with
the construction of larger properties set back from the highway along curving streets and large
areas of planned post-war housing. The terraced housing and suburban domestic architecture of
the 19th and 20th centuries survives well, creating the distinctive urban grain across the Borough.
Likely Evolution of the Baseline Without the Local Plan
3.17.8 Whilst national planning policy set out in the NPPF, the Draft GMSF and guidance in SPDs would
continue to offer some protection and guidance, there is the potential that development could be
inappropriately sited and designed without an up-to-date policy framework. This could adversely
affect the landscape and townscape character of the area and, further, opportunities may not be
realised to enhance landscape and townscape character through, for example, the provision of
green infrastructure or the adoption of high quality design standards which reflect local character.
3.17.9 The Draft GMSF includes proposals to amend Green Belt boundaries in the Borough through a
number of emerging strategic allocations for residential and employment development in current
Green Belt locations. Changes to the current Green Belt are therefore expected to take place to
some degree irrespective of the Local Plan.
Key Issues
The need to conserve and enhance Tameside’s distinctive landscape and townscape
character.
The need to promote high quality design that respects local character.
The need to maximise opportunities associated with new development to enhance
townscape character and the quality of urban environments.
Links across the Integrated Assessment
3.17.10 Landscape and townscape cuts across a number of social, economic and environmental themes.
The landscapes and townscapes of the Borough contribute towards making Tameside an attractive
place for people to live, work and invest thereby supporting housing and employment delivery.
3.17.11 Well designed and usable public spaces and landscapes can provide health benefits and contribute
towards social inclusion for the Borough’s communities. Landscapes and green spaces can also
contribute towards water management by providing areas for water storage whilst also helping to
mitigate the effects of climate change.
84 The Greater Manchester Archaeological Unit et al (2011) Greater Manchester Urban Historic Landscape Characterisation Tameside District Report. Available from http://archaeologydataservice.ac.uk/archiveDS/archiveDownload?t=arch-1145-1/dissemination/pdf/Tameside.pdf [Accessed January 2017].

86 © Amec Foster Wheeler Environment & Infrastructure UK Limited
March 2017 Doc Ref. bri005ir
3.18 Summary of Key Sustainability, Health and Equality Issues
3.18.1 From the analysis of the baseline presented in the preceding sections, a number of key
sustainability, health and equality issues affecting the Borough have been identified. These issues
are summarised in Table 3.28.
Table 3.28 Summary of Key Sustainability, Health and Equality Issues
Topic Key Sustainability, Health and Equality Issues
Population and Demographics The need to meet future requirements for housing including for a mix of accommodation types and tenures.
The need to meet the needs of an ageing population.
The need to ensure that the needs of different ethnic groups are met and that community cohesion is fostered.
Housing The need to provide an adequate supply of land for housing to meet the requirements set out in the GMSF.
The need to ensure the delivery of an appropriate range of housing types and tenures to meet local needs.
The need to make best use of, and where appropriate improve, the quality of the existing housing stock including bringing empty properties back into use.
The need to address homelessness in the Borough.
The need to make appropriate provision for Gypsies, Travellers and Travelling Showpeople.
Economy The need to provide sufficient employment land in locations well served by transport and other infrastructure and in locations attractive to the market, particularly in the key growth sectors.
The need to facilitate the growth of an appropriately educated and skilled workforce.
The need to support the development of innovative and knowledge-based businesses.
The need to support the growth and development of existing businesses.
The need to increase local employment opportunities.
The need to support the expansion of the manufacturing sector.
The need to maintain and enhance the vitality and viability of the Borough's town centres.
Health and Wellbeing The need to enhance the health and wellbeing of Tameside's population.
The need to tackle inequalities in health.
The need to ensure appropriate open space provision across Tameside.
The need to reduce crime levels, minimise risk and increase community safety.
The need to ensure appropriate health care facilities and services are available and accessible to meet needs arising from new development and anticipated population growth.
The need to plan for an ageing population.
Education and Skills The need to raise educational attainment and skills.
The need to ensure that educational facilities meet the changing demands of the population and the economy.
Deprivation The need to address the many causes of deprivation within the Borough.
The need to specifically tackle deprivation and promote regeneration in the Borough's most deprived communities.
The need to promote social inclusion and reduce inequality.
Transport and Accessibility The need to ensure timely investment in transport infrastructure and services to accommodate anticipated growth.
The need to support proposals contained in the TFGM Greater Manchester Transport Strategy 2040 and those identified by Highways England to address highways capacity issues in the Borough.
The need to capitalise on the Borough's good transport accessibility links to Manchester Airport and the proposed transport interchange and potential new Droylsden railway station.
The need to encourage alternative modes of transport to the private car.
The need to ensure that new development is accessible to community facilities and services and jobs so as to reduce the need to travel.
The need to encourage walking and cycling.
The need to protect and enhance the PRoW network in the Borough.
87 © Amec Foster Wheeler Environment & Infrastructure UK Limited
March 2017 Doc Ref. bri005ir
Topic Key Sustainability, Health and Equality Issues
Biodiversity and Green Infrastructure
The need to conserve and enhance biodiversity including sites with international, national and local designations for their nature conservation value.
The need to maintain, restore and expand, where appropriate, the Borough's priority habitats.
The need to recognise the key role that green infrastructure plays in supporting wellbeing and climate change resilience.
The need to enhance the green infrastructure network, ensuring adequate provision, improving accessibility and encouraging multiple uses where appropriate.
Land Use, Geology and Soil The need to encourage development on previously developed (brownfield) land.
The need to make best use of existing buildings and infrastructure.
The need to protect the limited areas of best and most versatile agricultural land in the Borough from inappropriate development.
The need to protect and enhance sites designated for their geological interest.
Water The need to protect and enhance the quality of the Borough's water resources.
The need to promote the efficient use of water resources.
The need to ensure the timely provision of new water services infrastructure to meet demand arising from new development.
The need to locate new development away from areas of flood risk, taking into account the effects of climate change.
The need to encourage the use of Sustainable Drainage Systems.
The need to appropriately manage surface water.
Air Quality The need to minimise the emission of pollutants to air.
The need to improve air quality, particularly in the Greater Manchester AQMA.
Climate Change The need to ensure that new development is able to adapt to the effects of climate change.
The need to mitigate climate change including through increased renewable energy provision.
The need to contribute to the Greater Manchester target of reducing CO2 emissions by 48% by 2020.
Material Assets The need to minimise waste arisings and encourage reuse and recycling.
The need to promote the efficient use of mineral resources, recognising that the Greater Manchester area is reliant on minerals won in other MPAs.
The need to ensure the protection of the Borough's mineral resources in accordance with the Great Manchester Joint Minerals Plan (2013).
The need to promote resource efficiency through sustainable design and construction techniques to minimise resource depletion and waste creation.
Cultural Heritage The need to protect and enhance Tameside's cultural heritage assets, including industrial heritage assets, and their settings.
The need to avoid harm to designated heritage assets and their settings.
The need to recognise the value of non-designated heritage assets where appropriate.
The need to tackle heritage at risk.
The need to recognise the positive contribution made by the historic environment to the character of landscapes and townscapes.
Landscape and Townscape The need to conserve and enhance Tameside's distinctive landscape and townscape character.
The need to promote high quality design that respects local character.
The need to maximise opportunities associated with new development to enhance townscape character and the quality of urban environments.

88 © Amec Foster Wheeler Environment & Infrastructure UK Limited
March 2017 Doc Ref. bri005ir
4. Integrated Assessment Approach
4.1 Introduction
4.1.1 This section describes the proposed approach to the IA of the Local Plan. In particular, it draws on
the information contained in Sections 2 and 3 to develop the assessment framework (the IA
Framework) and sets out how this framework will be used to support the assessment of the key
components of the Local Plan (including reasonable alternatives).
4.2 Integrated Assessment Framework
4.2.1 Establishing appropriate IA objectives and guide questions is central to assessing the
sustainability, health and equality effects of the Local Plan. Broadly, the IA objectives define the
long term aspirations for the Borough with regard to social (including health and equality),
economic and environmental considerations and it is against these objectives that the performance
of Local Plan proposals will be assessed.
4.2.2 Table 4.1 presents the proposed IA Framework including IA objectives and associated guide
questions to be used in the assessment of the Local Plan. The IA objectives and guide questions
have been informed by:
the topics contained in Annex I of the SEA Directive (shown in the third column in Table 4.1):
the determinants of health (see Section 1.4);
the equality considerations set out in the Equality Act 2010 (see Section 1.4);
the review of plans and programmes and the associated key policy objectives and messages
(see Section 2); and
the baseline information and key sustainability, health and equality issues (see Section 3).
4.2.3 Consideration has also been given to the framework developed as part of the GMSF Integrated
Assessment and to the objectives and criteria that comprised the SA Framework developed in
support of the SA of the Joint Core Strategy and Development Management Policies DPD.
Table 4.1 Proposed IA Framework
IA Objective Guide Questions
Will the Local Plan…
SEA Directive
Topic(s)
1. Housing: To provide a sustainable supply of housing land and an appropriate mix of sizes, types and tenures to meet housing need.
Meet the Borough’s objectively assessed housing need (consistent with the requirements of the Greater Manchester Spatial Framework), providing a range of housing types, tenures and sizes to meet current and emerging need for market and affordable housing?
Reduce homelessness?
Reduce the number of unfit homes?
Make best use of the Borough’s existing housing stock?
Help to ensure the provision of good quality, well designed homes?
Ensure housing land is well-connected with employment land, centres and green space or co-located where appropriate?
Deliver pitches/plots required for Gypsies, Travellers and Travelling Showpeople?
Population
2. Economy and Employment: To promote sustainable economic growth and job creation.
Provide a balanced supply of flexible, good quality employment land to meet the needs of the Borough’s existing businesses and to attract inward investment, consistent with
Population

89 © Amec Foster Wheeler Environment & Infrastructure UK Limited
March 2017 Doc Ref. bri005ir
IA Objective Guide Questions
Will the Local Plan…
SEA Directive
Topic(s)
the requirements of the Greater Manchester Spatial Framework?
Help to diversify the local economy and support the delivery of the Greater Manchester Growth and Reform Plan and Manufacturing Strategy and the New Economic Strategy for Tameside?
Provide good quality, well paid employment opportunities that meet the needs of local people?
Increase average income levels?
Improve the physical accessibility of jobs?
Promote a low carbon economy?
Maintain and enhance the vitality and viability of the Borough’s towns?
Create jobs in high knowledge sectors?
3. Transport and Communications: To reduce the need to travel, promote sustainable modes of transport and ensure that there is sufficient coverage and capacity of transport and utilities to support growth and development.
Reduce travel demand and the distance people travel for jobs, employment, leisure and services and facilities?
Encourage a shift to more sustainable modes of transport?
Encourage walking and cycling?
Help to manage traffic congestion?
Deliver investment in the Borough’s transportation infrastructure and support proposals identified in the Greater Manchester Transport Strategy 2040?
Help to develop a safe transport network that minimises the impact on the environment and public health?
Reduce the level of freight movement by road?
Improve transport connectivity?
Ensure that utilities / digital infrastructure can support growth?
Population Human Health Air
4. Regeneration: To promote regeneration and tackle levels of deprivation and disparity.
Ensure appropriate provision of community facilities and services?
Enhance accessibility to key community facilities and services?
Tackle deprivation in the Borough’s most deprived areas and reduce inequalities?
Support reductions in poverty (including child and fuel poverty), deprivation and disparity across the domains of the Indices of Multiple Deprivation?
Contribute to regeneration initiatives including in the proposed Eastern Gateway?
Promote participation in cultural activities?
Enhance the public realm?
Support rural regeneration?
Population Human Health
5. Equality and Social Inclusion: To promote equality of opportunity and the elimination of discrimination.
Foster good relations between different people?
Improve people’s perception of their local area as being a place where people from different ethnic backgrounds get on well together?
Create a sense of belonging and wellbeing for all members of the community?
Ensure equality of opportunity and equal access to facilities and infrastructure for all?
Appropriately consider ‘protected characteristics’ groups, as defined in the Equality Act 2010?
Ensure that the needs of different areas (namely urban, suburban, urban fringe and rural) are equally addressed?
Population Human Health
6. Health and Wellbeing: To improve health and wellbeing and reduce health inequalities.
Avoid locating development in locations that could adversely affect people’s health?
Reduce death rates and negative health impacts in key vulnerable groups?
Ensure adequate provision of, and access to, green infrastructure, open space, leisure and recreational facilities?
Enhance the opportunities for physical activity?
Improve access to healthcare facilities and services?
Reduce health inequalities?
Meet the needs of the elderly?
Population Human Health

90 © Amec Foster Wheeler Environment & Infrastructure UK Limited
March 2017 Doc Ref. bri005ir
IA Objective Guide Questions
Will the Local Plan…
SEA Directive
Topic(s)
Support those with disabilities?
Promote community safety?
Reduce actual levels of crime and anti-social behaviour?
Reduce the fear of crime?
Promote design that discourages crime?
Align healthcare facilities and services with growth?
Help to improve mental health and wellbeing?
Improve living conditions?
Support the aims and objectives of the Greater Manchester Mental Health and Wellbeing Strategy, Tameside and Glossop Mental Wellbeing Strategy and Our Life in Tameside?
7. Education and Skills: To improve educational attainment and skills for all.
Improve access to training to raise employment potential?
Promote investment in the Borough’s educational establishments?
Improve education levels of children, regardless of their background?
Improve educational and skill levels of the population of working age?
Provide access to work experience, apprenticeships and training?
Support the priorities of the Greater Manchester Work and Skills Strategy?
Population Human Health
8. Air Quality: To improve air quality. Maintain and improve air quality, particularly within the Greater Manchester Combined Authority Air Quality Management Area?
Avoid locating development in areas of existing poor air quality?
Minimise emissions to air from new development?
Air Human Health
9. Biodiversity and Geodiversity: To conserve and enhance biodiversity and geodiversity.
Conserve and enhance European designated nature conservation sites?
Conserve and enhance nationally designated nature conservation sites such as Sites of Special Scientific Interest?
Conserve and enhance Local Nature Reserves and Sites of Biological Importance?
Conserve and enhance species diversity, and in particular avoid harm to indigenous species of principal importance, or priority species and habitats?
Enhance ecological connectivity, providing green spaces that are well connected and biodiversity rich?
Maintain and enhance woodland cover?
Avoid damage to, and protect, Regionally Important Geological Sites (as they are designated)?
Provide opportunities for people to access the natural environment including green and blue infrastructure?
Enhance the resilience of the natural environment to the impacts of climate change?
Biodiversity, Fauna and Flora Human Health
10. Climate Change: To minimise greenhouse gas emissions and ensure communities, developments and infrastructure are resilient to the effects of expected climate change.
Minimise energy use and reduce or mitigate greenhouse gas emissions?
Plan for adaptation measures for the likely effects of climate change?
Support the delivery of renewable and low carbon energy in the Borough and reduce dependency on non-renewable sources?
Ensure that communities, existing and new developments and infrastructure systems are resilient to the predicted effects of climate change?
Climatic Factors
11. Flood Risk: To minimise flood risk and reduce the impact of flooding to people and property, taking into account the effects of climate change.
Help to minimise the risk of flooding to existing and new developments/infrastructure?
Ensure that development does not unacceptably increase flood risk?
Climatic Factors Water

91 © Amec Foster Wheeler Environment & Infrastructure UK Limited
March 2017 Doc Ref. bri005ir
IA Objective Guide Questions
Will the Local Plan…
SEA Directive
Topic(s)
Ensure adequate measures are in place to manage existing flood risk?
Restrict inappropriate development in areas at risk from flooding?
Deliver sustainable urban drainage systems and promote investment in flood defences that reduce vulnerability to flooding?
Ensure development is appropriately future proof to accommodate future levels of flood risk including from climate change?
12. Water: To protect and improve the quality and availability of water resources.
Help to achieve the objective of good status under the Water Framework Directive?
Promote management practices that will protect surface and ground water from pollution?
Reduce water consumption and encourage water efficiency?
Ensure that new water/wastewater management infrastructure is delivered to support new development?
Water
13. Cultural Heritage: To conserve and enhance the Borough’s historic environment, cultural heritage, character and setting.
Help to conserve and enhance existing features of the historic built environment and their settings, including archaeological assets?
Reduce the instances and circumstances where heritage assets are identified as being ‘at risk’?
Promote sustainable repair and reuse of heritage assets?
Protect or enhance the significance of designated heritage assets?
Protect or enhance the significance of non-designated heritage assets?
Help to conserve historic buildings, places and spaces that enhance local distinctiveness, character and appearance through sensitive adaptation and re-use?
Provide opportunities for people to value and enjoy the Borough’s cultural heritage?
Improve and promote access to buildings of historic/cultural value?
Encourage heritage-led regeneration?
Cultural Heritage
14. Landscape and Townscape: To conserve and enhance the Borough’s landscape character and townscapes.
Conserve and enhance the Borough’s landscape character and townscapes?
Promote high quality design in context with its urban and rural landscape?
Protect and enhance visual amenity?
Improve the character of open spaces and the public realm?
Landscape
15. Land Use and Soils: To encourage the efficient use of land and conserve and enhance soils.
Promote the use of previously developed (brownfield) land and minimise the loss of greenfield land?
Avoid the loss of agricultural land including best and most versatile land?
Make best use, and reduce the amount, of derelict, degraded and underused land in the Borough?
Encourage the reuse of existing buildings and infrastructure?
Prevent land contamination and facilitate remediation of contaminated sites?
Maintain and enhance soil quality?
Soil Material Assets
16. Resource Use and Waste: To encourage sustainable resource use and promote the waste hierarchy (reduce, reuse, recycle, recover).
Support the objectives and proposals of the Greater Manchester Joint Minerals Plan?
Minimise the demand for raw materials and assist in maximising the use of recycled and secondary materials (including aggregates)?
Promote the use of local resources?
Reduce minerals extracted and imported?
Increase efficiency in the use of raw materials and promote recycling?
Avoid sterilisation of mineral reserves?
Material Assets
92 © Amec Foster Wheeler Environment & Infrastructure UK Limited
March 2017 Doc Ref. bri005ir
IA Objective Guide Questions
Will the Local Plan…
SEA Directive
Topic(s)
Support the objectives and proposals of the Greater Manchester Joint Waste Development Plan Document?
Assist or facilitate compliance with the waste hierarchy (i.e. reduce first, then reuse, recycle and recover)?
4.2.4 Table 4.2 shows the extent to which the IA objectives encompass the range of issues identified in
the SEA Directive.
Table 4.2 Coverage of the SEA Directive Topics by the IA Objectives
SEA Directive Topic IA Objective(s)
Biodiversity 9, 12
Population * 1, 2, 3, 4, 5, 6 and 7
Human Health 4, 6, 8, 9, 11, 12,
Fauna 9, 12
Flora 9, 12
Soil 9, 15
Water 11, 12
Air 3, 8
Climatic Factors 8, 10, 11
Material Assets * 15, 16
Cultural Heritage including architectural and archaeological heritage
13
Landscape 14
* These terms are not clearly defined in the SEA Directive.
4.3 Methodology
4.3.1 Based on the scope of the Local Plan detailed in Section 1.3, it is envisaged that the IA
Framework set out in Table 4.1 will be used to assess the following key components of the Plan
(and reasonable alternatives where these exist):
Vision and Objectives;
Spatial Strategy (in respect of the distribution of development);
Plan Policies; and

93 © Amec Foster Wheeler Environment & Infrastructure UK Limited
March 2017 Doc Ref. bri005ir
Site Allocations.
4.3.2 The proposed approach to the assessment of each of the Plan components listed above is set out
in the sub-sections that follow.
Vision and Objectives
4.3.3 It is important that the vision and objectives of the Local Plan are aligned with the IA objectives.
The Local Plan vision and objectives will therefore be assessed for their compatibility with the
objectives that comprise the IA Framework to help establish whether the general approach to the
Plan is in accordance with the principles of sustainability. A compatibility matrix will be used to
record the assessment similar to that presented in Table 4.3.
Table 4.3 Compatibility Matrix
IA Objective
Local Plan Vision/Objective V
isio
n
Ob
jec
tiv
e 1
Ob
jec
tiv
e 2
Ob
jec
tiv
e
3..
.etc
.
1. Housing: To provide a sustainable supply of housing land and an appropriate mix of sizes, types and tenures to meet housing need.
+ 0 + ?
2. Economy and Employment: To promote sustainable economic growth and job creation. + - + +
3. Etc... + 0 + ?
Key
+ Compatible ? Uncertain
0 Neutral - Incompatible
Spatial Strategy
4.3.4 The Local Plan will set out the spatial strategy for the Borough in terms of the broad distribution of
future development. The spatial strategy, including reasonable alternatives, will be assessed
against each of the IA objectives that comprise the IA Framework using an assessment matrix.
The matrix will include:
the IA objectives;
a score indicating the nature of the effect for each spatial strategy option;
a commentary on significant effects (including consideration of the cumulative, synergistic
and indirect effects as well as the geography, duration, temporary/permanence and
likelihood of any effects) and on any assumptions or uncertainties; and
recommendations, including any mitigation or enhancements measures.
4.3.5 The format of the matrix that will be used to assess the effects of the spatial strategy and
reasonable alternatives is shown in Table 4.4. A qualitative scoring system will be used which is

94 © Amec Foster Wheeler Environment & Infrastructure UK Limited
March 2017 Doc Ref. bri005ir
set out in Table 4.5 and to guide the assessment, specific definitions have been developed for
what constitutes a significant effect, a minor effect or a neutral effect for each of the 16 IA
objectives; these can be found in Appendix D.
Table 4.4 Proposed Assessment Matrix – Spatial Strategy
Table 4.5 Proposed Scoring System
Score Description Symbol
Significant Positive Effect
The proposed option/policy contributes significantly to the achievement of the objective. ++
Minor Positive Effect The proposed option/policy contributes to the achievement of the objective but not
significantly. +
Neutral The proposed option/policy does not have any effect on the achievement of the objective 0
Minor Negative Effect
The proposed option/policy detracts from the achievement of the objective but not significantly. -
Significant Negative Effect
The proposed option/policy detracts significantly from the achievement of the objective. --
No Relationship There is no clear relationship between the proposed option/policy and the achievement of the objective or the relationship is negligible. ~
Uncertain The proposed option/policy has an uncertain relationship with the objective or the relationship is dependent on the way in which the aspect is managed. In addition, insufficient information may be available to enable an assessment to be made.
?
IA Objective Option 1 Option 2 Option 3
1. Housing: To provide a sustainable supply of housing land and an appropriate mix of sizes, types and tenures to meet housing need.
Likely Significant Effects
A description of the likely effects of each option on the IA Objective will be been provided here.
Mitigation
Mitigation and enhancement measures will be outlined here.
Assumptions
Any assumptions made in undertaking the assessment will be listed here.
Uncertainties
Any uncertainties encountered during the assessment will be listed here.
Likely Significant Effects
Etc..
Mitigation
Etc..
Assumptions
Etc..
Uncertainties
Etc..
Likely Significant Effects
Etc..
Mitigation
Etc..
Assumptions
Etc..
Uncertainties
Etc..
- + --
95 © Amec Foster Wheeler Environment & Infrastructure UK Limited
March 2017 Doc Ref. bri005ir
Policies
4.3.6 The policies of the Local Plan will also be assessed using the IA Framework. The assessment will
be undertaken by plan chapter/section with a score awarded for each constituent policy and for the
cumulative effects of all policies contained in each respective chapter/section. Commentary will be
provided including any mitigation or enhancements measures to enhance the performance of the
policies (for example, amendments to policy wording). As with the assessment of the spatial
strategy, the definitions of significance outlined in Appendix D will be used to guide the
assessment.
4.3.7 The findings of the assessment will be presented in a matrix similar to that shown in Table 4.6 and
will use the same scoring mechanism as that presented in Table 4.5.
Table 4.6 Proposed Appraisal Matrix – Policies
IA Objective Policy Cumulative effect of the draft policies
Commentary on effects of each policy
Policy H1
Policy H2
Policy H3
Etc.
1. Housing: To provide a sustainable supply of housing land and an appropriate mix of sizes, types and tenures to meet housing need.
++ ++ ++ 0 ++
Likely Significant Effects
A description of the likely effects of the policies on the IA Objective will be provided here, drawing on baseline information as appropriate.
Mitigation
Mitigation and enhancement measures will be outlined here.
Assumptions
Any assumptions made in undertaking the assessment will be listed here.
Uncertainties
Any uncertainties encountered during the assessment will be listed here.
Site Allocations
4.3.8 Potential site allocation options will be assessed against the IA objectives that comprise the IA
Framework using tailored assessment criteria with associated thresholds of significance to
determine the type and magnitude of effect against each IA objective. In the interests of
transparency, the proposed assessment criteria is set out in Table 4.7 to enable interested parties
to provide early comment.
Table 4.7 Proposed Site Assessment Criteria
IA Objective Assessment Criteria Threshold Score 1. Housing: To provide a sustainable supply of housing land and an appropriate mix of sizes, types and tenures to meet housing need.
Number of (net) new dwellings proposed/loss of dwellings.
100+ dwellings (3ha or more). ++
1 to 99 dwellings (up to 2.9ha). +
0 dwellings. 0
-1 to -99 dwellings (-2.9ha or more).
-

96 © Amec Foster Wheeler Environment & Infrastructure UK Limited
March 2017 Doc Ref. bri005ir
IA Objective Assessment Criteria Threshold Score
-100+ dwellings (-3ha or more). --
2. Economy and Employment: To promote sustainable economic growth and job creation.
Net employment land provision/loss.
1ha+ of land. ++
0.1ha to 0.99ha of land. +
0ha 0
-01ha to -0.99ha of land. -
-1ha+ of land. --
Proximity to key employment sites.
Within 2,000m walking distance of a major employment site.
+
In excess of 2,000m walking distance of a major employment site.
0
3. Transport and Communications: To reduce the need to travel, promote sustainable modes of transport and ensure that there is sufficient coverage and capacity of transport and utilities to support growth and development.
Access to: -bus stops -railway stations -Metrolink stations
Within 400m walking distance of all services.
++
Within 400m or more of one or more services.
+
In excess of 400m from all services.
-
Impact on highway network. Potential significant positive impact on the highway network.
++
Potential positive impact on the highway network.
+
No impact on highway network. 0
Potential adverse impact on highway network.
-
Potential significant adverse impact on highway network.
--
4. Regeneration: To promote regeneration and tackle levels of deprivation and disparity.
Walking distance to key services including:
-GP surgeries
-Primary schools
-Secondary schools
-Post Offices
-Supermarkets
Proximity to town centres.
Within 800m walking distance of all services and/or a town centre.
++
Within 800m of one or more key services and/or within 2,000m of all services/a town centre.
+
Within 2,000m of a key service. 0
In excess of 2,000m from all services/a town centre.
-
Provision of community facilities and services.
Development would provide key services and facilities on site.
++
Development would contribute to the provision of additional services and facilities.
+
Development would not provide or result in the loss of key services and facilities.
0

97 © Amec Foster Wheeler Environment & Infrastructure UK Limited
March 2017 Doc Ref. bri005ir
IA Objective Assessment Criteria Threshold Score
Development would not contribute to the provision of additional services and facilities and would increase pressure on existing services and facilities.
-
Development would result in the loss of key services and facilities without appropriate mitigation.
--
5. Equality and Social Inclusion: To promote equality of opportunity and the elimination of discrimination.
Proximity to deprived areas. Within 10% most deprived Lower Layer Super Output Areas (LSOA) nationally.
++
Within 20% most deprived LSOAs nationally.
+
Not located within 10% or 20% most deprived LSOAs nationally.
0
6. Health and Wellbeing: To improve health and wellbeing and reduce health inequalities.
Access to: -GP surgeries -open space (including sports and recreational facilities)
Within 800m walking distance of a GP surgery and open space.
++
Within 800m of a GP surgery or open space.
+
Within 2,000m of a GP surgery or open space.
0
In excess of 2,000m from a GP surgery and/or open space.
-
Provision of open space or health facilities.
Would provide open space and/or health facilities on site.
++
Development would contribute to the provision of additional open space and/or health facilities.
+
Would not affect current provision of open space or health facilities.
0
Development would not contribute to the provision of additional open space and/or health facilities and would increase pressure on existing open space and/or health facilities.
-
Would result in the loss of open space and/or health facilities without appropriate mitigation.
--
Neighbouring uses. Not located in close proximity to unsuitable neighbouring uses.
0
Located in close proximity to unsuitable neighbouring uses and which could have an adverse effect on human health.
-
Located in close proximity to unsuitable neighbouring uses and which could have a
--

98 © Amec Foster Wheeler Environment & Infrastructure UK Limited
March 2017 Doc Ref. bri005ir
IA Objective Assessment Criteria Threshold Score significant adverse effect on human health.
7. Education and Skills: To improve educational attainment and skills for all.
Access to: -primary schools -secondary schools/further education/training establishments
Within 800m walking distance of all educational facilities.
++
Within 800m of a primary school and/or 2,000m from a secondary school.
+
Within 2,000m of a primary school.
0
In excess of 2,000m from all educational facilities.
-
Provision of educational facilities.
Development would provide additional educational facilities on site.
++
Development would contribute to the provision of educational facilities.
+
Development would not provide or result in the loss of educational facilities.
0
Development would not contribute to the provision of additional educational facilities and would increase pressure on existing educational facilities.
-
Development would result in the loss of educational facilities, without appropriate mitigation.
--
8. Air Quality: To improve air quality.
Proximity to the Greater Manchester Combined Authority Air Quality Management Area (AQMA)
In excess of 500m of the
AQMA. 0
Within 500m of the AQMA. -
Within the AQMA. --
9. Biodiversity and Geodiversity: To conserve and enhance biodiversity and geodiversity.
Enhancement of habitats, species and green infrastructure.
Development would have a positive effect on European or national designated sites, habitats or species / create new habitat or significantly improve existing habitats / significantly enhance the Borough’s green infrastructure network.
++
Development would have a positive effect on regional or local designated sites, habitats or species / improve existing habitats / enhance the Borough’s green infrastructure network.
+
Proximity to:
-statutory international/national nature conservation designations (SAC, SPA, SSSI, Ancient Woodland);
No designations affecting site. 0
Within 100m of a locally designated site (including RIGS)/Within 500m from an international/national site.
-

99 © Amec Foster Wheeler Environment & Infrastructure UK Limited
March 2017 Doc Ref. bri005ir
IA Objective Assessment Criteria Threshold Score -local nature conservation designations (Local Nature Reserves and Sites of Biological Importance);
-Regionally Important Geological Site (RIGS).
Within 100m of a statutory designated site.
--
Presence of Greater Manchester Biodiversity Action Plan (BAP) habitat.
Does not contain BAP habitat. 0
Contains BAP habitat. --
10. Climate Change: To minimise greenhouse gas emissions and ensure communities, developments and infrastructure are resilient to the effects of expected climate change.
It has not been possible to identify specific site level criteria for this IA objective.
N/A.
N/A
11. Flood Risk: To minimise flood risk and reduce the impact of flooding to people and property, taking into account the effects of climate change.
Presence of Environment Agency Flood Zones.
Within Flood Zone 1. 0
Within Flood Zone 2. -
Within Flood Zone 3a/b. --
12. Water: To protect and improve the quality and availability of water resources.
Proximity to waterbordies In excess of 50m of a waterbody.
0
Within 10-50m of a waterbody. -
Within 10m of a waterbody. --
Requirement for new or upgraded water management infrastructure.
No requirement to upgrade water management infrastructure.
0
Requirement to upgrade water management infrastructure.
--
13. Cultural Heritage: To conserve and enhance the Borough’s historic environment, cultural heritage, character and setting.
Effects on designated heritage assets.
Development offers the potential to significantly enhance designated heritage assets or their settings.
++
Development offers the potential to enhance designated heritage assets or their settings.
+
Development is unlikely to affect heritage assets or their settings.
0
Development may have an adverse effect on designated heritage assets and/or their settings.
-
Development may have a significant adverse effect on a designated heritage assets or their settings.
--
14. Landscape and Townscape: To conserve and enhance the Borough’s landscape character and townscapes.
Effects on landscape character.
Development offers potential to significantly enhance landscape/townscape character
++
Development offers potential to enhance landscape/townscape character
+
100 © Amec Foster Wheeler Environment & Infrastructure UK Limited
March 2017 Doc Ref. bri005ir
IA Objective Assessment Criteria Threshold Score
Development is unlikely to have an effect on landscape character.
0
Development may have an adverse effect on landscape character.
-
Development may have a significant adverse effect on landscape character.
--
15. Land Use and Soils: To encourage the efficient use of land and conserve and enhance soils.
Development of brownfield / greenfield/ mixed land
Development of agricultural land including best and most versatile agricultural land (Agricultural Land Classification (ALC) grades 1, 2 and 3)).
Previously developed (brownfield) land.
++
Mixed greenfield/brownfield land.
+/-
Greenfield (not in ALC Grades 1, 2 or 3).
-
Greenfield (in ALC Grade 1, 2 or 3).
--
16. Resource Use and Waste: To encourage sustainable resource use and promote the waste hierarchy (reduce, reuse, recycle, recover).
Development in Joint Minerals Plan Minerals Safeguarding Areas/Areas of Search.
Outside a Minerals Safeguarding Area/Area of Search.
0
Within a Minerals Safeguarding Area/Area of Search.
--
Development within/including waste management facilities/Joint Waste Local Plan allocations.
Site does not include a waste management facility/allocation.
0
Sites includes a waste management facility/allocation.
--
Secondary, Cumulative and Synergistic Effects
4.3.9 The policies and proposals of the Local Plan will not sit in isolation from each other. They will work
together to achieve the objectives of the Plan. For this reason, it is important to understand what
the combined sustainability, health and equality effects of the policies and proposals will be.
4.3.10 As noted above, the assessment of the plan policies will be undertaken by plan chapter in order to
determine the cumulative effects of each policy area. Throughout the assessment matrices,
reference will also be made to where cumulative effects could occur. In addition to the inclusion of
cross reference between the policy themes, an assessment of cumulative effects will be
undertaken in order to clearly identify areas where policies and proposals work together. Additional
commentary will be provided where the Local Plan may have effects in-combination with other
plans and programmes such as the GMSF, neighbouring authority development plans and United
Utilities’ WRMP.
4.4 EqIA and HIA Screening
4.4.1 EqIA screening will be undertaken using the Council’s Equality Impact Assessment template which
is contained at Appendix E to this report. Additionally, the DOH HIA screening framework will be
completed (see Appendix F). The completion of both screening frameworks will help to identify
where the Local Plan policies and proposals may have impacts in terms of health and equality,
helping to guide and inform the more detailed consideration of these effects through the
assessment of the Local Plan against the objectives that comprise the IA Framework. These
frameworks will be completed for the Local Plan as a whole, rather than separate commentary on
each policy / proposal.

101 © Amec Foster Wheeler Environment & Infrastructure UK Limited
March 2017 Doc Ref. bri005ir
4.5 Difficulties Encountered in Compiling this Scoping Report
4.5.1 No significant difficulties have been encountered in compiling this Scoping Report.

102 © Amec Foster Wheeler Environment & Infrastructure UK Limited
March 2017 Doc Ref. bri005ir
5. Next Steps
5.1.1 The approach set out in Section 4 of this Scoping Report, amended on the basis of consultation
responses where appropriate, will be used to assess the potential effects of the Local Plan. The
assessment will be an iterative process and will involve the development and refinement of the
Local Plan by testing the sustainability, health and equality strengths and weaknesses of the
emerging Plan options.
5.1.2 As set out in Section 1.3, the Council is currently working towards consultation on a Draft Local
Plan which is due to take place between August and September 2017. An interim IA Report will be
published for consultation alongside the Draft Local Plan and will consider the sustainability, health
and equality performance of key plan options and proposals.
5.1.3 Reflecting the requirements of Schedule 2 of the SEA Regulations (which reproduce the SEA
Directive Annex I issues), the IA Reports will consist of:
A Non-Technical Summary;
A chapter setting out the scope and purpose of the assessment and including an overview of
the emerging Local Plan;
A chapter summarising the key objectives of other plans and programmes and socio-
economic (including health and equality) and environmental issues relevant to the Local
Plan;
A chapter setting out the approach to the assessment and any difficulties encountered;
A chapter outlining the likely effects of the implementation of the Local Plan and reasonable
alternatives, including cumulative effects, mitigating measures, uncertainties and risks. This
will include dedicated sections for EqIA and HIA. The reasons for selecting the preferred
Local Plan options and for the rejection of alternatives will be explained;
A chapter presenting views on implementation and monitoring.