integrated bioinformatics and experimental approaches
TRANSCRIPT

Research ArticleIntegrated Bioinformatics and Experimental ApproachesIdentified the Role of NPPA in the Proliferation and theMalignant Behavior of Breast Cancer
Aijun Sun,1,2 Xiaonan Sheng ,3 Jinhai Tang ,1,4 Zhenfeng Yu ,5 and Jian Zhang 4
1The First Clinical Medical College, Nanjing University of Chinese Medicine, Xianlin Road 138, Nanjing 210023, China2Department of Thyroid and Breast Oncological Surgery, Xuzhou Medical College Affiliated Huaian Hospital, Huaihai SouthRoad 62#, Huaian, Jiangsu 223001, China3Renji Hospital, School of Medicine, Shanghai Jiao Tong University, No. 1630 Dongfang Shanghai 200127, China4Department of General Surgery, The First Affiliated Hospital with Nanjing Medical University, Nanjing 210029, China5Department of General Surgery, Shanghai Fengxian Central Hospital, 6600 NanFeng Road, 201499, China
Correspondence should be addressed to Jinhai Tang; [email protected], Zhenfeng Yu; [email protected],and Jian Zhang; [email protected]
Received 19 July 2021; Revised 15 August 2021; Accepted 20 August 2021; Published 27 September 2021
Academic Editor: Jian Song
Copyright © 2021 Aijun Sun et al. This is an open access article distributed under the Creative Commons Attribution License,which permits unrestricted use, distribution, and reproduction in any medium, provided the original work is properly cited.
Breast cancer is the 3rd most common type of malignant tumor worldwide with high heterogeneity, frequent recurrence, and highmetastasis tendency. In this study, we aimed to demonstrate the value of extracellular matrix- (ECM-) related genes in breastcancer patients. The overall expression of ECM is assessed with a novel SC3 clustering method, and patients were divided intotwo clusters with diverse recurrence rate. We established the Cox regression model in breast cancer patients and identifiedNPPA as an independent prognostic marker. The NPPA expression is downregulated in breast cancer patients, independent ofthe ER status, PR status, stemness score, and immune infiltrating condition. And we observed the enhanced proliferation,migration, and invasion potential of breast cancer cells after NPPA depletion. Further, we predicted the transcriptionmodulation of NPPA with PROMO and JASPAR. And we further validated the binding of MZF1 to the -318 bp~-452 bpregion of the NPPA promoter with chromatin immunoprecipitation and dual luciferase assay. Together, our study identifiedNPPA as a potential prognostic biomarker for breast cancer patients, whose downregulation is associated with an enhancedmalignant behavior of breast cancer cells both in vivo and in vitro and identified the transcription regulation of NPPA by MZF1.
1. Introduction
Breast cancer is among the most common types of malignanttumor worldwide and the most common type of malignanttumor in women, accounting for at least half million of deathannually [1]. Breast cancer typically has a high level of hetero-geneity and can be further categorized into multiple subtypeswith respect to variousmolecular and pathological signatures,including Her2 status, estrogen receptor (ER) status, proges-terone receptor (PR) status, and PAM50 features [2, 3]. Likeother types of malignant tumors, early diagnosed breastcancer are largely curable with the combination of primarysurgical approaches and multiple following effective subse-
quential therapies, including chemotherapy, radiotherapy,or targeted therapy [4–6]. However, the high recurrence rateof breast cancer remains a critical barrier for the long-termsurvival of patients. Also, the underlying mechanisms ofrecurrence and distant metastasis are not fully investigated.
Extracellular matrix (ECM) typically includes fibrillarcollagens, fibronectin, specific laminins, proteoglycans, andmatricellular proteins [7]. The extracellular matrix-relatedgenes comprise of at least 555 proteins and are consideredto have a critical influence on the prognosis of cancer [8],whose alteration are closely linked to the invasion andmetastasis of the tumor [9–11], such as brain and lungmetastases [12]. The chemical and biological properties of
HindawiJournal of Immunology ResearchVolume 2021, Article ID 7876489, 17 pageshttps://doi.org/10.1155/2021/7876489

ECM are highly complicated and are delicately modulated inthe tumor microenvironment, including local hypoxia,nutrition deprivation, and the infiltration of immune cells[13–17]. The modeling of cancer ECM by various cell types,such as epithelia and stroma, has been proposed to have aprofound effect on the progression of cancer [18]. Whilemany of the ECM-related genes and their regulation net-work have been identified [19–21], the ECM-related genesin the Gene Ontology (GO) database comprises of as manyas 555 genes, whose biological functions are largelyunknown. Besides, the approaches to modulate ECM inbreast cancer tissues are very limited [8, 21, 22].
NPPA (natriuretic peptide precursor A) belongs to theECM genes in the GO database, whose expression is consid-ered to involve in the familial atrial fibrillation, heart devel-opment, and hypertension [23–25]. However, the functionand expression of NPPA in cancer, such as breast cancer,have not been explored.
The single-cell consensus matrix (SC3) model was pro-posed by Kiselev et al. as a quick and efficient nonmoni-tored clustering method, primarily used in the analysis ofsingle-cell sequencing data [26]. With this method, wecould calculate the eigenvector of each sample with all theexpression genes and effectively distinguish the subclustersof breast cancer patients while identifying the potentialmarkers for each cluster.
Here, in this study, we have analyzed the expression ofall 555 ECM-related genes in the TCGA breast cancer data-base and performed a novel SC3 method to cluster breastcancer patients. We have identified a 49-gene ECM signaturein breast cancer patients and eventually identified NPPA asan independent prognostic marker with the forwardstepwise multivariate Cox regression model. Further, wevalidated the proliferation suppression function of NPPAboth in vivo and in vitro. Lastly, we predicted and validatedthe transcription modulation of NPPA by MZF1, at the-318~-452 bp of the NPPA promoter. Together, our findingsidentified NPPA as a prognostic marker, unveiled the bio-logical function of NPPA, and explored the transcriptionmodulation of NPPA by MZF1, which we believe wouldexpand the horizon for breast cancer treatment.
2. Material and Methods
2.1. Data Collection. mRNA sequencing data, molecularcategories, immunohistochemistry (IHC) staining data, andclinical information of breast cancer patients and othercancer types were obtained from the TCGA BRCA database(https://tcga-data.nci.nih.gov/), Human Protein Atlas(https://www.proteinatlas.org/), IST Online (https://ist.medisapiens.com/), GEO database (https://www.ncbi.nlm.nih.gov/), and GEPIA (http://gepia.cancer-pku.cn/index.html), respectively. The expression pattern of normal breasttissues and paratumor tissues was acquired from the TCGAdatabase, GEO database (GES65261), and GTEx database(https://xenabrowser.net/), respectively.
Stemness score and ssGSEA result from mRNA wereacquired from the TCGA PAN-CANCER database (https://xenabrowser.net/datapages/). Levels of different immune
cells in breast cancer patients were acquired from GEPIA(http://gepia.cancer-pku.cn/index.html).
Telomere length for breast cancer patients was acquiredfrom previous research [27].
2.2. Kaplan-Meier Analysis. Kaplan-Meier analysis was per-formed with GraphPad (https://www.graphpad.com/), SPSS(https://www.ibm.com/products/spss-statistics), and GEPIAto calculate log-rank significance in different groups ofbreast cancer patients. Besides, Kaplan-Meier analysis wasperformedwith SPSS and visualizedwithGraphPad to stratifypatients with respect to ER status, PR status, postoperationradiation, and PAM50 subtypes in breast cancer patients.
The overall survival (OS), disease-specific survival (DSS),disease-free interval (DFI), and progression-free interval(PFI) were compared in breast cancer patients.
2.3. Multiple Variate Cox Regression. Multiple variate Coxregression was performed with SPSS. The forward stepwisemethod was performed with the threshold of p < 0:05 toinclude and p > 0:10 to acquire independent factors for theprognosis of breast cancer patients.
Significant and independent factors predicting OS, DSS,DFI, or PFI were selected in breast cancer patients. Thecorresponding risk scores for OS, DSS, DFI, and PFI werecalculated and assessed, respectively.
2.4. Heatmap and Hierarchical Clustering. Heatmap andhierarchical clustering were performed with the MeV soft-ware (https://sourceforge.net/projects/mev-tm4/). Expres-sion levels of all genes included in the analysis werenormalized with respect to the median of the gene acrossall patients, and the color scale was normalized and set to-2~2. Hierarchical clustering was performed with the Euclid-ean clustering method with average linkage and optimizedgene/sample order.
Heatmap and the following hierarchical clusteringenabled us to directly visualize the expression pattern ofcertain clusters of genes and samples.
2.5. Data Analysis. IHC data was analyzed with Image-ProPlus (https://www.totalsmart.com.tw/cn/image-pro-plus).
The correlation between two groups of samples wasperformed and plotted with GraphPad. Linear regressionwas performed with SPSS, and 95% CI was plotted in adotted line.
Student’s t-test was performed with GraphPad.Single-cell consensus clustering (SC3) was carried out
with R package [26], and the dimension reduction methodwith the t-SNE method was archived with python [28].
2.6. Statistical Analysis. Student’s t -test was performed tocompare the expression level of different groups unlessotherwise stated. Paired Student’s t-test was used to comparethe NPPA and MZF1 mRNA levels in tumor tissues andpaired paratumor tissues.
Log-rank analysis was utilized to compare the survival ofbreast cancer patients. Pearson’s correlation coefficient wascalculated between two genes in breast cancer (such asNPPA and MZF1).
2 Journal of Immunology Research

2.7. Prediction of the Transcriptional Modulation of NPPA.To further explore the transcriptional modulation of NPPAin breast cancer patients, the DNA sequence of the SMC4promoter region (-1000 bp~-1 bp) was obtained from theUCSC database (http://www.genome.ucsc.edu/index.html).The binding affinity of all transcription factors to all bindingsites were predicted in both the PROMO database (http://alggen.lsi.upc.es/recerca/frame-recerca.html) and JASPARdatabase (http://jaspar.genereg.net/).
Next, the mutual transcription factors in both database:transcription factors with dissimilarity < 5% in the PROMOdatabase, or with relative score > 90% in the JASPAR data-base, were selected as potential transcription factors for themodulation of NPPA. Lastly, we analyzed the expressionlevel of NPPA and candidate transcription factors and tran-scription factors in the TCGA database and transcriptionfactors with Pearson’s R > 0:25 or <-0.25 were selected forfurther validation.
2.8. Chromatin Immunoprecipitation (ChIP) and DualLuciferase Reporter Assay. ChIP experiment was performedwith the Chromatin Immunoprecipitation kit (Merck Milli-pore, MA, USA) according to the manufacturer’s instruc-tions. Quantitative PCR was used to measure the relativeenrichment of MZF1 on the NPPA promoter, using primersspecific for each target gene promoter. Primer sequences wereas follows: primer for -318~-452, F: 5′- GCTGGCTGCCTGCCATTTCCTC -3′, R: 5′- CGTGCCTCAGGATTCTTTC-3′ and primer for -889~-762, F: 5′- TCCTCCATCGGTCAAGTTGC-3′, R: 5′- CGACCCTCCTCCAGCATGCT-3′.
Dual luciferase reporter assay was performed with fireflyplasmid carrying -300 bp~-500 bp of the NPPA promoterand control Renilla plasmid. 10 : 1 of firefly and Renilla plas-mid was cotransfected to breast cancer cell lines. After 2 daysof transfection, cells were harvested and lysed in lysis buffer(Promega, Madison, WI, USA), and the activity of both plas-mid was detected by the Dual-Luciferase Reporter AssaySystem (Promega). The results were normalized to theRenilla activities and analyzed with GraphPad.
2.9. Constructs and Transfections. Specific target shRNAs and anontarget shRNA were cloned into lentiviral vector pLKO.1. 2different shRNA sequences were employed in this study:shNPPA seq.1: 5′- GAGCTAATCCCATGTACAATG-3′ andshNPPA seq.2: 5′- TTGTACATGGGATTAGCTCTG-3′.
The overexpression of flag-tagged MZF1 protein andshRNA transfection were achieved with plasmid as previ-ously reported [29].
2.10. Cell Culture. Breast cancer cells MCF-7, MDA-MB-231, BT-20, and HCC1937 are obtained from ShanghaiInstitute of Oncology. MCF-7 and MDA-MB-231 cellswere cultured in DMEM/F12 supplemented with 10%FBS and 1% P/S. BT-20 cells were cultured in MEMsupplemented with 10% FBS and 1% P/S. HCC1937 werecultured in the RPMI-1640 medium supplemented with10% FBS and 1% P/S.
All cells were cultured in a humidified condition at 37degrees with 5% CO2.
2.11. Proliferation Assay of Breast Cancer Cells. For the pro-liferation assay of 4 breast cancer cell lines, 2000 cells wereseeded in triplicates in a 96-well plate on the first day. Cellviability was measured for 5 consecutive days with 1 hourincubation in the Cell Counting Kit-8 (MedChemExpress).
2.12. Invasion and Migration Analysis of Breast Cancer Cells.Matrigel invasion assay was performed as previouslyreported [30]. In brief, Matrigel was dissolved at 4 degrees,diluted to 25% with DMEM, and coated on top of the Trans-well (25μl per Transwell). A complete medium was added tothe lower chamber of the 24-well plate, and cells were resus-pended in DMEM at 5∗105/ml and 100μl of the cells seededon top of the Matrigel. After 24~48 h, cells were fixed andstained with crystal violet.
Migration assay was also performed as previouslyreported [31]. In brief, a complete medium was added tothe lower chamber of the 24-well plate. Cells were thenresuspended in DMEM at 5∗105/ml, and 100μl of the cellswas seeded on top of the Transwell. After 24~48h, cells werefixed and stained with crystal violet.
2.13. Quantitative PCR (qPCR). qPCR was performed aspreviously reported.
Primers used are as follows: NPPA_F: CAACGCAGACCTGATGGATTT; NPPA_R: AGCCCCCGCTTCTTCATTC; MZF1_F: TCCAGGTAGTGTAAGCCCTCA; MZF1_R: TCCTGTTCACTCCTCAGATCG; GAPDH_F: AAGGTCGGAGTCAACGGATT; GAPDH_R: CTCCTGGAAGATGGTGATGG; ACTIN_F: CCTGGCACCCAGCACAAT;and ACTIN_R: GGGCCGGACTCGTCATACT.
2.14. In Vivo Experiments. Nude mouse xenograft model wasestablished with the MCF-7 breast cancer cell line. In brief,2∗106 MCF-7 cells transfected with shCtrl, shNPPA seq.1,or shNPPA seq.2, respectively, were injected to 6-8 weeksold nude mice. Tumor volume was measured every 3-4 daysonce the tumor was observable. Mice were sacrificed oncethe tumor volume was close to 1000mm3.
3. Results
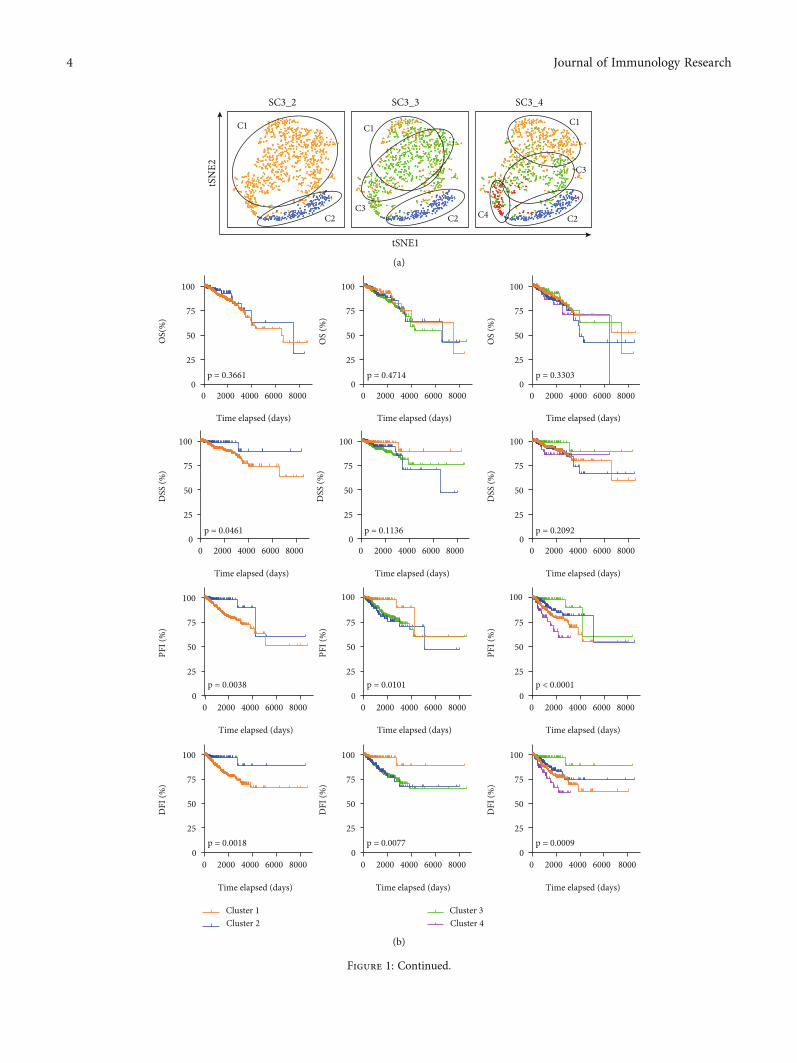
3.1. The Landscape of ECM-Related Genes in Breast CancerPatients. A total of 568 extracellular matrix- (ECM-) relatedgenes were acquired from a Gene Ontology term, GO_EXTRACELLULAR_MATRIX, in the GSEA database(http://www.gsea-msigdb.org). To interpret the significanceof extracellular matrix-related genes in breast cancer patient,we demonstrated the expression matrix of these genes fromthe TCGA database (https://portal.gdc.cancer.gov/). Anonsupervised clustering method, SC3 clustering method(single-cell consensus matrix), was performed, and the clus-tering results were visualized with a t-distributed stochasticneighbor embedding (t-SNE) method (Figure 1(a)). Todetermine the appropriate number of clusters, we comparedthe overall survival (OS), disease-specific survival (DSS),disease-free interval (DFI), and progression-free interval(PFI) with Kaplan-Meier analysis in all clusters of patients.And a significant difference in DSS, DFI, and PFI can only
3Journal of Immunology Research
tSNE1
tSN
E2
SC3_2
C1
C2
SC3_3
C2C3
C1
SC3_4
C2C4
C1
C3
(a)
0 2000 4000 6000 80000
25
50
75
100
Time elapsed (days)
DSS
(%)
p = 0.1136
0 2000 4000 6000 80000
25
50
75
100
Time elapsed (days)
DSS
(%)
p = 0.2092
Cluster 1Cluster 2
Cluster 3Cluster 4
0 2000 4000 6000 80000
25
50
75
100
Time elapsed (days)
OS
(%)
p = 0.4714
0 2000 4000 6000 80000
25
50
75
100
Time elapsed (days)
OS(
%)
p = 0.3661
0 2000 4000 6000 80000
25
50
75
100
Time elapsed (days)
OS
(%)
p = 0.3303
80000 2000 4000 60000
25
50
75
100
Time elapsed (days)
PFI (
%)
p = 0.0038
0 2000 4000 6000 80000
25
50
75
100
Time elapsed (days)
DSS
(%)
p = 0.0461
0 2000 4000 6000 80000
25
50
75
100
Time elapsed (days)
DFI
(%)
p = 0.0018
100
PFI (
%)
0 2000 4000 6000 80000
25
50
75
Time elapsed (days)
p = 0.0101
0 2000 4000 6000 80000
25
50
75
100
Time elapsed (days)
DFI
(%)
p = 0.0077
8000
100
0 2000 4000 6000 80000
25
50
75
Time elapsed (days)
PFI (
%)
p < 0.0001
0 2000 4000 60000
25
50
75
100
Time elapsed (days)
DFI
(%)
p = 0.0009
(b)
Figure 1: Continued.
4 Journal of Immunology Research

be observed in breast cancer patients when they were dividedinto 2 clusters (Figure 1(b)).
To illustrate the significance of the clustering, we labeledthe pathological staging, AJCC staging, radiation treatment,PR status, PAM50 status, new tumor events status, newtumor anatomic site, and new tumor event types in these 2clusters of breast cancer patients (Figure 1(c) and Suppl.Figure 1A-1C). As shown in Figure 1(c), there is no
difference in the pathological and AJCC staging,postoperation treatment, and the molecular subtypes of thepatients (Suppl. Figure 1A-1B), yet we observed a dramaticincrease in the relapse of the tumor (Suppl. Figure 1C).Further bioinformatics analysis unveiled that the newtumor events after initial treatment were most commonlydistant metastasis, most commonly observed in bones(Suppl. Figure 1C).
C1
PAM50 categoryLumBLumAHer2Basal
C1
C2 C2PR status
PositiveNegative
C1
C2
Radiation therapyafter surgery
YesNo
C1
C2
Pathologic staging
Stage IStage IIStage IIIStage IV
C1
C2
AJCC staging
Stage IStage IIStage IIIStage IV
C2
LungLiverBrainBone
Other
C1
C2
New tumor eventsanatomic site
C1
C2New tumor events type
Distant metastasisLocoregional diseaseLocoregional recurrenceNew primary tumor
C1
C2
New tumor eventsafter initial treatment
YesNo
(c)
9
6
3
0–0.5 0.0 0.5
ssGSEA (Averagec1 -Averagec2)
-Log
10P C
1vs.C
2 Recognition and associationof DNA glycosylaseCleavage of the damaged purine
Regulation of telomeraseSMAD2/3/4 heterotrimerregulates transcription
Nuclear import of rev proteirActivation of NIMA kinases
Activation of RAS in B cellsProcessing of DNAends prior to end rejoining
Arf1 pathway
Tachykinin receptorsbind tachykinins
G alpha (q) signalling events
Glucagon signalingin metabolic regulation
NegativePositive
Sr
APe
Arf1 pathway
chykinin receptorsind tachykininsy
G alpha (q) signalling events
Glucagon signalingin metabolic regulation
(d)
Figure 1: The landscape of ECM-related genes in breast cancer patients. (a) t-SNE method showing the SC3 clustering result. 2 to 4 groupsof patients were demonstrated and labeled. (b) Kaplan-Meier analysis comparing the OS, DSS, DFI, and PFI of different clusters of breastcancer patients in (a). (c) The labeling of pathological stages, AJCC stages, radiation therapy condition, PR status, PAM50 subtypes,postoperative new tumor events, new tumor event anatomic site, and new tumor event types in breast cancer patients. (d) Volcano plotshowing the −log ðpÞ and the difference in ssGSEA results in Cluster 1 and Cluster 2 breast cancer patients. Significant pathways withdifference in ssGSEA > 0:25 were labeled in red (enhanced in Cluster 1) or blue (suppressed in Cluster 1).
5Journal of Immunology Research

Sc3_2_clustersTHSD4HPXF7LRIG1ADAMTS15BCAMTGFB3NPNTCHADGDF15HAPLN3SFRP1MATN4PTX3HDGFCHI3L1MMP7LAD1WNT6CSTB
3
0
(a)
-Log
2PC1
vs.C
2 10
15
5
00 50 100 150 200 250
-Log2PSC3_2 marker
Not significiantSignificiant
(b)
Low ECM Medium ECM High ECM
Euclidean distance/average linkage clustering
–2
2
(c)
0 3000 6000 90000
25
50
75
100
Time elapsed (days)
DSS
(%)
p = 0.0430
9000
Time elapsed (days)
0 3000 60000
25
50
75
100
PFI (
%)
p = 0.1910
Low ECMMedium ECMHigh ECM
(d)
B Sig. Exp(B)Lower Upper
PR status -0.921 0.002 0.398 0.225 0.705Pathological staging 0.690 0.004 1.993 1.254 3.169ADAMTS13 0.285 0.037 1.330 1.018 1.738NPPA -0.624 0.019 0.536 0.317 0.904Pathological staging 1.022 0.000 2.777 1.679 4.595SEMA3B -0.311 0.000 0.732 0.619 0.866GDF15 0.180 0.021 1.197 1.028 1.393PR status -0.567 0.012 0.567 0.365 0.881Pathological staging 0.782 0.000 2.186 1.535 3.113EDIL3 0.150 0.017 1.161 1.027 1.313MFAP4 -0.159 0.007 0.853 0.760 0.957Pathological staging 0.732 0.000 2.080 1.454 2.975SEMA3B -0.199 0.003 0.819 0.720 0.933COL17A1 -0.106 0.005 0.900 0.836 0.968EDIL3 0.135 0.034 1.145 1.010 1.297GDF15 0.113 0.049 1.120 1.000 1.253
DSS
PFI
OS
DFI
95.0% CI for Exp (B)
(e)
Figure 2: Continued.
6 Journal of Immunology Research

0 2000 4000 6000 80000
25
50
75
100
Time elapsed (days)
Low PFI risk High PFI risk
p < 0.0001
0 2000 4000 6000 80000
25
50
75
100
Time elapsed (days)
DSS
(%)
Low DSS riskHigh DSS risk
p < 0.0001
0 2000 4000 6000 80000
25
50
75
100
Time elapsed (days)
DFI
(%)
Low DFI riskHigh DFI risk
p < 0.0001
0 2000 4000 6000 80000
25
50
75
100
Time elapsed (days)
PFI(
%)
Low PFI riskHigh PFI risk
p < 0.0001
OS
(%)
(f)
0 20004000600080000
25
50
75
100
Time elapsed (days)
OS
(%)
p = 0.0485
0 20004000600080000
25
50
75
100
Time elapsed (days)
DSS
(%)
p = 0.0268
NPPA lowNPPA high
0 20004000600080000
25
50
75
100
Time elapsed (days)
DFI
(%)
p = 0.0253
0 20004000600080000
25
50
75
100
Time elapsed (days)
PFI (
%)
p = 0.0155
(g)
0 3000 6000 90000
25
50
75
100
Time elapsed (days)
DSS
(%)
Low NPPAHigh NPPA
p = 0.3098
0 3000 6000 90000
25
50
75
100
Time elapsed (days)
PFI (
%)
p = 0.0734
0 3000 6000 90000
25
50
75
100
Time elapsed (days)
DSS
(%)
p = 0.0129
0 3000 6000 90000
25
50
75
100
Time elapsed (days)
PFI (
%)
p = 0.1004
(h)
Figure 2: Identification of NPPA as an independent prognostic marker for breast cancer patients. (a) Heatmap showing the marker genes inSC3 clustering results. (b) Volcano plot showing the significance of genes in Cluster 1 vs. Cluster 2 and in SC3 clustering result. Mutuallysignificant genes were defined as marker genes and were labeled in red. (c) Heatmap showing the expression of ECM marker genes in breastcancer patients. Three major clusters of patients were identified as high, medium, and low ECM levels. (d) Kaplan-Meier analysis comparingthe DSS and PFI of the high-, medium-, and low-ECM breast cancer patients. (e) Multivariate Cox regression results showing theindependent marker genes and clinical features for the prognosis of breast cancer patients. Risk factors for OS, DSS, DFI, and PFI werecalculated with respect to the Cox regression results. (f) Kaplan-Meier analysis comparing the high vs. low risk scores in OS, DSS, DFI,and PFI was demonstrated in breast cancer patients. (g, h) Kaplan-Meier analysis comparing the high vs. low NPPA in OS, DSS, DFI,and PFI was demonstrated in breast cancer patients (g) or in breast cancer patients stratified by postoperative radiation therapy.
7Journal of Immunology Research

Circulating recticulocyte Heart
Peripheral nervous system
Endocrine systemSalivary gland
BladderMyeloma
Lung carcinoid tumor
Glioma
HematologicalConnecitivity and muscularRespiratory
NervousEndocrine & SalivaryGI tract & organs
UrogenitalGynegological & Breast
Stem cells
3000
2000
1000
Relat
ive E
xore
ssio
n le
vel
5000
NPPA,ENSG00000175206
Anatomical system
10000
Samples
15000
0
(a)
TumorNormal
(b)
Figure 3: Continued.
8 Journal of Immunology Research

ACC
T (n=77
)N (n
=128)
BLCA
T (n=40
4)N (n
=28)
BRCA
T (n=10
85)
N (n=29
1)
CESC
T (n=30
6)N (n
=13)
CHOL
T (n=36
)N (n
=9)
COAD
T (n=27
5)N (n
=349)
DLBC
T (n=47
)N (n
=337)
ESCA
T (n=18
2)N (n
=286)
GBM
T (n=16
3)N (n
=207)
HNSC
T (n=51
9)N (n
=44)
KICH
T (n=66
)N (n
=53)
KIRC
T (n=52
3)N (n
=100)
KIRP
T (n=28
6)N (n
=60)
LAML
T (n=17
3)N (n
=70)
LGG
2
T (n=51
6)N (n
=207)
LIHC
T (n=36
9)N (n
=160)
LUAD
T (n=48
3)N (n
=347)
LUSC
T (n=48
6)N (n
=338)
MESO
T (n=87
)
OV
T (n=42
6)N (n
=88)
PAAD
T (n=17
9)N (n
=171)
PCPG
T (n=18
2)
N (n=3)
PRAD
T (n=49
2)N (n
=152)
READ
T (n=92
)N (n
=318)
SARC
T (n=26
2)N (n
=2)
SKCM
T (n=46
1)N (n
=558)
STAD
T (n=40
8)N (n
=211)
TGCT
T (n=13
7)N (n
=165)
THCA
T (n=51
2)N (n
=337)
THYM
T (n=11
8)N (n
=339)
UCEC
T (n=17
4)N (n
=91)
UCS
T (n=57
)N (n
=78)
UVMT (n
=79)
Tran
scrip
ts pe
r mill
ion
(TPM
)
0
1
2
3
4
5
6
7
8
9
(c)
GSE65216
Paratumor
Tumor–4
–2
0
2
4
6
Rela
tive e
xpre
ssio
n le
vel
Rela
tive e
xpre
ssio
n le
vel
Rela
tive e
xpre
ssio
n le
vel
⁎
Basal
Her2LumA
LumB–4
–2
0
2
4
6
⁎⁎⁎
⁎
Healthy
TNBCHer2
LumALumB
2
3
4
5
6
⁎⁎⁎
⁎⁎⁎
⁎⁎
TCGATCGA
(C)(B)(A)
(d)
Figure 3: Continued.
9Journal of Immunology Research

With the single-sample gene set enrichment analysis(ssGSEA), we observed the most significantly altered path-ways in Cluster 1 and Cluster 2 (Figure 1(d)). And pathwayscorrelated with the tumor recurrence, such as regulation oftelomerase pathway, SMAD2/3/4 heterotrimer-regulatedtranscription pathway and the activation of NIMA kinasespathway, were significantly activated, while the pathwaysinvolved in the DNA damage repair pathways, such as rec-ognition and association of DNA glycosylases pathway andthe cleavage of the damaged purine pathway, were inhibited.
3.2. Identification of NPPA as an Independent PrognosticMarker for Breast Cancer Patients. We collected the mostaltered genes between Cluster 1 and Cluster 2 as potentialmarkers for breast cancer patients (Figure 2(a)), and thesignificance between the mRNA level of all ECM genes inCluster 1 and Cluster 2 patients was calculated. Eventually,49 marker genes with p < 10−10 in SC3 method and withp < 10−5 between Clusters 1 and 2 were further selectedas the signature of ECM-related genes (Figure 2(b)).
With hierarchical clustering, breast cancer patientswere further categorized into 3 different levels with respectto the expression pattern of ECM marker genes, termed asthe low-, medium-, and high-ECM groups, respectively,(Figure 2(c)). Kaplan-Meier analysis showed patients withhigher ECM level showed impaired DSS and a tendencyto reduce PFI in breast cancer patients (Figure 2(d)).
To further explore the prognostic significance of thesemarker genes in breast cancer patients, we performed a mul-tivariate Cox regression model to select the independentmarkers for DFI, DSS, PFI, and OS (Figure 2(e)). Clinicalfeatures, including CN clusters, ER status, PAM50 status,PR status, TNM staging, surgical procedure name, histolog-ical type, and pathological staging together with 49 ECM
markers were included in the model. Results showed thatPR status, pathological staging, and the expression ofADAMTS13 and NPPA correlated with the DFI; pathologi-cal staging and the expression of SEMA3B and GDF15correlated with the DSS; PR status, pathological staging,and the expression of EDIL3 and MFAP4 correlated withthe PFI; and pathological staging and the expression ofSEMA3B, COL17A1, EDIL3, and GDF15 correlated withthe OS of the breast cancer patients (Figure 2(e)).
Risk scores for the OS, DSS, DFI, and PFI were calculatedwith results in Figure 2(e), respectively, and the significance ofthese risk scores was demonstrated (Figure 2(f)). Then, weassessed the prognostic value of all these independent genesand results showed only SEMA3B and NPPA could signifi-cantly predict the DFI, PFI, and DSS of breast cancer patients(Figure 2(g) and Suppl. Figure 2A). Considering the fact thatthe biological function of SEMA3B has been proposed, weseek to unveil the function of NPPA in breast cancer.
Next, we observed that the NPPA was significantlycorrelated with the DSS of breast cancer patients stratifiedby postoperative radiation therapy condition (Figure 2(h)),but not in breast cancer patients stratified by ER status(Suppl. Figure 2B), PR status (Suppl. Figure 2C), andPAM50 subtypes (Suppl. Figure 2D).
3.3. The Expression of NPPA Was Impaired in Breast CancerTissues.We compared the expression pattern of NPPA in bothnormal and malignant tumor tissues with IST Online. Asshown in Figure 3(a), NPPA was highly expressed in the nor-mal endocrine system, myeloma lung carcinoid tumor, andglioma, yet NPPA was significantly reduced in breast cancer(Figure 3(b)). Consistently, we observed that the expressionof NPPA was suppressed in various tumor tissues and wasonly overexpressed in lower grade glioma (Figure 3(c)).
Tum
orN
orm
al
NPPA ZOOM
200µm
200µm 50µm
50µm
(e)
Tumor Normal
0.3
0.2
0.1
0.0
AO
D
⁎⁎⁎
(f)
Figure 3: The expression of NPPA was impaired in breast cancer tissues. (a–c) The expression pattern of NPPA in IST Online (a), GEPIA(b), or in TCGA (c). (d) The expression of NPPA mRNA in tumor and paratumor tissues (A), in different PAM50 subtypes (B), and inGSE65216 database (C). (e, f) The expression (e) and quantification (f) of NPPA protein level in the Human Protein Atlas withimmunohistochemistry. Average optical density (AOD) was used to determine the protein level of NPPA. For the data in (d), (A) wasanalyzed with paired Student’s t-test and the rest were analyzed with Student’s t-test. ∗p < 0:05, ∗∗p < 0:01, and ∗∗∗p < 0:001.
10 Journal of Immunology Research

Highproliferation
Mediumproliferation
Lowproliferation
RRM2CDC20UBE2CBIRC5CCNBIPTTGINDC80CEP55MK167UNF2TYMS
–2
2
(a)
Low
MediumHigh
–2
–1
0
1
2
3
NPP
A m
RN A
leve
l ⁎
⁎⁎
(b)
⁎⁎⁎
⁎⁎⁎
MCF-7
Time elapsed (days)
1 2 3 40.0
0.5
1.0
1.5
CCK8
(OD
450)
Time elapsed (days)
⁎⁎⁎⁎
⁎⁎⁎
MDA-MB-231
1 2 3 40.0
0.5
1.0
1.5
CCK8
(OD
450)
Time elapsed (days)
⁎⁎⁎
⁎⁎⁎⁎⁎
BT-20
1 2 3 40.0
0.2
0.8
1.0
0.4
0.6
CCK8
(OD
450)
Time elapsed (days)
⁎⁎⁎⁎
⁎⁎
HCC1937
1 2 3 40.0
0.5
1.5
2.0
1.0
CCK8
(OD
450)
(c)
Inva
sion
Mig
ratio
n
siCtrl shNPPAseq.1
shNPPAseq.2
siCtrl shNPPAseq.1
shNPPAseq.2
MCF-7
MCF-7
(d)
Figure 4: Continued.
11Journal of Immunology Research

Further, we showed NPPA was decreased in breast can-cer in the TCGA and GSE65216 databases, especially in thebasal group (Figure 3(d)). Next, we collected the NPPAimmunohistochemistry (IHC) staining in the normal andbreast cancer tissues from the Human Protein Atlas database(Figure 3(e)) and consistently impaired NPPA level wereobserved in breast tumor tissues (Figure 3(f)).
However, the expression of NPPA was not altered inpatients with/without radiation therapy (Suppl. Figure 3A)and in patients with different ER status (Suppl. Figure 3B)or histological staging (Suppl. Figure 3C). Further, we
observed a weak correlation of NPPA with stemness score(Suppl. Figure 3D), relative telomere length (Suppl.Figure 3E), and various T cells (Suppl. Figure 3F) in breastcancer patients.
3.4. NPPA Silencing Promotes the Malignant Behavior ofBreast Cancer Cells. Breast cancer patients were furtherdivided into three different groups according to their sepa-rate proliferation potential (Figure 4(a)), and the expressionlevel of NPPA was gradually decreased in patients withhigher proliferation potential (Figure 4(b)).
0
100
200
300
⁎
⁎⁎
MDA-MB-231
0
50
100
150Ce
ll N
umbe
rCe
ll N
umbe
r
0
100
200
300
400
⁎
⁎
MCF-7Ce
ll N
umbe
r
siCtrlsiNPPAseq.1
siNPPAseq.2
⁎
⁎⁎
0
50
100
150
200
⁎
⁎
Cell
Num
ber
MCF-7 MDA-MB-231
(e)
MCF-7
7 10 13 16 19 22 250
200
400
600
800
Time elapsed (days)
Tum
or v
olum
e (m
m3 )
shCtrlshNPPA seq.1shNPPA seq.2
⁎⁎⁎⁎
⁎⁎⁎
⁎⁎
⁎⁎⁎
⁎⁎
(f)
siCtrl
shNPPAseq.1
shNPPAseq.2
(g)
Figure 4: NPPA silencing promotes the malignant behavior of breast cancer cells. (a) Heatmap showing the proliferation potential of breastcancer patients in the TCGA database. The top three clusters of patients were identified as the high, medium, and low proliferation groups.(b) Quantification of NPPA mRNA level in the high, medium, and low proliferation breast cancer patients. (c) The proliferation curve ofNPPA depleted or control cells. Experiments were performed in 4 different breast cancer cell lines. (d, e) The typical figure (d) and thequantification (e) of MCF-7 cells and MDA-MB-231 cells in the Transwell experiments. Migration (A) and invasion (B) were assessed,respectively, in NPPA depleted or control cells. (f, g) The proliferation curve (f) and the tumor image (g) of MCF-7 nude mousexenograft. Tumor growth and tumor volume were assessed in NPPA depleted or control MCF-7 cells. Data are represented asmean ± SEM, ∗p < 0:05, ∗∗p < 0:01, and ∗∗∗p < 0:001. The data were analyzed using Student’s t-test.
12 Journal of Immunology Research

11136 274
Dissimilarity < 5%PROMO
Relative profile score > 90%JASPAR
(a)
–0.1 0.0 0.1 0.2 0.3 0. 40
5
10
15
20
25
TCGA database
Pearson Correlation
–Log
(p)
MZF1
(b)
Pearson r=0.3044
2
0
MZF
1 m
RNA
leve
l
NPPA mRNA level
0 1 2
–2
–2 –1–4
(c)
2.0
1.5
1.0
0.5
Bits
0.01 2 3 4 5 6
(d)
–1000 –750 –500 –2500
2
4
6
0
1
2
3
Promoter region
1-Re
lativ
e sco
re (%
) Dis-sim
ilarity (%)
–1
PROMOJASPAR
(e)
⁎
⁎
0
1
2
3
4
Rela
tive m
RNA
leve
l
MZF1 NPPA
(f)
Figure 5: Continued.
13Journal of Immunology Research

To validate our findings with the bioinformatics analysis,we established 4 different breast cancer cell lines with stablyNPPA knockdown with two different sequences of shRNA(Suppl. Figure 4A). The NPPA knockdown with twodifferent shRNAs could significantly enhance theproliferation potential of 4 different breast cancer cells,despite their subtypes or ER status (Figure 4(c)).
To confirm whether NAAP also has a critical role in themigration and the invasion of breast cancer cells, weperformed Transwell experiments with MCF-7 and MDA-MB-231 cells. Results showed NPPA knockdown could sig-nificantly enhance the migration and the invasion of breastcancer cells (Figures 4(d) and 4(e)). However, the necrosis
and the apoptosis of MCF-7 and MDA-MB-231 cells werenot affected by NPPA knockdown (Suppl. Figure 4B-4C).
Next, we sought to validate our findings in nude mousexenograft model. As expected, we observed the enhancedproliferation of NPPA knockdown MCF-7 cells, as com-pared with the control groups (Figures 4(f) and 4(g) andSuppl. Figure 4D-4E).
3.5. NPPA Was Transcriptionally Modulated by MZF1 inBreast Cancer Cells. We further tried to explore the tran-scription modulation of NPPA in breast cancer cells. WithPROMO and JASPAR, we predicted the binding of allhuman factors on the -1000 bp promoter region of NPPA.
0
5
10
15
Rela
tive m
RNA
leve
l
EVMZF1OE
MZF1 NPPA
⁎
⁎⁎
(g)
⁎
0
2
4
6
Fold
enric
hmen
t
–318~–452 –762~–889
(h)
0
1
2
3
4
Fold
enric
hmen
t
–318 ~ –452 –762 ~ –889
MCF-7
⁎⁎⁎
(i)
⁎
0
2
4
6
Fire
fly/r
enill
a (RL
U)
–300~–500
(j)
0
1
2
3
4
5Fi
refly
/ren
illa(
RLU
)
IgGFlag
–300~–500⁎⁎⁎
(k)
Figure 5: NPPA was transcriptionally modulated by MZF1 in breast cancer cells. (a) Veen plot showing the mutual transcription factorsidentified by both PROMO and JASPAR. (b) Dot plot showing the Pearson correlation between mRNA level of NPPA and 11transcription factors. MZF1 was labeled in red. (c) Dot plot showing the correlation between NPPA and MZF1 mRNA levels in breastcancer patient. (d) The binding motif of MZF1. (e) The binding site of MZF1 to the promoter region of NPPA with PROMO andJASPAR. Binding sites in PROMO and JASPAR were labeled in red and blue, respectively. (f, g) Quantification of MZF1 and NPPAmRNA in MZF1 overexpressed MCF-7 (f) and MDA-MB-231 (g) cells. (h, i) ChIP result showing the binding of MZF1 to the -381~-452 bp of the NPPA promoter region in MZF1 overexpressed MCF-7 (h) and MDA-MB-231 (i) cells. (j, k) Dual luciferase assay showingthe relative transcription activity of -300~-500 bp (Firefly/Renilla, RLU) in MZF1 overexpressed MCF-7 (j) and MDA-MB-231 (k) cells.Data are represented as mean ± SEM; ∗p < 0:05, ∗∗p < 0:01, and ∗∗∗p < 0:001. The data were analyzed using Student’s t-test.
14 Journal of Immunology Research

With dissimilarity < 5% in PROMO and relative profilescore > 90% in JASPAR, we identified 11 mutual transcrip-tion factors with both methods (Figure 5(a)). Then, weestimated the Pearson correlation between the mRNA levelof these genes with NPPA, respectively (Figure 5(b)), andwe observed that only MZF1 is highly correlated with theNPPA (Figure 5(c)). Consistently, we identified the reducedMZF1 level in tumor tissues, especially in the basal subtypeof breast cancer tissues (Suppl. Figure 5A-5B).
The binding motif of MZF1 is shown in Figure 5(d), andthe corresponding binding site of MZF1 in PROMO andJASPAR was mainly clustered in the -750 bp and -350 bpregions of the NPPA promoter (Figure 5(e)). Consistently,we observed that the expression of NPPA was elevated inMCF-7 and MDA-MB-231 cells overexpressed with flag-tagged MZF1 (Figures 5(f) and 5(g)). To validate our find-ings, we explored the binding of MZF1 in the promoterregion of NPPA with ChIP experiments. We observed thebinding of MZF1 to the -318~-452 bp, but not the -889~-762 bp, of the NPPA promoter in both cell lines(Figures 5(h) and 5(i)). Further, we performed the dual lucif-erase assay with the -300~-500 bp of the NPPA promoterand observed a enhanced transcription activity of NPPA inMZF1 overexpressed MCF-7 and MDA-MB-231 cells(Figures 5(j) and 5(k)).
4. Discussion
Breast cancer is one of the leading cause of tumor-relateddeath worldwide, whose incidence rate has been increasingfor decades. While various approaches of treatment as wellas multiple molecular subtypes of breast cancer have beenproposed, the recurrence of breast cancer remains high andthe biological significance of ECM-related genes, especiallythe function and role of NPPA in breast cancer patients,have not been discussed.
Here, in this study, we performed a novel SC3 clusteringmethod of breast cancer patients with respect to the expres-sion pattern of ECM-related genes and identified a cluster ofbreast cancer patients with much lower recurrence rate(Figure 1). We collected the marker genes for this clusterof breast cancer patients and assessed the correlationbetween the expression level of ECM-related genes and theirprognosis with integrated bioinformatics analysis. We even-tually identified NPPA as a novel prognostic marker forbreast cancer patients. Also, NPPA remains a significantprognostic in breast cancer patients stratified by postopera-tive radiation condition, but not by ER status, PR status,and PAM50 subtypes.
The expression pattern of NPPA across various humantissues and cancer types has been demonstrated, and NPPAis simultaneously downregulated in cancer tissues. Further,we observed the reduced NPPA in mRNA and protein levelsand the knockdown of NPPA result in the enhanced prolif-eration, migration, and invasion of breast cancer cells bothin vivo and in vitro. However, the expression of NPPA inbreast cancer is based on a computational study and furthervalidation in patients is needed.
Eventually, we explored the transcription modulation ofNPPA in breast cancer cells. We identified MZF1 as a keytranscription factor for NPPA and predicted the binding ofMZF1 to the two different domains of the NPPA promoterregion. With the chromatin immunoprecipitation (ChIP)experiment as well as the following dual luciferase assay,we identified that the binding of MZF1 to the -300~-500 bp of the NPPA promoter could promote the transcrip-tion of NPPA.
Together, we plotted the expression pattern of ECM-related genes in breast cancer patients and identified a novelindependent prognostic factor, NPPA, in the breast cancerpatients. With both bioinformatics and experimentalapproaches, we established the expression pattern of NPPAand explored its biological function in breast cancer cells.We believe our findings would provide a novel insight intothe prevention of breast cancer recurrence and provide anew approach in the treatment of breast cancer.
Data Availability
Public datasets in the current study can be accessed fromfollowing links: TCGA BRCA database (https://tcga-data.nci.nih.gov/), Human Protein Atlas (https://www.proteinatlas.org/), GEPIA (http://gepia.cancer-pku.cn/index.html), GTExdatabase (https://xenabrowser.net/), PROMO database(http://alggen.lsi.upc.es/recerca/frame-recerca.html), and JAS-PAR database (http://jaspar.genereg.net/).
Conflicts of Interest
The authors declare that they have no competing interestswith the contents of this article.
Authors’ Contributions
Jinhai Tang and Zhenfeng Yu designed the research. AijunSun and Xiaonan Sheng performed the experiments. Finally,Aijun Sun wrote the manuscript, and Jian Zhang revised themanuscript. All authors read and approved the final manu-script. Aijun Sun and Xiaonan Sheng contributed equallyto this work.
Acknowledgments
This research was supported by the National KeyResearch and Development Program of China (No.2016YFC0905900), National Natural Science Foundationof China (No. 81872365), and Jiangsu Provincial KeyResearch Development Program (No. BE2019731).
Supplementary Materials
Supplementary Figure 1: (A) quantification of pathologicalstages, AJCC stages, and postoperative radiation therapycondition in Cluster 1 and Cluster 2 breast cancer patients.(B) Quantification of PR status and PAM50 subtypes inCluster 1 and Cluster 2 breast cancer patients. (C) Quantifi-cation of postoperative new tumor events, new tumor eventanatomic site, and new tumor event types in Cluster 1 and
15Journal of Immunology Research

Cluster 2 breast cancer patients. Supplementary Figure 2:(A) Kaplan-Meier analysis comparing the prognostic valueof ADAMTS13, SEMA3B, GDF15, EDIL3, MFAP4, andCOL17A1 in breast cancer patients. DSS, DFI, and PFI wereanalyzed. (B–D) Kaplan-Meier analysis comparing the DSSand PFI of breast cancer patients with high or low NPPAlevel. Patients were stratified by ER status (B), PR status (C),or PAM50 subtypes (D). Supplementary Figure 3: (A–C)the expression pattern of NPPA in breast cancer patients withdifferent postoperative radiation conditions (A), ER status(B), and AJCC staging (C). (D, E) Dot plot showing the corre-lation between NPPA mRNA and stemness score (D) andrelative telomere length (E). (F) Dot plot showing the correla-tion between NPPA mRNA with the tumor infiltration T cellsubtypes. The data were analyzed using Student’s t-test,∗p < 0:05. Supplementary Figure 4: (A) quantification ofNPPA mRNA level in 4 NPPA depleted or control breastcancer cell lines. (B, C) Quantification of necrosis andapoptosis cell percentage with flowcytometry in NPPAdepleted or control MCF-7 (B) and MDA-MB-231 (C) cells.(D, E) Quantification of body weight (D) and tumor weight(E) in nude mouse xenograft model with NPPA depleted orcontrol MCF-7 cells. Data are represented as mean ± SEM,∗∗p < 0:01. The data were analyzed using Student’s t-test.Supplementary Figure 5: (A) the expression pattern of MZF1in the TCGA breast cancer database. The data were analyzedusing paired Student’s t-test; *p < 0:05. (B) The expressionpattern of MZF1 in different subtypes of breast cancer in theGSE65216 database. The data were analyzed using Student’st-test; ∗∗∗∗p < 0:0001. (Supplementary Materials)
References
[1] N. Harbeck and M. Gnant, “Breast cancer,” Lancet, vol. 389,no. 10074, pp. 1134–1150, 2017.
[2] METABRIC Group, C. Curtis, S. P. Shah et al., “The genomicand transcriptomic architecture of 2,000 breast tumoursreveals novel subgroups,” Nature, vol. 486, no. 7403,pp. 346–352, 2012.
[3] D. C. F. R. Koboldt, R. Fulton, M. McLellan et al., “Compre-hensive molecular portraits of human breast tumours,”Nature, vol. 490, no. 7418, pp. 61–70, 2012.
[4] T. J. Whelan, J. P. Pignol, M. N. Levine et al., “Long-termresults of hypofractionated radiation therapy for breast can-cer,” The New England Journal of Medicine, vol. 362, no. 6,pp. 513–520, 2010.
[5] A. S. Coates, E. K. A. Millar, S. A. O'Toole et al., “Prognosticinteraction between expression of p53 and estrogen receptorin patients with node-negative breast cancer: results fromIBCSG Trials VIII and IX,” Breast Cancer Research, vol. 14,no. 6, p. R143, 2012.
[6] R. S. Herbst, J. C. Soria, M. Kowanetz et al., “Predictive corre-lates of response to the anti-PD-L1 antibody MPDL3280A incancer patients,”Nature, vol. 515, no. 7528, pp. 563–567, 2014.
[7] J. Insua-Rodriguez and T. Oskarsson, “The extracellularmatrix in breast cancer,” Advanced Drug Delivery Reviews,vol. 97, pp. 41–55, 2016.
[8] A. L. Wishart, S. J. Conner, J. R. Guarin et al., “Decellularizedextracellular matrix scaffolds identify full-length collagen VI asa driver of breast cancer cell invasion in obesity and metasta-sis,” Science Advances, vol. 6, no. 43, p. eabc3175, 2020.
[9] M. Najafi, B. Farhood, and K. Mortezaee, “Extracellular matrix(ECM) stiffness and degradation as cancer drivers,” Journal ofCellular Biochemistry, vol. 120, no. 3, pp. 2782–2790, 2019.
[10] B. Erdogan and D. J. Webb, “Cancer-associated fibroblastsmodulate growth factor signaling and extracellular matrixremodeling to regulate tumor metastasis,” Biochemical SocietyTransactions, vol. 45, no. 1, pp. 229–236, 2017.
[11] C. Walker, E. Mojares, and A. Del Rio Hernandez, “Role ofextracellular matrix in development and cancer progression,”International Journal of Molecular Sciences, vol. 19, no. 10,p. 3028, 2018.
[12] R. Carvalho, J. Paredes, and A. S. Ribeiro, “Impact of breastcancer cells’ secretome on the brain metastatic niche remodel-ing,” Seminars in Cancer Biology, vol. 60, pp. 294–301, 2020.
[13] C. E. McQuitty, R. Williams, S. Chokshi, and L. Urbani,“Immunomodulatory role of the extracellular matrix withinthe liver disease microenvironment,” Frontiers in Immunology,vol. 11, p. 574276, 2020.
[14] H. Tomlin and A. M. Piccinini, “A complex interplay betweenthe extracellular matrix and the innate immune response tomicrobial pathogens,” Immunology, vol. 155, no. 2, pp. 186–201, 2018.
[15] J. Winkler, A. Abisoye-Ogunniyan, K. J. Metcalf, and Z. Werb,“Concepts of extracellular matrix remodelling in tumour pro-gression and metastasis,” Nature Communications, vol. 11,no. 1, p. 5120, 2020.
[16] Z. Elgundi, M. Papanicolaou, G. Major et al., “Cancer metasta-sis: the role of the extracellular matrix and the heparan sulfateproteoglycan perlecan,” Frontiers in Oncology, vol. 9, p. 1482,2020.
[17] D. M. Gilkes, G. L. Semenza, and D. Wirtz, “Hypoxia and theextracellular matrix: drivers of tumour metastasis,” NatureReviews Cancer, vol. 14, no. 6, pp. 430–439, 2014.
[18] J. A. Reuter, S. Ortiz-Urda, M. Kretz et al., “Modeling induciblehuman tissue neoplasia identifies an extracellular matrix inter-action network involved in cancer progression,” Cancer Cell,vol. 15, no. 6, pp. 477–488, 2009.
[19] A. Chakravarthy, L. Khan, N. P. Bensler, P. Bose, and D. D. DeCarvalho, “TGF-β-associated extracellular matrix genes linkcancer-associated fibroblasts to immune evasion and immu-notherapy failure,” Nature Communications, vol. 9, no. 1,p. 4692, 2018.
[20] C. Liu, L. Deng, J. Lin et al., “Zinc finger protein CTCF regu-lates extracellular matrix (ECM)-related gene expression asso-ciated with the Wnt signaling pathway in gastric cancer,”Frontiers in Oncology, vol. 10, article 625633, 2021.
[21] A. Gordon-Weeks and A. E. Yuzhalin, “Cancer extracellularmatrix proteins regulate tumour immunity,” Cancers, vol. 12,no. 11, p. 3331, 2020.
[22] Y. Zhao, X. Zheng, Y. Zheng et al., “Extracellular matrix:emerging roles and potential therapeutic targets for breast can-cer,” Frontiers in Oncology, vol. 11, article 650453, 2021.
[23] A. Menon, L. Hong, E. Savio-Galimberti et al., “Electro-physiologic and molecular mechanisms of a frameshift_NPPA_ mutation linked with familial atrial fibrillation,”Journal of Molecular and Cellular Cardiology, vol. 132,pp. 24–35, 2019.
[24] J. Man, P. Barnett, and V. M. Christoffels, “Structure and func-tion of the Nppa-Nppb cluster locus during heart developmentand disease,” Cellular and Molecular Life Sciences, vol. 75,no. 8, pp. 1435–1444, 2018.
16 Journal of Immunology Research

[25] J. Li, J. Zhu, L. Ren et al., “Association between NPPA pro-moter methylation and hypertension: results from Gusucohort and replication in an independent sample,” ClinicalEpigenetics, vol. 12, no. 1, p. 133, 2020.
[26] V. Y. Kiselev, K. Kirschner, M. T. Schaub et al., “SC3: consen-sus clustering of single-cell RNA-seq data,” Nature Methods,vol. 14, no. 5, pp. 483–486, 2017.
[27] F. P. Barthel, W. Wei, M. Tang et al., “Systematic analysis oftelomere length and somatic alterations in 31 cancer types,”Nature Genetics, vol. 49, no. 3, pp. 349–357, 2017.
[28] D. Kobak and P. Berens, “The art of using t-SNE for single-celltranscriptomics,” Nature Communications, vol. 10, no. 1,p. 5416, 2019.
[29] E. Fang, X. Wang, J. Wang et al., “Therapeutic targeting ofYY1/MZF1 axis by MZF1-uPEP inhibits aerobic glycolysisand neuroblastoma progression,” Theranostics, vol. 10, no. 4,pp. 1555–1571, 2020.
[30] J. Marshall, “Transwell® invasion assays,”Methods in Molecu-lar Biology, vol. 769, pp. 97–110, 2011.
[31] C. R. Justus, N. Leffler, M. Ruiz-Echevarria, and L. V. Yang, “Invitro cell migration and invasion assays,” Journal of visualizedexperiments: JoVE, vol. 88, no. 88, 2014.
17Journal of Immunology Research