integrated building control based on …seedengr.com/integrated building control based on occupant...
TRANSCRIPT
INTEGRATED BUILDING CONTROL BASED ON OCCUPANT BEHAVIOR 1 PATTERN DETECTION AND LOCAL WEATHER FORECASTING 2
3 Bing Dong1, Khee Poh Lam2, Charles P. Neuman3 4
United Technologies Research Center, East Hartford, CT, 06108, USA 5 2Center for Building Performance and Diagnostics, Carnegie Mellon University, Pittsburgh, 6
PA, 15213, USA 7 3Department of Electrical and Computer Engineering, Carnegie Mellon University, 8
Pittsburgh, PA, 15213, USA 9 10
ABSTRACT
Standard office building control systems operate the heating, ventilating, and air conditioning on a fixed schedule, based upon anticipated occupancy and use of the building. This study introduces and illustrates a method for integrated building heating, cooling and ventilation control to reduce energy consumption and maintain indoor temperature set points, based on the prediction of occupant behaviour patterns and local weather conditions. The experiment test-bed is setup in the Solar Decathlon House (2005), with over 100 sensor points. The results show that there is a 17.8% measured energy reduction in the cooling season test case.
INTRODUCTION The World Business Council for Sustainable Development recently published their first report on energy efficiency in buildings stating that buildings are responsible for at least 40% of energy use in many countries (Lafarge and UTC, 2008). A fundamental goal of an integrated high performance building is to provide comfortable environment for occupants while minimizing energy usage. There have been many previous research efforts on using model predictive controls (MPC) in building to reduce total building energy consumption. However, the outdoor conditions used in most MPC designs for buildings are based on historic information (Cho, et al. 2003) or available data from NOAA website (Ma, et al. 2010). Only recently, Morari and Tödtli (2008) begin to combine numnerical local weather forecasting and MPC to enhance building energy usage and indoor thermal comfort. Zavala, et al., (2009) studied the economic impacts on building energy consumptions based on local temperature forecasting. Through a proof-of-concept simualtion study and the use of a supervisory dynamic optimization strategy, the proposed framework can lead to significant savings (more than 18 % reduction) in operating costs. However, their research still focuses on local temperature (Zavala, et al. 2009) or tempearture and solar radiation predictions (Morari and Tödtli, 2008). The prediction of wind speed is not mentioned, which is a dominate factor for infiltration
calculations for residential buldings such as the Solar House. This is one of the issues that will be addreesed in this paper. Another important input parameter for MPC design, the number of occupants inside a space, is still an assumption such as a fixed schedule for most of the previous studies. Detection occupancy behaviour based on a single sensor or sensor network becomes an interesting topic for building scientists. Wang et al. (2005) applied Poisson process to generate daily occupancy profile in a single-occupied office based on PIR sensor data. Duong, et al. (2006) used hidden Semi Markov models for modelling and detecting activities of daily living such as cooking, eating, etc. in a home environment with a single occupant. Youngblood, et al. (2007) introduced a new method of automatically constructing hierarchical Hidden Markov Models (HMM) using the output of a sequential data-mining algorithm to estimate occupants’ moving patterns and thus control an office environment. Page, et al. (2007) targeted individual occupancy behaviour by developing a generalized stochastic model for the simulation of occupant presence in single occupied offices with derived probability distributions based on Markov chains. Most of the above studies focus on individual behaviour in a single occupied space. Dong, et al. (2010) applied HMM to estimate occupants’ behavior in four bays of a large scale open office based on a complex sensor network involving five different types of sensors. A later study by Dong and Lam (2011) combining Gausian Process and HMM shows better results and an energy saving of 18.5% is achieved if applied into building energy management based on the EnergyPlus simualtion results. This paper introduces an innovative building control approach, which integrates local weather forecasting (temperature, solar radiation and wind speed) with occupant behaviour detection (number of occupants and occupancy duration) into MPC design. The developed MPC is then implemented and tested in the Solar Decathlon House test-bed with over 100 sensor points measuring indoor environmental parameters such as temperature, relative humidity, CO2, lighting, motion and acoustics, and power consumption for electrical plugs, HVAC and lighting systems.
Proceedings of Building Simulation 2011: 12th Conference of International Building Performance Simulation Association, Sydney, 14-16 November.
- 193 -
METHODOLOGY
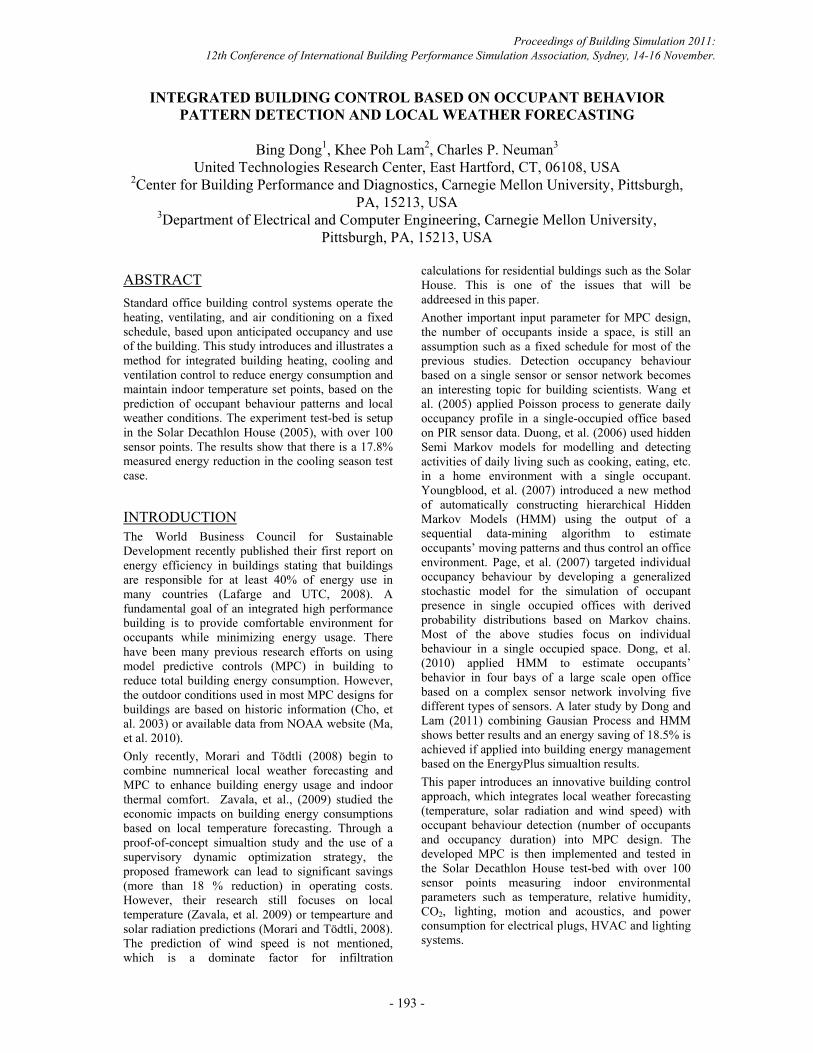
Figure 1 Overview of the methodology in this study
As shown in Figure 1, starting from the sensor network inside the house, the raw sensor data are inputs to the occupant pattern prediction model. The weather forecasting model simultaneously predicts outdoor temperature, solar radiation and wind speed (Jiang and Dong, 2010) for the next time horizon. The resultant weather and occupancy information are then inputs to the virtual building model in MATLAB/Simulink. The optimal control results from the virtual model are then implemented through LabVIEW on local HVAC actuators for pumps, water heater and fans. Hence, the methodology includes the following modules: sensor network, building and system model, local weather forecasting, parameter estimation, occupancy detection, building model, optimal control design and experiment set-up. Sensor network The house is equipped with a complex sensor network to measure and retrieves as much operational information as possible. Sample sensors are shown in Figure 2. There are three independent sensor networks.
LabVIEW based data acquisition system (DAQ), which measures the indoor temperature at different heights, RH and both indoor and outdoor CO2 levels with a sampling of one minute. All sensors are connected with DAQ and signals are transferred and stored through LabVIEW.
A wireless environmental sensor network, measures temperature, RH, lighting, acoustics and motion with a sampling time of one minute.
A Campbell Scientific CR1000 data logger system, connected with an outdoor local weather station (temperature, RH, wind speed, pyranometer) measures power metering for every electrical consumer such
as PV, HVAC, lighting and appliances as shown in Figure 3, with a sampling time of five seconds
All sensor data are fully integrated into a central database. Time synchronization is conducted when the data are retrieved from the central database.
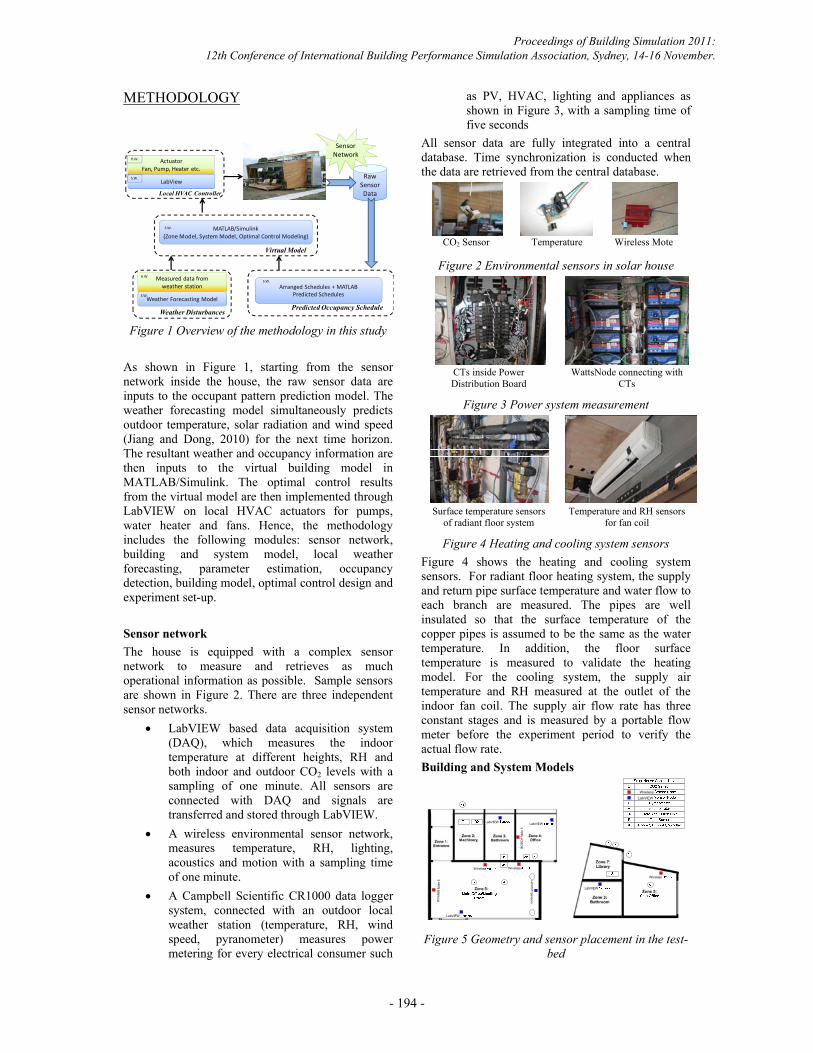
CO2 Sensor Temperature Wireless Mote
Figure 2 Environmental sensors in solar house
CTs inside Power Distribution Board
WattsNode connecting with CTs
Figure 3 Power system measurement
Surface temperature sensors of radiant floor system
Temperature and RH sensors for fan coil
Figure 4 Heating and cooling system sensors Figure 4 shows the heating and cooling system sensors. For radiant floor heating system, the supply and return pipe surface temperature and water flow to each branch are measured. The pipes are well insulated so that the surface temperature of the copper pipes is assumed to be the same as the water temperature. In addition, the floor surface temperature is measured to validate the heating model. For the cooling system, the supply air temperature and RH measured at the outlet of the indoor fan coil. The supply air flow rate has three constant stages and is measured by a portable flow meter before the experiment period to verify the actual flow rate. Building and System Models
Figure 5 Geometry and sensor placement in the test-
bed
RawSensorData
SensorNetwork
Virtual Model
Predicted Occupancy Schedule
MATLAB/Simulink(Zone Model, System Model, Optimal Control Modeling)
ActuatorFan, Pump, Heater etc.
H.W.
S.W.LabView
S.W.
Local HVAC Controller
S.W.
Measured data fromweather station
H.W.
Weather Forecasting ModelS.W.
Weather Disturbances
Arranged Schedules + MATLABPredicted Schedules
S.W.
BOSC
H M
ote
5
BOSC
H M
ote
6
NR
EL Sensors
Wireless
LabVIEW
LabVIEWLabVIEW
LabVIEW
LabVIEW
Wireless Wireless
Wire
less
LabVIEW
Wireless
Proceedings of Building Simulation 2011: 12th Conference of International Building Performance Simulation Association, Sydney, 14-16 November.
- 194 -

The heat transfer through external walls is modelled by the standard two capacitance and three resistance (2C3R) model (ASHRAE thermal network model) as shown in Figure 6.
Figure 6 Thermal network model of one external wall The heat balance for the outside surface is given by:
surfowall
osurfisurfosurfambo
osurfout Q
RTT
TTAhdt
dTC
(1)
The heat balance for the inside surface is given by:
surfiwall
isurfosurfisurfzonei
isurf QR
TTTTAh
dtdT
Cint
(2)
The heat balance for the zone air node is given by:
win
zoneambzoneisufistructure R
TTTTAhQ )()((3)
The solar radiation on the external and internal surfaces is:
solsurfo QQ (4)
intQQQ solsurfi(5)
The thermal resistance and capacity are defined as:
kAlR , and
2lAC
C p(6)
The energy balance in the zones shown in Figure 5 is:
adjzonesurface N
izonezonei
N
iistructure
zoneAMBzoneSUP
zonezoneair
TTQ
QTTmTTmdt
dTm
1_
intinfsup
_
)(
(7)
The cooling equipment in the solar house is provided by a multi-spit fan coil unit. The total amount of cooling energy into the space is represented by:
(8)
The total cool energy consumption is:
(9)
Local Weather forecasting model Local weather forecasting is important input parameters for building controls. Recently, researchers applied different artificial intelligence methods to predict temperature and solar radiation. Henze, et al. (2004) investigated the impact of forecasting accuracy on the predictive optimal control of active and passive building thermal storage system. The outdoor temperature forecasting models include bin, unbiased random walk, and seasonal integrated Autoregressive Moving Average (ARMA) predictors. Florita and Henze (2009) applied moving average and neural network models to predict the weather variables such as outdoor air temperature, relative humidity and global horizontal solar radiation seasonally in several geographical locations. In this study, the Hammerstein Wiener (HW) model and adaptive Gaussian process (AGP) method (Jiang and Dong, 2010) are introduced to predict outside dry-bulb temperature, global horizontal solar radiation and wind speed in the time magnitude of one hour and 15 minutes. Figure 7 presents an overview of the methods implemented in the local weather forecasting.
Figure 7 Overview of implemented weather
forecasting methods The HW model converts the nonlinear inputs into piecewise linear function blocks, and then into a nonlinear function as outputs. The Adaptive Gaussian Process (Jiang and Dong, 2010) is essentially data driven, which leverages non-parametric algorithms to locate and model relevant sub-sequences of observation adaptively. Although the idea of the proposed model also depends on learning from past samples, unlike the Markov approach of building transition probabilities, it considers the past data samples together during the prediction. The detailed algorithm is described in Jiang and Dong (2010).
R
C
1/hiA1/hoAR QsurfiQsurfo
C
Qstructure
Rwin
AMBT OSURT iSURT zoneT
it jit ft
OutdoorTemperature
HammersteinWienerModel
Wind Speed
HammersteinWienerModel
SolarRadiation
15minutes timestep for cooling
60minutes timestep for heating
Adaptive GP
Proceedings of Building Simulation 2011: 12th Conference of International Building Performance Simulation Association, Sydney, 14-16 November.
- 195 -

Parameter Estimation Thermal parameters, such as R and C numerical values, are not commonly available. Although some can be derived from construction drawings, the specific assemble of the construction could affect the external wall thermal properties. Hence, a parameter estimation approach is taken to identify thermal properties based on measured data. The building model presented in this study can be treated as a grey-box model. Braun and Chaturvedi (2002) developed a similar thermal network for load prediction. This inverse grey-box model needs one week of data to train with rich zone temperature variations or two to three weeks of data to train with limited zone temperatures variations. The model error can be limited within 2% with simulation data and 9% with on-site data. Wang and Xu (2006) developed a simplified model of the building thermal load on heat transfer of building envelope and internal mass. The parameters of building thermal network models for building envelope are determined by frequency characteristic analysis; the parameters of thermal network models for lumped internal mass are identified with a generic algorithm. McKinley and Aleyne, et al. (2008) presented an alternative approach using optimization search process (hill climbing algorithm) to identify building thermal model parameters and loads based on site measurement. In this study, considering this problem as a constrained nonlinear optimization, the subspace trust region solver based on the interior-reflective Newton method (Coleman and Li, 1996) is chosen, which is available in the MATLAB optimization toolbox. Occupancy detection model The occupancy detection model implemented in this study is adopted from Dong and Lam (2011). Gaussian Mixture Models (GMM) is used to categorize the changes of the selected features, which yielded the highest information gain in this context, according to different numbers of occupants in the zones. These categorizations are then used as observations for the Hidden Markov Model (HMM) to estimate number of occupants. To estimate the duration of occupants in the space, a Semi Markov Model was developed based on patterns of CO2, acoustics, motion and lighting changes (Dong, et al. 2009). The patterns are comprised by different single sensor events. Each single event is denoted with a code and an episode as a sequence of codes. Table 1 shows the code assignments. An example of an episode may be “agghheeg…”, which presents the activity of “low acoustics level CO2 increasing CO2 decreasing motion off-on CO2 increasing”. All parameter values used in the definitions are determined empirically for the test-bed environment used in this
study. Hence, these definitions are specifically for this study only and may not be applicable for other test-beds. Table 1 Definition of important events from sensors
Sensors State Transitions
Code Sensors State Transitions Code
Acoustics
1. Low acoustic level
a Motion
1. Off-on (motion) e
2. High acoustic level
b 2. On-off (no motion)
f
Lighting
1. Off-On c C
O2
1. Increasing g
2. On-off d 2. Decreasing h
Finally, the predicted occupancy schedules derived from occupant behaviour patterns together with existing known schedules from Outlook calendar are taken as dynamic inputs for the integrated control. Design of non-linear MPC In this study, a non-linear model predictive control (NMPC) is designed for the Solar House heating and cooling system following Magni, et al. (2003) and implemented in the test bed. The optimization problem becomes:
(10)
(11)
(12)
(13)
(14)
(15)
(16)
The specific problem presented above is a discrete time formulation of the general problem for HVAC control, which is an infinite time horizon control problem. It is converted into a finite time control problem with a moving horizon h at each time step. At the current time t, the initial conditions
are obtained as inputs into the plant model. At the same time, the optimization problem defined (10)-(16) is solved by dynamic programming. The results are the optimal control profile for HVAC systems and corresponding room temperature set-point . However, only the first step from t to t+1 of calculated is actually executed, which is defined in . Once is known at the next time step, the prediction horizon is shifted forward by one time step and the problem is solved again to find . The new is in principle different from because of the additional new information available. During the heating season, the moving time horizon h is 24 hours
Proceedings of Building Simulation 2011: 12th Conference of International Building Performance Simulation Association, Sydney, 14-16 November.
- 196 -

because the response time of radiant floor heating system is slow. However, during the cooling season, the moving horizon h is 3 hours (Coffey, 2008) because heat pump cooling is air-based which can cool down the space in 15 minutes.
Figure 8 Overview of the NMPC Design
Figure 8 shows the overall NMPC design. The plant model includes building thermal zone and building HVAC system models. The disturbances were from the real-time outdoor weather condition and indoor occupancy activities. is a vector of initial values. The NMPC is constructed from the plant and disturbances models and solved by dynamic programming. The output control signals are ideally implemented through a local PID controller, where the control signal is tuned based on disturbances received in real-time and track the optimized control set-point as close as possible. In this study, due to the lack of PID hardware in the controller, the PID is tuned and implemented through LabVIEW to local actuators directly on the relays of pumps. Experiment setup The data are continuously collected every one minute or one and half minutes (depending on the network latency) since April 28, 2009. The experiment is setup both for cooling and heating season as follows: 1) The heating season experiment is setup through the first week of February, 2010. The cooling season experiment is setup through the week from July 5 to July 10, 2010. In this paper, only results from cooling season are discussed. 2) The heating setpoint while occupied is 21 0C at day time with 17 0C set-back. The cooling setpoint while occupied is 25 0C, with 30 0C set-back. 3) During the heating season, the time step for control is 1 hour, while during cooling season, the time step for control is 15 minutes because the heat pump system can cool down the space from 29 0C to 25 0C in 15 minutes. 4) During the experimental period, the operable windows are all closed. Air infiltration happens only
through unintended openings (e.g. cracks between foundation and frame). 5) Building occupants vary during the daytime and include university staffs, the external visitors and students of School of Architecture. 6) All the training data set for occupancy and weather prediction is from the previous one month continuously collected data. DISCUSSION AND RESULT ANALYSIS Local weather forecasting
Figure 9 Results of 15-minute local outdoor air
temperature prediction from July 5 to July 10, 2010
Figure10 Results of 15-minute local global
horizontal solar radiation prediction from July 5 to July 10, 2010
Figure 11 Results of 15-minute local wind speed
prediction from July 5 to July 10, 2010 Figures 9-11 shows the results of hourly outdoor air temperature, global horizontal solar radiation and local wind speed prediction from July 5 to July 10, 2010. The RMSEs are 0.62, 60.02 and 0.37,
07/05 07/06 07/07 07/08 07/09 07/1020
22
24
26
28
30
32
34
36
Time (15 minutes)O
utsi
de A
ir Te
mpe
ratu
re (C
)
MeasuredPredicted with RMSE 0.62
Jul-05 00:00 Jul-06 00:00 Jul-07 00:00 Jul-08 00:00 Jul-09 00:00 Jul-10 00:000
100
200
300
400
500
600
700
800
900
1000
Time (15 minutes)
Glo
bal H
oriz
onta
l Sol
ar R
adia
tion
(W/m
2 )
Predicted with RMSE 60.02Measured
07/05 07/06 07/07 07/08 07/09 07/100
0.5
1
1.5
2
2.5
3
3.5
4
4.5
Time (15 minutes)
Win
d Sp
eed
(m/s
)
MeasuredPredicted with RMSE 0.37
Proceedings of Building Simulation 2011: 12th Conference of International Building Performance Simulation Association, Sydney, 14-16 November.
- 197 -
repectively. The MAPE is 8%, 25% and 12%. The maximum temperature difference is 1.5 0C and minimum is 0.2 0C. Bases on those results, it is believed that the prediction of disturbances from weather are accurate enough for NMPC. Occupancy patterns Occupancy number estimation
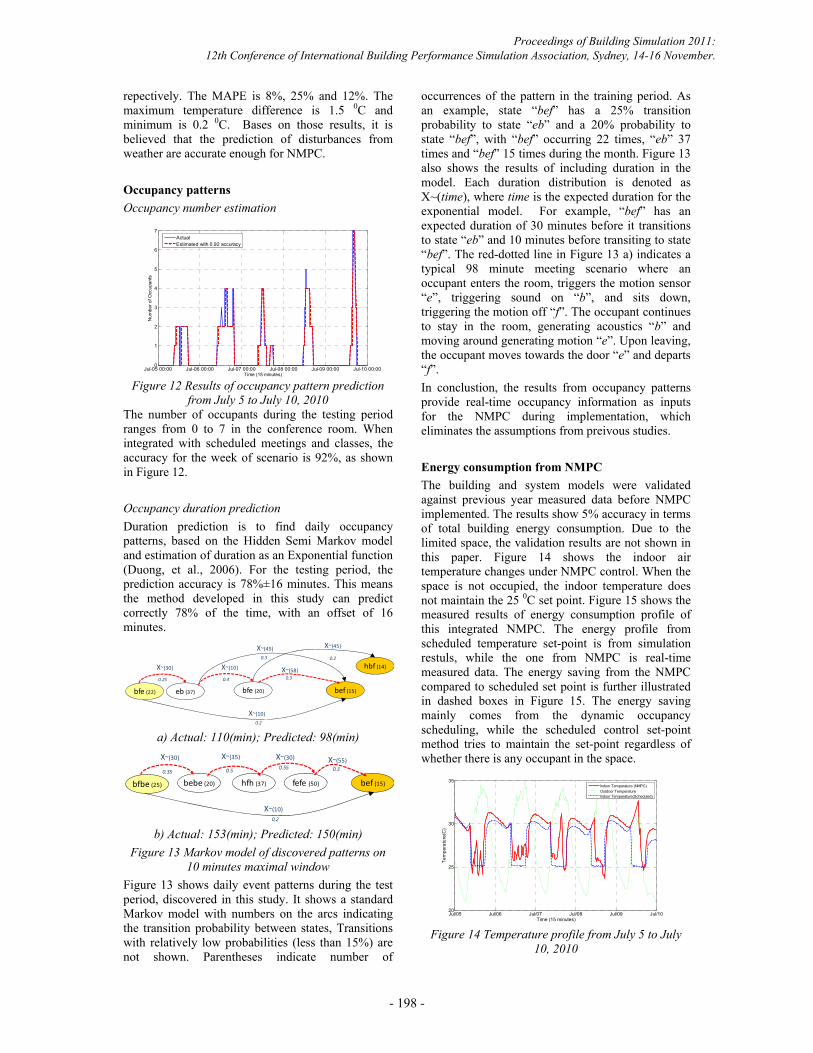
Figure 12 Results of occupancy pattern prediction
from July 5 to July 10, 2010 The number of occupants during the testing period ranges from 0 to 7 in the conference room. When integrated with scheduled meetings and classes, the accuracy for the week of scenario is 92%, as shown in Figure 12. Occupancy duration prediction Duration prediction is to find daily occupancy patterns, based on the Hidden Semi Markov model and estimation of duration as an Exponential function (Duong, et al., 2006). For the testing period, the prediction accuracy is 78%±16 minutes. This means the method developed in this study can predict correctly 78% of the time, with an offset of 16 minutes.
a) Actual: 110(min); Predicted: 98(min)
b) Actual: 153(min); Predicted: 150(min)
Figure 13 Markov model of discovered patterns on 10 minutes maximal window
Figure 13 shows daily event patterns during the test period, discovered in this study. It shows a standard Markov model with numbers on the arcs indicating the transition probability between states, Transitions with relatively low probabilities (less than 15%) are not shown. Parentheses indicate number of
occurrences of the pattern in the training period. As an example, state “bef” has a 25% transition probability to state “eb” and a 20% probability to state “bef”, with “bef” occurring 22 times, “eb” 37 times and “bef” 15 times during the month. Figure 13 also shows the results of including duration in the model. Each duration distribution is denoted as X~(time), where time is the expected duration for the exponential model. For example, “bef” has an expected duration of 30 minutes before it transitions to state “eb” and 10 minutes before transiting to state “bef”. The red-dotted line in Figure 13 a) indicates a typical 98 minute meeting scenario where an occupant enters the room, triggers the motion sensor “e”, triggering sound on “b”, and sits down, triggering the motion off “f”. The occupant continues to stay in the room, generating acoustics “b” and moving around generating motion “e”. Upon leaving, the occupant moves towards the door “e” and departs “f”. In conclustion, the results from occupancy patterns provide real-time occupancy information as inputs for the NMPC during implementation, which eliminates the assumptions from preivous studies. Energy consumption from NMPC The building and system models were validated against previous year measured data before NMPC implemented. The results show 5% accuracy in terms of total building energy consumption. Due to the limited space, the validation results are not shown in this paper. Figure 14 shows the indoor air temperature changes under NMPC control. When the space is not occupied, the indoor temperature does not maintain the 25 0C set point. Figure 15 shows the measured results of energy consumption profile of this integrated NMPC. The energy profile from scheduled temperature set-point is from simulation restuls, while the one from NMPC is real-time measured data. The energy saving from the NMPC compared to scheduled set point is further illustrated in dashed boxes in Figure 15. The energy saving mainly comes from the dynamic occupancy scheduling, while the scheduled control set-point method tries to maintain the set-point regardless of whether there is any occupant in the space.
Figure 14 Temperature profile from July 5 to July
10, 2010
Jul-05 00:00 Jul-06 00:00 Jul-07 00:00 Jul-08 00:00 Jul-09 00:00 Jul-10 00:000
1
2
3
4
5
6
7
Time (15 minutes)
Num
ber o
f Occ
upan
ts
ActualEstimated with 0.92 accuracy
bfe (22) eb (37)
0.3
bef (15)bfe (20)
0.3
0.25
hbf (14)0.2
0.2
X~(30) X~(58)
X~(10)
X~(45) X~(45)
X~(10)
0.4
bfbe (25) bebe (20)
0.3
bef (15)fefe (50)
0.550.35
0.2
X~(30) X~(55)
X~(10)
X~(30)X~(35)
0.5
hfh (37)
Jul/05 Jul/06 Jul/07 Jul/08 Jul/09 Jul/1020
25
30
35
Time (15 minutes)
Tem
pera
ture
(C)
Indoor Temperature (NMPC)Outdoor TemperatureIndoor Temperature(Scheduled)
Proceedings of Building Simulation 2011: 12th Conference of International Building Performance Simulation Association, Sydney, 14-16 November.
- 198 -
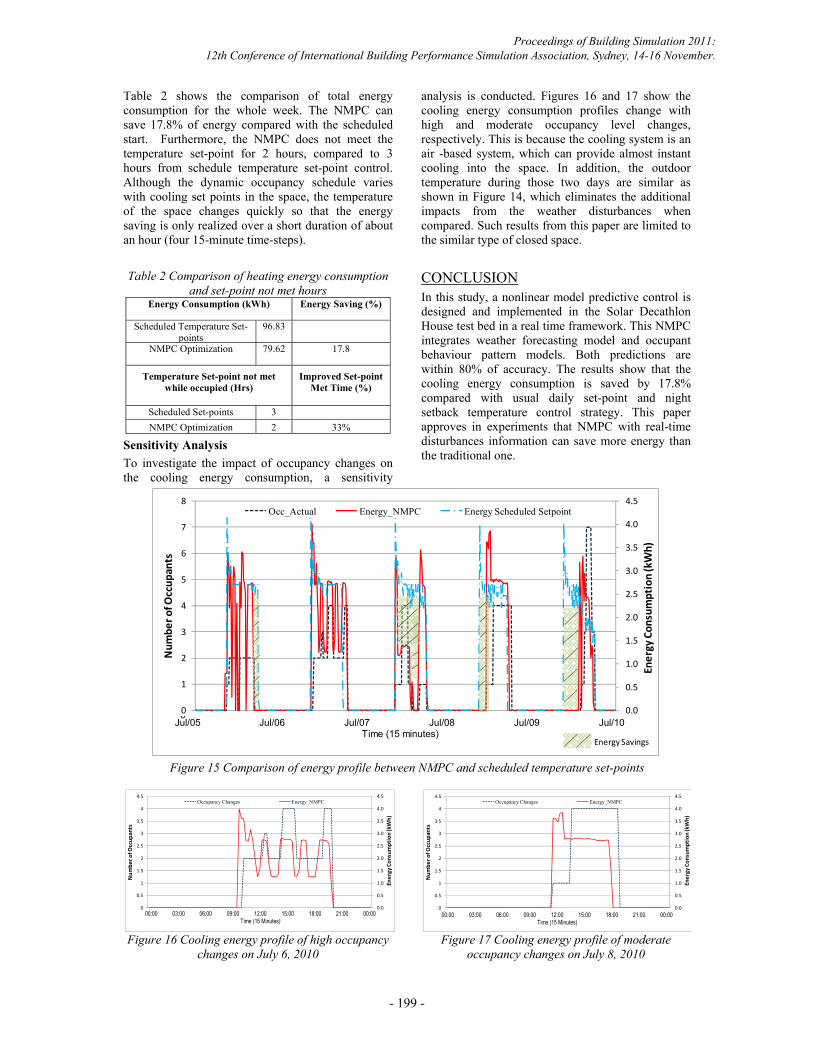
Table 2 shows the comparison of total energy consumption for the whole week. The NMPC can save 17.8% of energy compared with the scheduled start. Furthermore, the NMPC does not meet the temperature set-point for 2 hours, compared to 3 hours from schedule temperature set-point control. Although the dynamic occupancy schedule varies with cooling set points in the space, the temperature of the space changes quickly so that the energy saving is only realized over a short duration of about an hour (four 15-minute time-steps). Table 2 Comparison of heating energy consumption
and set-point not met hours Energy Consumption (kWh) Energy Saving (%)
Scheduled Temperature Set-points
96.83
NMPC Optimization 79.62 17.8
Temperature Set-point not met while occupied (Hrs)
Improved Set-point Met Time (%)
Scheduled Set-points 3 NMPC Optimization 2 33%
Sensitivity Analysis To investigate the impact of occupancy changes on the cooling energy consumption, a sensitivity
analysis is conducted. Figures 16 and 17 show the cooling energy consumption profiles change with high and moderate occupancy level changes, respectively. This is because the cooling system is an air -based system, which can provide almost instant cooling into the space. In addition, the outdoor temperature during those two days are similar as shown in Figure 14, which eliminates the additional impacts from the weather disturbances when compared. Such results from this paper are limited to the similar type of closed space.
CONCLUSION In this study, a nonlinear model predictive control is designed and implemented in the Solar Decathlon House test bed in a real time framework. This NMPC integrates weather forecasting model and occupant behaviour pattern models. Both predictions are within 80% of accuracy. The results show that the cooling energy consumption is saved by 17.8% compared with usual daily set-point and night setback temperature control strategy. This paper approves in experiments that NMPC with real-time disturbances information can save more energy than the traditional one.
Figure 15 Comparison of energy profile between NMPC and scheduled temperature set-points
Figure 16 Cooling energy profile of high occupancy changes on July 6, 2010
Figure 17 Cooling energy profile of moderate occupancy changes on July 8, 2010
0.0
0.5
1.0
1.5
2.0
2.5
3.0
3.5
4.0
4.5
0
1
2
3
4
5
6
7
8
Energy
Consum
ption(kWh)
Num
bero
fOccup
ants
Occ_Actual Energy_NMPC Energy Scheduled Setpoint
Jul/05 Jul/06 Jul/07 Jul/08 Jul/09 Jul/100
Time (15 minutes)
Energy Savings
0.0
0.5
1.0
1.5
2.0
2.5
3.0
3.5
4.0
4.5
0
0.5
1
1.5
2
2.5
3
3.5
4
4.5
Energy
Consum
ption(kWh)
Num
bero
fOccup
ants
Occupancy Changes Energy_NMPC
00:00 03:00 06:00 09:00 12:00 15:00 18:00 21:00 00:000
Time (15 Minutes)
0.0
0.5
1.0
1.5
2.0
2.5
3.0
3.5
4.0
4.5
0
0.5
1
1.5
2
2.5
3
3.5
4
4.5
Energy
Consum
ption(kWh)
Num
bero
fOccup
ants
Occupancy Changes Energy_NMPC
00:00 03:00 06:00 09:00 12:00 15:00 18:00 21:00 00:000
Time (15 Minutes)
Proceedings of Building Simulation 2011: 12th Conference of International Building Performance Simulation Association, Sydney, 14-16 November.
- 199 -

NOMENCLATURE
oh
surface heat transfer coefficient [W/m2,ºC]
A wall or window surface area [m2] k thermal conductivity of surface [W/m, ºC]
density of the surface material [kg/m3]
C heat capacitance [J/m3·K]
R yhermal resistance [K·m2/W]
isurfT
inside surface temperature [ºC]
osurfT
outside surface temperature [ºC]
zoneT
zone air temperature [ºC];
SUPT supply air temperature [ºC];
supm
supply air mass flow rate [kg/s];
infm infiltration mass flow rate [kg/s];
intQ
convective internal loads[W];
surfoQ
outside surface absorbed solar radiation [W]
surfiQ inside surface absorbed solar radiation [W]
cost function of NMPCheat transfer functions
REFERENCES Braun, J. and N. Chaturvedi. 2002. An inverse gray-
box model for transient building load prediction. HVACR Research : 8, 72~99.
Cho, S.H. and M. Zaheer-uddin. 2003. Predictive control of intermittently operated radiant floor heating systems, Energy Conservation and Management Vol.44(8), pp. 1333–1342.
Coleman, T.F. and L. Yuying. 1994. On the convergence of interior-reflective Newton methods for nonlinear minimization subject to bounds. Mathematical Programming. Vol. 67, pp 189-224.
Duong, T.V., D.Q. Phung, H.H. Bui, and S. Venkatesh, 2006. Behavior Recognition with Generic Exponential Family Duration Modeling in the Hidden Semi-Markov Model. In Proceedings of the 18th international Conference on Pattern Recognition. Vol. 3.
Dong, B., B. Andrews, K.P. Lam, M. Höynck, . Y.S. Chiou, R. Zhang and D. Benitez. 2010. An Information Technology Enabled Sustainability Test-Bed (ITEST) For Occupancy Detection through an Environmental Sensing Network. Energy and Buildings. Vol.42 (7), pp. 1038-1046.
Dong, B. and K.P. Lam. 2011. Building Energy and Comfort Management through Occupant Behaviour Pattern Detection Based On a Large-Scale Environmental Sensor Network. Journal of Building Performance Simualtion. In Press.
Dong, B. and B. Andrew. 2009. Sensor-based Occupancy Behavioral Pattern Recognition for Energy and Comfort Management in Intelligent Buildings. Proceedings of Building Simulation ’2009, an IBPSA Conference, Glasgow, U.K.
Henze, G.P., F. Clemens and K. Gottfried. 2004. Evaluation of optimal control for active and passive building thermal storage. International Journal of Thermal Sciences. Vol. 43: 173-183.
Jiang, X.Q. and Dong, B. Adaptive Gaussian Process for Short-Term Wind Speed Forecasting Proceedings of 19th European Conference on Artificial Intelligence. Lisbon, Portugal.September, 2010
Florita, A. R. and G. P. Henze. 2009. Comparison of Short-Term Weather Forecasting Models for Model Predictive Control. HVAC&R, Vol. 15(5).
Ma, Y. F. Borrelli, B. Hencey, A. Packard and S. Bortoff. 2009. Model predictive control of thermal energy storage in building cooling systems. 48th IEEE Conference on Decision and Control.
Magni, L. G.D. Nicolao, R. Scattolini1, and F. Allgöwer. 2003. Robust model predictive control for nonlinear discrete-time systems. Internal Journal of Robust and Nonlinear Control. Vol.13 (4). pp.229-246.
McKinley, T. and A. Alleyne. 2008. Identification of building model parameters and loads using on-site data logs. SimBuild. 2008.
Morari, M. and J. Tödtli, 2008. Weather forecasts enhance comfort and save energy, Smart Energy Strategies 2008 Conference, Meeting the Climate Change Challenge, 8-10 September 2008, ETH Zurich.
Page, J., D. Robinson, N. Morel and J.L. Scartezzini. 2007. A Generalised Stochastic Model For The Simulation Of Occupant Presence. Energy and Buildings. Vol. 40 (2). pp. 83-98.
Wang, D., C. Federspiel and F. Rubinstein. 2005. Modelling Occupancy in Single Person Offices. Energy and Buildings 37: 121-126.
Wang, S.W. and X. Xu. 2006. Simplified building model for transient thermal performance estimation using GA-based parameter identification. International Journal of Thermal Sciences 45.
Youngblood, G.M. and D. Cook. 2007. Data Mining for Hierarchical Model Creation. IEEE Transactions on system, man and cybernetics. Vol. 37, No.4.
Zavala, V. M., E. M. Constantinescu, T. Krause, and M. Anitescu. 2009.Weather Forecast-Based Optimization of Integrated Energy Systems. Argonne National Laboratory, ANL/MCS-TM-305.
Proceedings of Building Simulation 2011: 12th Conference of International Building Performance Simulation Association, Sydney, 14-16 November.
- 200 -