integrated inventory ranking system for oilfield equipment
TRANSCRIPT
Journal of Industrial Engineering and ManagementJIEM, 2014 – 7(1): 115-136 – Online ISSN: 2013-0953 – Print ISSN: 2013-8423
http://dx.doi.org/10.3926/jiem.511
Integrated Inventory Ranking System for Oilfield Equipment Industry
Jalel Ben Hmida, Siddharth Parekh, Jim Lee
University of Louisiana at Lafayette (United States)
j [email protected], [email protected], [email protected]
Received: July 2012Accepted: January 2014
Abstract:
Purpose: This case study is motivated by the subcontracting problem in an oilfield equipment
and service company where the management needs to decide which parts to manufacture in-
house and which parts to purchase from suppliers when the capacity is not enough to make all
required parts. A higher level quality can be achieved for the parts manufactured in house and
the lead time can also be well controlled. Currently the company is making subcontracting
decisions based on management’s experience.
Design/methodology/approach: Working with the management, a Decision Support System
(DSS) is developed to rank parts by integrating three inventory classification methods
considering two quantitative factors including cost and demand, and one qualitative factor
based on management experience. The proposed integrated inventory ranking procedure will
make use of three classification methods: ABC based on cost, FSN based on demand, and
VED based on management experience.
Findings: An integration mechanism using weights is developed to rank the parts based on the
total priority scores. The ranked list generated by the system helps management to identify the
most critical parts to manufacture in-house.
Originality/value: The integration of all three inventory classification techniques, covering
both quantitative and qualitative factors, into a single system is a unique feature of this research.
-115-
Journal of Industrial Engineering and Management – http://dx.doi.org/10.3926/jiem.511
is important as it provides a more inclusive, big picture view of the DSS for management’s use
in making business decisions.
Keywords: inventory management, inventory classification methods, ABC, FSN, VED, subcontracting,
decision support system
1. Introduction
Inventory management is important for the successful operation of most industries due to the
amount of money inventory represents. Due to the variation in product demand, the industry
may not be able to manufacture all the necessary parts on time. In this case, subcontracting
becomes vital in order to avoid shortage and to maintain continuity in the manufacturing
process.
Subcontracting is defined as “a situation where the firm offering the subcontract requests
another independent enterprise to undertake the production or carry out the processing of a
material, component, part or subassembly for it according to specifications or plans provided
by the firm offering the subcontract” (Holmes, 1986). When the available capacity is not
enough, a decision has to be made about what parts should be manufactured in-house and
what parts should be subcontracted. The growing pressures of time-based global competition
have led to the recognition of subcontracting as an important contributor to the competitive
advantage of the firm (Kumar & Wilson, 2009).
Manufacturing industries typically deal with thousands of parts and many suppliers. Extensive
research has been done on the selection of suppliers or subcontractors (Krause, Handfield &
Scannell, 1998; Carr & Pearson, 1999; Ferrer, 2003; Li, Murat & Huang, 2009) and supplier
uncertainty (Petrovic, Petrovic & Rajat, 1998; Hillier 2002; Yang, Ronald & Chu, 2005; Kim,
Chatfield, Harrison & Hayya, 2006; Mohebbi & Hao, 2006). However, in-depth research in
identifying which parts to manufacture in-house or subcontract is not common.
Several approaches have been used in the industries for make-or-buy decisions. The first
approach is to manufacture the parts with early due dates and subcontract the ones that would
not be possible to manufacture within the time frame. The problem with this approach is that
the productivity of the plant decreases because different setups are used for different parts.
Another approach that is being followed in the industries is to manufacture the parts that have
similar setups to the part that is currently being manufactured, and subcontract the rest. Even
though this approach increases the productivity of the plant, the inventory levels may go up
(Atamtürk & Hochbaum, 2001).
-116-

Journal of Industrial Engineering and Management – http://dx.doi.org/10.3926/jiem.511
The third approach is to prioritize the inventory by using general inventory classification
methods. Inventory classification is a crucial element in the operation of any production
company. Because of the huge number of inventory items in many companies, great attention is
directed to inventory classification into the different classes, which consequently require the
application of different management tools and policies (Chase, Jacobs, Aquilano & Agarwal,
2006).
ABC analysis is one of the most commonly employed inventory classification techniques.
Conventional ABC classification was developed for use by General Electric during the 1950s.
The classification scheme is based on the Pareto principle, or the 80/20 rule, that employs the
following rule of thumb: ‘‘vital few and trivial many.” The process of ABC analysis classifies
inventory items into A, B, or C categories based on so-called annual dollar usage. Annual dollar
usage is calculated by multiplying the dollar value per unit by the annual usage rate (Cohen &
Ernst, 1988; Partovi & Anandarajan, 2002). Inventory items are then arranged according to
the descending order of their annual dollar usage. Class A items are relatively small in number,
but account for the greatest amount of annual dollar usage. In contrast, class C items are
relatively large in number, but make up a rather small amount of annual dollar usage. Items
between classes A and C are categorized as class B.
Chen, Li and Liu (2008) examines several multiple criteria ABC analysis procedures which have
been criticized for its exclusive focus on dollar usage. Other criteria such as lead-time,
commonality, obsolescence, durability, inventory cost, and order size requirements have also
been recognized as critical for inventory classification (Flores & Whybark, 1987; Jamshidi & Jain,
2008; Ng, 2007; Ramanathan, 2006). In order to accommodate multi-criteria inventory
classification, many researchers have proposed methods that consider factors other than annual
dollar usage. Flores and Whybark (1987) developed a cross-tabulation matrix method for use in
bi-criteria inventory classification; they found that the method becomes increasingly complicated
when three or more criteria are involved in evaluations. Flores, Olson and Dorai (1992) have
proposed the use of joint criteria matrix for two criteria. Analytic hierarchy process (AHP)
developed by Saaty (1980) has been successfully applied to multi-criteria inventory classification
by Flores et al. (1992). The advantage of the AHP is that it can incorporate many criteria and
ease of use on a massive accounting and measurement system, but its shortcoming is that a
significant amount of subjectivity is involved in pairwise comparisons of criteria. They have used
the AHP to reduce multiple criteria to one consistent measure. Hadi-Vencheh (2010) proposed a
simple nonlinear programming model, which determines a common set of weights for all the
items. Yu (2011) compared artificial-intelligence (AI)-based classification techniques with
traditional multiple discriminant analysis (MDA).
Kabir and Hasin (2012) developed an improved multi-criteria inventory classification model
using Fuzzy Analytic hierarchy process (FAHP) approach. Although the FAHP approach proved
to be a convenient method in tackling practical multi-criteria decision making problems an
-117-
Journal of Industrial Engineering and Management – http://dx.doi.org/10.3926/jiem.511
improvement could be done in the determination of the weights of each component to handle
uncertainties in the decision making.
Larson (1980) proposed a method FSN to classify parts as fast-moving (F), slow-moving (S) or
non-moving (N) based on demand. Mukhopadhyay, Pathak and Guddu (2003) proposed VED
method to classify parts as Vital (V), Essential (E), or Desired (D). The integration of ABC with
other factors has been considered by several studies. ABC is integrated with a mixed integer
program (MIP) in Kirche & Srivastava (2005) for order management. Bhattachaya, Sarkar and
Mukherjee (2007) developed a procedure based on ABC and perishability of items. Hincapie,
Lee and Emblom (2011) developed a decision support system which ranks component parts by
integrating multi-criteria classification methods. The decision is to manufacture the parts that
have the highest priority. Nahmias and Demmy (1981) modeled a system which maintains
inventory to meet both high priority and low priority demands. They evaluated the control
structure such that various methods of comparing refill rates may be developed both when
rationing of the reorder point, quantity, and support level is and is not in effect.
Among the three general classification methods, ABC focuses on cost and FSN focuses on demand.
Both ABC and FSN are quantitative methods and do not take into account the perceived
importance of the part in the eyes of the manager. VED allows the management to assign parts
priority subjectively, but it does not fully utilize the available inventory data. The problem of these
classification methods is that no one considers the integration of both quantitative (ABC and FSN)
and qualitative factors (VED) in one model. An integrated approach needs to be developed that
can rank the inventory based on multiple criteria, taking into account both quantitative and
qualitative factors. Once this new approach is developed, a Decision Support System (DSS) can be
implemented to rank the inventory. A DSS is defined as a class of information systems that
support decision-making activities (Holsapple & Whinston, 1996). Various DSS’s have been
developed for inventory management. Sadrian and Yoon (1994) developed a Procurement Decision
Support System (PDSS) to improve the procurement practices of a company. Ronen & Trietsch
(1988) developed a DSS for purchasing components and materials for large projects taking into
account lateness penalties. Walker (2000) developed of a decision support tool for the single-
period inventory problem. DSS using simulation (Bed & Nagarur, 1994), stochastic sampling
(Jeong, Leon & Villaboros, 2007), and fuzzy logic (Lan, Ding & Hong, 2005; Zeydan & Colpan,
2009) have also been developed to deal with various manufacturing applications, but none of
these systems addresses the problem of ranking parts for subcontracting or manufacturing in-
house decisions using both quantitative and qualitative factors.
This case study is motivated by the subcontracting problem in an oilfield equipment and service
industry. Currently the company is making subcontracting decisions based on management’s
experience without using any data, and discussion with the management indicates that both
quantitative and qualitative factors are important. Our objective of this case study is to 1) develop
an integrated inventory ranking procedure that takes into account both quantitative factors such as
-118-
Journal of Industrial Engineering and Management – http://dx.doi.org/10.3926/jiem.511
cost and demand, and qualitative factors such as functionality, efficiency, and manufacturing
expertise or quality; and 2) develop a DSS to implement the integrated inventory ranking
procedure and produce a ranked list to help the management in make-or-buy decisions.
The proposed integrated inventory ranking procedure will make use of three classification
methods: ABC, FSN, and VED. Based on our discussion with the management and review of
existing inventory data, we believe that the integration of the three methods will provide useful
information to make subcontracting decision. At the same time, our DSS is designed in a
modular fashion which can be modified to add more classification methods. Section 2 of this
paper provides the logic we follow to implement each of the three inventory classification
methods. Section 3 presents the integration mechanism and the theory foundation of our
integrated procedure. The development of a DSS to implement our procedure is discussed in
section 4. In section 5, the case study is performed using real data from the oilfield equipment
and service industry. Using the DSS, the company developed a ranked list of about 50 critical
parts to be manufacture in-house. Our concluding remarks are given in section 6.
2. Inventory classification methods
The proposed integrated inventory ranking procedure uses three classification methods: ABC,
FSN, and VED. The ABC and FSN methods consider quantitative factors such as cost and
demand, and the VED focuses on qualitative factors such as functionality, efficiency or quality.
All the qualitative factors have cost implications. When the cost is difficult to estimate, VED
allows management to subjectively assign a class based on past experience. An illustrative
example of the application of each of these classification schemes in our research is given in
the sections below.
2.1. ABC classification
The ABC classification ranks the parts based on their dollar usage value in a given period. The
high value parts (about 20%) are classified as A, the middle value parts (about 30%) are
classified as B, and the lower value parts are classified as C. The procedure used in our study
to perform the classification entails the following steps:
1. Compute quantity and dollar usage of each item from inventory data.
Dollar usage of each item = Quantity * Unit Cost
2. Arrange parts in descending order based upon the dollar usage values.
-119-
Journal of Industrial Engineering and Management – http://dx.doi.org/10.3926/jiem.511
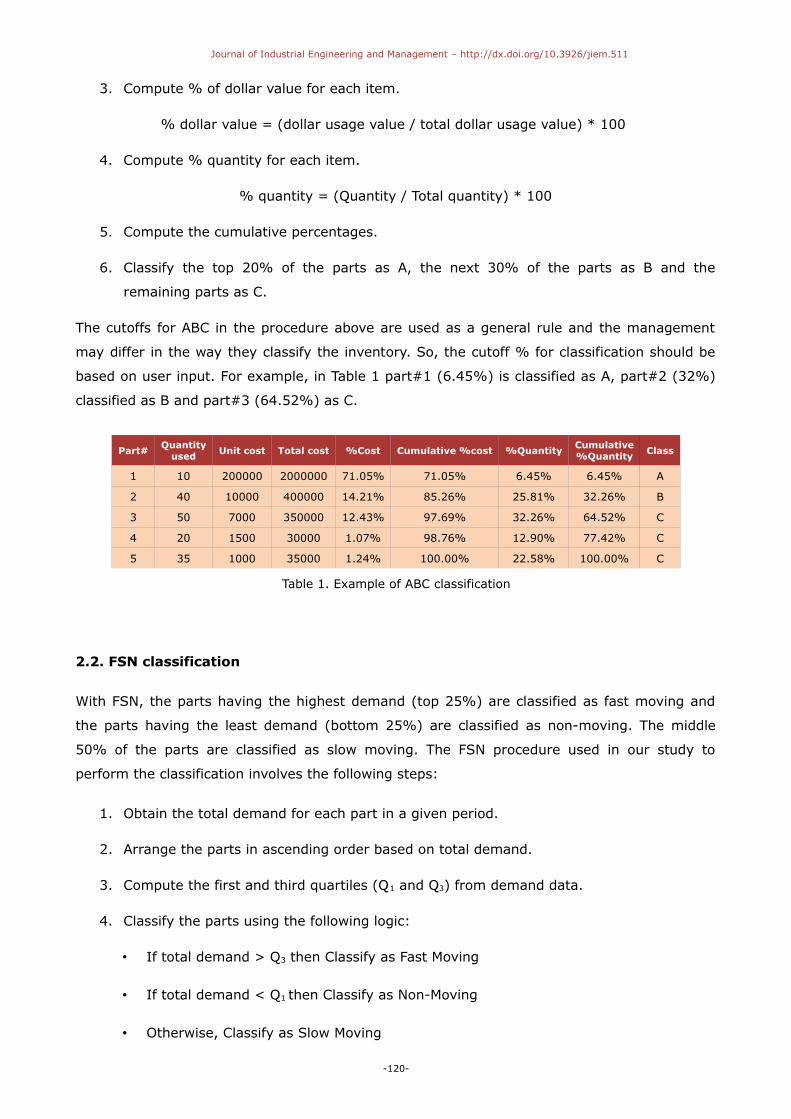
3. Compute % of dollar value for each item.
% dollar value = (dollar usage value / total dollar usage value) * 100
4. Compute % quantity for each item.
% quantity = (Quantity / Total quantity) * 100
5. Compute the cumulative percentages.
6. Classify the top 20% of the parts as A, the next 30% of the parts as B and the
remaining parts as C.
The cutoffs for ABC in the procedure above are used as a general rule and the management
may differ in the way they classify the inventory. So, the cutoff % for classification should be
based on user input. For example, in Table 1 part#1 (6.45%) is classified as A, part#2 (32%)
classified as B and part#3 (64.52%) as C.
Part#Quantity
used Unit cost Total cost %Cost Cumulative %cost %QuantityCumulative%Quantity Class
1 10 200000 2000000 71.05% 71.05% 6.45% 6.45% A
2 40 10000 400000 14.21% 85.26% 25.81% 32.26% B
3 50 7000 350000 12.43% 97.69% 32.26% 64.52% C
4 20 1500 30000 1.07% 98.76% 12.90% 77.42% C
5 35 1000 35000 1.24% 100.00% 22.58% 100.00% C
Table 1. Example of ABC classification
2.2. FSN classification
With FSN, the parts having the highest demand (top 25%) are classified as fast moving and
the parts having the least demand (bottom 25%) are classified as non-moving. The middle
50% of the parts are classified as slow moving. The FSN procedure used in our study to
perform the classification involves the following steps:
1. Obtain the total demand for each part in a given period.
2. Arrange the parts in ascending order based on total demand.
3. Compute the first and third quartiles (Q1 and Q3) from demand data.
4. Classify the parts using the following logic:
• If total demand > Q3 then Classify as Fast Moving
• If total demand < Q1 then Classify as Non-Moving
• Otherwise, Classify as Slow Moving
-120-
Journal of Industrial Engineering and Management – http://dx.doi.org/10.3926/jiem.511
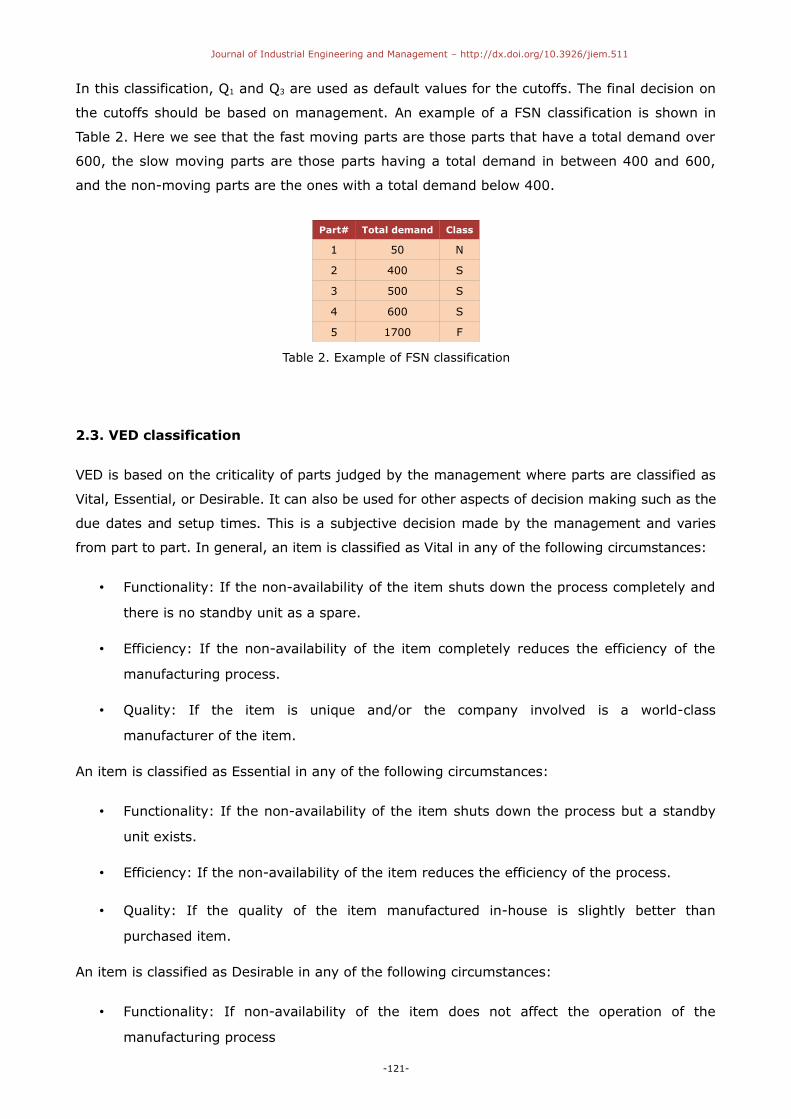
In this classification, Q1 and Q3 are used as default values for the cutoffs. The final decision on
the cutoffs should be based on management. An example of a FSN classification is shown in
Table 2. Here we see that the fast moving parts are those parts that have a total demand over
600, the slow moving parts are those parts having a total demand in between 400 and 600,
and the non-moving parts are the ones with a total demand below 400.
Part# Total demand Class
1 50 N
2 400 S
3 500 S
4 600 S
5 1700 F
Table 2. Example of FSN classification
2.3. VED classification
VED is based on the criticality of parts judged by the management where parts are classified as
Vital, Essential, or Desirable. It can also be used for other aspects of decision making such as the
due dates and setup times. This is a subjective decision made by the management and varies
from part to part. In general, an item is classified as Vital in any of the following circumstances:
• Functionality: If the non-availability of the item shuts down the process completely and
there is no standby unit as a spare.
• Efficiency: If the non-availability of the item completely reduces the efficiency of the
manufacturing process.
• Quality: If the item is unique and/or the company involved is a world-class
manufacturer of the item.
An item is classified as Essential in any of the following circumstances:
• Functionality: If the non-availability of the item shuts down the process but a standby
unit exists.
• Efficiency: If the non-availability of the item reduces the efficiency of the process.
• Quality: If the quality of the item manufactured in-house is slightly better than
purchased item.
An item is classified as Desirable in any of the following circumstances:
• Functionality: If non-availability of the item does not affect the operation of the
manufacturing process
-121-
Journal of Industrial Engineering and Management – http://dx.doi.org/10.3926/jiem.511
• Efficiency: If non-availability of the item does not significantly affect the efficiency of
the process.
• Quality: If the quality of the item manufactured in-house is no better than purchased
item.
Once the three classifications are done, a method for combining them is needed. The different
methods of combining the classifications along with their analyses are discussed in the next
section.
3. Integrated inventory ranking procedure
In ranking the importance of parts, several factors must be considered. When three
classification methods are integrated, it is possible that the management feels that the levels
of importance of the three methods are different. Weights can then be assigned to the
methods and they may change from one industry to the other. The integrated mechanism that
this DSS introduces lets the user (i.e., management) decide what factors are of importance
and in what order. So, if qualitative factors need to have higher priority than quantitative
factors, higher weights need to be assigned to VED compared to ABC and FSN. Providing the
management an option to choose which factor is most important in his/her scenario is a key
design objective of our DSS. A good DSS also needs to have the flexibility and capability to
answer “what if” questions.
While the factors considered in the classification methods are not mutually independent, the
three classification methods may assign different priority scores to the same part, resulting in
three different ranked lists. For example, if the part with the highest demand is the most
expensive part, then both FSN and ABC will assign the part with high priority. If the cost to
make the part is relatively low but demand is high, then this part may not receive high priority
based on ABC. A part with low demand and low cost may also be classified as “Vital” under
VED if the quality of the part manufactured in-house is significantly better than purchased from
subcontractor.
The notation that would be followed to indicate the priority levels for ABC, FSN, and VED
classifications respectively is [ABC, FSN, VED]. If we consider three priority levels for the
purpose of integration, then a total of 27 different combinations (33) are possible which can be
generalized into 3 categories:
• Identical priority levels for all classifications (e.g., [1,1,1])
• Mixed priority levels for all classifications (e.g., [1,1,2])
• Distinct priority levels for all classifications (e.g., [2,1,3])
-122-
Journal of Industrial Engineering and Management – http://dx.doi.org/10.3926/jiem.511
3.1. Integration mechanisms
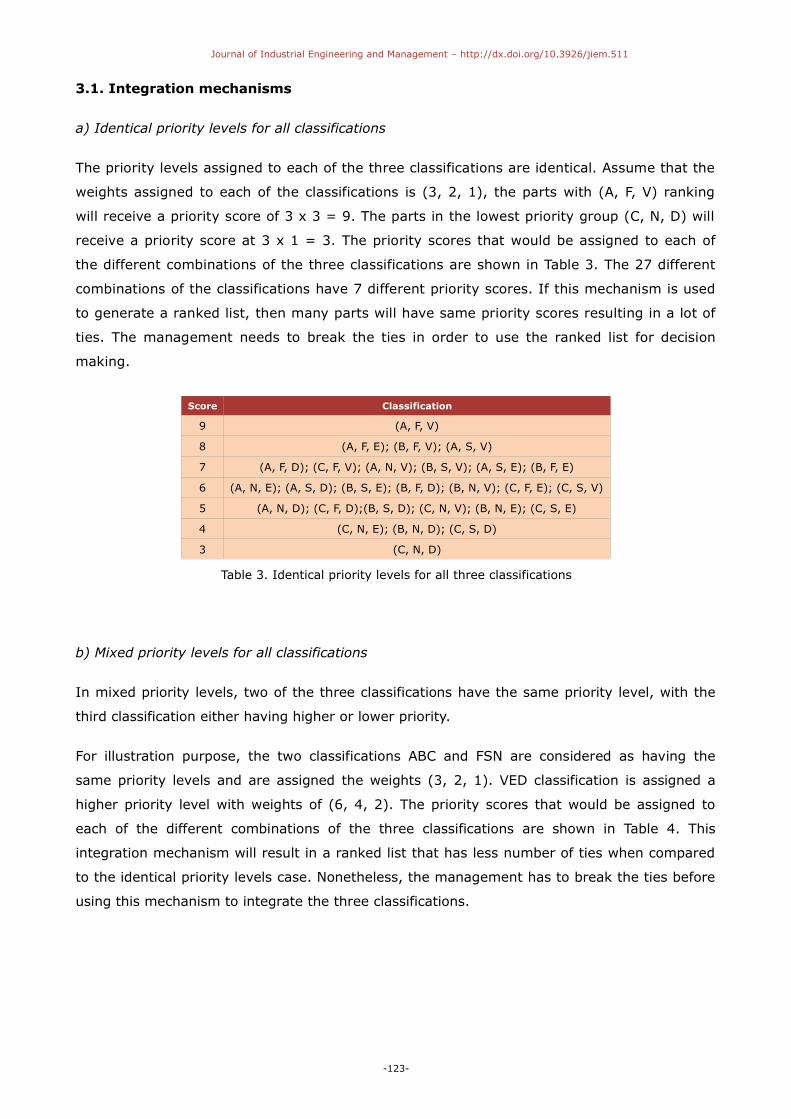
a) Identical priority levels for all classifications
The priority levels assigned to each of the three classifications are identical. Assume that the
weights assigned to each of the classifications is (3, 2, 1), the parts with (A, F, V) ranking
will receive a priority score of 3 x 3 = 9. The parts in the lowest priority group (C, N, D) will
receive a priority score at 3 x 1 = 3. The priority scores that would be assigned to each of
the different combinations of the three classifications are shown in Table 3. The 27 different
combinations of the classifications have 7 different priority scores. If this mechanism is used
to generate a ranked list, then many parts will have same priority scores resulting in a lot of
ties. The management needs to break the ties in order to use the ranked list for decision
making.
Score Classification
9 (A, F, V)
8 (A, F, E); (B, F, V); (A, S, V)
7 (A, F, D); (C, F, V); (A, N, V); (B, S, V); (A, S, E); (B, F, E)
6 (A, N, E); (A, S, D); (B, S, E); (B, F, D); (B, N, V); (C, F, E); (C, S, V)
5 (A, N, D); (C, F, D);(B, S, D); (C, N, V); (B, N, E); (C, S, E)
4 (C, N, E); (B, N, D); (C, S, D)
3 (C, N, D)
Table 3. Identical priority levels for all three classifications
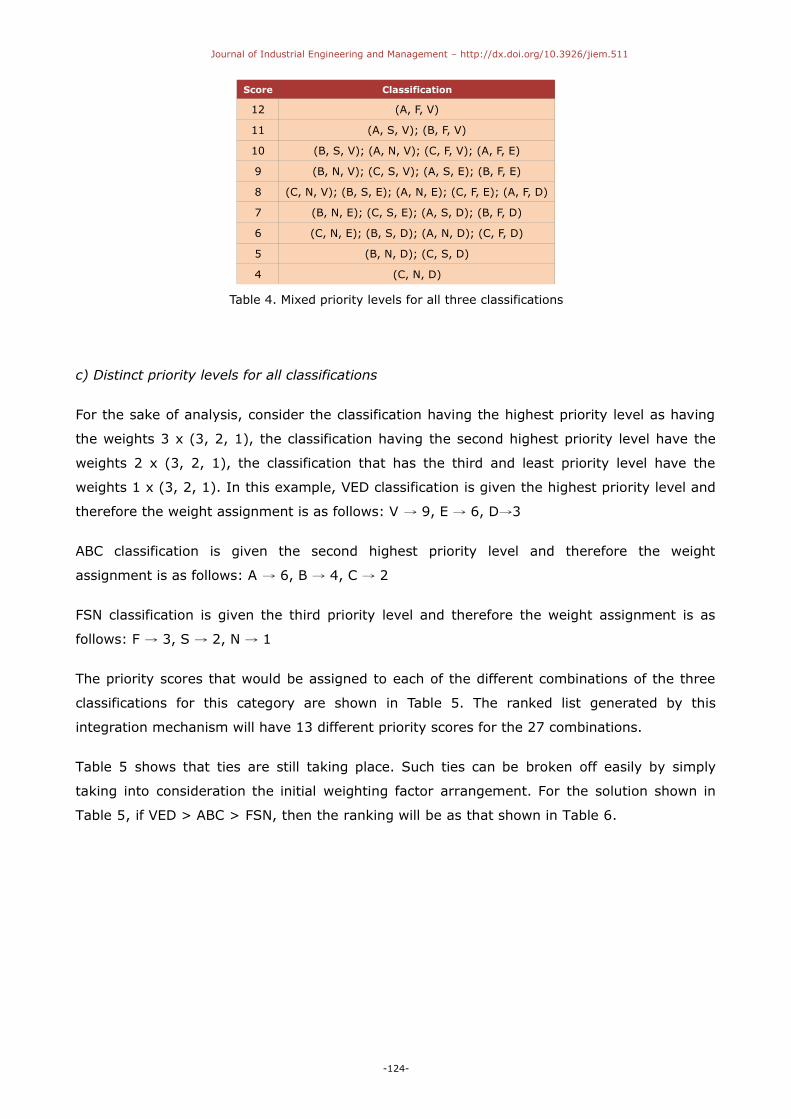
b) Mixed priority levels for all classifications
In mixed priority levels, two of the three classifications have the same priority level, with the
third classification either having higher or lower priority.
For illustration purpose, the two classifications ABC and FSN are considered as having the
same priority levels and are assigned the weights (3, 2, 1). VED classification is assigned a
higher priority level with weights of (6, 4, 2). The priority scores that would be assigned to
each of the different combinations of the three classifications are shown in Table 4. This
integration mechanism will result in a ranked list that has less number of ties when compared
to the identical priority levels case. Nonetheless, the management has to break the ties before
using this mechanism to integrate the three classifications.
-123-
Journal of Industrial Engineering and Management – http://dx.doi.org/10.3926/jiem.511
Score Classification
12 (A, F, V)
11 (A, S, V); (B, F, V)
10 (B, S, V); (A, N, V); (C, F, V); (A, F, E)
9 (B, N, V); (C, S, V); (A, S, E); (B, F, E)
8 (C, N, V); (B, S, E); (A, N, E); (C, F, E); (A, F, D)
7 (B, N, E); (C, S, E); (A, S, D); (B, F, D)
6 (C, N, E); (B, S, D); (A, N, D); (C, F, D)
5 (B, N, D); (C, S, D)
4 (C, N, D)
Table 4. Mixed priority levels for all three classifications
c) Distinct priority levels for all classifications
For the sake of analysis, consider the classification having the highest priority level as having
the weights 3 x (3, 2, 1), the classification having the second highest priority level have the
weights 2 x (3, 2, 1), the classification that has the third and least priority level have the
weights 1 x (3, 2, 1). In this example, VED classification is given the highest priority level and
therefore the weight assignment is as follows: V → 9, E → 6, D→3
ABC classification is given the second highest priority level and therefore the weight
assignment is as follows: A → 6, B → 4, C → 2
FSN classification is given the third priority level and therefore the weight assignment is as
follows: F → 3, S → 2, N → 1
The priority scores that would be assigned to each of the different combinations of the three
classifications for this category are shown in Table 5. The ranked list generated by this
integration mechanism will have 13 different priority scores for the 27 combinations.
Table 5 shows that ties are still taking place. Such ties can be broken off easily by simply
taking into consideration the initial weighting factor arrangement. For the solution shown in
Table 5, if VED > ABC > FSN, then the ranking will be as that shown in Table 6.
-124-

Journal of Industrial Engineering and Management – http://dx.doi.org/10.3926/jiem.511
Score Classification
18 (A, F, V)
17 (A, S, V)
16 (A, N, V); (B, F, V)
15 (B, S, V); (A, F, E)
14 (B, N, V); (C, F, V); (A, S, E)
13 (C, S, V); (A, N, E); (B, F, E)
12 (C, N, V); (B, S, E); (A, F, D)
11 (B, N, E); (C, F, E); (A, S, D)
10 (C, S, E); (A, N, D); (B, F, D)
9 (C, N, E); (B, S, D)
8 (B, N, D); (C, F, D)
7 (C, S, D)
6 (C, N, D)
Table 5. Distinct priority levels for all three classifications
Ranking Classification Score Ranking Classification Score
1 (A, F, V) 18 15 (A, F, D) 12
2 (A, S, V) 17 16 (B, N, E) 11
3 (A, N, V) 16 17 (C, F, E) 11
4 (B, F, V) 16 18 (A, S, D) 11
5 (B, S, V) 15 19 (C, S, E) 10
6 (A, F, E) 15 20 (A, N, D) 10
7 (B, N, V) 14 21 (B, F, D) 10
8 (C, F, V) 14 22 (C, N, E) 9
9 (A, S, E) 14 23 (B, S, D) 9
10 (C, S, V) 13 24 (B, N, D) 8
11 (A, N, E) 13 25 (C, F, D) 8
12 (B, F, E) 13 26 (C, S, D) 7
13 (C, N, V) 12 27 (C, N, D) 6
14 (B, S, E) 12
Table 6. Final classification ranks taking into account tie breaking procedure
-125-

Journal of Industrial Engineering and Management – http://dx.doi.org/10.3926/jiem.511
3.2. Inventory ranking procedure
Figure 1 depicts the integrated inventory ranking procedure. The user can choose to perform
any of the classifications in any order. The ABC and FSN classifications are performed based on
the cutoffs that are entered by the user while the VED classification is a subjective input from
the management. Once the classifications are performed, the priority levels or weights need to
be provided. This can be done in 27! ways for the 27 different combinations of the
classifications and each choice can significantly affect the ranked list. In case the user does not
want any classification to affect the decision-making procedure, the weights for that
classification can be (0, 0, 0). The parts are sorted in the descending order of their priority
scores once they are calculated. The procedure does not suggest the weights and the user has
the flexibility to assign them subjectively.
Figure 1. Integrated inventory ranking procedure flowchart
-126-
Journal of Industrial Engineering and Management – http://dx.doi.org/10.3926/jiem.511
Of the three classifications, we believe that the VED ranking system should have the most
weight. If a part is so critical that it will shut down the entire process, then it should be given
the highest priority over value and demand. The part’s value, or ABC classification, should
have the second rank in the weight system. If the part uses a significant amount of the
manufacturer’s capital to produce, it should be considered more important and have a higher
rank than a high-demand part. However, if it is not vital to keep the process operating, then it
should be ranked lower than a vital part. Lastly, the FSN classification can be used as a tie-
breaker for high-cost, vital parts in the process. A high-demand part should have priority over
a slow or non-moving part, but its demand should not take precedent over value or vitality.
Using above guidelines to assign weights to the three classifications will eliminate ties and
satisfy some industry experts. This method can be used as an industry standard. There is no
argument that a part which is vital to the process must take the highest priority; but one can
argue that a fast-moving part should be prioritized over a high-cost part. The main idea of
these guidelines is to use a multiplier to distinguish between the different classifications to
eliminate ties altogether and have a clear ranking of inventory.
4. Decision support system
A DSS called Integrated Inventory Ranking System for Inventory Management (IRSIM) is
developed in MS Access to implement the integrated inventory ranking procedure. IRSIM had
three major modules: the database module, the model management module, and the user
interface module. The database module and the model management module made up the
internal design of IRSIM.
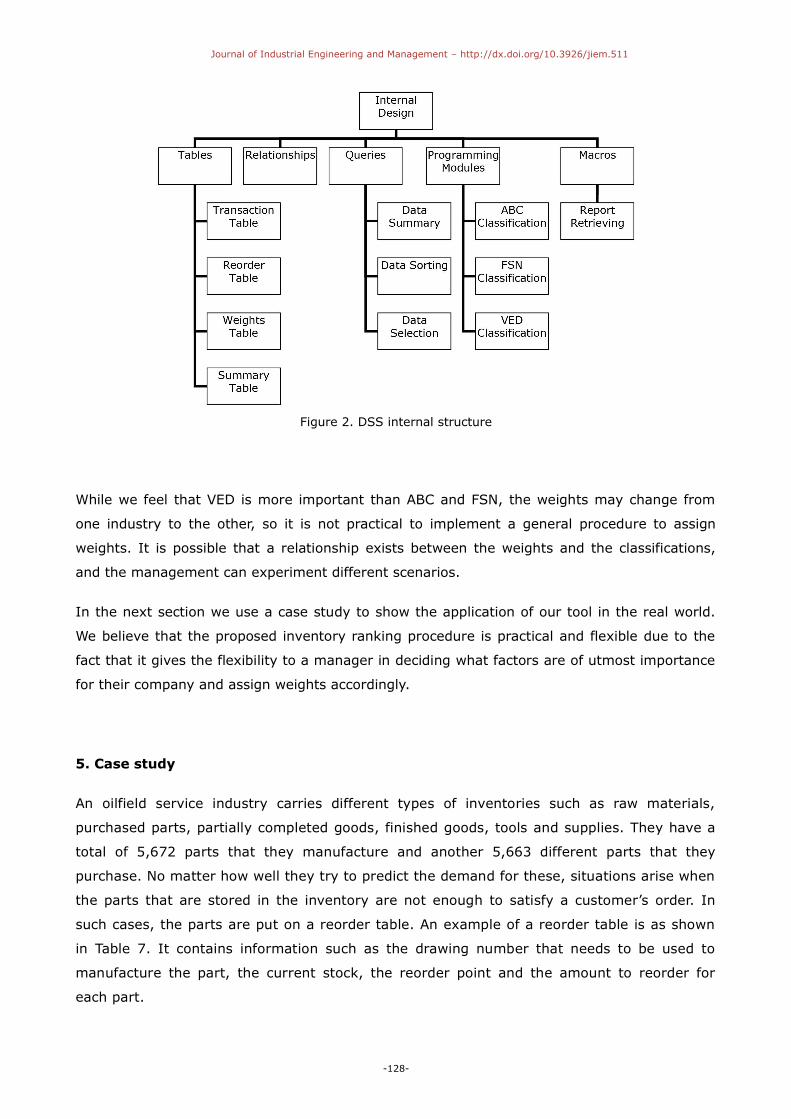
The internal structure of IRSIM is designed to be modular so changes can be implemented as
desired. The model management module comprises of the code that was written to perform
the classification techniques and to integrate them based on weights provided by the user. The
development of the internal structure consists of designing the tables, defining the relationship
among them, designing queries, writing programming modules and macros as depicted in
Figure 2.
The user interface was designed to be as user friendly as possible, and the input that the
system requires to perform the classifications was kept as simple as possible. Options have
been provided in IRSIM to generate various other reports other than the reorder lists, so that
the user can choose the kind of information he/she would like to use for making a decision.
The validity of IRSIM is tested and verified by utilizing real world data.
-127-
Journal of Industrial Engineering and Management – http://dx.doi.org/10.3926/jiem.511
Figure 2. DSS internal structure
While we feel that VED is more important than ABC and FSN, the weights may change from
one industry to the other, so it is not practical to implement a general procedure to assign
weights. It is possible that a relationship exists between the weights and the classifications,
and the management can experiment different scenarios.
In the next section we use a case study to show the application of our tool in the real world.
We believe that the proposed inventory ranking procedure is practical and flexible due to the
fact that it gives the flexibility to a manager in deciding what factors are of utmost importance
for their company and assign weights accordingly.
5. Case study
An oilfield service industry carries different types of inventories such as raw materials,
purchased parts, partially completed goods, finished goods, tools and supplies. They have a
total of 5,672 parts that they manufacture and another 5,663 different parts that they
purchase. No matter how well they try to predict the demand for these, situations arise when
the parts that are stored in the inventory are not enough to satisfy a customer’s order. In
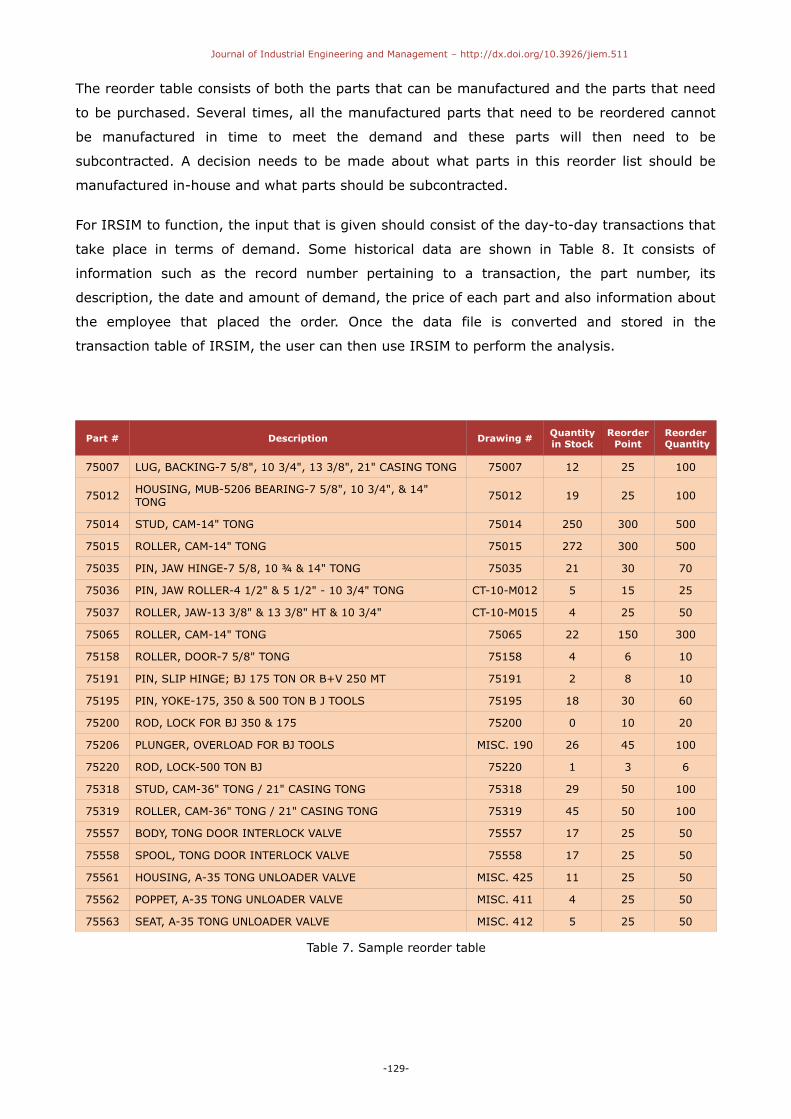
such cases, the parts are put on a reorder table. An example of a reorder table is as shown
in Table 7. It contains information such as the drawing number that needs to be used to
manufacture the part, the current stock, the reorder point and the amount to reorder for
each part.
-128-
Journal of Industrial Engineering and Management – http://dx.doi.org/10.3926/jiem.511
The reorder table consists of both the parts that can be manufactured and the parts that need
to be purchased. Several times, all the manufactured parts that need to be reordered cannot
be manufactured in time to meet the demand and these parts will then need to be
subcontracted. A decision needs to be made about what parts in this reorder list should be
manufactured in-house and what parts should be subcontracted.
For IRSIM to function, the input that is given should consist of the day-to-day transactions that
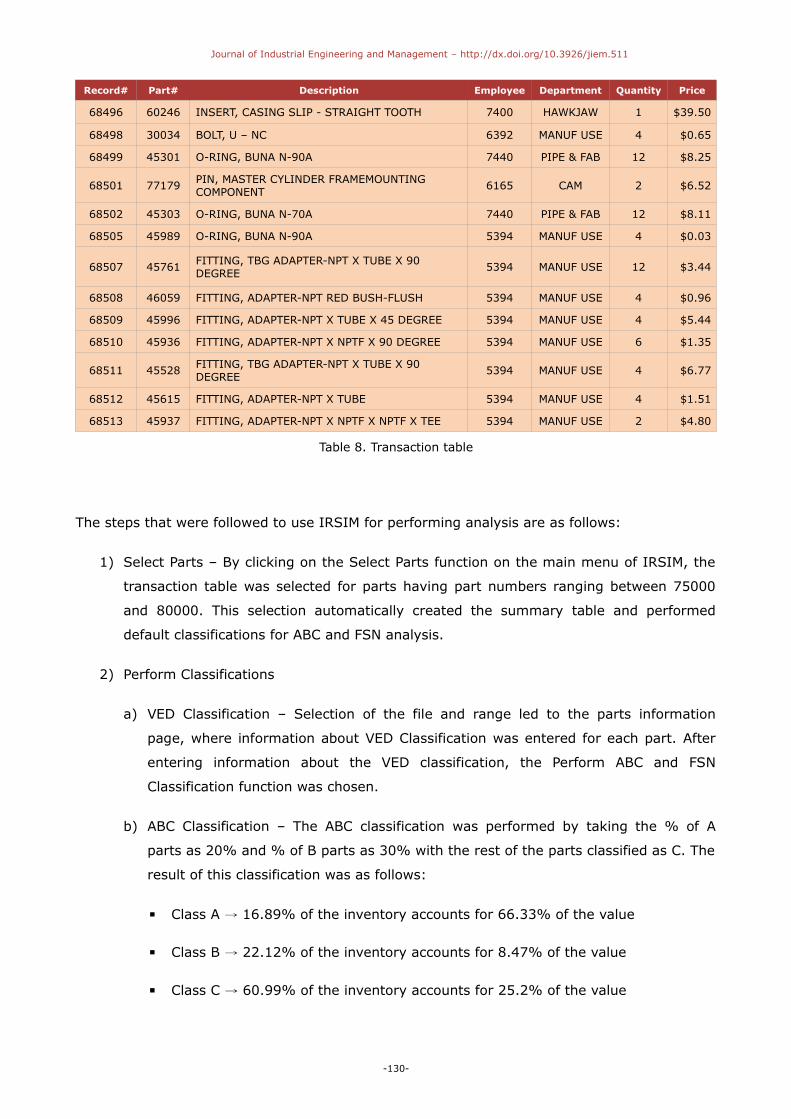
take place in terms of demand. Some historical data are shown in Table 8. It consists of
information such as the record number pertaining to a transaction, the part number, its
description, the date and amount of demand, the price of each part and also information about
the employee that placed the order. Once the data file is converted and stored in the
transaction table of IRSIM, the user can then use IRSIM to perform the analysis.
Part # Description Drawing # Quantityin Stock
ReorderPoint
Reorder Quantity
75007 LUG, BACKING-7 5/8", 10 3/4", 13 3/8", 21" CASING TONG 75007 12 25 100
75012 HOUSING, MUB-5206 BEARING-7 5/8", 10 3/4", & 14" TONG 75012 19 25 100
75014 STUD, CAM-14" TONG 75014 250 300 500
75015 ROLLER, CAM-14" TONG 75015 272 300 500
75035 PIN, JAW HINGE-7 5/8, 10 ¾ & 14" TONG 75035 21 30 70
75036 PIN, JAW ROLLER-4 1/2" & 5 1/2" - 10 3/4" TONG CT-10-M012 5 15 25
75037 ROLLER, JAW-13 3/8" & 13 3/8" HT & 10 3/4" CT-10-M015 4 25 50
75065 ROLLER, CAM-14" TONG 75065 22 150 300
75158 ROLLER, DOOR-7 5/8" TONG 75158 4 6 10
75191 PIN, SLIP HINGE; BJ 175 TON OR B+V 250 MT 75191 2 8 10
75195 PIN, YOKE-175, 350 & 500 TON B J TOOLS 75195 18 30 60
75200 ROD, LOCK FOR BJ 350 & 175 75200 0 10 20
75206 PLUNGER, OVERLOAD FOR BJ TOOLS MISC. 190 26 45 100
75220 ROD, LOCK-500 TON BJ 75220 1 3 6
75318 STUD, CAM-36" TONG / 21" CASING TONG 75318 29 50 100
75319 ROLLER, CAM-36" TONG / 21" CASING TONG 75319 45 50 100
75557 BODY, TONG DOOR INTERLOCK VALVE 75557 17 25 50
75558 SPOOL, TONG DOOR INTERLOCK VALVE 75558 17 25 50
75561 HOUSING, A-35 TONG UNLOADER VALVE MISC. 425 11 25 50
75562 POPPET, A-35 TONG UNLOADER VALVE MISC. 411 4 25 50
75563 SEAT, A-35 TONG UNLOADER VALVE MISC. 412 5 25 50
Table 7. Sample reorder table
-129-
Journal of Industrial Engineering and Management – http://dx.doi.org/10.3926/jiem.511
Record# Part# Description Employee Department Quantity Price
68496 60246 INSERT, CASING SLIP - STRAIGHT TOOTH 7400 HAWKJAW 1 $39.50
68498 30034 BOLT, U – NC 6392 MANUF USE 4 $0.65
68499 45301 O-RING, BUNA N-90A 7440 PIPE & FAB 12 $8.25
68501 77179 PIN, MASTER CYLINDER FRAMEMOUNTING COMPONENT 6165 CAM 2 $6.52
68502 45303 O-RING, BUNA N-70A 7440 PIPE & FAB 12 $8.11
68505 45989 O-RING, BUNA N-90A 5394 MANUF USE 4 $0.03
68507 45761 FITTING, TBG ADAPTER-NPT X TUBE X 90 DEGREE 5394 MANUF USE 12 $3.44
68508 46059 FITTING, ADAPTER-NPT RED BUSH-FLUSH 5394 MANUF USE 4 $0.96
68509 45996 FITTING, ADAPTER-NPT X TUBE X 45 DEGREE 5394 MANUF USE 4 $5.44
68510 45936 FITTING, ADAPTER-NPT X NPTF X 90 DEGREE 5394 MANUF USE 6 $1.35
68511 45528 FITTING, TBG ADAPTER-NPT X TUBE X 90 DEGREE 5394 MANUF USE 4 $6.77
68512 45615 FITTING, ADAPTER-NPT X TUBE 5394 MANUF USE 4 $1.51
68513 45937 FITTING, ADAPTER-NPT X NPTF X NPTF X TEE 5394 MANUF USE 2 $4.80
Table 8. Transaction table
The steps that were followed to use IRSIM for performing analysis are as follows:
1) Select Parts – By clicking on the Select Parts function on the main menu of IRSIM, the
transaction table was selected for parts having part numbers ranging between 75000
and 80000. This selection automatically created the summary table and performed
default classifications for ABC and FSN analysis.
2) Perform Classifications
a) VED Classification – Selection of the file and range led to the parts information
page, where information about VED Classification was entered for each part. After
entering information about the VED classification, the Perform ABC and FSN
Classification function was chosen.
b) ABC Classification – The ABC classification was performed by taking the % of A
parts as 20% and % of B parts as 30% with the rest of the parts classified as C. The
result of this classification was as follows:
▪ Class A → 16.89% of the inventory accounts for 66.33% of the value
▪ Class B → 22.12% of the inventory accounts for 8.47% of the value
▪ Class C → 60.99% of the inventory accounts for 25.2% of the value
-130-
Journal of Industrial Engineering and Management – http://dx.doi.org/10.3926/jiem.511
c) FSN Classification –The FSN classification was performed by taking the % of F parts
as 25% and % of S parts as 50% with the rest of the parts classified as N. The
result of this classification was as follows:
▪ Fast moving parts have a demand greater than or equal to 46
▪ Slow moving parts have a demand of less then 46 and greater than 5
▪ Non moving parts have a demand less than or equal to 5
3) Assign Weights – Once all the classifications were performed, they were assigned
weights using the Assign Weights function on the main menu of IRSIM. The
management of the oil equipment company believes that the costly parts should be
made in-house, so ABC is given the highest weights at (10, 5, 1). The FSN is
considered as more important than the VED, so a (5, 3, 1) is used for FSN and (3, 2,1)
is used for VED.
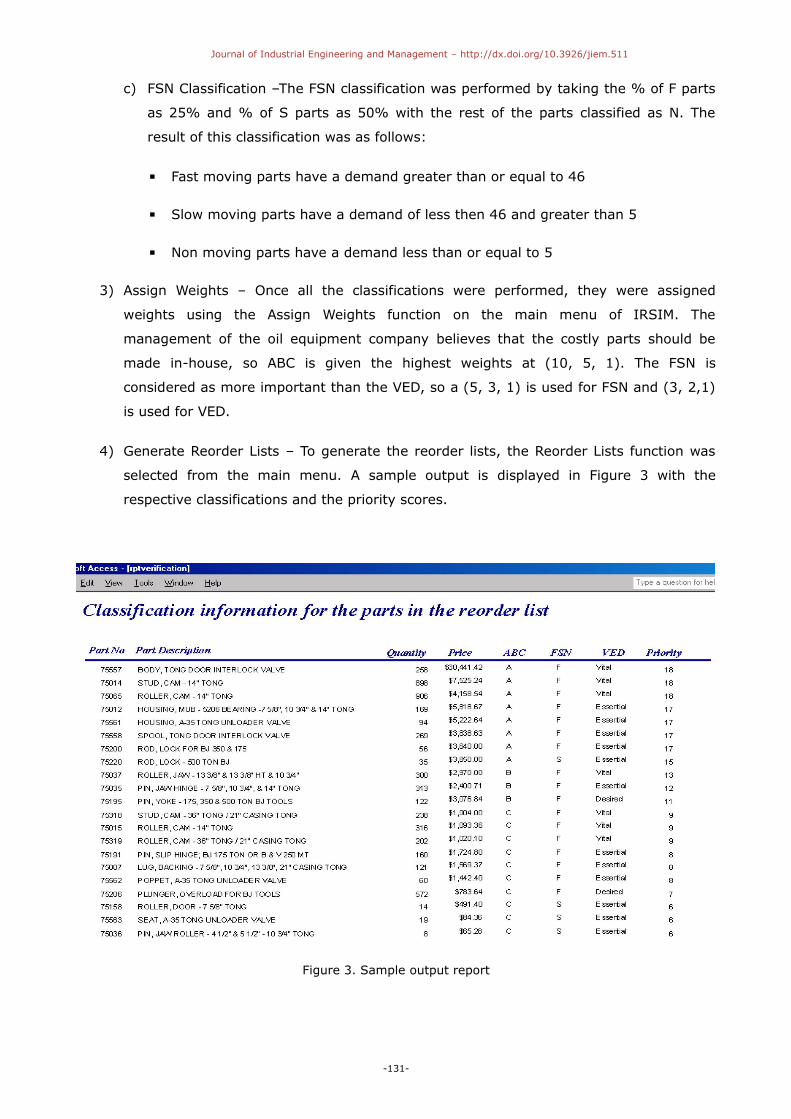
4) Generate Reorder Lists – To generate the reorder lists, the Reorder Lists function was
selected from the main menu. A sample output is displayed in Figure 3 with the
respective classifications and the priority scores.
Figure 3. Sample output report
-131-

Journal of Industrial Engineering and Management – http://dx.doi.org/10.3926/jiem.511
The parts are arranged in descending order of their priority scores.
A ranked list is given in Table 9.
Ranking Part # Part Description
1 75557 Body, Tong Door Interlock Valve
2 75014 Stud, Cam – 14” Tong
3 75065 Roller, Cam – 14” Tong
4 75012 Housing, Mub – 5206 Bearing -7 5/8”, 10 ¾” & 14” Tong
5 75561 Housing, A-35 Tong Unloader Valve
6 75558 Spool. Tong Door Interlock Valve
7 75200 Rod, Lock for BJ 350 & 175
8 75220 Rod, Lock – 500 Ton BJ
9 75037 Roller Jaw – 13 3/8” & 13 3/8” HT & 10 ¾”
10 75035 Pin, Jaw Hnge – 7 5/8”, 10 ¾” & 14” Tong
11 75195 Pin, Yoke – 175, 350 & 500 Ton BJ Tools
12 75318 Stud, Cam – 36” Tong / 12” Casino Tong
13 75015 Roller, Cam – 14” Tong
14 75319 Roller, Cam – 36” Tong / 12” Casino Tong
15 75191 Pin, Slip Hinge; BJ 175 Ton or B & V 250 MT
16 75007 Lug, Backing – 7 5/8”, 10 ¾”, 13 3/8”, 21” Casino Tong
17 75562 Poppet, A-35 Tong Unloader Valve
18 75206 Plunger, Overload For BJ Tools
19 75158 Roller, Door – 7 5/8” Tong
20 75563 Seat, A-35 Tong Unloader Valve
21 75036 Pin, Jaw Roller – 4 ½” & 5 ½” – 10 ¾” Tong
Table 9. Ranking table
Our system suggests that those parts with higher priority scores are those which would be of
more importance to the company and therefore should be produced in-house so as to have
better control of it based on the production capacities and due dates. While those with lower
priority scores are of lesser importance and may be considered for outsourcing within the
allowable order constraints.
6. Conclusions
The case study is performed to develop an integrated inventory ranking procedure to
determine make-or-buy decisions on the parts of an oilfield equipment company. A DSS called
IRSIM is created to implement the procedure using MS Access database software.
Three different inventory classification techniques including ABC classification, FSN
classification, and VED classification are integrated into IRSIM to combine both quantitative
factors and qualitative factors to generate a ranked list.
-132-
Journal of Industrial Engineering and Management – http://dx.doi.org/10.3926/jiem.511
The integration of all three inventory classification techniques into a single system is a unique
feature of this research. This is important as it provides a more inclusive, big picture view of
the DSS for management’s use in making business decisions.
The inventory ranking depends heavily on the weights given to the three classification
methods. The VED ranking should have the most weight if vital parts can be easily identified. If
the shortage of a part will shut down the entire process, then it should be given the highest
priority over value and demand. The part’s cost, or ABC classification, should have the second
rank in the weight system. Lastly, the FSN classification can be used as a tie-breaker for high-
cost, vital parts in the process.
Our DSS is tested and verified by utilizing real world data, and the company has produced a
list of parts to be made in-house. While we feel that the VED ranking should have the most
weight, the management of the oil equipment company believes that the costly parts should be
made in-house, so ABC is given the highest weights. The decision reveals that the
management may not feel very comfortable about their VED assignment. Other industries will
generate different rankings if different priorities are used, indicating the need for a flexible
DSS. This is very common in DSS applications.
Future enhancements to this research can be done in two areas. The inventory ranking
procedure is based on three quantitative and qualitative factors as suggested by the company in
our case study. Future research can consider other classification methods and other factors such
as due dates and similar setups. The integration mechanism can also be enhanced to implement
procedure to assign weights for the other factors. The IRSIM developed in this case study
focuses on the make-or-buy decisions for one industry. The scope of IRSIM can be further
extended to deal with other inventory management problem areas such as reorder strategies.
References
Atamtürk, A., & Hochbaum, D.S. (2001). Capacity acquisition, subcontracting, and lot sizing.
Management Science, 47, 1081-1100. http://dx.doi.org/10.1287/mnsc.47.8.1081.10232
Bed, N.K., & Nagarur, N.N. (1994). An integrated decision support system for FMS: using
intelligent simulation. International Journal of Production Research, 32(4), 951-965.http://dx.doi.org/10.1080/00207549408956981
Bhattachaya, A., Sarkar, B., & Mukherjee, S.K. (2007). Distance-based consensus method for
ABC analysis. International Journal of Production Research, 45(15), 3405-3420.http://dx.doi.org/10.1080/00207540600847145
-133-

Journal of Industrial Engineering and Management – http://dx.doi.org/10.3926/jiem.511
Carr, A.S., & Pearson, J.N. (1999). Strategically managed buyer-supplier relationships and
performance outcomes. Journal of Operations Management, 17, 497-519.http://dx.doi.org/10.1016/S0272-6963(99)00007-8
Chase, R.B., Jacobs, F.R., Aquilano, N.J., & Agarwal, N.K. (2006). Operations Management for
Competitive Advantage. 11th Edition. New York, USA: McGraw Hill.
Chen, Y., Li, K., & Liu, S. (2008). A comparative study on multi-criteria ABC analysis in
inventory management. Systems, Man and Cybernetics, SMC 2008. IEEE International
Conference, 3280-3285. http://dx.doi.org/10.1109/ICSMC.2008.4811802
Cohen, M.A., & Ernst, R. (1988). Multi-item classification and generic inventory stock control
policies. Production and Inventory Management Journal, 29(3), 6-8.
Ferrer, G. (2003). Yield information and supplier responsiveness in remanufacturing
operations. European Journal of Operational Research, 149(3), 540-556.http://dx.doi.org/10.1016/S0377-2217(02)00454-X
Flores, B.E., & Whybark, D.C. (1987). Implementing multiple criteria ABC analysis. Journal of
Operations Management, 7(1), 79-84. http://dx.doi.org/10.1016/0272-6963(87)90008-8
Flores, B.E., Olson, D.L., & Dorai, V.K. (1992). Management of Multicriteria Inventory
Classification. Mathematical and Computer Modeling, 16(12), 71-82.http://dx.doi.org/10.1016/0895-7177(92)90021-C
Hadi-Vencheh, A. (2010). An improvement to multiple criteria ABC inventory classification.
European Journal of Operational Research, 201(3), 962-965.
Hillier, M. (2002). Using commonality as backup safety stock. European Journal of Operational
Research, 136(2), 353-365. http://dx.doi.org/10.1016/S0377-2217(01)00027-3
Hincapie, J., Lee, J., & Emblom, W. (2011). Sensitivity Analysis on Inventory Classification
Methods for Oilfield Equipment Industry. International Manufacturing Science and
Engineering Conference, MSEC2011-50172, 145-153
Holmes, J. (1986). The organization and locational structure of production subcontracting. In
A. Scott and M. Storper. Production, Work, Territory. Boston: Allen and Unwin. 80-106.
Holsapple, C.W., & Whinston, A.B. (1996). Decision Support Systems: A Knowledge-based
Approach. West Publishing Co., Minneapolis.
Jamshidi, H., & Jain, A. (2008). Multi-criteria ABC inventory classification: With exponential
smoothing weights. Journal of Global Business Issues, 2(1), 61-67.
Jeong, I.J., Leon, V.J., & Villaboros, J.R. (2007). Integrated decision-support system for
diagnosis, maintenance planning, and scheduling of manufacturing systems. International
Journal of Production Research, 45(2), 267-285. http://dx.doi.org/10.1080/00207540600678896
-134-

Journal of Industrial Engineering and Management – http://dx.doi.org/10.3926/jiem.511
Kabir, G., & Hasin, A., (2012). Multiple criteria inventory classification using fuzzy analytic
hierarchy process. International Journal of Industrial Engineering Computations, 123-132
Kim, J., Chatfield, D., Harrison, T., & Hayya, J. (2006). Quantifying the bullwhip effect in a
supply chain with stochastic lead time. European Journal of Operational Research, 173(2),
617-636. http://dx.doi.org/10.1016/j.ejor.2005.01.043
Kirche, E., & Srivastava, R. (2005). An ABC-based cost model with inventory and order level
costs: A comparison with TOC. International Journal of Production Research, 43(8),
1685-1710.
Krause, D.R., Handfield, R.B., & Scannell, T.V. (1998). An empirical investigation of supplier
development: reactive and strategic processes. Journal of Operations Management, 17(1),
39-58. http://dx.doi.org/10.1016/S0272-6963(98)00030-8
Kumar, S., & Wilson, J. (2009). A manufacturing decision framework for minimizing inventory
costs of a configurable off-shored product using postponement. International Journal of
Production Research, 47(1), 143-162. http://dx.doi.org/10.1080/00207540701477792
Lan, H., Ding, Y., & Hong, J. (2005). Decision support system for rapid prototyping process
selection through integration of fuzzy synthetic evaluation and an expert system.
International Journal of Production Research, 43(1), 169-194.http://dx.doi.org/10.1080/00207540410001733922
Larson, S.E. (1980). Inventory systems and control handbook. New Jersey: Prentice-Hall.
Li, S., Murat, A., & Huang, W. (2009). Selection of contract suppliers under price and demand
uncertainty in a dynamic market. European Journal of Operational Research, 198(3),
830-847.
Mohebbi, E., & Hao, D. (2006). When supplier's availability affects the replenishment lead
time-An extension of the supply-interruption problem. European Journal of Operational
Research, 175(2), 992-1008. http://dx.doi.org/10.1016/j.ejor.2005.06.015
Mukhopadhyay, S.K., Pathak, K., & Guddu, K. (2003). Development of decision support system
for stock control at area level in mines. IE(I) Journal-MN, 84(1), 11-16.
Nahmias, S., & Demmy, W.S. (1981). Operating Characteristics of an Inventory System with
Rationing. Management Science, 27(11), 1236-1245. http://dx.doi.org/10.1287/mnsc.27.11.1236
Ng, W.L. (2007). A simple classifier for multiple criteria ABC analysis. European Journal of
Operational Research, 177, 344-353. http://dx.doi.org/10.1016/j.ejor.2005.11.018
-135-

Journal of Industrial Engineering and Management – http://dx.doi.org/10.3926/jiem.511
Partovi, F.Y., & Anandarajan, M. (2002). Classifying inventory using artificial neural network
approach. Computers and Industrial Engineering, 41, 389-404. http://dx.doi.org/10.1016/S0360-
8352(01)00064-X
Petrovic, D., Petrovic, R., & Rajat, R. (1998). Modeling and Simulation of a Supply Chain in an
Uncertain Environment. European Journal of Operational Research, 109(2), 299-309.http://dx.doi.org/10.1016/S0377-2217(98)00058-7
Ramanathan, R. (2006). ABC inventory classification with multiple-criteria using weighted
linear optimization. Computers and Operations Research, 33, 695-700.http://dx.doi.org/10.1016/j.cor.2004.07.014
Ronen, B., & Trietsch, D. (1988). A decision support system for purchasing management of
large projects. Operations Research, 36(6), 882-890. http://dx.doi.org/10.1287/opre.36.6.882
Saaty, T.L. (1980). The analytic hierarchy process. New York: McGraw-Hill.
Sadrian, A.A., & Yoon, Y.S. (1994). A procurement decision support system in business volume
discount environments. Operations Research, 42(1), 14-23. http://dx.doi.org/10.1287/opre.42.1.14
Walker, J. (2000). Decision support for the single-period inventory problem. Industrial
Management & Data Systems, 100(2), 61-67. http://dx.doi.org/10.1108/02635570010319693
Yang, G., Ronald, R., & Chu, P. (2005). Inventory models with variable lead time and present
value. European Journal of Operational Research, 164(2), 358-366.http://dx.doi.org/10.1016/j.ejor.2003.09.030
Yu, M.C. (2011). Multi-criteria ABC analysis using artificial-intelligence-based classification
techniques. Expert Systems with Applications, 38(4), 3416-3421.http://dx.doi.org/10.1016/j.eswa.2010.08.127
Zeydan, M., & Colpan, C. (2009). A new decision support system for performance
measurement using combined fuzzy TOPSIS/DEA approach. International Journal of
Production Research, 47(15), 4327-4349. http://dx.doi.org/10.1080/00207540802662870
Journal of Industrial Engineering and Management, 2014 (www.jiem.org)
Article's contents are provided on a Attribution-Non Commercial 3.0 Creative commons license. Readers are allowed to copy, distribute
and communicate article's contents, provided the author's and Journal of Industrial Engineering and Management's names are included.
It must not be used for commercial purposes. To see the complete license contents, please visit
http://creativecommons.org/licenses/by-nc/3.0/.
-136-