integrated research limited (iri) fy2020 annual financial … · 2020. 8. 19. · leading global...
TRANSCRIPT

Integrated Research Limited (IRI)FY2020 Annual Financial ResultsAugust 2020
John Ruthven, CEOPeter Adams, CFO
complexity simplified
For
per
sona
l use
onl
y

2
IRI at a GlanceOur purpose is to create clarity and insight in a world of connected devices
Highlights• IR is the leading global provider of user experience and performance management solutions for Unified Communications,
Payments and IT Infrastructure. • Global enterprise customer base spanning diverse industries and including more than 25% of Fortune 500 companies• We create value by optimising performance and providing intelligent insight into mission critical systems through our real
time, scalable platform and our deep domain knowledge
Investment Proposition
Strong Financial Performance~40% EBITDA margins~30% Return on Equity
Net cash to fund growth strategies
Defensive87% of revenues recurring
in nature, multiyear contracts
GrowthLeveraged to structural switch to cloud and increasing payments
High QualityMission critical software with
Tier 1 customer base
53
7085
91 91101
111
2014 2015 2016 2017 2018 2019 2020
Strong track record of revenue growth (A$M)
For
per
sona
l use
onl
y

3
Performance Review (A$M)Delivering record results
21.224.2
2019 2020
REVENUE
UP 10%
NET PROFIT AFTER TAX
UP 10%
RETURN ON EQUITY
OPERATING CASH FLOW1
NET PROFIT AFTER TAX MARGIN
DIVIDENDS PER SHARE
DOWN 2ppt
UP 14%
Consistent
Maintained
7.25c 7.25c
2019 2020
22% 22%
2019 2020
100.8110.9
2019 2020
31% 29%
2019 2020
21.924.1
2019 2020
Note1: Operating cashflow was up 5% on a “like for like” adjusting for new AASB leasing standard
For
per
sona
l use
onl
y

CEO Key MessagesIncreasing leverage to long term growth trends
4
Strong Performance - revenue and profit up 10%; licence sales up 15%
Satisfied Customers – customer satisfaction up 25%; biggest deal in company history; 38 new customers
Accelerated Innovation – SaaS platform live, hybrid strategy validated, MS Teams & Zoom launching in 1HFY21
Engaged Talent – key new hires; internal promotions; organisational alignment
Focused Strategy – focus on UC driven by growth of remote working and payments driven by cashless transactions
FitterFasterStronger – R&D strategy to increase quality and accelerate time to marketFor
per
sona
l use
onl
y

5
Decisive COVID-19 ResponseContinuing to deliver client solutions, remotely
COVID–19 ImpactCustomersIncreased demand for collaborationStrength of long term relationshipsPhysical access to customers limitedFinancialQ4 New business growth slowedQ4 Renewal and capacity sales continuingCash receipts slowed (catchup in FY21 Q1)EmployeesRecommended work from homeSome offices closed & virtual meetings
ResponseInnovation & Agility
Investment in Teams and Zoom solutionMarketing spend directed to virtual eventsProfessional services performed remotely
FinancialQ4 cost control and scenario planning
Continued investment in developmentBalance sheet management (increased debt facility)
EmployeesBusiness continuity tested
Facilitated remote working capability
Resilient Business Model
For
per
sona
l use
onl
y

Stories from the FieldGrowth driven by solving high value customer problems
6
Woolworths
maintain
JP Morgan
grow
GSKGlaxoSmithKline
new
complexity simplified
problem
solution
Customer experience; payment failures & declines; 45,000 lanes
Real time performance metrics visibility and tracking
Thousands of transactions a second; ATMs, merchant services, cards, retail
Manage hardware and payment applications; thresholds for ‘standard operating’
Video conferencing platform failure or poor quality
Proactively manage user experience with real time metrics
Contract extension;customer for 10+ years; new 5 year agreement; monitoring payment network
Contract expansion;customer for 25 years; contract consolidation; extended term; new capability
Land & expand;‘single pane of glass’;video transformation project; expansion
outcome
For
per
sona
l use
onl
y

Blue Chip Customer Base38 new customers added in FY20
Telecom/IT Financial Other Healthcare
Not-for-Profit
7over $3M new logo
For
per
sona
l use
onl
y

8
Revenue Analysis - GeographicAPAC consistent growth with solid ROW performance
Americas Revenue US$MEurope Revenue £MAsia Pacific Revenue A$M
Americas momentum improved in 2H after slow 1H; 2H licence
fees grew in all product lines; region
breaks US$50 million in revenue
Europe revenue declined by 1%; UC
licence growth offset by lower Payments and Infrastructure
(cyclical)
APAC achieved revenue growth of 17% with strong UC licence growth. Seven years of
consecutive growth
0123456789
10
2013 2014 2015 2016 2017 2018 2019 20200
10
20
30
40
50
60
2013 2014 2015 2016 2017 2018 2019 202002468
101214161820
2013 2014 2015 2016 2017 2018 2019 2020
For
per
sona
l use
onl
y
9
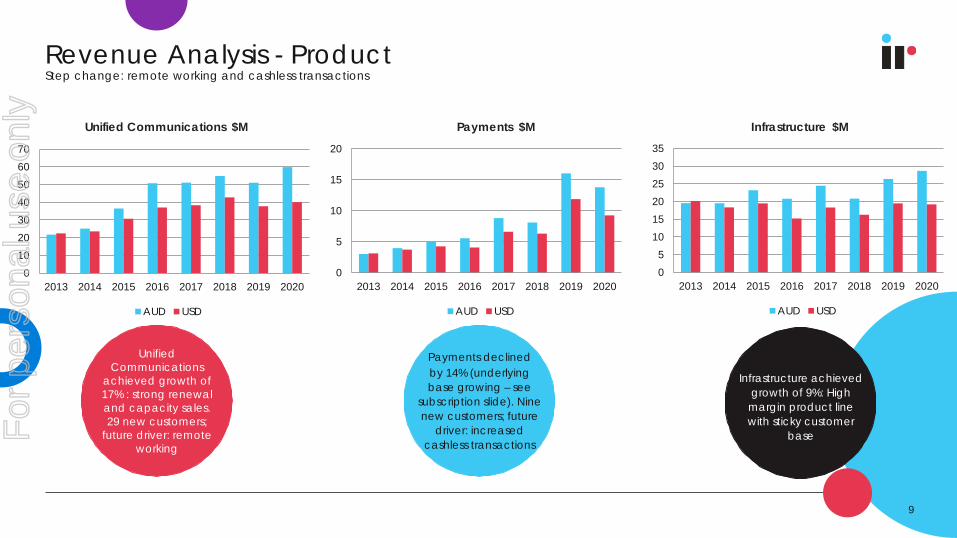
Revenue Analysis - ProductStep change: remote working and cashless transactions
Payments $MUnified Communications $M Infrastructure $M
Payments declinedby 14% (underlying base growing – see
subscription slide). Nine new customers; future
driver: increased cashless transactions
Unified Communications
achieved growth of 17% : strong renewal and capacity sales. 29 new customers;
future driver: remote working
Infrastructure achieved growth of 9%: High margin product line with sticky customer
base
010203040506070
2013 2014 2015 2016 2017 2018 2019 2020
AUD USD
0
5
10
15
20
2013 2014 2015 2016 2017 2018 2019 2020
AUD USD
05
101520253035
2013 2014 2015 2016 2017 2018 2019 2020
AUD USD
For
per
sona
l use
onl
y

10
Proforma Subscription Revenue*Subscription recurring revenue more than 80% of proforma total revenue
372Bcard
transactions
* - proforma subscription revenue is a non-statutory alternate view of revenue (unaudited); refer appendix for calculations
-
5.0
10.0
15.0
20.0
25.0
FY17 FY18 FY19 FY20
Infrastructure A$M
-
2.0
4.0
6.0
8.0
10.0
12.0
FY17 FY18 FY19 FY20
Payments A$M
-
10.0
20.0
30.0
40.0
50.0
60.0
FY17 FY18 FY19 FY20
Unified Communication A$M
Unified Communications up 11%; three platforms
served (Microsoft, Avaya and Cisco)
Payments up 27%; strong bookings fueling
subscription growth
Infrastructure up 8%: High margin product
line with sticky customer baseF
or p
erso
nal u
se o
nly

Results SummaryAnother record year
11
Year ending Jun 2020 * Jun 2019 % change
A$M A$M A$M
Total revenue 110.9 100.8 10%
EBITDA 42.9 40.2 7%
EBITDA margin 39% 40% -1ppt
EBIT 30.9 28.9 7%
EBIT margin 28% 29% -1ppt
Profit after tax 24.1 21.9 10%
Profit after tax margin 22% 22%
Basic earning per share (cents) 14.0c 12.72c 10%
Dividend per share (cents) 7.25c 7.25c
Return on equity 29% 31% -2ppt
Revenue in constant currency 105.1 100.8 4%
* AASB 16 ‘Leases’ standard adoption resulted in an increase in EBITDA of approximately $2m
For
per
sona
l use
onl
y

9.3
30.35.0
14.0
12.5
8.59.7
0
10
20
30
40
50
Opening cash Cash fromoperations
Debt drawdown
Developmentspend
Dividend Interest, tax &other
Closing cash
A$M
12
Net Cash Flow movementServicing innovation and return to shareholders
Strong balance sheet – no debt
Strong balance sheet – net cash $4.7M
Improvement in cash from operations
Continuing dividend payments
Development spend includes
the next gen platformF
or p
erso
nal u
se o
nly

Balance SheetWell positioned to fund growth
Strong balance sheet – no debt
New lease accounting
standard - lease liabilities $6.5M
Strong balance sheet – net cash $4.7M
13
Jun 20 Jun 19
A$M A$M
Cash and cash equivalents 9.7 9.3Trade and other receivables 87.3 72.8Intangible Assets 29.1 23.1
Right-of-use Assets 6.4 -
All Other Assets 7.4 8.3
Total Assets 139.8 113.5
Trade and other liabilities 10.2 10.0
Borrowings 5.0 -
Provisions 4.6 3.9
Tax liabilities 8.6 7.5
Deferred revenue 22.3 22.3
Lease liabilities 6.5 -
Total liabilities 57.3 43.7
Net assets 82.5 69.8
Trade receivables -strong source of
future cash
Strong balance sheet – net cash
$4.7M
For
per
sona
l use
onl
y

14
R&D StrategyAccelerate innovation and reduce time to market
IR invests 20% of revenue on R&D to drive sustainable growth
goal financial outcome scorecard key deliverables
value
Invest to maintain the base and bring new products to market
Revenue growth Improving
- New SaaS products
- Hybrid capability
velocity
Highly efficient (agile) development shop
Margin improvement Improving
- Extend SaaS platform
- Reduce time to market for new products
quality
Ensure products are robust and reliable to enhance customer experience
Lower cost of support High
- >95% satisfaction
- Reduce support queues
V
Q
V
For
per
sona
l use
onl
y

15
Evolution to CloudHybrid cloud and SaaS opportunity for IR
Daily call volumes over 540k and more than 300k
users
The Myth of the 100% Cloud: Many businesses are instead
boosting on-premises workloads; Jim Rapoza –
Aberdeen Group
MS Teams ‘daily active users’ more than 75 million
MS Teams & Zoom launching in H1
Beta customers on new SaaS platform
Hybrid strategy validated
Large enterprise customers are moving to hybrid cloud – workloads run in both on-premises
and SaaS
Platform supports new SaaS products; Payment
Analytics, MS Teams & Zoom; it is the processing
engine
MS Teams & Zoom API integration to monitor performance and call
quality
For
per
sona
l use
onl
y

16
Key Success DriversLeveraging long term structural growth trends
2. Payments Cashless transactions
Expand addressable market
New products, SaaS, hybrid
1. UnifiedCommunications
Remote working Strong renewals base
New products, SaaS, hybrid
3. Regional growth Continued growth APAC
Americas has turned the corner
European turn-around
4. New customers 26 & 38 in two prior years Strong pipeline Service-provider
reach
5. New products MS Teams, Zoom, Webex
Payment analytics, generic collector
SaaS platform extension
IR is well placed to capitalise on the step change in structural growth trendsFor
per
sona
l use
onl
y

Investment Summary Driving sustainable long-term performance
17
complexity simplified
High Quality Defensive Growth Strong Financial performance
Mission critical software
Broad base of Tier 1 customers
87% of revenues recurring in nature
Leveraged to structural growth in
cloud-based solutions
11% Revenue CAGR since 2013
Long term growth in cashless payments and video comms
29% ROE with net cash to fund growth
strategies
Long term contract with high retention
ratesFor
per
sona
l use
onl
y

Appendix
For
per
sona
l use
onl
y

19
CapabilitiesPrognosis provides best in class
performance management across Unified Communications, Contact Centres and Payments
ecosystems, cloud, hybrid oron-premises.
Who we areIR
IR is the leading global provider of user experience and performance management
solutions for Unified Communications. Payments and IT Infrastructure.
What we doCapabilities
Prognosis provides best in class performance management across Unified Communications, Contact Centres and Payments ecosystems,
cloud, hybrid or on-premises.
Why customers buyValue Proposition
Prognosis end-to-end Unified Communications, Payments and Infrastructure experience
management software and testing services optimize operations of mission critical systems
through insight into real time and historical events.
Why we succeedCompetitive Advantage
Prognosis is real-time scalable, extensible & flexible.Prognosis supports multiple platforms,
vendors and applicationsIR has a significant enterprise global customer base
IR has >25% or the Fortune 500 ascustomersIR has a world-class R&D capability
For
per
sona
l use
onl
y

Revenue Model by Segment
License Fees Term Recurring Perpetual
Maintenance Fees Recurring Recurring Recurring
SaaS Fees Recurring N/A N/A
Testing Solutions Part Recurring N/A N/A
Consulting Non-Recurring
Term Recurring Term Recurring
Contracts with multiyear duration
Top 10 customers account for less than one-third of
total annual revenue
Bias from customers is for operational style purchasing vs
large up front capital spend
UC & CC Payments Infrastructure
20
For
per
sona
l use
onl
y

Proforma Subscription Revenue
Purpose:To provide an alternate view of underlying performance by restating term licence and maintenance revenues on a recurring subscription basis
How:• All licence sales from FY2012 to FY2020 were analysed for each region in their natural
currencies (the historic analysis period) • Perpetual deals have been reported separately in the year sold• Subscription revenues have been calculated by aggregating amortised licence
revenues with maintenance revenues for each product line• Other revenue streams have been reported the same as the statutory accounts (e.g.
professional services and testing services)• A reconciliation of proforma subscription revenues and statutory revenue has been
included below the analysis
21
For
per
sona
l use
onl
y

22
Proforma Subscription Revenue
FY17 FY18 FY19 FY20 FY17 FY18 FY19 FY20
A$M A$M A$M A$M
Infrastructure 21.0 19.8 20.1 21.6 2% -6% 1% 8%
Payments 5.2 6.5 8.2 10.5 12% 24% 27% 27%
Unified Communications 36.9 41.0 47.9 53.1 1% 11% 17% 11%
Subscription revenues 63.1 67.2 76.1 85.2 2% 6% 13% 12%
Perpetual sales 6.4 1.8 2.9 4.3 -34% -72% 61% 52%
Testing Services 4.1 5.2 5.0 5.5 -5% 28% -4% 11%
Professional Services 6.8 7.4 7.4 8.6 -8% 9% 0% 17%
Proforma revenue 80.4 81.6 91.4 103.7 -3% 1% 12% 13%
Statutory revenue 91.2 91.2 100.8 110.9 8% 0% 11% 10%
Reconciliation to Statutory Accounts
Proforma revenue 80.4 81.6 91.4 103.7
Deduct Amortised licence fees (36.3) (41.0) (50.1) (60.4)
Add Licence fees recognised upfront 47.0 50.7 59.6 67.6
Statutory revenue 91.2 91.2 100.8 110.9
Annual revenue
For
per
sona
l use
onl
y

23
Multiple Channels to MarketCustomer “High Touch” Model
Sales Network
Direct: Global coverage with Fortune 500
Distribution:
Customers
Direct Sales Indirect Sales Service Provider Sales
Alliance Partners
Distribution
Resellers Service Providers
For
per
sona
l use
onl
y

24
Prognosis Solution ComponentsInsightful & effectiveProactive end-to-end insights across multi-vendor ecosystems that drives effective collaboration
Value & speedFast time to value with a small footprint and rapid extensibility
Flexible & SecureCloud enabled with secure access for visibility anytime anywhere
Professional ServicesInstall, Configure, Implement, Train, Optimize Extensions & Analytics
InfrastructureHardware, Operating System, Virtualisation, Network Layer
Core CapabilitiesProactive Availability & Performance ManagementRapid Root Cause Analyst to reduce Mean Time ToResolution (MTTR)
Capacity Planning & Reporting Deep MetricsRealtime
VoIPVideoContact Center
Call Recording Assurance Compliance
Unified Communications Payments Finance Transactions Money Transfer
ATMFraud Detection
For
per
sona
l use
onl
y

25
Supporting Enterprise Customers Evolution to CloudOn-premise to Cloud – the hybrid journey
*Gartner 2019 ** WPR 2019 CAGR 2013-2017
IR will grow revenue with NEWvalue added offerings on the new SaaS platform
Support on-premise, SaaS, and hybrid deployments which will be the majority for the next 5 years
Two solutions this fiscal year leveraging IR’s next gen SaaS platform – payments & UC
Today 25% of UC deployments are cloud based, by 2023 this is forecast to be 37%*
Continue to maintain and protect blue chip on-premise customer base
Leading vendor for on-premise UC, payments, and infrastructure management
For
per
sona
l use
onl
y

26
High Quality RevenuesDiversified contribution and risk spread
Licence fees by contract length
Customer Region Product Group Industry
JP Morgan Americas Pay’t/Infra Financial Services
NTT Global Unified Comms Communications Service Provider
BT Europe Unified Comms Communications Service Provider
Kiwi Bank APAC Payments Financial Services
Contracts with multi-yearduration
Maintenance retention rate: 93%
Major H2 deals across regions and product
0%
10%
20%
30%
40%
50%
60%
FY2017 FY2018 FY2019 FY2020
one and two years three and four years
five years perpetual
For
per
sona
l use
onl
y

Cash FlowImproved cash receipts from customers
Significant improvement in
cash from operations
Continuing dividend payments
Accelerated investment in development
27
Jun 20 * Jun 19 Change
A$M A$M
Cash flows from operating activities
Cash receipts from customers ex debtor factoring 88.8 84.5 5%
Cash receipts from debtor factoring 7.6 5.0 52%
Cash receipts from customers 96.4 89.5 8%
Cash paid to suppliers and employees (66.0) (61.5) 7%
Cash generated from operations 30.3 27.9 8%
Income taxes paid (6.2) (6.7) (8%)
Net cash from operating activities 24.2 21.2 14%
Net cash used in investing activities (14.2) (11.8) 21%
Net cash used in financing activities (9.7) (12.1) (20%)
Net increase/ (decrease) in cash and cash equivalents 0.2 (2.6) (108%)
Cash and cash equivalents at 1 July 9.3 11.2 (17%)
Effects of exchange rate changes on cash 0.2 0.7 (70%)
Cash and cash equivalents at 30 June 9.7 9.3 5%
* Cash outflow from leases of approximately $2 million classified in financing activities as a result of adopting the new accounting standard on leases (AASB16); cash outflow from leases in the comparative column is classified in operating activities
For
per
sona
l use
onl
y

28
Financial track record Growth and return to shareholders
Strong balance sheet – no debt
Strongperformance
Strong balance sheet – net cash $4.7M
Long-term shareholder value
Consistent growth
70.384.5 91.2 91.2
100.8110.9
2015 2016 2017 2018 2019 2020
REVENUE A$M
27% 25%28% 28% 29% 28%
2015 2016 2017 2018 2019 2020
EBIT MARGIN
8.49.4
10.9 11.212.7
14.0
2015 2016 2017 2018 2019 2020
BASIC EPS CENTS
7.56.5 6.5 6.5
7.25 7.25
2015 2016 2017 2018 2019 2020
DIVIDEND PER SHARE CENTSF
or p
erso
nal u
se o
nly

29
Financial Track Record (Annual results)Annual Results (A$M): Jun-10 Jun-11 Jun-12 Jun-13 Jun-14 Jun-15 Jun-16 Jun-17 Jun-18 Jun-19 Jun-20 10 year CAGR
Licence fees 18.4 25.0 28.9 26.6 28.0 41.0 45.7 53.4 52.6 62.8 72.1 15%Revenue 38.2 44.6 48.6 48.9 53.2 70.3 84.5 91.2 91.2 100.8 110.9 11%EBIT 5.7 9.3 11.1 11.1 10.3 19.0 21.4 25.7 25.8 28.9 30.9 18%EBIT margin 15% 21% 23% 23% 19% 27% 25% 28% 28% 29% 28%EBITDA 12.5 15.9 18.5 18.6 17.8 28.1 32.0 37.0 36.2 40.2 42.9 13%EBITDA margin 33% 36% 38% 38% 33% 40% 38% 41% 40% 40% 39%NPAT 5.4 7.5 9.0 9.1 8.5 14.3 16.0 18.5 19.1 21.9 24.1 16%NPAT margin 14% 17% 19% 19% 16% 20% 19% 20% 21% 22% 22%Earnings per share (cents) 3.24 4.47 5.41 5.40 5.03 8.41 9.42 10.86 11.19 12.72 14.00 16%Total dividend per share (cents) 2.50 4.00 5.00 5.00 5.00 7.50 6.50 6.50 6.50 7.25 7.25Payout ratio 77% 89% 92% 93% 99% 89% 69% 60% 58% 57% 50%Return on equity 22% 27% 31% 30% 28% 39% 39% 38% 33% 31% 29%Growth rates:
Licence -13% 36% 15% -8% 5% 46% 11% 17% -2% 19% 15%Revenue -11% 17% 9% 1% 9% 32% 20% 8% 0% 11% 10%EBIT -39% 63% 19% 1% -8% 85% 13% 20% 1% 12% 7%EBITDA -17% 27% 17% 0% -4% 58% 14% 16% -2% 11% 7%NPAT -31% 38% 21% 0% -6% 68% 12% 16% 3% 14% 10%F
or p
erso
nal u
se o
nly