integrated statistics and accounts - united nations · integrated statistics and accounts examples...
TRANSCRIPT

www.bea.gov
Integrated Statistics and Accounts
Examples at BEA
Nicole Mayerhauser
International Workshop on Economic Census, Business Registers and Integrated Economic Statistics
INEGI-UNSD
Aguascalientes, Mexico
29 September – 1 October 2015

www.bea.gov
Decentralized economic statistics
▪ The U.S. is a decentralized statistical system
� Bureau of Economic Analysis –National economic accounts, international economic accounts, regional accounts, trade in services, multinational enterprises (MNE) and foreign direct investment censuses and surveys
� U.S. Census Bureau –Business register, economic census and business surveys
� IRS – Tax data (Statistics of Income)
� Federal Reserve Board – Central bank
Financial accounts, regulatory data
� Bureau of Labor Statistics –Productivity, prices, and labor data
2

www.bea.gov 3
BEA uses all of it!
www.bea.gov 4
Why integrate?
▪ Integration
� Multiple data sets
� Across statistical agencies
� May or may not integrate at micro level
� Across economic disciplines
� One framework to support broader understanding of the macro economy
▪ BEA’s role
� Link projects
� Integrated Macroeconomic Accounts (IMAs)
� Integrated Production Accounts

www.bea.gov
BEA data link projects
▪ BEA-Census link projects
� Link MNE and economic census micro data
� Link MNE and R&D expenditure micro data
� Better understand the role multi nationals play in the U.S. economy
▪ Extended supply-use tables
� Link MNE data to U.S. input-output accounts
� Heterogeneity between foreign vs domestic industry output, inputs, value added
▪ Income distribution
� Linking micro household data to macro data to analyze household spending and income by income distribution (won’t discuss here)
5

www.bea.gov 6
BEA supported integrated accounts
▪ IMAs� Combine financial accounts of the United States
(FAUS) and national income and product accounts (NIPAs)
� Link production and income to changes in net worth through balance sheets
� Trace sources and uses of funds for capital formation and net lending
▪ Productivity Accounts� Integrate U.S. multifactor productivity (MFP) statistics
and national economic accounts
� Identify sources of economic growth and productivity by industry

www.bea.gov
Link Projects
www.bea.gov
Foreign direct investment data
▪ BEA conducts surveys of foreign direct investment in the U.S. (FDIUS) and U.S. direct investment abroad (USFDIA)
▪ Rich source of data on multi-national enterprises
▪ When linked with other data, we can
� Investigate global value chains
� Study impacts of FDI on local employment
� Track potential differences in productivity of NME vs non NME firms
8

www.bea.gov
FDI – economic census link project
▪ Link US affiliates of foreign companies to economic Census establishments
▪ Linked on EIN (employer identification number)
▪ Scope differences – econ census excluded some NAICS industries (agriculture, some air and railroad transportation and some financial industries)
▪ Timing differences – fiscal vs calendar years
▪ Classification differences – parent industry vs affiliate
▪ Last time this was done: 2002
9

www.bea.gov
Some findings (from 2002)
▪ Foreign owned establishments represented:
� 1.7% of total establishments
� 5.4% of employment in U.S
� 7.3% of payroll
� 10.9% of sales
▪ Data available by country and by state
▪ It is time to update these data10

www.bea.gov
FDI – R&D link project
▪ R&D data - Survey of Industrial Research and Development (SIRD) – National Science Foundations and Census Bureau
▪ Linked on EIN for 2004 – 2007
▪ Linked ownership to type of R&D activity and location
▪ Industry classifications differed
� SIRD based on employment
� FDI based on revenue
� Project used SIRD classifications11

www.bea.gov
Some findings (2007)
12
▪ U.S. parents funded 88% of their U.S. R&D from own funds
▪ U.S. affiliates of foreign companies funded 96% of their R&D from nonfederal funds
0
20
40
60
80
100
120
Foreignowned
US parent
Percent
Companyfunded
Federalgovernment funded
▪ The work provided a better picture of how MNEs contribute to R&D in the U.S.
▪ ¾ of R&D spending went to development activity for all groups
▪ NMEs made up 75% of employment of R&D performing companies

www.bea.gov 13
FDI - extended supply-use link project
▪ Increased need to assess impacts of globalization/global value chains on national economies
▪ One approach to measurement: � Trade in Value Added (TiVA)-led by OECD-WTO
▪ Requires global Supply-Use tables (SUTs)� National tables linked together through bilateral
international trade flows
� New work to develop “Extended” SUTs that account for firm-level heterogeneity � E.g., ownership characteristics; MNE/Non;
exporter/nonexporter

www.bea.gov
Proof-of-concept analysis on heterogeneity
▪ Erich Strassner and Jim Fetzer at BEA
▪ To motivate and validate longer-run BEA-Census link project on extended SUT
▪ Use data available to BEA: tabulations from tax returns for all U.S. firms and from BEA’s MNE and SUT
▪ Decomposition of gross output for
� Multi-national enterprises
� Entirely domestic firms
14

www.bea.gov
▪ U.S. parent and affiliate data
� U.S. parents minus majority foreign owned
� BEA surveys of U.S. MNEs
� Value added directly measured as sum of components
▪ Non-MNEs=All U.S. firms less MNEs
� IRS Statistics of Income tax return data
� BEA IO-Employee comp and trade flows
� Value added indirectly measured as Output-Intermediate inputs
Methodology for decomposing output
15

www.bea.gov
Early results for all private industries
16
Note: The experimental estimates presented in this table are provisional and are intended only for discussion and to illustrate the types of analysis that can be performed with this framework.

www.bea.gov
Value added share of output
17
Note: The experimental estimates presented in this figure are provisional and are intended only
for discussion and to illustrate the types of analysis that can be performed with this framework.
VA share of output lower for MNEs than pure domestic establishments

www.bea.gov
Exporters vs. non-exporters
▪ About one-half of U.S. parents and affiliates export
▪ Value added share of output for exporters vs. non-exporters
� All industries
� Smaller for both U.S. parents and affiliates that export
� Manufacturing
� Smaller for U.S. parents that export
� Larger for U.S. affiliates that export
18

www.bea.gov
U.S. Integrated Macroeconomic Accounts IMAs

www.bea.gov 20
Integrated Macro Accounts (IMAs)
▪ BEA and the Federal Reserve
▪ Harmonize financial accounts with capital and current accounts
▪ In general, follow the System of National Accounts 2008
▪ Released quarterly with the FAUS
▪ 7 sectors� Households and NPISHs� Nonfinancial noncorporate business� Nonfinancial corporate business� Financial business� Federal government� State and local governments� Rest of the world
� Government sectors include government enterprises
� In the SNA noncorporate business is either in the quasi-corporate or household sector

www.bea.gov 21
Overview of the IMAs
Current account
• Gross (net) value added
• Net national income
• Disposable income
• Net saving
Capital account
• Net saving
• Capital transfers
• Capital formation
• Net lending/borrowing C
Financial account
• Net acquisition of financial assets
• Net incurrence of liabilities
• Net lending/borrowing F
Other changes in volume and
revaluation accounts
• Statistical discrepancy
• Change in net worth
Balance sheet
• Total assets• Total liabilities• Net worth

www.bea.gov
Analysis using the IMAs
22
� More complete picture of economic activity
� Income and balance sheet data presented together –easy calculation of analytical ratios
� Delineate 4 sources of changes to net worth: � Saving, capital transfers, non
price related changes, variation in market prices (holding gains)
� Shows which sectors are net provider of funds and which are net users of funds
0.0
10.0
20.0
30.0
40.0
1960 1965 1970 1975 1980 1985 1990 1995 2000 2005 2010
Ind
ex
nu
mb
ers
, 1
96
0=
1.0
0
Year
Households and Nonprofits
Net Worth
Net Saving
0
100
200
300
400
500
600
-2,000
-1,000
0
1,000
2,000
2000 2002 2004 2006 2008 2010Year
Nonfinancial Corporate Business – Real Estate
Gross fixed capital formation (right axis)
Revaluation (left axis)
Change in stock (left axis)

www.bea.gov
Net lending and borrowing by sector
23
Source: Yamashita, Takashi, “A Guide to the Integrated Macroeconomic Accounts”, Survey of Current Business, April 2013

www.bea.gov
Highlights differences in datasets
24
▪ Helps identify potential data and measurement gaps
Total Economy Net Lending (+) or Net Borrowing (-) in the Capital and Financial Accounts

www.bea.gov
Challenges
▪ Alignment of data
� NIPAs – NAICS industry based
� But a mix of establishment and enterprise data
� Financial accounts - institution based
▪ Lack of detailed data
� Aggregations of financial sectors masks underlying differences
� Financial products grouped together masks different risk characteristics
25

www.bea.gov
Future of the IMAs
▪ Break out financial sectors
� Depository institutions
� Central Banks
� Pensions and insurance
� Other financial business
▪ Breakout nonprofits from households
▪ Separate structured products from traditional debt instruments
▪ Develop whom-to-whom matrices for debt instruments
▪ Split real estate values into structures and land
26

www.bea.gov
U.S. Integrated Production Accounts

www.bea.gov
Integrated production accounts
28
▪ Motivation
� Long-standing call for statistics on the sources of economic growth
� Researchers constructing their own measures
Jorgenson and Landefeld (2006) in A New Architecture for the U.S. National Accounts
� Call to action – industry-level total factor productivity
The Advisory Committee on Measuring Innovation in the 21st Century: A Report to the Secretary of Commerce (January 2008)

www.bea.gov
BEA national and industry level accounts
▪ National level account
� Private total business and nonfarm business
� Provides reconciliation between GDP and BLS-based output
� Links BLS capital and labor inputs to GDP
▪ Industry level account
� 63 industries
� Links BLS capital and labor inputs to industry value added
� Allows for heterogeneity of industry-specific inputs
29

www.bea.gov
Integrate GDP with productivity
30
▪ Growth accounting framework
▪ Consistent with the definitions and concepts of the U.S. national economic accounts
▪ Symmetric treatment of industry-level outputs, intermediate inputs, and value added inputs
▪ Consistent with aggregate GDP and the Input-Output Framework
� Gross output: BEA intermediate input & value added
� Capital input: BLS, based on BEA Fixed Assets
� Labor input: BLS hours, BEA Compensation
▪ Available annually

www.bea.gov
Sources of growth
▪ GDP growth decomposed into industries and factors of production (KLEMS)
▪ Real value added growth decomposed into primary (capital and labor) inputs and multifactor productivity (MFP)
31
Finance, insurance,
and real estate
www.bea.gov
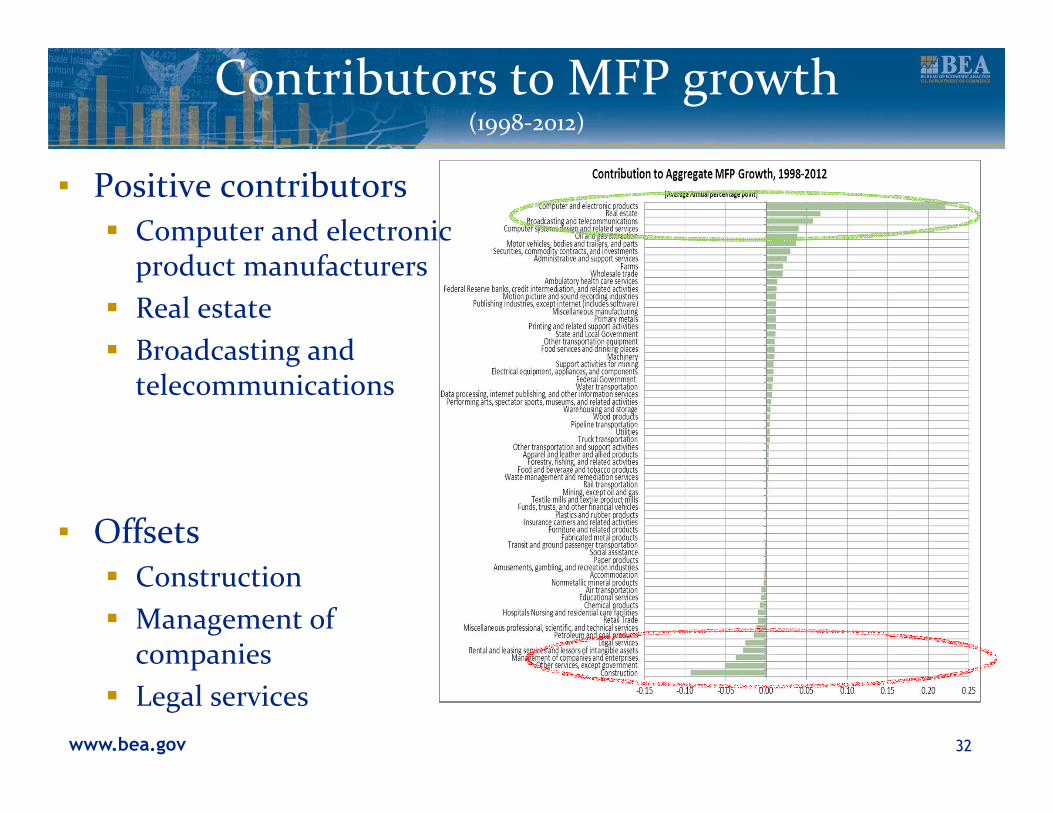
Contributors to MFP growth(1998-2012)
32
▪ Positive contributors� Computer and electronic
product manufacturers
� Real estate
� Broadcasting and telecommunications
▪ Offsets� Construction
� Management of companies
� Legal services

www.bea.gov
Analysis of economic growth
33
1998-2012
GDP 2.02
IT-producing industries 0.31
IT-using industries 0.98
Non-IT industries 0.73
Capital input 1.19
IT-producing industries 0.04
IT-using industries 0.59
Non-IT industries 0.56
Labor input 0.36
IT-producing industries 0.00
IT-using industries 0.30
Non-IT industries 0.06
Multifactor productivity 0.47
IT-producing industries 0.27
IT-using industries 0.09
Non-IT industries 0.11
▪ Capital inputs accounted for about 60 percent of growth� 50 percent due to IT-using
industries
▪ Labor inputs accounted for a bit more than 15 percent
▪ MFP accounted for about 25 percent� 60 percent due to IT-
producing industries

www.bea.gov
Integrated economic accounts
▪ Most relevant when datasets align in scope, classification, and definition
▪ Best chance for this is when data is derived from a single source (like a statistical business register)
▪ Otherwise, time lost to reconciling data sets, filling data gaps, or worse, leaving gaps
▪ National accountants will always find a way to make estimates, but the more consistent their input datasets, the more accurate and relevant the data products will be for policy makers
34

www.bea.gov
Thank you.