integrated system health management: foundational concepts
TRANSCRIPT
Integrated System Health Management: Foundational Concepts, Approach, and Implementation
Fernando Figueroa 1 and John Schmalzel.2
NASA, Stennis Space Center, MS, 3952, USA
Mark Walker 3, Meera Venkatesh4 and Ravi Kapadia 5 General Atomics, San Diego, CA, 92127, USA
and
Jon Morris 6 , Mark Turowski 7 and Harvey Smith 8 Jacobs Technology, Stennis Space Center, MS, 39529, USA
Nomenclature ISHM = integrated system health management DIaK = data, information, and knowledge FCL = Functional Capability Level FMEA = failure modes and effects analysis RCA = Root Cause Analysis HealthMAP = Health Monitoring Assessment and Prognostics NASA = National Aeronautics and Space Administration RETS = Rocket Engine Test Stand OSA-CBM = Open Systems Architecture for Condition-Based Maintenance VISE = Virtual Intelligent Sensor Environement DIaK = Data, Information, and Knowledge LC-20 = Launch Complex 20 SSC = Stennis Space Center KSC = Kennedy Space Center
I. Introduction MPLEMENTATION of integrated system health management (ISHM) capability is fundamentally linked to the management of data, information, and knowledge (DIaK) with the purposeful objective of determining the health
of a system. It is akin to having a team of experts who are all individually and collectively observing and analyzing a complex system, and communicating effectively with each other in order to arrive to an accurate and reliable assessment of its health. We present concepts, procedures, and a specific approach as a foundation for implementing a credible ISHM capability. The capability stresses integration of DIaK from all elements of a system. The intent is also to make possible implementation of on-board ISHM capability, in contrast to a remote capability. The information presented is the result of many years of research, development, and maturation of technologies, and of prototype implementations in operational systems (rocket engine test facilities). The paper will address the following topics:
I
1. ISHM Model of a system
American Institute of Aeronautics and Astronautics
1
2. Detection of anomaly indicators.
1 Office of Public Affairs, NASA Stennis Space Center, AIAA Associate Fellow.. 2 Office of Public Affairs, NASA Stennis Space Center. 3 Lead Engineer, Intelligent Systems, Electromagnetic Systems Division, AIAA Member Grade 4 Program Manager, Intelligent Systems, Electromagnetic Systems Division, and AIAA Member Grade. 5 Senior Engineer, Intelligent Systems, Electromagnetic Systems Division, and AIAA Member Grade. 6 Engineer, Technology Development and Application, M/S B8306. 7 Engineer, Technology Development and Application, M/S B8306. 8 Professional Scientist III, Technology Development and Application, M/S B8306.
American Institute of Aeronautics and Astronautics
2
3. Determination and confirmation of anomalies. 4. Diagnostic of causes and determination of effects. 5. Consistency checking cycle. 6. Management of health information 7. User Interfaces 8. Example implementation ISHM has been defined from many perspectives. We define it as a capability that might be achieved by various
approaches. We describe a specific approach that has been matured throughout many years of development, and pilot implementations. The following definition is extracted from references 1 and 2.
“ISHM is a capability that is achieved by integrating data, information, and knowledge (DIaK) that might be
distributed throughout the system elements (which inherently implies capability to manage DIaK associated with distributed sub-systems). DIaK must be available to any element of a system at the right time and in accordance with a meaningful context. ISHM Functional Capability Level (FCL) is measured by how well a system performs the following functions: (1) detect anomalies, (2) diagnose causes, (3) predict future anomalies/failures, and (4) provide the user with an integrated awareness about the condition of every element in the system and guide user decisions.
The primary technologies that enable achievement of ISHM capability include:
• Algorithms/approaches/methodologies for anomaly detection. • Approaches and methodologies for root-cause analysis to diagnose causes of anomalies. • Approaches and methodologies for prediction of future anomalies. • Architectures/Taxonomies/Ontologies that enable management of DIaK – where management implies distributed
storage, sharing, processing, maintenance, configuration, and evolution. • Software environments that integrate contributing technologies in a modular plug&play fashion, adhering to a
defined architecture/taxonomy/ontology. • User interfaces to provide the user with integrated system awareness. • Intelligent elements that communicate within a network (e.g. sensors, valves, pumps, etc.).
The ISHM philosophy is predicated on:
• Lives and missions depend on vigilant systems. • Data is valuable: No data should be left uninterpreted. • Information is hidden: Intelligence is required to extract information. • Interpretation, reasoning, and decision making require knowledge of how elements interact as part of an
integrated system. Prior work on ISHM covers a substantial number of publications. However, most publications focus on specific
algorithms being applied to specific cases, and with very limited use of information from across system elements18. Others focus on development of special sensors or sensor distribution approaches to allow more effective health management of specific systems, yet others address tools for automating failure modes and effects analysis (FMEA)(many commercial products available), or software for reasoning using states and/or analytic models19.
This paper focuses on an approach to implementing ISHM capability, following a paradigm that encapsulates
DIaK related to any system, within a hierarchical network of intelligent process elements. It emphasizes software environments that integrate contributing technologies in a modular plug&play fashion, while adhering to a defined architecture/taxonomy/ontology. It does not focus on specific algorithms to detect an anomaly, or root-cause analysis implementations for specific systems. Validation is shown through implementation of these capabilities for specific pilot cases.
Unlike other capabilities designed into systems (e.g. thrust capability of an engine), which are not expected to
change during its life cycle; ISHM capabilities must improve throughout the life of the system. This means that new methods and technologies that augment ISHM capabilities need to be incorporated as plug&play modules when they become available. For instance, if a new method to assess signal noise level is developed, which represents an

improvement over the existing method; it should be incorporated seamlessly, without the need for extensive programming or re-assessment of the software.
The following sections describe concepts, approaches, and implementations of ISHM capability. We begin by
defining ISHM models of systems as the basic foundation for the developing a modular and credible capability, along with a description of creation of such models, including a taxonomy. Then we discuss architectures and ontologies for integrating DIaK from across systems; followed by approaches to anomaly detection, root-cause analysis, and user interfaces. We conclude by describing an example pilot implementation.
II. ISHM Model of a System (Architecture, Taxonomy, Ontology) The ISHM model encompasses DIaK needed to achieve ISHM capability. Data is available from sensors and
components. Distribution of DIaK associated with physical elements of a system gives rise to an Information Architecture (IA), where intelligent processes (e.g. physics-based models and other models) at various levels of the architecture are used for consistency checking; and DIaK are managed in a distributed manner1-5 (Figure 1). This hierarchical architecture is connected to models of processes occurring throughout the system (e.g. tank pressurization), and is conceptually different from a typical architecture depicting the physical composition of a system (Figure 2), where the hierarchy is based on how simpler elements are assembled into more complex sub-systems and systems.
Intelligent Sensor
Processes
Intelligent Element
Processes Intelligent
Controllers
Intelligent Subsystem Processess
Intelligent System Processes
Actuator
Intelligent Components
Figure 1. Data, Information, and Knowledge Architecture for ISHM (Information Architecture).
The ISHM architecture embodies intelligent sensor processes at the lowest level, and intelligent processes
associated with combinations of sensors and components (or subsystems) at higher levels. A process represents any model that describes physical phenomena occurring in the system. “Intelligent” process models have two important qualities: they are generic to a large degree, in that they encapsulate descriptions of phenomena associated with first principles; and they can be readily and automatically specialized to a specific process in a specific system using data and information encapsulated in elements of the architecture. Processes at higher levels integrate more information and knowledge associated with a collection of elements that partake in the processes (e.g. an integrated flow model through a fuel-feed subsystem from a pressurized tank to a combustion chamber will include the tank, valves to regulate the flow, pressure and temperature sensors, flow instruments, and the combustion chamber). Results of consistency checking at lower levels (e.g. results from separate models of flow thru the tank and a valve) are either confirmed, negated, or left unchanged (no opinion), by results at higher levels (flow thru the entire sub-system). Processes at higher levels generate information that improves assessments associated with processes at lower levels.
American Institute of Aeronautics and Astronautics
3
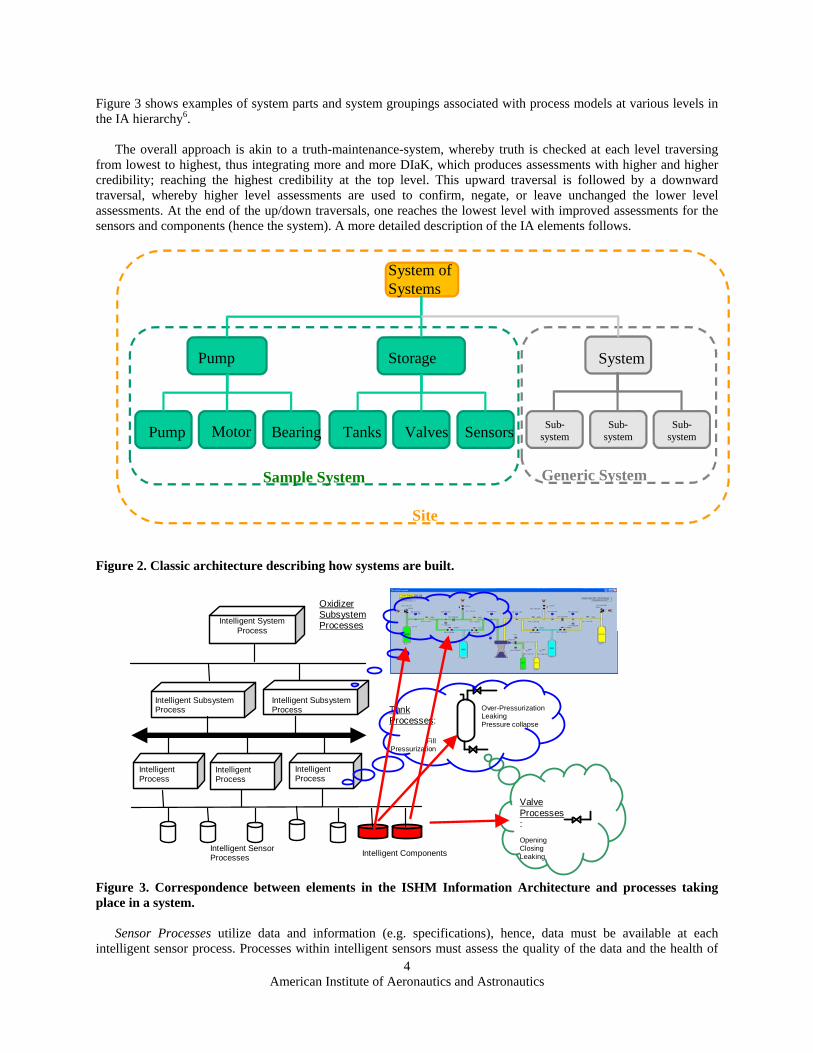
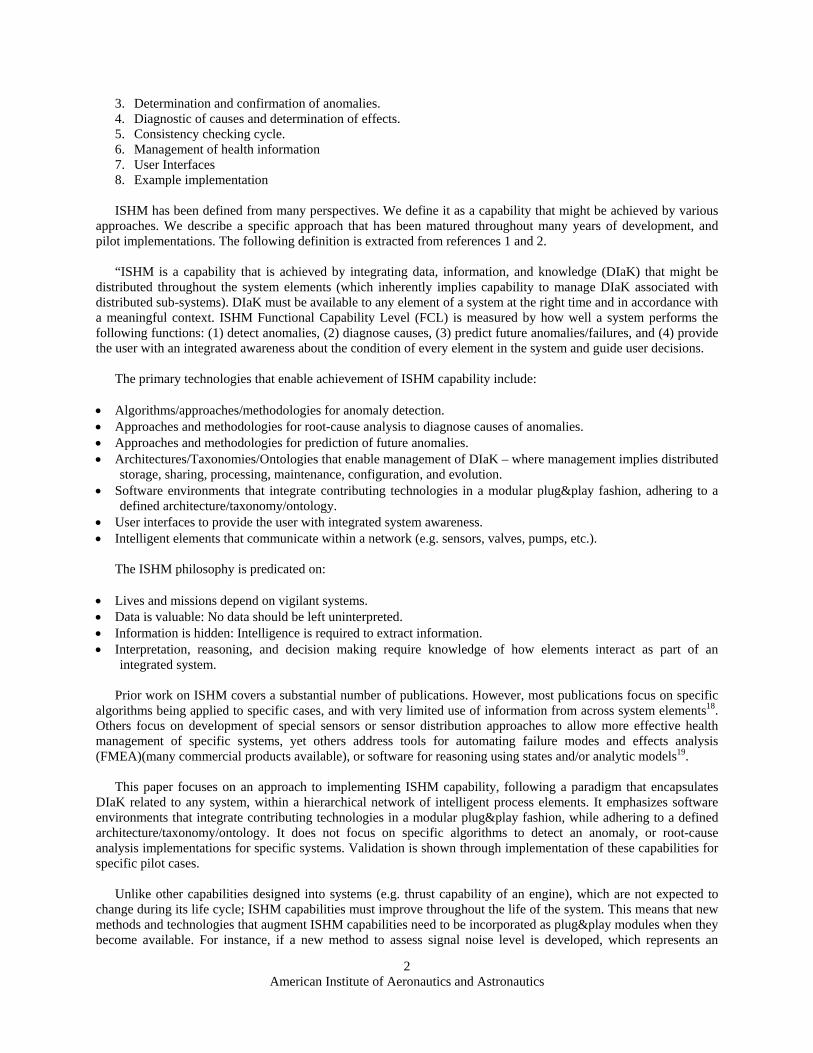
Figure 3 shows examples of system parts and system groupings associated with process models at various levels in the IA hierarchy6.
The overall approach is akin to a truth-maintenance-system, whereby truth is checked at each level traversing
from lowest to highest, thus integrating more and more DIaK, which produces assessments with higher and higher credibility; reaching the highest credibility at the top level. This upward traversal is followed by a downward traversal, whereby higher level assessments are used to confirm, negate, or leave unchanged the lower level assessments. At the end of the up/down traversals, one reaches the lowest level with improved assessments for the sensors and components (hence the system). A more detailed description of the IA elements follows.
System ofSystems
Pump
Pump Motor Bearing
Storage
Tanks Valves Sensors
System
Sub-system
Sub- system
Sub-system
Sample System Generic System
Site
Figure 2. Classic architecture describing how systems are built.
Valve Processes: Opening Closing Leaking
Fill Pressurization
Over-Pressurization Leaking Pressure collapse
Tank Processes:
Intelligent Sensor Processes
Intelligent System Process
Intelligent Process Intelligent
Process Intelligent Process
Intelligent Components
Intelligent Subsystem Process
Oxidizer Subsystem Processes
Intelligent Subsystem Process
Figure 3. Correspondence between elements in the ISHM Information Architecture and processes taking place in a system.
Sensor Processes utilize data and information (e.g. specifications), hence, data must be available at each
intelligent sensor process. Processes within intelligent sensors must assess the quality of the data and the health of
American Institute of Aeronautics and Astronautics
4

American Institute of Aeronautics and Astronautics
5
the sensor. These processes may reside in physical intelligent sensors or virtual ones (virtual sensors are realized by streaming sensor data to software in a computational unit, which transforms legacy sensors into intelligent ones)7-11.
Element Processes (or component processes) can be encapsulated within components, such as a tank or valve.
Eventually, Element Processes must have available data and information from sensors that are installed specifically as an integral part of that element (e.g. position feedback, open and close limit switches, and command signal on a valve).
Subsystem Processes consume information from Sensor and Element Processes (primarily health, but also
transducer data sheets and data) to execute more integrated consistency checks. System Processes and higher levels are similar to subsystem processes; they consume data and information from
lower levels, for increasingly more integrated and credible consistency checks. Predictive Processes are a special case of processes. Predictive processes tend to be analytic models of processes
involving sensors, elements, subsystems, and/or systems. The purpose of these models is to predict sensor readings, and, for implementation purposes, they are considered as specialized “virtual” sensors.
III. Detection of Anomaly Indicators Anomaly indicators are related events or features that, when interpreted within a context, help assess anomalies.
A. Anomaly Indicators at Sensors Indicators that can be detected with localized sensor information and data. For example, excessive noise, spikes,
etc. These indicators can lead to detection of anomalies, e.g. unattached thermocouple (combination of high noise, and perhaps 60 Hz interference, plus wear indicators such as drift, and even life/duty-cycle records). However, for anomaly detection (identification), additional information from the process in which the sensor participates is often needed; e.g. the time constant of the measurand.
B. Anomaly Indicators at Components Generally, an anomaly indicator at a component is a result of reasoning that involves data and information from
sensors associated with the component and models of processes taking place in the component e.g. pressurized tank, tank fill, fill/drain valve state, etc. In this case, what is needed are sensor data, a measure of the quality of the data, and sensor health (perhaps just good, suspect, and bad health states), and process models to detect anomaly indicators by checking consistency of sensors and model. For example, in the case of a valve, an indicator of a valve being stuck open is given by a reading of the position feedback sensor remaining constant at an opening different from the value of the valve command signal. However, other information is needed to determine with certainty that the valve is indeed stuck.
The architecture, standards, and object classes in the ISHM model should allow automatic (standardized) access
of data and information to run the process models, and make models’ outputs available to other models for further inferences.
IV. Detection and Confirmation of Anomalies Detection and confirmation of anomalies are done through use of process models that involve a sensor, a
component and associated sensors, and combinations of components and sensors that might be defined as subsystems for the application of specific process models (strategies).
A. Anomalies at Sensors Some anomalies might be determined using localized data and information, however, confirmation of an
anomaly will come from models that incorporate one or more components. The approach to confirmation is to let the sensors know when their health assessment is consistent, not consistent, or not affected by assessments at higher levels. The highest priority of ISHM is to determine sensor anomalies.
B. Anomalies at Components

Anomalies at components, e.g. valve stuck, can be determined with data and information from the valve, its sensors, and one or more process models describing a stuck condition. However, just as in the case of sensors, if this assessment is not consistent with higher level models (that include the valve), the inconsistency is communicated to the valve to help it improve its assessment. The second highest priority of ISHM is to determine component anomalies.
V. Diagnostic of causes and determination of effects Detection of events and determination of causes and effects need to be inferred and analyzed within the ISHM
Model. Sensor information such as rate of increase or decrease, and health parameters (noise level, presence of spikes, etc.) should be available within the intelligent sensor object of the ISHM model. Sensor data is also needed for display purposes; although, in order to decrease the computational requirements within the ISHM Model, a display and user interface system can be hosted in another processor with access to DIaK from sensors and from the ISHM model.
A. Root Cause Analysis Failure modes are distinct mechanisms by which the components can fail. From these failure modes it is possible
to construct a directed “fault model” – a directed graph which represents failure modes and their downstream effects as nodes, and uses directed edges to depict the causal relationships between them.
Such fault models can be traversed by software to aid in determining the causes of abnormal system behavior.
When a measureable effect (an anomaly event) is observed, Root Cause Analysis (RCA) traverses the fault model in the upstream direction to determine possible causes and to identify the necessary tests to diagnose and isolate the root causes of the observed events. Fault models can also be traversed downstream to identify and predict degradations that lead to system failures (Figure 4) --- this is commonly referred to as Impact Analysis.
When leveraged with generic object models, these model-based analyses techniques can provide a powerful
diagnosis and prediction capability. To build health management applications that avail of this capability, it is important to define system models that capture specific objects and their dynamic relationships. In addition to defining the fault models themselves, it is also critical to define methods for detecting events that trigger the traversal through the fault models.
Figure 4. Root-cause trees with generic objects representing two possible sets of cause-effect relations associated with a leak event detection. The failure modes represented by the trees apply to classes of objects such as valves, flow subsystems, sensors, and other general process equipment.
B. Software Capabilities The authors and collaborators have developed a software toolkit that addresses implementation of RCA in a
modular and methodic manner; and incorporates the ability to use complex and dynamic relationships that must be considered to achieve credible RCA. Health Monitoring Assessment and Prognostics (HealthMAP)12 is a model-based framework that supports the development of applications that monitor system sensors, generate alarms, diagnose their root causes, initiate time-based and condition-based maintenance procedures, assess component health and predict component life expectancy, and provide intelligent decision support. HealthMAP relies on two
American Institute of Aeronautics and Astronautics
6
American Institute of Aeronautics and Astronautics
7
types of object-oriented system models: (1) component-centric domain models and (2) qualitative fault models. The domain models represent the set of physical components that are to be managed by the application, the behaviors of these components, the system topology, and the static and dynamic relationships among the components. Qualitative fault models capture generic expert diagnostic reasoning in the form of causal directed graphs. These models are used to isolate root causes and predict future impacts.
At the heart of HealthMAP is a hierarchical, graphical, object-oriented, component centric domain representation
that models the system topology. HealthMAP contains a library of such domain object definitions with attributes that model the configuration, state, and behaviors of the domain object instances and methods for various purposes including behavior simulation, health assessment, initialization, and so on. HealthMAP facilitates the definition of generic relationships among system components that are utilized in powerful ways within a real-time model-based reasoning environment. For example, at any given time in a hydraulic system there will be some number of pipes, valves, and tanks downstream of a pump that is driving flow through the system. Since the positions of valves in a hydraulic system might be changing dynamically, the sets of components upstream and downstream of each other are potentially in a constant state of flux. Knowing in real-time what valves are open, which components are downstream, or what pumps are supplying which components, can be crucial for performing system health management tasks like detecting leaks and obstructions and analyzing flow paths. It is this ability to maintain a real-time understanding of complex dynamic relations that enables the model-based HealthMAP to reason over systems based on operational context.
Whenever new state information is received, HealthMAP can traverse the underlying domain model based on
existing object relationships, and then dynamically update those relationships based on new information. Reasoning over dynamic relationships is a key capability of HealthMAP. Correlating the events and state of one object with the events and state of related objects provides for powerful fault diagnosis capability.
HealthMAP captures diagnostic knowledge in the form of graphical object oriented qualitative causal fault
models. When a component starts to deteriorate or becomes completely unavailable, ISHM requires that the impact of this component on the ability of every related component to deliver its functionality must be recognized. Some of the nodes in a fault model correspond to observable events (i.e., symptoms) that are detected from system parameter measurements using various techniques such as threshold checking, fuzzy logic, statistical processing, pattern recognition, and comparison with expected values derived from modeling and simulation.
The detection of an event on a domain object triggers HealthMAP’s diagnostic reasoning process, which
dynamically combines the domain model, generic fault models, and incoming events to produce a specific fault model that applies to the specific set of system components based on the relationships that exist among the components at the time of the creation of the specific fault model. Propagation along the causal links within the specific fault model aids in the determination of upstream root causes and downstream impacts. Specific fault models capture the full range of causal relationships that exist based on actual equipment configurations.
VI. Consistency checking cycle This section addresses the problem of where to begin the cycle of consistency checking that leads to anomaly
(indicators) detection and diagnostics. Locally assessed health information should be done first to feed higher level process models. At every level upward, re-assessment of health information should flow down. The principle is to assess component health based on good sensor information and process models. The following cycle should be implemented: 1. Initiation: All sensor local health assessment done with information at the lowest level of the IA. 2. Apply Level 1 process models and re-assess sensor health (each sensor should receive a consistency value for
each process in which it participates: consistent, not consistent, or unchanged). 3. Apply the same approach as in 2 for higher level process models, thus implementing the upward and downward
traversals described in the Section “ISHM Model of a System.” NOTE: at every level of the DIaK hierarchy, assessements are challenged (re-assessed) by process models at higher levels. This activity takes place asynchronously, any time new assessments are made by a multitude of processes running in parallel when permitted.
American Institute of Aeronautics and Astronautics
8
VII. Management of health information As the paradigm of ISHM is based on availability of DIaK across elements of a system, where intelligent
elements can be distributed on a network, it is very important to adhere to standards to achieve plug&play interoperability. For example, any intelligent sensor should be capable of basic activities for system configuration, operation, and maintenance. Standards that embody these capabilities for sensors and actuators exist now. The IEEE 1451 family of standards13,14 for smart sensors and actuators has been developed jointly by NIST and industry. “Real-Time” health information from sensors and components can be methodically managed using the IEEE 1451 standards. Another standard, OSA-CBM (Open Systems Architecture for Condition-Based Maintenance)15 applies to the management of a wide range of health related information, and should be used in conjunction with the IEEE 1451 standards. Both standards are focused on DIaK management in “Real-Time.”
A crucial capability made possible by standards is interoperability of elements and/or applications that provide
data and information to an ISHM system (such as intelligent sensors or other algorithms running on a computer connected to the network). For instance, a visualization (user interface) capability that is enabled with gateways supporting the IEEE 1451.1 and the OSA-CBM standards, can consume sensor data, along with health information from sensors and ISHM systems. It can also interact with intelligent sensors and ISHM systems to request for specific information. In this manner, computational requirements on the ISHM system are reduced to activities that involve integrated reasoning with information that has been initially processed by distributed elements.
VIII. User Interfaces Display of system health information is addressed as a special user interface problem that is not yet well
developed by the community. Most interfaces are simple 2-D screens similar to control screens, where data is shown on sensors and components. Display information should include health and data, and the opportunity to explore the approach, DIaK, and reasoning behind health assessments. User interfaces should allow for the most intuitive ways to achieve integrated awareness of the system by the user. They should also include capabilities for “real time” and “historic” descriptions.
We have started implementation of 3-D navigation visualization applications to achieve integrated awareness by
the user. These efforts involve the ISHM architecture that provides DIaK via buses accessible to computational resources that embody standardized user-interface applications. In this sense, user interfaces become consumers of products from intelligent sensors and actuators, and the ISHM system and model.
IX. Example Implementations Current projects at General Atomics12 include applying this methodology to state of the art electromagnetic
systems for launching and arresting airplanes from an aircraft carrier. As system availability and reliability are critical for such systems, General Atomics is leveraging this methodology to diagnose and predict the health and life expectancy of aircraft launch and landing gear components.
National Aeronautics and Space Administration (NASA) and General Atomics have collaborated for managing
the health of NASA’s Rocket Engine Test Stand (RETS). RETS tests the structural integrity of a rocket before it is launched, and typically provides NASA’s engineers their last chance to detect and correct any flaws in the fully assembled rocket. The fault management application has been deployed at NASA’s Stennis Space Center facility in southern Mississippi.
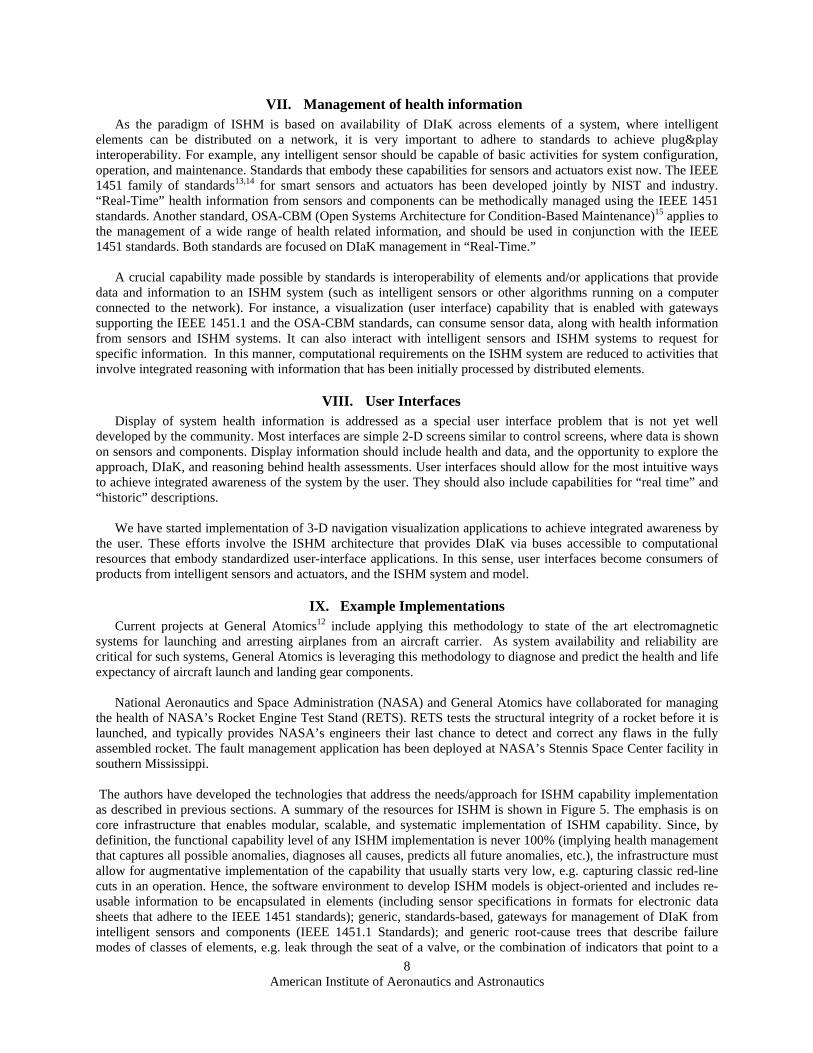
The authors have developed the technologies that address the needs/approach for ISHM capability implementation as described in previous sections. A summary of the resources for ISHM is shown in Figure 5. The emphasis is on core infrastructure that enables modular, scalable, and systematic implementation of ISHM capability. Since, by definition, the functional capability level of any ISHM implementation is never 100% (implying health management that captures all possible anomalies, diagnoses all causes, predicts all future anomalies, etc.), the infrastructure must allow for augmentative implementation of the capability that usually starts very low, e.g. capturing classic red-line cuts in an operation. Hence, the software environment to develop ISHM models is object-oriented and includes re-usable information to be encapsulated in elements (including sensor specifications in formats for electronic data sheets that adhere to the IEEE 1451 standards); generic, standards-based, gateways for management of DIaK from intelligent sensors and components (IEEE 1451.1 Standards); and generic root-cause trees that describe failure modes of classes of elements, e.g. leak through the seat of a valve, or the combination of indicators that point to a
unattached thermocouple. This software environment was developed using G2 and Optegrity; commercial products suited for implementation of intelligent applications21. The focus of the software is to enable building of models for ISHM implementation; in an analogous manner as LabView22 enables building of data acquisition, signal processing, and control implementations. Pallets provide easy access to classes of objects that are graphically connected to build domain ISHM models (mechanical, electrical, and others).
Go To Part View Part
ISHM Models (Embedded Data, Information, and Knowledge): MTTP Implementation
Health Anomaly Database: Health Electronic Data Sheets
Integrated Awareness: 3-D Health Visualization of MTTP
Anomaly Detection:
Leaks, etc.
Intelligent Sensors: IEEE Standard+Health
Embedding of Predictive Models e.g. flow through a valve.
Root Cause Analysis
MTTP
Figure 5. Technologies, tools, resources, and expertise to implement ISHM capability.
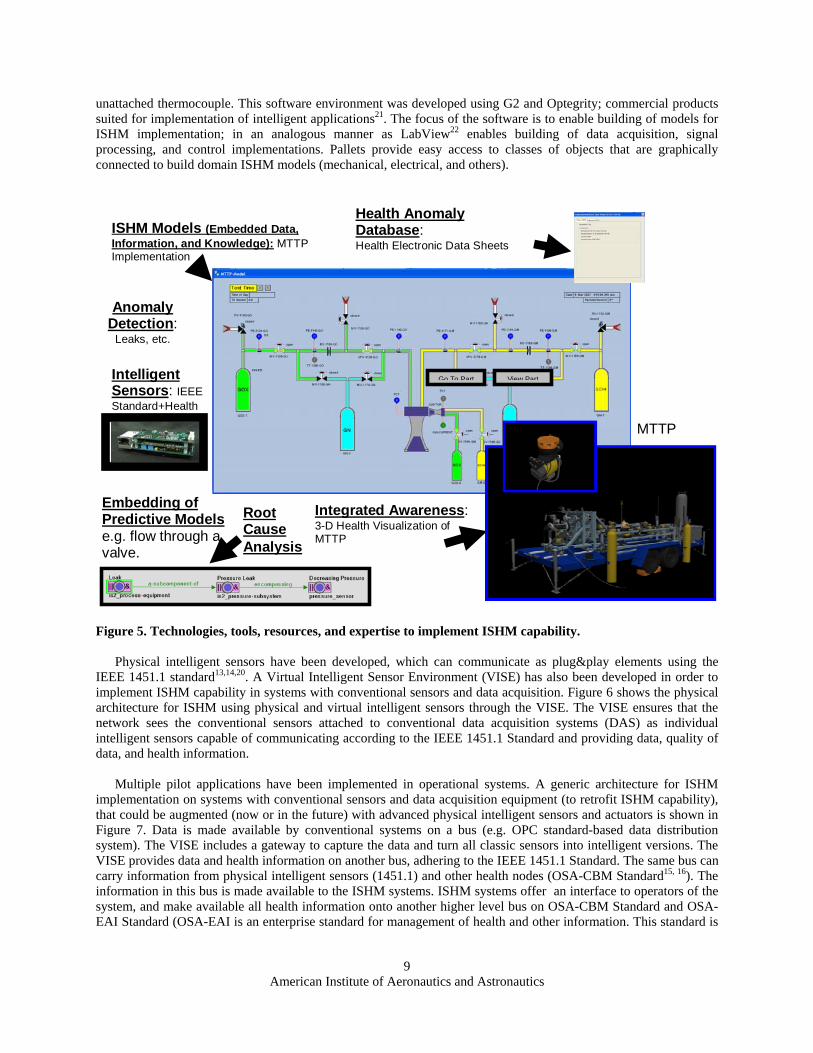
Physical intelligent sensors have been developed, which can communicate as plug&play elements using the IEEE 1451.1 standard13,14,20. A Virtual Intelligent Sensor Environment (VISE) has also been developed in order to implement ISHM capability in systems with conventional sensors and data acquisition. Figure 6 shows the physical architecture for ISHM using physical and virtual intelligent sensors through the VISE. The VISE ensures that the network sees the conventional sensors attached to conventional data acquisition systems (DAS) as individual intelligent sensors capable of communicating according to the IEEE 1451.1 Standard and providing data, quality of data, and health information.
Multiple pilot applications have been implemented in operational systems. A generic architecture for ISHM implementation on systems with conventional sensors and data acquisition equipment (to retrofit ISHM capability), that could be augmented (now or in the future) with advanced physical intelligent sensors and actuators is shown in Figure 7. Data is made available by conventional systems on a bus (e.g. OPC standard-based data distribution system). The VISE includes a gateway to capture the data and turn all classic sensors into intelligent versions. The VISE provides data and health information on another bus, adhering to the IEEE 1451.1 Standard. The same bus can carry information from physical intelligent sensors (1451.1) and other health nodes (OSA-CBM Standard15, 16). The information in this bus is made available to the ISHM systems. ISHM systems offer an interface to operators of the system, and make available all health information onto another higher level bus on OSA-CBM Standard and OSA-EAI Standard (OSA-EAI is an enterprise standard for management of health and other information. This standard is
American Institute of Aeronautics and Astronautics
9
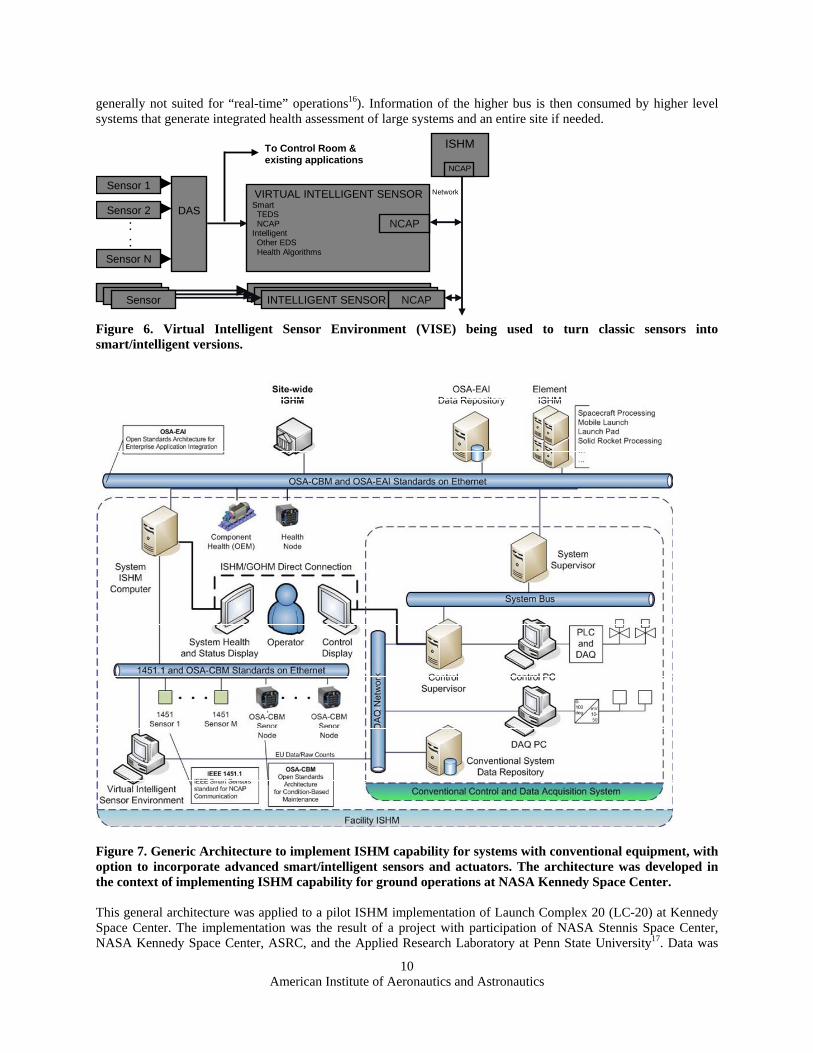
generally not suited for “real-time” operations16). Information of the higher bus is then consumed by higher level systems that generate integrated health assessment of large systems and an entire site if needed.
Sensor 1
Sensor 2
Sensor N
DAS
: :
VIRTUAL INTELLIGENT SENSOR Smart TEDS NCAP Intelligent Other EDS Health Algorithms
ISHM
NCAP
Sensor INTELLIGENT SENSORSensor INTELLIGENT SENSORSensor INTELLIGENT SENSOR
NCAP
NCAP
Network
To Control Room & existing applications
Figure 6. Virtual Intelligent Sensor Environment (VISE) being used to turn classic sensors into smart/intelligent versions.
Figure 7. Generic Architecture to implement ISHM capability for systems with conventional equipment, with option to incorporate advanced smart/intelligent sensors and actuators. The architecture was developed in the context of implementing ISHM capability for ground operations at NASA Kennedy Space Center. This general architecture was applied to a pilot ISHM implementation of Launch Complex 20 (LC-20) at Kennedy Space Center. The implementation was the result of a project with participation of NASA Stennis Space Center, NASA Kennedy Space Center, ASRC, and the Applied Research Laboratory at Penn State University17. Data was
American Institute of Aeronautics and Astronautics
10
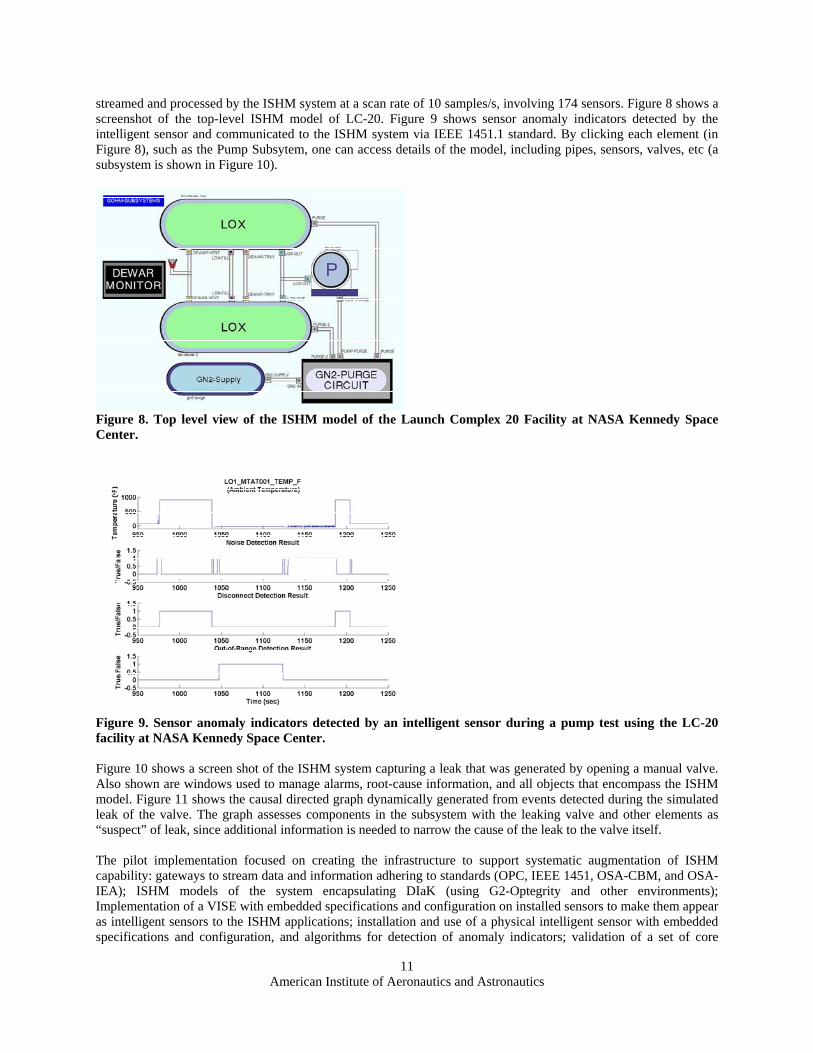
streamed and processed by the ISHM system at a scan rate of 10 samples/s, involving 174 sensors. Figure 8 shows a screenshot of the top-level ISHM model of LC-20. Figure 9 shows sensor anomaly indicators detected by the intelligent sensor and communicated to the ISHM system via IEEE 1451.1 standard. By clicking each element (in Figure 8), such as the Pump Subsytem, one can access details of the model, including pipes, sensors, valves, etc (a subsystem is shown in Figure 10).
Figure 8. Top level view of the ISHM model of the Launch Complex 20 Facility at NASA Kennedy Space Center.
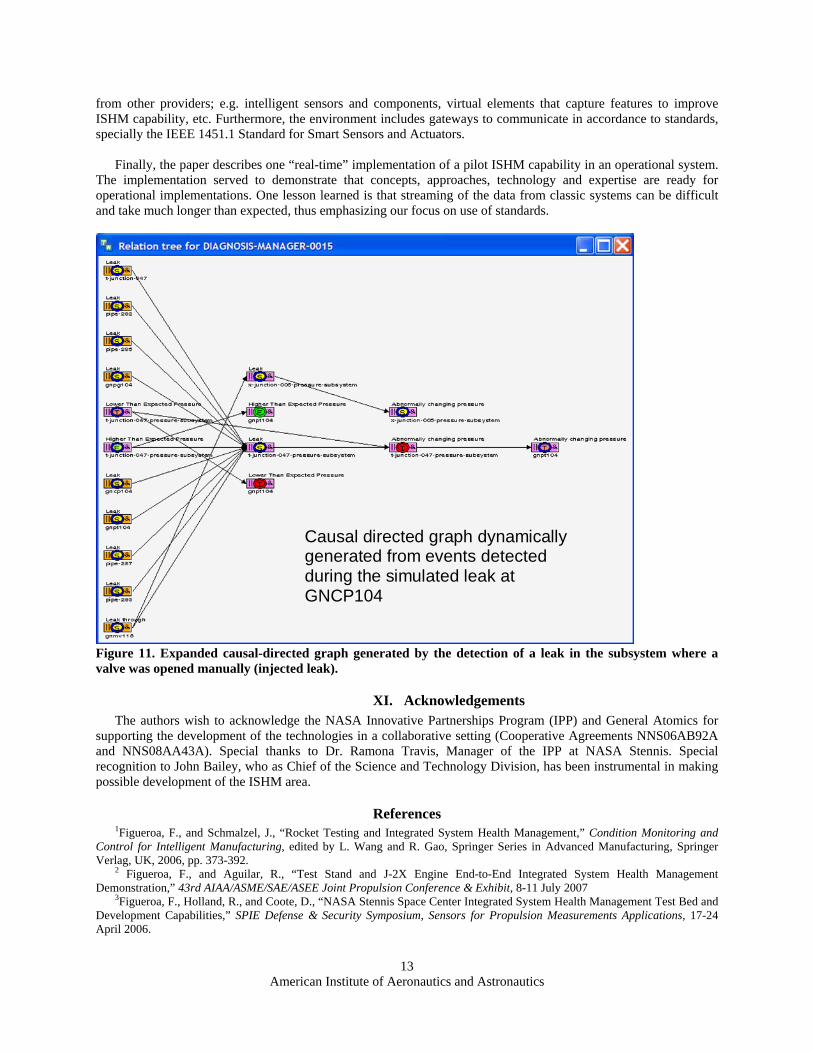
Figure 9. Sensor anomaly indicators detected by an intelligent sensor during a pump test using the LC-20 facility at NASA Kennedy Space Center. Figure 10 shows a screen shot of the ISHM system capturing a leak that was generated by opening a manual valve. Also shown are windows used to manage alarms, root-cause information, and all objects that encompass the ISHM model. Figure 11 shows the causal directed graph dynamically generated from events detected during the simulated leak of the valve. The graph assesses components in the subsystem with the leaking valve and other elements as “suspect” of leak, since additional information is needed to narrow the cause of the leak to the valve itself. The pilot implementation focused on creating the infrastructure to support systematic augmentation of ISHM capability: gateways to stream data and information adhering to standards (OPC, IEEE 1451, OSA-CBM, and OSA-IEA); ISHM models of the system encapsulating DIaK (using G2-Optegrity and other environments); Implementation of a VISE with embedded specifications and configuration on installed sensors to make them appear as intelligent sensors to the ISHM applications; installation and use of a physical intelligent sensor with embedded specifications and configuration, and algorithms for detection of anomaly indicators; validation of a set of core
American Institute of Aeronautics and Astronautics
11
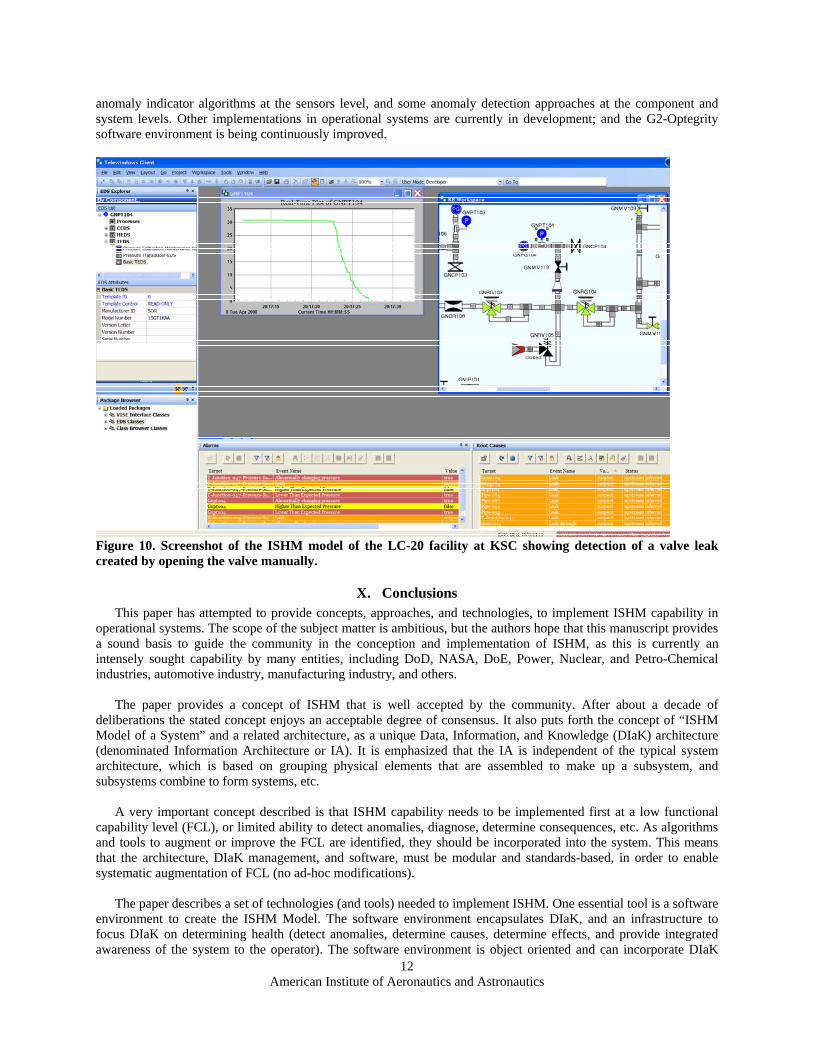
anomaly indicator algorithms at the sensors level, and some anomaly detection approaches at the component and system levels. Other implementations in operational systems are currently in development; and the G2-Optegrity software environment is being continuously improved.
Figure 10. Screenshot of the ISHM model of the LC-20 facility at KSC showing detection of a valve leak created by opening the valve manually.
X. Conclusions This paper has attempted to provide concepts, approaches, and technologies, to implement ISHM capability in
operational systems. The scope of the subject matter is ambitious, but the authors hope that this manuscript provides a sound basis to guide the community in the conception and implementation of ISHM, as this is currently an intensely sought capability by many entities, including DoD, NASA, DoE, Power, Nuclear, and Petro-Chemical industries, automotive industry, manufacturing industry, and others.
The paper provides a concept of ISHM that is well accepted by the community. After about a decade of
deliberations the stated concept enjoys an acceptable degree of consensus. It also puts forth the concept of “ISHM Model of a System” and a related architecture, as a unique Data, Information, and Knowledge (DIaK) architecture (denominated Information Architecture or IA). It is emphasized that the IA is independent of the typical system architecture, which is based on grouping physical elements that are assembled to make up a subsystem, and subsystems combine to form systems, etc.
A very important concept described is that ISHM capability needs to be implemented first at a low functional
capability level (FCL), or limited ability to detect anomalies, diagnose, determine consequences, etc. As algorithms and tools to augment or improve the FCL are identified, they should be incorporated into the system. This means that the architecture, DIaK management, and software, must be modular and standards-based, in order to enable systematic augmentation of FCL (no ad-hoc modifications).
American Institute of Aeronautics and Astronautics
12
The paper describes a set of technologies (and tools) needed to implement ISHM. One essential tool is a software environment to create the ISHM Model. The software environment encapsulates DIaK, and an infrastructure to focus DIaK on determining health (detect anomalies, determine causes, determine effects, and provide integrated awareness of the system to the operator). The software environment is object oriented and can incorporate DIaK
from other providers; e.g. intelligent sensors and components, virtual elements that capture features to improve ISHM capability, etc. Furthermore, the environment includes gateways to communicate in accordance to standards, specially the IEEE 1451.1 Standard for Smart Sensors and Actuators.
Finally, the paper describes one “real-time” implementation of a pilot ISHM capability in an operational system.
The implementation served to demonstrate that concepts, approaches, technology and expertise are ready for operational implementations. One lesson learned is that streaming of the data from classic systems can be difficult and take much longer than expected, thus emphasizing our focus on use of standards.
Causal directed graph dynamically generated from events detected during the simulated leak at GNCP104
Figure 11. Expanded causal-directed graph generated by the detection of a leak in the subsystem where a valve was opened manually (injected leak).
XI. Acknowledgements The authors wish to acknowledge the NASA Innovative Partnerships Program (IPP) and General Atomics for
supporting the development of the technologies in a collaborative setting (Cooperative Agreements NNS06AB92A and NNS08AA43A). Special thanks to Dr. Ramona Travis, Manager of the IPP at NASA Stennis. Special recognition to John Bailey, who as Chief of the Science and Technology Division, has been instrumental in making possible development of the ISHM area.
References 1Figueroa, F., and Schmalzel, J., “Rocket Testing and Integrated System Health Management,” Condition Monitoring and
Control for Intelligent Manufacturing, edited by L. Wang and R. Gao, Springer Series in Advanced Manufacturing, Springer Verlag, UK, 2006, pp. 373-392.
2 Figueroa, F., and Aguilar, R., “Test Stand and J-2X Engine End-to-End Integrated System Health Management Demonstration,” 43rd AIAA/ASME/SAE/ASEE Joint Propulsion Conference & Exhibit, 8-11 July 2007
3Figueroa, F., Holland, R., and Coote, D., “NASA Stennis Space Center Integrated System Health Management Test Bed and Development Capabilities,” SPIE Defense & Security Symposium, Sensors for Propulsion Measurements Applications, 17-24 April 2006.
American Institute of Aeronautics and Astronautics
13

American Institute of Aeronautics and Astronautics
14
4Schmalzel, J., Figueroa, F., Morris, J., Mandayam, S., and Polikar, R., “An Architecture for Intelligent Systems Based on Smart Sensors,” IEEE Transactions on Instrumentation and Measurement, Vol. 54, No. 4, August 2005, pp. 1612-1616.
5Figueroa, F., Holland, R., Schmalzel, J., and Duncavage, D., “Integrated System Health Management (ISHM): Systematic Capability Implementation,” Sensors Applications Symposium, 2006, Proceedings of the 2006 IEEE, 7-9 February 2006, pp. 202-206.
6 Karl Reichard, Fernando Figueroa, Rebecca Oosdyke, John Schmalzel, and Jose Perotti, “An ISHM Architecture for Ground Operations Health Management,” ISHM Conference, Covington Convention Center, KY, August11-14, 2008.
7Mahajan, A., Chitikeshi, S., Bandhil, P., Utterbach, L. and Figueroa, F., “Intelligent Sensors – An Integrated Approach,” Proceedings of the 5th International Workshop on Structural Health Monitoring, 12-14 September 2005.
8Chitikeshi, S., Bandhil, P., Utterbach, L., Mahajan, A. and Figueroa, F., “Intelligent Sensors – Strategies for an Integrated Systems Approach,” Proceedings of the ASME IMECE2005, 6-11 November 2005.
9Kuipers, B. J., “Reasoning With Qualitative Models,” Artificial Intelligence, Vol. 59, 1993, pp. 125-132. 10Mahajan, A., and Figueroa F., "Dynamic Across Time Autonomous - Sensing, Interpretation, Model Learning, and
Maintenance Theory," Mechatronics, Vol. 5, No. 6, 1995, pp. 665-693. 11Prosser, W. H., Allison, S. G., Woodard, S. E., Wincheski, R. A., Cooper, E. G., Price, D. C., Hedley, M., Prokopenko, M.,
Scott, D. A., Tessler, A., and Spangler, J. L., “Structural Health Management for Future Aerospace Vehicles,” Proceedings of the 2nd Australian Workshop on Structural Health Management, 2004.
12General Atomics, 13Lee, K., “Sensor Networking and Interface Standardization,” Proc. 18th IMTC, 2001, pp. 147-152. 14Lee, K., “Smart Transducer Interface Standards for Condition Monitoring and Control of Machines,” Condition Monitoring
and Control for Intelligent Manufacturing, edited by L. Wang and R. Gao, Springer Series in Advanced Manufacturing, Springer Verlag, UK, 2006, pp. 347-372.
15Discenzo, F. M. (Rockwell Automation, Cleveland, OH), Nickerson, W. (Oceana Sensors, State College, PA), Mitchell, C. E. (Boeing Phantom Works, Long Beach, CA), and Keller, K. J. (Boeing Phantom Works, Saint Louis, MO), “Open Systems Architecture Enables Health Management for Next Generation System Monitoring and Maintenance Development Program” -White Paper, 20002, , http://www.mimosa.org/
16Machinery Information Management Open Systems Alliance (MIMOSA), http://www.mimosa.org/ 17Karl Reichard, Fernando Figueroa, Rebecca Oosdyke, John Schmalzel, and Jose Perotti, “An ISHM Architecture for
Ground Operations Health Management,” ISHM Conference, Covington Convention Center, KY, August11-14, 2008. 18Davidson, M., and Stephens, J., “Advanced Health Management System for the Space Shuttle Main Engine,” 40th
AIAA/ASME/SAE/ASEE Joint Propulsion Conference, 11-14 July 2004 19Park, H. G., and Zak, M., “Grey-box Approach for Fault Detection of Dynamical Systems,” ASME Journal of Dyn. Sys.,
Meas., & Control, Vol. 125, 2003, pp. 451-454. 20Oosdyk, R., Mata, C., and Perotti, J., “A Kennedy Space Center Implementation of IEEE 1451 Networked Smart Sensors
and Lessons Learned,” IAC 2006 – IEEE Aerospace Conference, Big Sky, Montana, March 4-11, 2006. 21Gensym Corporation, www.gensym.com. 22National Instruments, www.ni.com