integrated virtual debugger for visual studio developer’s ... · integrated virtual debugger for...
TRANSCRIPT
Integrated Virtual Debugger forVisual Studio Developer’s Guide
VMware Workstation 8.0
This document supports the version of each product listed andsupports all subsequent versions until the document is replacedby a new edition. To check for more recent editions of thisdocument, see http://www.vmware.com/support/pubs.
EN-000630-00
VMware, Inc.3401 Hillview Ave.Palo Alto, CA 94304www.vmware.com
2 VMware, Inc.
Integrated Virtual Debugger for Visual Studio Developer’s Guide
You can find the most up-to-date technical documentation on the VMware Web site at:
http://www.vmware.com/support/
The VMware Web site also provides the latest product updates.
If you have comments about this documentation, submit your feedback to:
Copyright © 1998–2011 VMware, Inc. All rights reserved. This product is protected by U.S. and international copyright and intellectual property laws. VMware products are covered by one or more patents listed at http://www.vmware.com/go/patents.
VMware is a registered trademark or trademark of VMware, Inc. in the United States and/or other jurisdictions. All other marks and names mentioned herein may be trademarks of their respective companies.
VMware, Inc. 3
Contents
About This Book 5
1 Introduction to Live Debugging 7Capabilities of the Integrated Virtual Debugger 7
Requirements for the Integrated Virtual Debugger 7
Installing the Integrated Virtual Debugger 8
2 Using Live Debugging Mode 9Overview of Live Debugging Mode 9
Prepare the Guest for Live Debugging 9
Configure the Group Policy Settings for Windows 9
Disable or Configure the Windows Firewall 10
Configure User Accounts 10
Blank Passwords and the Default Password Policy 10
Suppress Security Prompts on the Guest System 11
Install the Microsoft .NET Framework to Support Managed Applications 11
Rename Virtual Machine Computer Names 11
Install the Remote Debug Monitor Manually on Windows 98 Guests 11
Start the Remote Debug Monitor Without Authentication on the Default Port 12
Configure Visual Studio for Live Debugging 12
Configure the Runtime Library Setting for C++ Applications 12
Configure the Integrated Virtual Debugger for Live Debugging 12
Create Configurations 12
Set Configuration Properties 13
Set General Properties 13
Set Pre‐Debug Event Properties 13
Set Post‐Debug Event Properties 14
Rename a Configuration 14
Remove a Configuration 14
Debug Live Applications in Virtual Machines 14
Start a Live Debugging Session in a Virtual Machine 14
Start a Session Without Debugging in a Virtual Machine 15
Attach the Debugger to a Process Running in a Virtual Machine 15
Configuration Properties Reference 16
General Options 16
Pre‐Debug Event Options 16
Post‐Debug Event Options 17
3 Troubleshooting Live Debugging 19Reporting Bugs and Viewing Log Files 19
Files Maintained by the Integrated Virtual Debugger 19
Live Debugging Tips 19
Cannot Change Shortcut Keys 19
Live Debugging Session Does Not Start 20
Cannot Exit Visual Studio with Powered On Virtual Machine 20
Cannot Prevent VMDebugger Add‐in from Loading 20
Need to Clean Up After a Failure to Debug Locally 20
Visual Studio 2005 Fails in Vista 21

Integrated Virtual Debugger for Visual Studio Developer’s Guide
4 VMware, Inc.
Index 23
VMware, Inc. 5
This manual, Integrated Virtual Debugger for Visual Studio Developer’s Guide, provides information about how to
install, configure, and use the Integrated Virtual Debugger for Visual Studio. This VMware product provides
a configurable extension to Microsoft Visual Studio for debugging programs in virtual machines. This manual
includes information about live debugging. The troubleshooting section lists some errors and workarounds
for issues that developers might experience while debugging.
Revision HistoryThis document is revised with each release of the product or when necessary. A revised version can contain
minor or major changes. Table 1 summarizes the significant changes in each version of this document.
Intended AudienceThis manual is intended for software developers and QA engineers who want to debug in a virtual machine,
with the assistance of the VMware host. Readers should be familiar with virtual machines, Visual Studio, and
the debugging workflow.
Document FeedbackVMware welcomes your suggestions for improving our documentation. Send your feedback to
Technical Support and Education ResourcesThe following sections describe the technical support resources available to you. To access the current versions
of other VMware books, go to http://www.vmware.com/support/pubs.
Online and Telephone Support
To use online support to submit technical support requests, view your product and contract information, and
register your products, go to http://www.vmware.com/support.
About This Book
Table 1. Revision History
Revision Date Description
2011‐09‐13 Revision with replay debugging removed for the Workstation 8.0 release.
2010‐10‐20 Third draft for the Workstation 7.0 GA release.
2009‐10‐01 Second beta draft for the Workstation 7.0 RC release.
2009‐08‐20 Standalone manual (beta draft) for the 2009 Workstation Technical Preview.
2008‐09‐23 Included as an appendix of the version 6.5 Workstation User’s Manual.
Integrated Virtual Debugger for Visual Studio Developer’s Guide
6 VMware, Inc.
Support Offerings
To find out how VMware support offerings can help meet your business needs, go to
http://www.vmware.com/support/services.
VMware Professional Services
VMware Education Services courses offer extensive hands‐on labs, case study examples, and course materials
designed to be used as on‐the‐job reference tools. Courses are available onsite, in the classroom, and live
online. For onsite pilot programs and implementation best practices, VMware Consulting Services provides
offerings to help you assess, plan, build, and manage your virtual environment. To access information about
education classes, certification programs, and consulting services, go to http://www.vmware.com/services.
VMware, Inc. 7
1
The Integrated Virtual Debugger extends Visual Studio to help you debug live virtual‐machine applications.
This chapter includes the following sections:
“Capabilities of the Integrated Virtual Debugger” on page 7
“Requirements for the Integrated Virtual Debugger” on page 7
“Installing the Integrated Virtual Debugger” on page 8
You can install the Integrated Virtual Debugger on most Windows hosts that have VMware Workstation and
Visual Studio installed. For more information about Workstation, see the VMware Workstation User’s Manual
on the VMware Web site. For information about Visual Studio, see the Microsoft Web site.
Capabilities of the Integrated Virtual Debugger The Integrated Virtual Debugger offers live debugging mode. Replay debugging has been discontinued.
Live debugging lets you debug an application in a virtual machine. It is similar to remote debugging with
Visual Studio, except it works with virtual machines instead of physical machines. In fact, live debugging was
called remote debugging in the Workstation 6.5 release.
Debugging on virtual machines has many advantages over debugging on physical machines. You can easily
compare behavior of different Windows versions, service packs, DLL combinations, and so on. If you are a
software developer or QA engineer, you can use the Integrated Virtual Debugger to help manage a collection
of virtual machines. Live debugging mode makes a Visual Studio debugging session as convenient as a local
debugging session.
The Integrated Virtual Debugger allows the following operations:
Power a virtual machine on or off
Start a live debugging session in a virtual machine
Attach to a process in a live virtual machine
Start an application without debugging
Configure settings for application execution and debugging in a virtual machine
The integrated virtual debugger supports the use of several Visual Studio languages including C++.
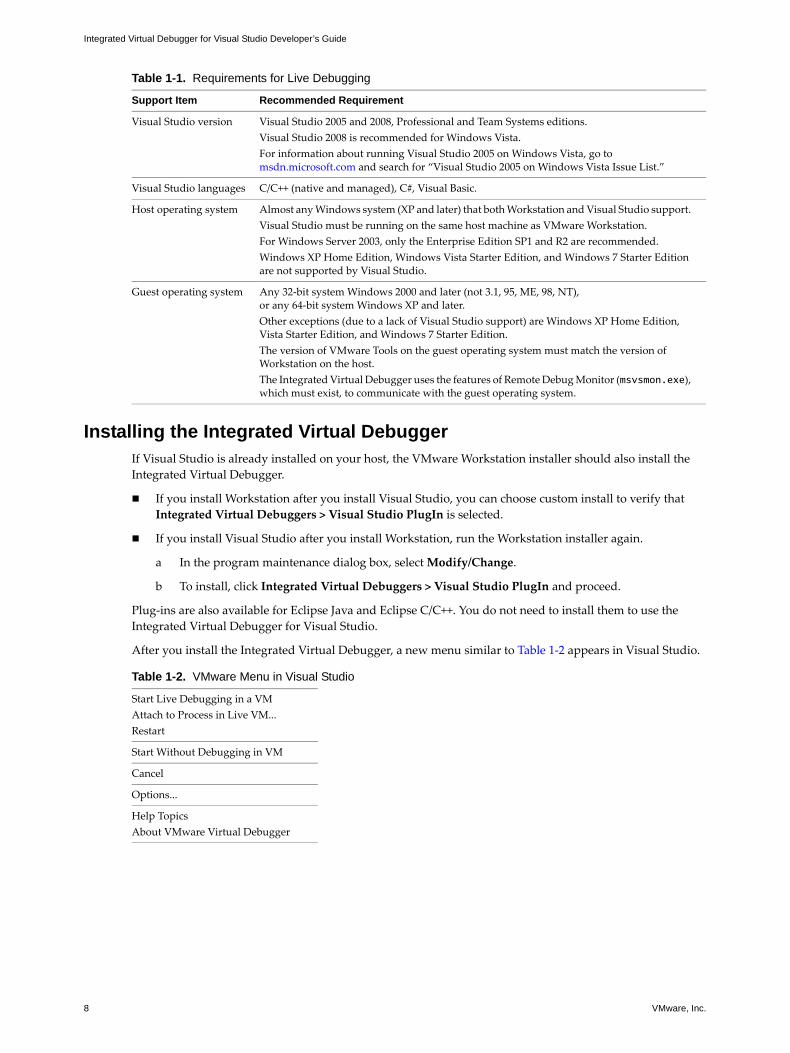
Requirements for the Integrated Virtual DebuggerTable 1‐1 summarizes the requirements for live debugging mode.
Introduction to Live Debugging 1
Integrated Virtual Debugger for Visual Studio Developer’s Guide
8 VMware, Inc.
Installing the Integrated Virtual DebuggerIf Visual Studio is already installed on your host, the VMware Workstation installer should also install the
Integrated Virtual Debugger.
If you install Workstation after you install Visual Studio, you can choose custom install to verify that
Integrated Virtual Debuggers > Visual Studio PlugIn is selected.
If you install Visual Studio after you install Workstation, run the Workstation installer again.
a In the program maintenance dialog box, select Modify/Change.
b To install, click Integrated Virtual Debuggers > Visual Studio PlugIn and proceed.
Plug‐ins are also available for Eclipse Java and Eclipse C/C++. You do not need to install them to use the
Integrated Virtual Debugger for Visual Studio.
After you install the Integrated Virtual Debugger, a new menu similar to Table 1‐2 appears in Visual Studio.
Table 1-1. Requirements for Live Debugging
Support Item Recommended Requirement
Visual Studio version Visual Studio 2005 and 2008, Professional and Team Systems editions.
Visual Studio 2008 is recommended for Windows Vista.
For information about running Visual Studio 2005 on Windows Vista, go to msdn.microsoft.com and search for “Visual Studio 2005 on Windows Vista Issue List.”
Visual Studio languages C/C++ (native and managed), C#, Visual Basic.
Host operating system Almost any Windows system (XP and later) that both Workstation and Visual Studio support.
Visual Studio must be running on the same host machine as VMware Workstation.
For Windows Server 2003, only the Enterprise Edition SP1 and R2 are recommended.
Windows XP Home Edition, Windows Vista Starter Edition, and Windows 7 Starter Edition are not supported by Visual Studio.
Guest operating system Any 32‐bit system Windows 2000 and later (not 3.1, 95, ME, 98, NT),or any 64‐bit system Windows XP and later.
Other exceptions (due to a lack of Visual Studio support) are Windows XP Home Edition, Vista Starter Edition, and Windows 7 Starter Edition.
The version of VMware Tools on the guest operating system must match the version of Workstation on the host.
The Integrated Virtual Debugger uses the features of Remote Debug Monitor (msvsmon.exe), which must exist, to communicate with the guest operating system.
Table 1-2. VMware Menu in Visual Studio
Start Live Debugging in a VM
Attach to Process in Live VM...
Restart
Start Without Debugging in VM
Cancel
Options...
Help Topics
About VMware Virtual Debugger
VMware, Inc. 9
2
This chapter introduces live debugging mode and includes the following sections:
“Overview of Live Debugging Mode” on page 9
“Prepare the Guest for Live Debugging” on page 9
“Configure Visual Studio for Live Debugging” on page 12
“Configure the Integrated Virtual Debugger for Live Debugging” on page 12
“Debug Live Applications in Virtual Machines” on page 14
“Configuration Properties Reference” on page 16
Overview of Live Debugging ModeThe Integrated Virtual Debugger’s live debugging mode simplifies the task of debugging applications in
virtual machines using the live debugging feature of Visual Studio. Live debugging mode works exactly like
Visual Studio remote debugging, except that virtual machines are usually on the same Workstation host
instead of across the network.
Live debugging lets you debug an application in a virtual machine. You can debug using different versions of
Windows, different service packs, various DLLs installed, and so on. Using virtual machines for debugging
provides a convenient alternative to debugging on physical machines. The Integrated Virtual Debugger helps
you manage your virtual assets. The Integrated Virtual Debugger can power virtual machines on and off, start
the application in its virtual machine, attach the debugger to the application, and control the application.
When you do live debugging with Visual Studio, you have to manually manage the virtual machine, manage
the files in the virtual machine, start the application to debug in a virtual machine, and attach the remote
debugger to an application. Live debugging provides the same debugging options as the Visual Studio remote
debugger, however it eliminates some of the tedium of Visual Studio remote debugging.
Live debugging mode debugs a live session of an application running on the Workstation host, or remotely.
To get started with live debugging, prepare the guest virtual machine, configure Visual Studio, and configure
the Integrated Virtual Debugger, as described in the following sections.
Prepare the Guest for Live DebuggingYou can manage live debugging configuration settings for each virtual machine in which you run and debug
applications. Virtual machine configuration properties, set in the Integrated Virtual Debugger configuration
pages, determine which virtual machine runs the application and how the application starts.
Configure the Group Policy Settings for Windows
Verify that the group policy is configured correctly for local authentication.
Using Live Debugging Mode 2
Integrated Virtual Debugger for Visual Studio Developer’s Guide
10 VMware, Inc.
To configure the group policy settings for Windows
Do one of the following:
To configure the guest system’s group policy settings for Windows XP Professional:
a Select Control Panel > Administrative Tools > Local Security Policy > Local Policies and select the
Security Options page.
b Set the Network access: Sharing and security model for local accounts policy to Classic – local users
authenticate as themselves.
To configure the guest system’s group policy settings for Windows Vista and Windows 7:
a Set Network security: LAN Manger authentication level to Send LM & NTLM responses.
b Set the Network access: Sharing and security model for local accounts policy to Classic – local users
authenticate as themselves.
You cannot view the group policy on Vista Home Premium or Vista Home Basic.
Disable or Configure the Windows Firewall
Windows XP SP2 (and later) systems usually have the firewall enabled by default. To debug in a Windows
guest, you must disable the firewall or configure it appropriately. VMware recommends disabling the firewall
if you are on a safe network.
For information about using Windows XP SP2 with the firewall enabled when doing remote debugging with
Visual Studio, go to the Microsoft Support Web site and enter the Microsoft knowledge base article ID 833977
in the Search menu.
Configure User Accounts
To configure user accounts, log in to the guest operating system with an Administrator account, and establish
an appropriate account if necessary.
For more information about how to set up Windows user accounts for live debugging, go to the Microsoft
Developer Network Web site, enter the search keywords Error: Remote Debugger Service On the Target
Computer Cannot Connect Back, and click the first search result.
Communication between Visual Studio and the guest operating system is not initiated until the virtual
machine is powered on and the configured user is logged in. The user runs the Remote Debug Monitor on the
guest, which in turn communicates with Visual Studio on the host.
To prevent a delay, power on the virtual machine and log in to the guest operating system before you debug
in a virtual machine. You can set up automatic login to bypass the login screen when the guest is booting.
Blank Passwords and the Default Password Policy
Windows has a default security feature that helps protect users with blank passwords from network‐based
attacks. Users who do not password protect their accounts can log in only at their physical computer console:
the monitor, keyboard, and mouse that are physically connected to their computer. This restriction applies to
local user accounts only, not to domain user accounts.
For information about how to disable blank password restrictions, go to the Microsoft Support Web site, enter
the Microsoft knowledge base article ID 303846 in the Search menu, and click the first search result.
IMPORTANT The user name, password, and domain name (if not local on both systems) must match on the
host and the guest. If they do not match, the Remote Debug Monitor on the guest cannot communicate with
the Visual Studio plug‐in on the host.
VMware, Inc. 11
Chapter 2 Using Live Debugging Mode
Suppress Security Prompts on the Guest System
Running an application from a network share triggers a security prompt every time a shared file is accessed.
VMware recommends that you turn off security prompts on the guest operating system.
You can use either Internet Explorer, or edit your registry key, to suppress security prompts.
To suppress security prompts on the guest system with Internet Explorer
1 In the Internet Explorer browser on the guest, select Tools > Internet Options > Security > Local Intranet
and click Sites.
2 Click Advanced and add a new Web site:
file://*..host
To edit a registry key to suppress security prompts
1 In the guest system, open the registry with regedit.
2 Add a new key called .host under HKCU\Software\Microsoft\Windows\CurrentVersion\InternetSettings\ZoneMap\Domains.
3 In the .host key, create a DWORD Value called file and set its value to 1.
Install the Microsoft .NET Framework to Support Managed Applications
To debug managed C++, C#, and Visual Basic applications, which use the Common Language Runtime, the
guest must have the Microsoft .NET Framework version 2.0 or later is installed. If not, install it.
Rename Virtual Machine Computer Names
Computer names must be unique on all virtual machines. If the names are not unique, the Integrated Virtual
Debugger cannot find the appropriate virtual machine on the network.
To rename virtual machine computer names
1 On the guest system, select Start > Control Panel > System.
2 Click the Computer Name tab.
3 Click Change.
4 Type a unique name and click OK.
Install the Remote Debug Monitor Manually on Windows 98 Guests
To enable debugging in a virtual machine, the Integrated Virtual Debugger shares the host folder that contains
the Remote Debug Monitor, and runs that Remote Debug Monitor on the guest. On Windows 98, you cannot
run the Remote Debug Monitor (or any executable file) from a shared folder. An attempt to do so generates
the following error:
The remote debugger is not properly installed. On a Windows ME or Windows 98 computer, the debugger cannot be run off a file share. Run the remote debugger setup.
Manually install and start the msvsmon.exe Remote Debug Monitor executable file on the guest operating
system before you start a debugging session.
To install the Remote Debug Monitor manually on Windows 98 guest systems
Use one of the following methods to install the Remote Debug Monitor:
Create a mapping to a network share with the host where msvsmon.exe is located.
Install msvsmon.exe from the Visual Studio 2005 installation CD.

Integrated Virtual Debugger for Visual Studio Developer’s Guide
12 VMware, Inc.
Start the Remote Debug Monitor Without Authentication on the Default Port
Running the Remote Debug Monitor on the guest system without authentication poses a security risk for that
system. VMware recommends that you take a snapshot first and set Revert to Parent Snapshot to Yes in the
Post‐Debug Event or Pre‐Debug Event properties. See “Set Configuration Properties” on page 13.
To start the Remote Debug Monitor without authentication on the default port
1 In the guest, run the following command:
msvsmon.exe /noauth
2 Verify that it uses port 4015 by confirming that Remote Debug Monitor displays the following message:
Msvsmon started a new server named '<guest_name>:4015'. Authentication is disabled. Waiting for new connections.
Configure Visual Studio for Live DebuggingFor C++ programs, you might have to configure Visual Studio to enable live debugging.
Configure the Runtime Library Setting for C++ Applications
When you debug on a remote machine or in a virtual machine, the application might not start if the runtime
library setting is set to certain values. If you encounter this problem, change the C++ runtime library setting.
To configure the runtime library setting for C++ applications
1 In Visual Studio, select Project > Properties.
2 Expand Configuration Properties > C/C++ and select Code Generation.
3 Set Code Generation to Multi‐threaded (/MT) or Multi‐threaded Debug (/MTd).
For more information about C++ libraries, go to the Microsoft Developer Network Web site and search for
Visual C++ Libraries as Shared Side‐by‐Side Assemblies.
Configure the Integrated Virtual Debugger for Live DebuggingBefore you can start or debug applications in a virtual machine, you set configuration properties. The default
configuration initially includes the default values for all properties that have them.
In Visual Studio, select VMware > Options to manage configurations. You can create, rename, and remove
configurations, and you can modify configuration properties for existing configurations.
The configuration selected in the Configuration drop‐down menu is one being edited in the configuration
pages. The configuration selected in the Active Configuration drop‐down menu is the one used when you
select VMware > Start Debugging in VM or VMware > Start Without Debugging in VM.
Create Configurations
When you create a configuration, it includes all aspects of the Integrated Virtual Debugger configuration.
To create configurations
1 Select VMware > Options.
2 Click the New icon next to the Configuration drop‐down menu.
3 In the New Configuration page, type a name for the new configuration.
4 Select a configuration to copy settings from. The default selection is <Default>, which includes the default
values for all properties that have them. Click OK.
The new configuration is created and listed as the active configuration in the Configuration and Active
Configuration drop‐down menus. You can begin editing the configuration properties.
VMware, Inc. 13
Chapter 2 Using Live Debugging Mode
Set Configuration Properties
You can edit configuration properties for a specific configuration by choosing the configuration name from the
Configuration drop‐down menu. You can also edit configuration properties for all configurations by choosing
All Configurations from the Configuration drop‐down menu.
Set General Properties
The default configuration initially includes many default values, but you must set the virtual machine’s
configuration file path.
To set general properties
1 Select VMware > Options.
2 In the left pane, click Live Debugging in VM and select General.
For more information about any of these options, see “General Options” on page 16.
3 Set Virtual Machine to the path of the guest’s virtual machine configuration file (the .vmx file).
4 You can set Remote Debug Monitor Path to the location of the Remote Debug Monitor on the host.
5 You can enter the Remote Debug Monitor Name on the guest.
6 You can set Guest Command to indicate how the debug command is run: either as a host path through a
shared folder (the default) or as a guest path.
7 You can set Shared Folders to a semicolon‐delimited list of paired folder names in the form
<shared_name>=<host_folder_name>.
8 You can set the guest login credentials, or specify them when connecting.
Set Pre-Debug Event Properties
Pre‐Debug Event options determine which actions are performed before the debug command is run.
On Windows Vista and Windows 7 guests, the files or folders that are specified in the Copy Files field might
fail with an access denied error. You might not have permission to copy files or folders to certain directories
like the root folder or the system directory because of the enforced UAC policy. To workaround this issue,
specify a different destination folder such as, MyDocuments or temp directory.
If the files or folders with the same name already exist in the guest, copying files or folders with the same name
may fail. Before you copy the files or folders, you can either modify the UAC policy or check whether the files
or folders with the same name exist. If these files or folders exist, copy the files or folders to a different folder.
To set Pre-Debug Event properties
1 Select VMware > Options.
2 In the left pane, click Live Debugging in VM and select Pre‐Debug Event.
3 You can set Revert to Parent Snapshot to Yes or No. The default is No.
If set to Yes, the virtual machine reverts to its parent snapshot when the debugging session is started.
4 You can set Copy Files to a semicolon‐delimited list of paired file or directory names that are copied from
the host to the guest, in the form <host_machine_file/folder>=<virtual_machine_file/folder>.
All specified files are copied before the pre‐debugging commands are run.
5 You can set Command Line to one or more semicolon‐delimited commands that are run after files are
copied and before the debugging session starts.
Integrated Virtual Debugger for Visual Studio Developer’s Guide
14 VMware, Inc.
Set Post-Debug Event Properties
Post‐Debug Event options determine which actions are performed after the debug command ends.
To set Post-Debug Event properties
1 Select VMware > Options.
2 In the left pane, click Live Debugging in VM and select Post‐Debug Event.
3 You can set Command Line to one or more semicolon‐delimited commands that are run after the
debugging session ends.
4 You can the Termination Mode to do nothing, power off the guest, revert to the parent snapshot, or
suspend the guest.
Rename a Configuration
You can rename a configuration so that the new name reflects the settings of your configuration.
To rename a configuration
1 Select VMware > Options.
2 Select the configuration to rename from the Configuration drop‐down menu and click the Edit icon.
3 On the Edit Configuration page, select the configuration to rename and click Rename.
4 Type the new name over the existing name and press Enter.
5 At the confirmation prompt click Yes. Click Close.
The renamed configuration is listed as the active configuration in the Configuration drop‐down menu.
You can edit its configuration properties, as described in “Set Configuration Properties” on page 13.
Remove a Configuration
When you no longer need a configuration, you can remove it without affecting another configuration.
To remove a configuration
1 Select VMware > Options.
2 Select the configuration to delete from the Configuration drop‐down menu and click the Edit icon.
3 In the Edit Configuration page, select the configuration to delete and click Remove.
4 At the confirmation prompt, click Yes. Click Close.
Debug Live Applications in Virtual MachinesAfter you create the required configurations for live debugging, the Integrated Virtual Debugger lets you:
Start a live debugging session in a virtual machine.
Start an application in a virtual machine without debugging.
Start a debugging session that attaches to a process already running in a virtual machine.
Start a Live Debugging Session in a Virtual Machine
You can debug an application in any configured virtual machine. Log in to the guest system manually before
the application is started. For more information, see “Configure User Accounts” on page 10.
VMware, Inc. 15
Chapter 2 Using Live Debugging Mode
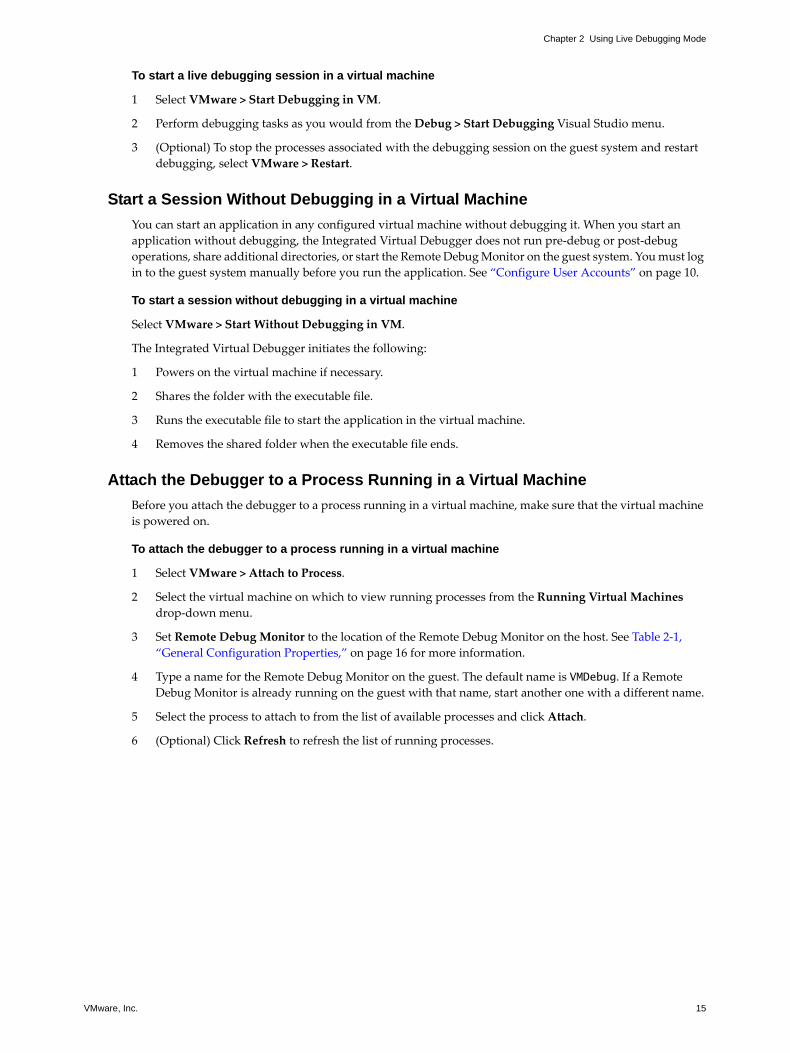
To start a live debugging session in a virtual machine
1 Select VMware > Start Debugging in VM.
2 Perform debugging tasks as you would from the Debug > Start Debugging Visual Studio menu.
3 (Optional) To stop the processes associated with the debugging session on the guest system and restart
debugging, select VMware > Restart.
Start a Session Without Debugging in a Virtual Machine
You can start an application in any configured virtual machine without debugging it. When you start an
application without debugging, the Integrated Virtual Debugger does not run pre‐debug or post‐debug
operations, share additional directories, or start the Remote Debug Monitor on the guest system. You must log
in to the guest system manually before you run the application. See “Configure User Accounts” on page 10.
To start a session without debugging in a virtual machine
Select VMware > Start Without Debugging in VM.
The Integrated Virtual Debugger initiates the following:
1 Powers on the virtual machine if necessary.
2 Shares the folder with the executable file.
3 Runs the executable file to start the application in the virtual machine.
4 Removes the shared folder when the executable file ends.
Attach the Debugger to a Process Running in a Virtual Machine
Before you attach the debugger to a process running in a virtual machine, make sure that the virtual machine
is powered on.
To attach the debugger to a process running in a virtual machine
1 Select VMware > Attach to Process.
2 Select the virtual machine on which to view running processes from the Running Virtual Machines
drop‐down menu.
3 Set Remote Debug Monitor to the location of the Remote Debug Monitor on the host. See Table 2‐1,
“General Configuration Properties,” on page 16 for more information.
4 Type a name for the Remote Debug Monitor on the guest. The default name is VMDebug. If a Remote
Debug Monitor is already running on the guest with that name, start another one with a different name.
5 Select the process to attach to from the list of available processes and click Attach.
6 (Optional) Click Refresh to refresh the list of running processes.
Integrated Virtual Debugger for Visual Studio Developer’s Guide
16 VMware, Inc.
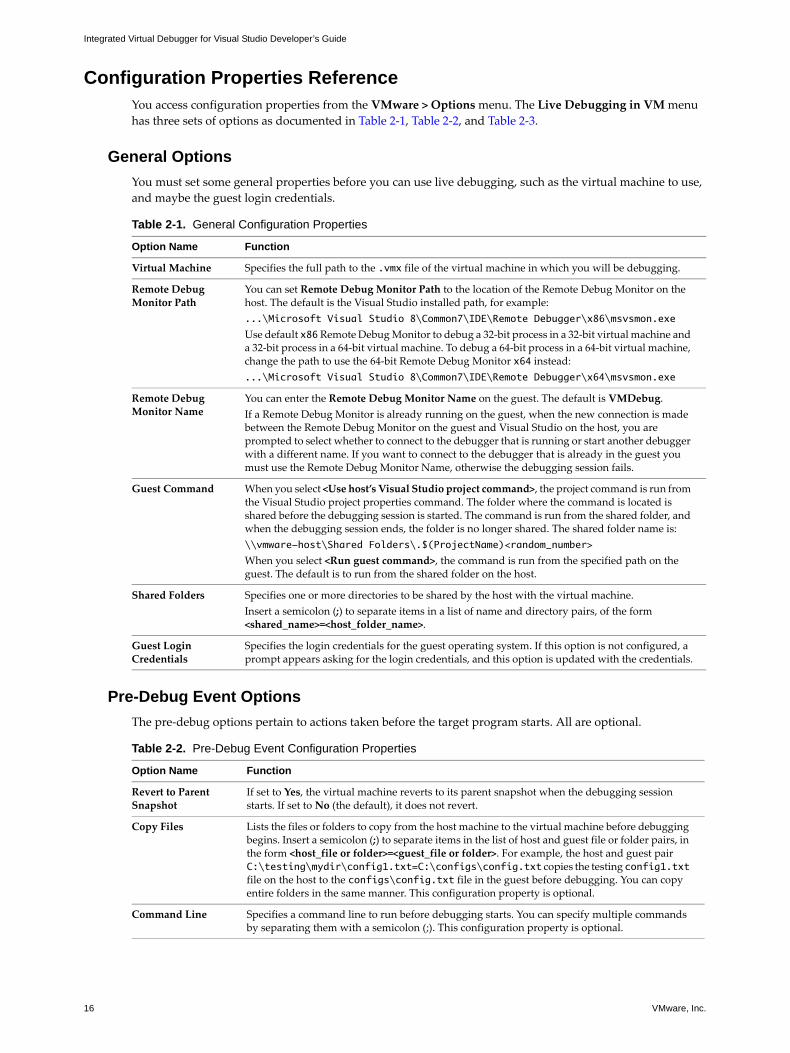
Configuration Properties ReferenceYou access configuration properties from the VMware > Options menu. The Live Debugging in VM menu
has three sets of options as documented in Table 2‐1, Table 2‐2, and Table 2‐3.
General Options
You must set some general properties before you can use live debugging, such as the virtual machine to use,
and maybe the guest login credentials.
Pre-Debug Event Options
The pre‐debug options pertain to actions taken before the target program starts. All are optional.
Table 2-1. General Configuration Properties
Option Name Function
Virtual Machine Specifies the full path to the .vmx file of the virtual machine in which you will be debugging.
Remote Debug Monitor Path
You can set Remote Debug Monitor Path to the location of the Remote Debug Monitor on the host. The default is the Visual Studio installed path, for example:
...\Microsoft Visual Studio 8\Common7\IDE\Remote Debugger\x86\msvsmon.exe
Use default x86 Remote Debug Monitor to debug a 32‐bit process in a 32‐bit virtual machine and a 32‐bit process in a 64‐bit virtual machine. To debug a 64‐bit process in a 64‐bit virtual machine, change the path to use the 64‐bit Remote Debug Monitor x64 instead:
...\Microsoft Visual Studio 8\Common7\IDE\Remote Debugger\x64\msvsmon.exe
Remote Debug Monitor Name
You can enter the Remote Debug Monitor Name on the guest. The default is VMDebug.
If a Remote Debug Monitor is already running on the guest, when the new connection is made between the Remote Debug Monitor on the guest and Visual Studio on the host, you are prompted to select whether to connect to the debugger that is running or start another debugger with a different name. If you want to connect to the debugger that is already in the guest you must use the Remote Debug Monitor Name, otherwise the debugging session fails.
Guest Command When you select <Use host’s Visual Studio project command>, the project command is run from the Visual Studio project properties command. The folder where the command is located is shared before the debugging session is started. The command is run from the shared folder, and when the debugging session ends, the folder is no longer shared. The shared folder name is:
\\vmware-host\Shared Folders\.$(ProjectName)<random_number>
When you select <Run guest command>, the command is run from the specified path on the guest. The default is to run from the shared folder on the host.
Shared Folders Specifies one or more directories to be shared by the host with the virtual machine.
Insert a semicolon (;) to separate items in a list of name and directory pairs, of the form <shared_name>=<host_folder_name>.
Guest Login Credentials
Specifies the login credentials for the guest operating system. If this option is not configured, a prompt appears asking for the login credentials, and this option is updated with the credentials.
Table 2-2. Pre-Debug Event Configuration Properties
Option Name Function
Revert to Parent Snapshot
If set to Yes, the virtual machine reverts to its parent snapshot when the debugging session starts. If set to No (the default), it does not revert.
Copy Files Lists the files or folders to copy from the host machine to the virtual machine before debugging begins. Insert a semicolon (;) to separate items in the list of host and guest file or folder pairs, in the form <host_file or folder>=<guest_file or folder>. For example, the host and guest pair C:\testing\mydir\config1.txt=C:\configs\config.txt copies the testing config1.txt file on the host to the configs\config.txt file in the guest before debugging. You can copy entire folders in the same manner. This configuration property is optional.
Command Line Specifies a command line to run before debugging starts. You can specify multiple commands by separating them with a semicolon (;). This configuration property is optional.
VMware, Inc. 17
Chapter 2 Using Live Debugging Mode
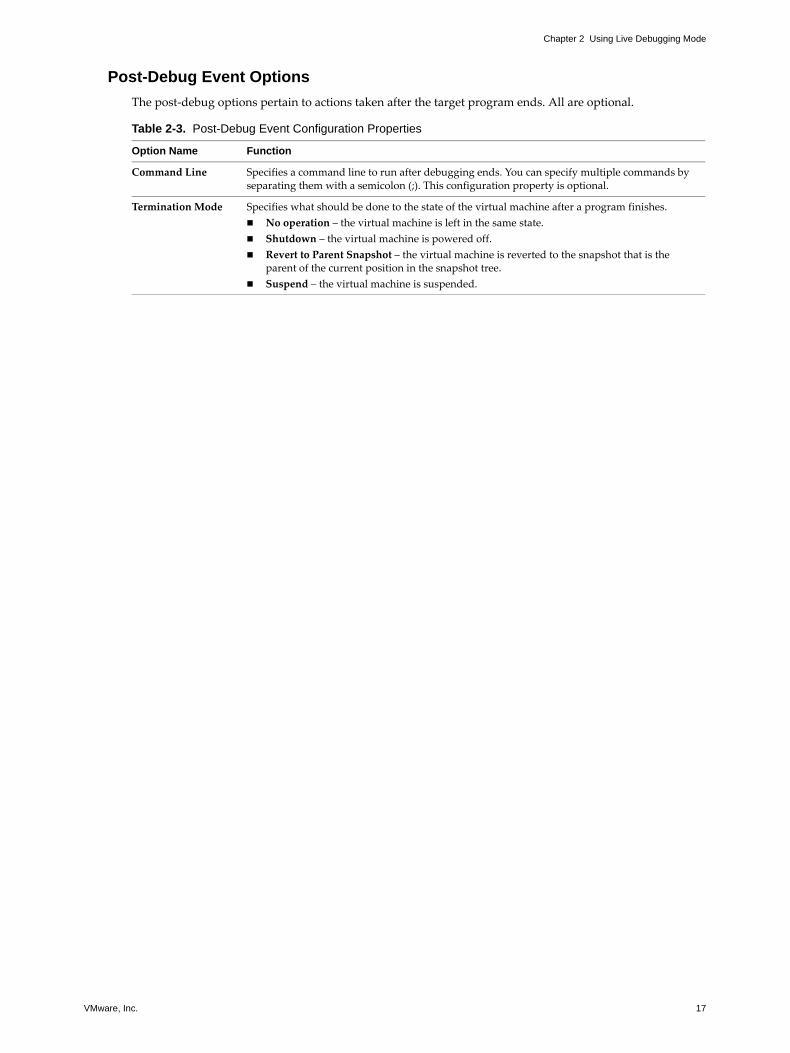
Post-Debug Event Options
The post‐debug options pertain to actions taken after the target program ends. All are optional.
Table 2-3. Post-Debug Event Configuration Properties
Option Name Function
Command Line Specifies a command line to run after debugging ends. You can specify multiple commands by separating them with a semicolon (;). This configuration property is optional.
Termination Mode Specifies what should be done to the state of the virtual machine after a program finishes.
No operation – the virtual machine is left in the same state.
Shutdown – the virtual machine is powered off.
Revert to Parent Snapshot – the virtual machine is reverted to the snapshot that is the parent of the current position in the snapshot tree.
Suspend – the virtual machine is suspended.

Integrated Virtual Debugger for Visual Studio Developer’s Guide
18 VMware, Inc.
VMware, Inc. 19
3
Before you start troubleshooting an error, make sure that you have correctly installed and configured the
Integrated Virtual Debugger. This chapter includes the following sections:
“Reporting Bugs and Viewing Log Files” on page 19
“Live Debugging Tips” on page 19
Reporting Bugs and Viewing Log FilesContact VMware customer support to report any bugs and send the log files that were generated. To view the
log files, select VMware > About VMware Virtual Debugger. The log files contain informational and error
messages about the actions of the Integrated Virtual Debugger.
A log file, vmware-vsid-<user_name>-<integer>.log, is created in the \Documents and Settings\<user_name>\Local Settings\Temp directory.
A log file, vmware-vixWrapper-<user_name>-<pid>.log, is created in the \Documents and Settings\<user_name>\Local Settings\Temp\vmware-<user_name> directory.
Files Maintained by the Integrated Virtual Debugger
The Integrated Virtual Debugger uses the Visual Studio environment to create its own files:
A preference file, vsid-prefs.xml, is located in the \Documents and Settings\<user_name>\Application Data\VMware directory. Do not edit this file directly. It is updated when you make changes in the Integrated Virtual Debugger configuration pages.
A file, <project_name>.idc, is created in the project directory for each project type that the Integrated Virtual Debugger supports.
Live Debugging TipsYou might experience the following errors when you are debugging using the live debugging mode.
Cannot Change Shortcut Keys
Problem
If you change the shortcut keys for VMDebugger commands, the tooltips for the VMware menu and toolbar do
not reflect the changes.
Solution
Restart Visual Studio to see your latest changes appear in the VMware menu and toolbar. To access the
keyboard mapping scheme for the VMDebugger commands, select Tools > Options > Keyboard.
Troubleshooting Live Debugging 3
Integrated Virtual Debugger for Visual Studio Developer’s Guide
20 VMware, Inc.
Live Debugging Session Does Not Start
Problem
A live debugging session fails to start and the last message in the VMware output window (and log file) is
Waiting for VMware Tools to start.
Solution
Check whether the guest system has the latest VMware Tools installed and running. If not, upgrade to the
latest version of VMware Tools. For more information, see the VMware Workstation User’s Manual.
Cannot Exit Visual Studio with Powered On Virtual Machine
Problem
If you attempt to exit Visual Studio after you start a debugging session but before you log in to the guest or
run VMware Tools on the guest, Visual Studio does not exit.
Solution
Power off the virtual machine or log in to the guest operating system.
Cannot Prevent VMDebugger Add-in from Loading
Problem
In Tools > Add‐In Manager, deselecting Startup does not prevent the Integrated Virtual Debugger Add‐in
from loading.
Solution
To permanently uninstall the Integrated Virtual Debugger, run the Workstation installation program, select
Modify/Change on the program maintenance page. In Custom setup, deselect Visual Studio PlugIn, and
click Finish.
Need to Clean Up After a Failure to Debug Locally
Problem
If you try to run the debugger locally after a debugging session in a virtual machine fails or stalls, you might
get a Visual Studio error that indicates that the remote server cannot be found.
Solution
Before you begin debugging in a local environment you must clean up the failure.
To clean up after a failure and debug locally
1 To clean up the failure, do one of the following:
In C++, select Project Property Pages > Debugging and set the Debugger to Launch property to
Local Windows Debugger.
Set the Command property to either an empty string or the correct local path.
In C# and Visual Basic, select Project Property Pages > Debug.
Make sure Start project is selected and Use remote machine is deselected.
2 (Optional) You can remove any shared folders that were used to run the debug command and the Remote
Debug Monitor. Shared folders are usually removed at the end of a debugging session, but they might not
be removed in the following circumstances:
If the debugging session causes a failure.
If the virtual machine is powered off while the debugging session is still running.
Shared folders are typically reused when another debugging session is started, so cleanup is not required.
VMware, Inc. 21
Chapter 3 Troubleshooting Live Debugging
Visual Studio 2005 Fails in Vista
Problem
Live debugging mode does not work in Visual Studio 2005 on a Windows Vista host.
Solutions
Manually configure the firewall to allow traffic from Visual Studio.
Run Visual Studio with Administrator permissions.
For more information about Visual Studio 2005 on Vista, go to the Microsoft Developer Network Web site and
search for “Visual Studio 2005 on Windows Vista Issue List.”

Integrated Virtual Debugger for Visual Studio Developer’s Guide
22 VMware, Inc.
VMware, Inc. 23
Index
Cconfigurations in live debugging
removing 14
renaming 14
Ddebugging
attaching to a process in a virtual machine 15
modes in the Integrated Virtual Debugger 7
debugging modes 7
Iinstall Remote Debug Monitor 11
Integrated Virtual Debugger
configuring for live debugging 12
environment 19
Visual Studio 7
Llive debugging
configuration properties 16
configuring group policy 9
configuring user accounts 10
configuring Windows XP firewall 10
set general properties 16
starting in a virtual machine 14
using 9
Mmsvsmon.exe program 8
N.NET framework, Microsoft 11
RRemote Debug Monitor 8
Sstarting
live debugging session in a virtual machine 14
session in a virtual machine without debugging 15
supported guest operating systems 8
supported programming languages 8
supported versions for live debugging 8
system requirements for live debugging 8
Ttechnical support resources 5
troubleshooting live debugging 19
WWindows group policy settings 9

Integrated Virtual Debugger for Visual Studio Developer’s Guide
24 VMware, Inc.