integrating airborne magnetic and landsat data for ... · pdf fileintegrating airborne...
TRANSCRIPT

The Pacific Journal of Science and Technology –556– http://www.akamaiuniversity.us/PJST.htm Volume 13. Number 1. May 2012 (Spring)
Integrating Airborne Magnetic and Landsat Data for Geologic Interpretation over part of the Benin Basin, Nigeria.
A.I. Opara, Ph.D.1*; A.C. Ekwe, Ph.D.2; C.N. Okereke, M.Sc.1; I.A. Oha, M.Sc.2;
and O.P. Nosiri, M.Sc.1
1Department of Geosciences, Federal University of Technology, PMB 1526, Owerri, Nigeria. 2Department of Geology, University of Nigeria, Nsukka, Enugu State, Nigeria.
E-mail: [email protected]*
ABSTRACT This paper presents the result of structural analysis of the aeromagnetic and Landsat data over parts of the Benin Basin, Southwestern Nigeria. Subsurface linear structures identified in the study revealed tectonic features with principal trend directions in the N-S and NE-SW, directions. A meso-fracture zone was identified around Ibu and Ilu–titu areas, which was identified on the Landsat image as an organized system of individual lineaments with consistent orientations of NE-SW directions. Northeast - southwest trending lineaments dominate the Landsat data of the study area, many of which coincided with major rectilinear drainage channels which generally suggest that there is a relationship between fracture orientation and physiographic features. Lithologic control was therefore deduced from the observed variation in both the number and frequencies of the system of linear structures. Several clusters of circular magnetic anomaly closures with different amplitudes which occur especially in the northwestern half of the area were interpreted to be lithological variations of mafic–ultramafic inclusions within granodioritic batholiths. The distribution of mafic and felsic rock forming minerals were correlated to the positive and negative second vertical derivative anomalies around Ilesha and Igarra areas. Finally, there seem to be a correlation of the interpreted lineaments with areas of primary mineralization in the study area.
(Keywords: structural trends, tectonic, lineaments, aeromagnetic, Landsat, Benin Basin, Nigeria)
INTRODUCTION The past three decades have seen a revolution in the application of aeromagnetic surveys from interpretation of solely basement structures to detailed examination of structure and lithologic variations in the sedimentary section. In many sedimentary basins, magnetic anomalies arise from secondary mineralization along fault planes, which are often revealed on aeromagnetic maps as surface linear features. O’Leary et al. (1976) and Ananaba and Ajakaiye (1987), believed that most mineral deposits are related to some type of deformation of the lithosphere, and most theories of ore formation and concentration embody tectonic or deformational concepts. Some lineament patterns have been defined to be the most favorable structural conditions in control of various mineral deposits. They include the traces of major regional lineaments, the intersection of major lineaments or both major (regional) and local lineaments, lineaments of tensional nature, local highest concentration (or density) of lineaments between en echelon lineaments, and lineaments associated with circular features. Linear features are clearly discernible on aeromagnetic maps and often indicate the form and position of individual folds, faults, joints, veins, lithologic contacts, and other geologic features that may lead to the location of individual mineral deposits. They often indicate the general geometry of subsurface structures of an area thereby providing a regional structural pattern. Previous studies in the study area by Coker and Ejewade (1987) depicted the Benin Basin as a sedimentary basin with low petroleum potentials. The petroleum prospects were thought to be confined to the down–dip offshore Cretaceous and lower Tertiary sections of the basin which is

The Pacific Journal of Science and Technology –557– http://www.akamaiuniversity.us/PJST.htm Volume 13. Number 1. May 2012 (Spring)
in deep waters. The purpose of this study therefore is to investigate the basement topography, identify and delineate the structures associated with the basin, identify the trends and patterns of such structures, and to make inferences about their relationship with basin formation and dynamics. Similarly, the relationship between subsurface structures and lineaments was fully investigated. Geological Background The geology, sedimentology and petroleum geology of the basin have been extensively discussed by various authors (Murat, 1972; Adediran and Adegoke 1987; Onuoha and Ofoegbu,1988; Adekeye, 2005, among others).
The study area lies at about longitude 4030E – 6000E and latitudes 6000 –7000N (Figure 1).The Benin basin (Dahomey Embayment) is bounded in the west by the Ghana Ridge which is an extension of the Romanche Fracture Zone and the east by the Benin Hinge line, a basin escarpment which separates the Okitipupa structure from the Niger delta basin and marks the continental extension of the Chain Fracture Zone. The Benin basin is a sedimentary basin that was initiated during the Mesozoic in response to the separation of the African–South American landmasses and the subsequent opening of the Atlantic. The basin forms the onshore part of the West African miogeocline in eastern Ghana, Togo, Benin and western Nigeria.
Figure 1: Geology Map of Part of the Benin Basin, Southwestern Nigeria.

The Pacific Journal of Science and Technology –558– http://www.akamaiuniversity.us/PJST.htm Volume 13. Number 1. May 2012 (Spring)
The Nigerian part of the basin forms part of a miogeoclinal wedge extending from the Volta delta area in Ghana to Okitipupa Ridge, east of Lagos. The distance from the volta mouth (Ghana) to the axis of the Okitipupa Ridge or Ilesha spur (Nigeria) being about 250 miles (450km).Sediments encountered in the onshore part of the basin range in age from late Cretaceous to Recent and exceed 7000 ft at the coast in western Nigeria. Coker and Ejedawe (1987) believe that the sediments thicken into the offshore area and then thin down to deepwater. The physiography of the basin can be described based on the structural elements in the entire basin. These include the Benin basin proper and the Okitipupa hinge which separates the former from the Anambra basin to the east and the Niger Delta basin to the southwest. A study of the sediments in the Benin basin revealed that the oldest outcropping sediments of
the basin are the Abeokuta Formation (Maastrichtian). It rests unconformably on the highly weathered and fractured basement complex rocks. Paleocene- Eocene marine shales, limestones, sandy shales and claystones conformably overlie the Maastrichtian sediments; the general stratigraphy of the basin is presented in Table1. THEORY AND METHODS Both magnetic and Landsat data have a great deal in common, and an interface for geological interpretation can be established between them. They are both extensively used as reconnaissance tools in oil and mineral exploration. Similarly, both have surficial discontinuities recognized by the common correspondence of linear anomalies to surficial evidence of faulting across the area.
Table1: Stratigraphic Setting of the Benin Basin, Southwestern Nigeria (from Idowu et al., 1993).
AGE
FORMATION LITHOLOGY Ako et al,1980 Omatsola and
Adegoke,1981
T
ERTI
AR
Y
EOCENE
ILARO FM
ILARO FM
SANDSTONE
OSHOSUN FM EWEKORO FM
OSHOSUN FM EWEKORO FM
SHALE LIMESTONE
PALEOCENE
CR
ETA
CEO
US
MAASTRICHTIAN
ABEOKUTA FM
A
BEO
KU
TA
GR
OU
P
ARAROMI
SHALE
TURONIAN
AFOWO
SANDSTONE&SHALE
BARREMIAN ISE
SANDSTONE
The Pacific Journal of Science and Technology –559– http://www.akamaiuniversity.us/PJST.htm Volume 13. Number 1. May 2012 (Spring)
The aeromagnetic data used were filtered using a low pass filter. The nature of filtering applied to the aeromagnetic data in this study in the Fourier domain was chosen to eliminate certain wavelengths and to pass longer wavelengths. Regional residual separation was carried out using polynomial fitting. This is a purely analytical method in which matching of the regional by a polynomial surface of low order exposes the residual features as random errors. For the magnetic data, the regional gradients were removed by fitting a plane surface to the data by using multi- regression least squares analysis. The expression obtained for the regional field T(R) is given as: ( ) )1.(..........248.0371.0158.7612 yxRT −+=
Other analytical methods used include 2-D spectral analysis, second vertical derivatives and trend surface analysis. Average depth values to buried magnetic rocks using the power spectrum of total intensity field were achieved using spectral analysis. These depths were established from the slope of the log- power spectrum at the lower end of the total wave number or spatial frequency band. The application of spectral analysis to the interpretation of potential field data is therefore sufficiently well established (Spector and Grant,1970).The method allows an estimate of the depth of an ensemble of magnetized blocks of varying depth, width, thickness and magnetization. Most of the approaches used involve Fourier transformation of the digitized aeromagnetic data to compute the energy (or amplitude) spectrum. This is plotted on a logarithmic scale against frequency. The slopes of the segments yield estimates of average depths to magnetic or gravity sources of anomalies. Given a residual magnetic anomaly map of dimensions l x l, digitized at equal intervals, the residual total intensity anomaly values can be expressed in terms of a double Fourier series expression given as:
)2...(....................)]........)(2sin[(
))(2cos(),(1 1
mynxL
Q
mynxL
PyxT
nm
N
n
M
m
nm
+
++=∑∑= =
π
π
where l = dimensions of the block, and is the Fourier amplitude and N and M are the
number of grid points along the x and y directions respectively. Similarly, using the complex form, the two dimensional Fourier transform pair may be written as:
)3......(..........),(),( )( dxdyeyxgVUG vyuxj +−∞
∞−
∞
∞−∫∫=
∫∫∞
∞−
+−∞
∞−
= )4...(),(4
1),( )(2 dxdyeVUGyxg vyuxj
π
The use of this method involves some practical problems, most of which are inherent in the application of the Discrete Fourier Transform (DFT). These include the problems of aliasing, truncation effect or Gibb’s phenomenon and the problems associated with even and odd symmetries of the real and imaginary parts of the Fourier transform. However, in this research, these problems were taken care of by the software used in the analysis. The regional trend is represented by a straight line, or more generally by a smooth polynomial curve. The fitting of polynomials to observed geophysical data is used to compute the mathematical surface giving the closest fit to the data that can be obtained within a specified degree of details. This surface is considered to approximate the effect of deep seated or regional structures if it of low degree. The function that generates this surface is called the trend for that specified degree and the consequent analysis of this constitutes the trend surface analysis. The fitting surface which represents the regional is a surface which will have both positive and negative deflections from the observed data points with the residuals balanced between positive and negative areas(Nettleton,1976). In trying to determine a geologic surface, the use of a polynomial expansion of the linear trend surface which introduces powers and cross products of the geographic coordinates is used. Trend functions are described by equations. Thus, for a surface of degree n, the trend function f is given by Simpson(1954) as:
( ) yxaii
n
i
n
jij
yxF ∑∑=
−
=
=0
1
0, ………………(5)

The Pacific Journal of Science and Technology –560– http://www.akamaiuniversity.us/PJST.htm Volume 13. Number 1. May 2012 (Spring)
where aij are coefficients to be determined by adjustments using the least squares method, while x, y are coordinates of a point at which the function is evaluated. A typical trend surface program consists of three (3) parts: a routine to generate the matrix of sums of powers and cross products, a simultaneous equation solver or matrix inverter and a plot algorithm. Reduction-to-Pole (RTP) transformation was applied to the aeromagnetic data to minimize polarity effects (Blakely, 1995). These effects are manifested as a shift of the main anomaly from the center of the magnetic source and are due to the vector nature of the measured magnetic field. The RTP transformation usually involves an assumption that the total magnetizations of most rocks align parallel or anti-parallel to the Earth's main field. Similarly, second vertical derivative filters were used to enhance subtle anomalies while reducing regional trends. These filters are considered most useful for defining the edges of bodies and for amplifying fault trends. In mathematical terms, a vertical derivative can be shown to be a measure of the curvature of the potential field, while zero second vertical derivative contours defines the edge of the causative body. Thus, the second vertical derivative is in effect a measure of the curvature, i.e., the rate of change of non- linear magnetic gradients. The zero magnetic contours of the second vertical derivative often coincide with the lithologic boundaries while positive and negative anomalies often match surface exposures of the mafic and felsic rocks respectively. The use of the second vertical derivatives can best be understood by noting that the magnetic field potential satisfies Laplace’s equation given as:
)6.(........................................02
2
2
2
2
2=
∂
∂+∂
∂+∂
∂
z
s
y
s
x
s
MATERIALS AND METHODS The magnetic data used were obtained as part of the nationwide aeromagnetic survey which was sponsored by the Geological Survey of Nigeria (GSN) and completed in 1976. Flight line direction was NNW-SSE at station spacing of 2km with flight line spacing of 20km at an altitude of about 150m. Tie lines were flown in an ENE-WSN
direction. Regional correction of the magnetic data was based on the IGRF (epoch date1 of January, 1974). For this study, aeromagnetic sheets 282, 283,284,296,297, and 298 were used. The aeromagnetic maps were digitized along flight lines at 2km intervals. The regional gradients were removed by fitting a plane surface to the data by multi- regression least squares analysis. Figure 2 is the total field of the magnetic data presented as a contour, while the total field is presented in Figure 3 as a surface plot. The first to fourth degree regional and residual fields are presented in Figures 4 and 5, respectively. Similarly, Landsat Thematic Mapper (Landsat-TM) imagery acquired on 17/02/2001 from NASRDA, Nigeria was used to map linear structures in the study area. The raw data was geo-referenced using the coordinates of the topographic sheets in the study area. The geo-reference projection was carried out using the Universal Tranverse Marcator (UTM). Image processing, enhancement, and analysis were carried out using ILWIS 3.1 Academic software. Image enhancement operations carried out include contrast stretching, spatial filtering and edge detection, which were done to enhance sharpness of the satellite image for better visual interpretation, reduce noise in the image and to aid structural interpretation. Figure 6a is the Landsat- TM imagery. ArcView 3.2 software was used to extract the lineaments and carry out statistical analysis of the interpreted lineaments in the area. The interpreted lineaments are further superimposed on the geology map (Figure 6b). The lineament trend directions were summarized by using a Rose diagram as shown in Figure 7. Since the primary objective of this study is to identify structures expressed as lineaments and classify them according to their spatial and directional attributes, it was necessary to process the aeromagnetic and Landsat -TM data in a manner that would both enhance trends and facilitate the computation of locations and depths to magnetic sources. Drainage pattern, termination of potential field(gravity or magnetic) map anomalies on a linear trend, termination of drainage line on linear trends and straight stream segments were the basic hypothetical models used to map fractures. Ajayi, et al (1991) believes that lineaments can also be revealed on aeromagnetic maps by breaks in anomaly trends (lengthwise) and prominently narrow magnetic lows (broadwise) and sharp gradients of anomaly.

The Pacific Journal of Science and Technology –561– http://www.akamaiuniversity.us/PJST.htm Volume 13. Number 1. May 2012 (Spring)
Figure 2: Total Field Intensity Map of the Magnetic Data of the Study Area.
Figure 3: Total Field Intensity of the Aeromagnetic Data of the Study Area presented as a 3–D Surface Plot.

The Pacific Journal of Science and Technology –562– http://www.akamaiuniversity.us/PJST.htm Volume 13. Number 1. May 2012 (Spring)
Figure 4: Non Linear Filter (NLF) Contour Map of the Magnetic Data of the Study Area.
Figure 5: First to Fourth Degree Regional Fields of the Aeromagnetic Field of the Study Area.
The Pacific Journal of Science and Technology –563– http://www.akamaiuniversity.us/PJST.htm Volume 13. Number 1. May 2012 (Spring)
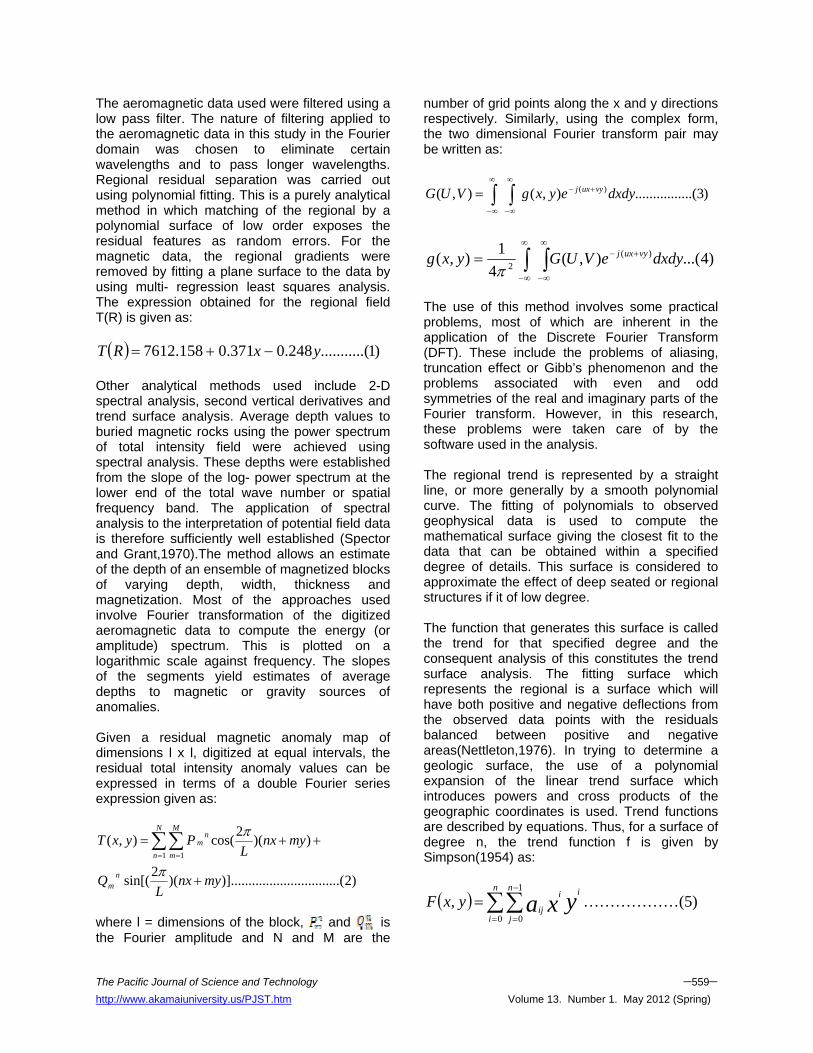
Figure 6: First to Fourth Degree Residual Fields of the Aeromagnetic Field of the Study Area. RESULTINTERPRETATIONAND DISCUSSION Subsurface linear structures identified in the study area (from first - fourth degree regional and residual maps) revealed tectonic features with principal trend directions in the N-S, NE-SW, NW-SE, and to a lesser extent E-W directions, with the N-S fractures marked by considerable shearing and brecciations. The N-S fractures are gravity induced while the conjugate northeasterly and northwesterly sets which were products of transcurrent movements are characterized by wide zones of cataclastic deformation. The NE-SW and NW-SE conjugate sets are mostly strike- slip faults with the northeasterly characterized by dextral sense of movement. Ajakaiye et al. (1986) ascertained that the possible triggering mechanisms of the Nigerian earth tremors are closely associated with the locations of the earth movements associated with NE-SW trending deep fractures and zones of
weakness extending from the Atlantic Ocean into the country. It is believed that the re-activation of the Chain Fracture Zone may have induced some motion in the Ifewara fault within the Ife fault zone which in turn caused the earth tremors in Ijebu-Ode area in 1984. The Benin basin is interpreted as an embayment because the western boundary is fault – bounded by the Romanche fault and the eastern side by the Benin Hinge line(Okitipupa High).These paleo-structures trend approximately in the NE-SW direction .The western margin of the Benin Basin is widely believed to be formed by structures associated with the onshore extension of the Romanche fracture zone, the basin originating along the transform margin of the incipient Equatorial Atlantic Ocean (Francheteau and Le Pichon, 1972; Emery et al. 1975; Omatsola and Adegoke, 1981; Coker and Ejedawe, 1987; and Mascle et al.,1988).
The Pacific Journal of Science and Technology –564– http://www.akamaiuniversity.us/PJST.htm Volume 13. Number 1. May 2012 (Spring)
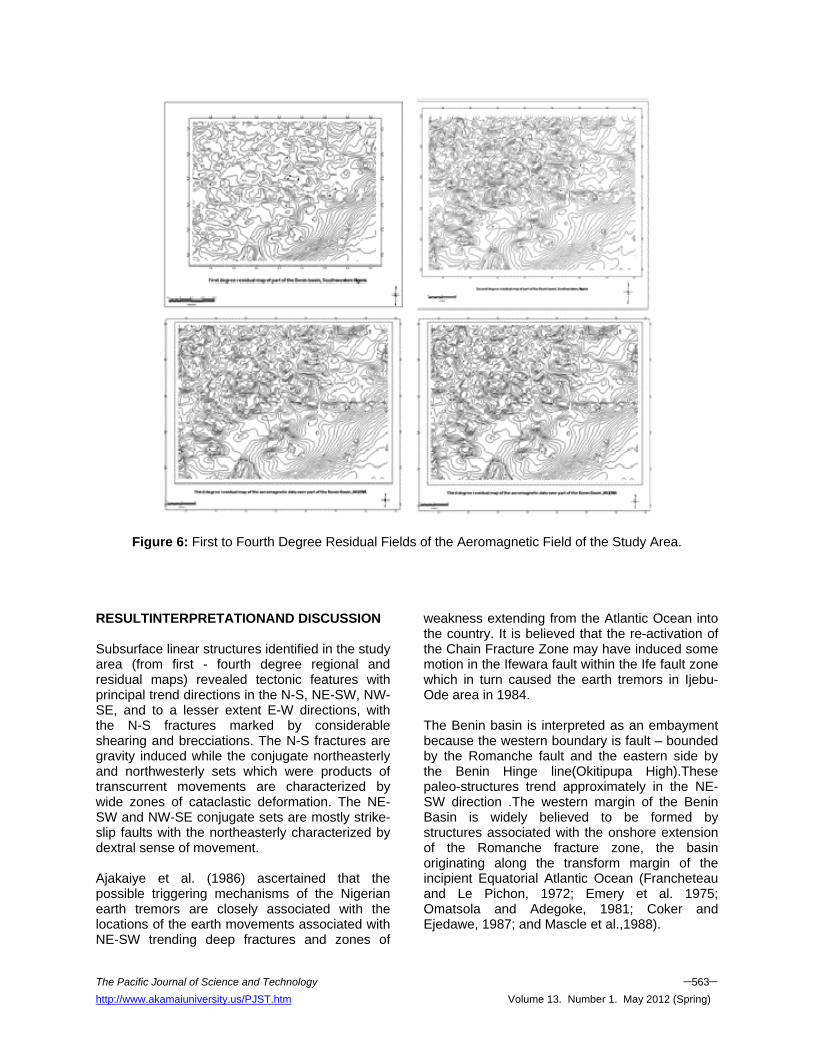
Figure 7a: Landsat – ETM Image of the Study Area Showing Interpreted Lineaments and Drainage.
Figure 7b: Geology Map of the Study Area Showing Interpreted Lineaments and Drainage
(Arrow indicates Meso-Fracture Area).

The Pacific Journal of Science and Technology –565– http://www.akamaiuniversity.us/PJST.htm Volume 13. Number 1. May 2012 (Spring)
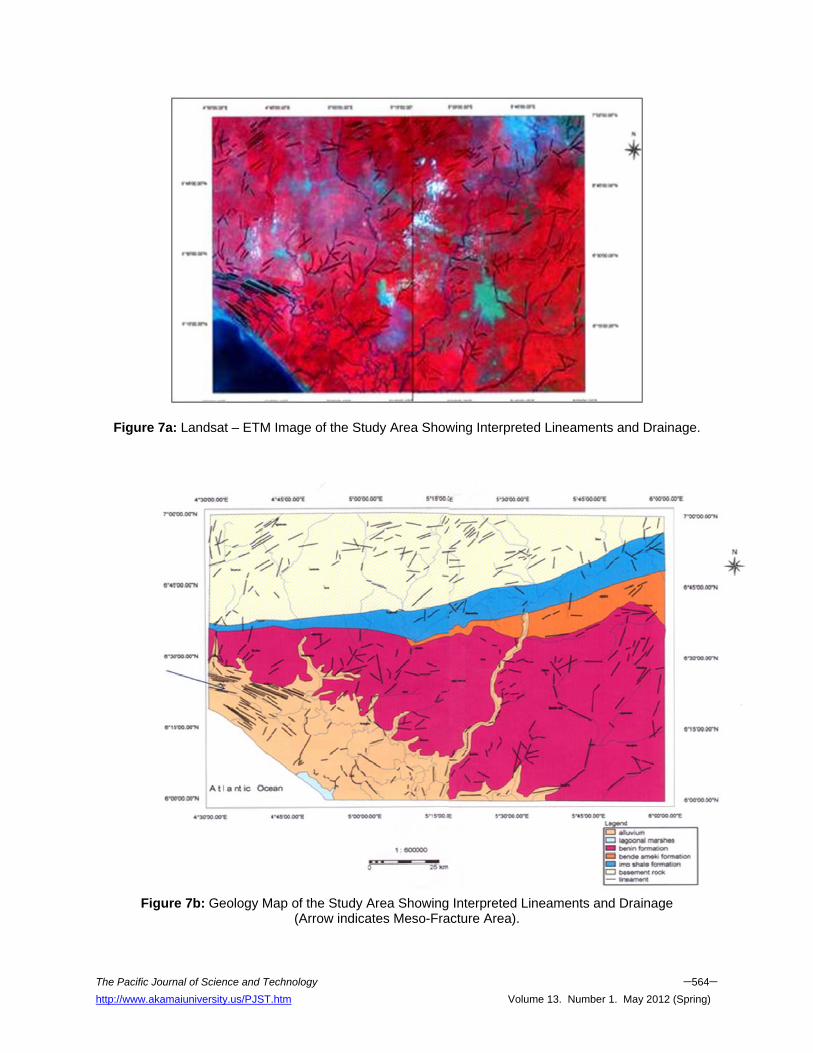
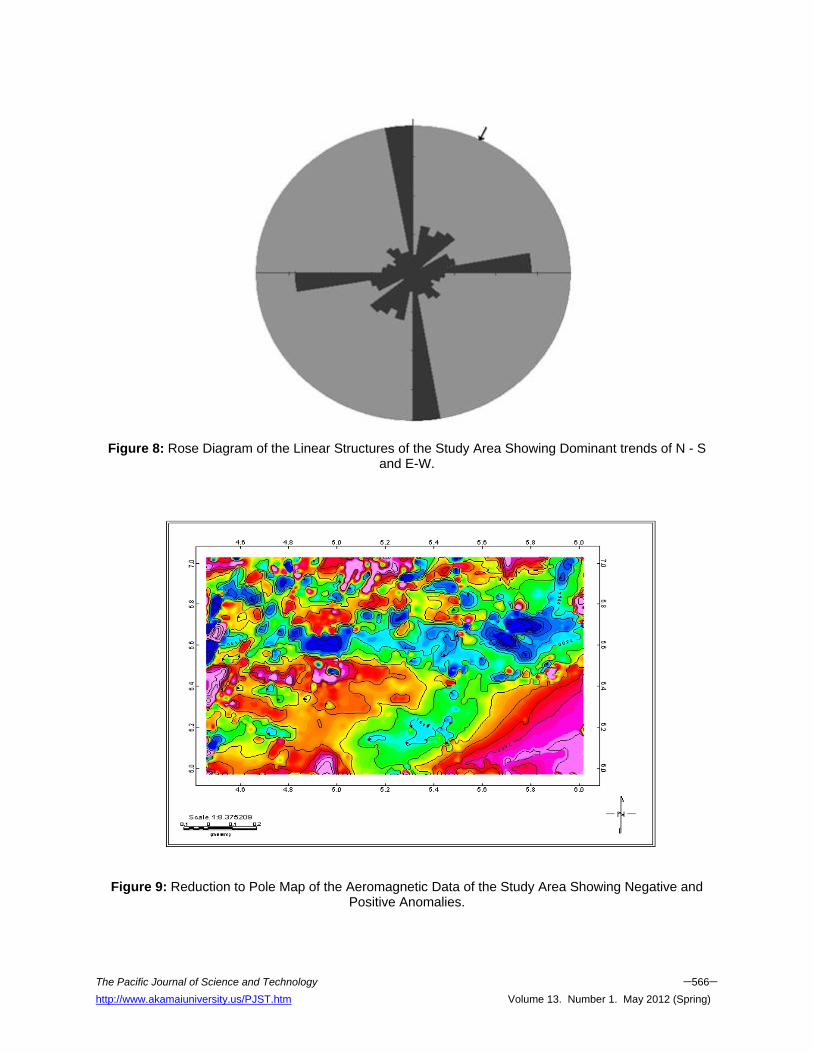
At its eastern end a basement uplift, the Okitipupa ridge, forms the boundary between the Benin Basin and the Niger Delta/Anambra Basin. The eastern margin of the ridge corresponds to the Benin Hinge Line of Murat (1972) which Omatsola and Adegoke (1981) regarded as the onshore extension of the Chain fracture zone. Lithologic control was deduced from the observed variation in both the number and frequencies of the system of linear structures. The lineament patterns observed on the Landsat-TM image have been summarized using Rose diagrams and further analyzed using geo-statistical techniques. The vector mean direction of the major surface lineaments is 450 while that of minor lineaments is 2750 as there is a bi-modal distribution at an angle of 900. The lineament counts density was determined as 0.057/km2 while the lineament length density is 133.71 km/km2. The sum of the lineament length is 2350441.8 km. Similarly, a meso-fracture zone was identified around Ibu and Ilu – titu areas between latitudes 6015 - 6030N and longitudes 4030- 4045E on figure 6a. This meso-fracture zone is identified on the Landsat image as an organized system of individual lineaments with consistent orientations of NE-SW directions and having a high density lineament zone with a width of up to a few kilometers and a length of several tens of kilometers consisting of numerous relatively short (1-4 km) and parallel lineaments. Lineament density delineates major fault zones which suggest that lineaments and subsurface structures results from like-oriented stresses. Northeast-southwest trending lineaments dominate the Landsat data of the study area, many of which coincided with major rectilinear drainage channels which generally suggest that there is a relationship between fracture orientation and physiographic features. The RTP aeromagnetic data, computed from the grid of total-field magnetic data, are shown in Figure 9. Several clusters of circular anomaly closures with different amplitudes which occur especially in the northwestern half of the area were interpreted to be lithological variations of mafic–ultramafic inclusions within granodioritic batholiths. Similarly, the high magnetic relief of this area is believed to be closely related to mafic-ultramafic rock masses in the area (Figure 11). Similarly, the zero contours of the second vertical derivative indicated the lithologic boundaries between the sedimentary formations and the basement. Finally, the distribution of mafic and
felsic rock forming minerals were correlated to the positive and negative second vertical derivative anomalies around Ilesha area (Figure.8). These rocks are believed to be the by-products of the re-activation of the trans-oceanic fracture zones that also acted as conduits for primary mineralization. In the Ilesha district, the meta-sediments with the associated mafic–ultramafic rocks are bordered by approximately N-S trending units of the gneiss-migmatite complex. Elueze (1982, 2000) agrees that the contacts may be tectonic and marked by the development of cataclasites and mylonites. Similarly, Olade and Elueze (1979) reported that granites and pegmatites also intrude the migmatitic gneisses, the mafic–ultramafic bodies and the meta-sediments in the area. The mafic–ultramafic units include a variety of amphibolites and talc bearing bodies. Lithologies of the metasedimentary suite comprise quartzites and quartz, quartz-sericite/muscovite, quartz-chlorite/biotite and biotite – rich schists. Elueze (2000) believes rocks with residual igneous textures are likewise encountered. Depth to source interpretation of aeromagnetic field data provides important information on basin architecture for petroleum exploration and for mapping areas where basement is shallow enough for mineral exploration. Magnetic basement is an assemblage of rocks that underlines sedimentary basins and may also outcrop in places. Onyedim et al. (2006) believes that if the magnetic units in the basement occur at the basement surface, then depth determinations for these will map the basin floor morphology and its structure. The result of spectral analysis indicated a two–depth source model with the depth to the deeper sources identified with crystalline basement. Two important magnetic sources were therefore revealed in this study with magnetic basement depths varying from 4.219km to 6.99km with an average basement depth of 6.039km (Figure 9).This layer may be attributed to magnetic rocks of the basement, lateral variations in basement susceptibilities and intra- basement features like faults and fractures. Depth to the shallow magnetic layer ranges from 0.101km to 0.884km with an average depth of 0.543km (Table 2).This layer is attributed to magnetic rocks which intruded into the sedimentary formations.
The Pacific Journal of Science and Technology –566– http://www.akamaiuniversity.us/PJST.htm Volume 13. Number 1. May 2012 (Spring)
Figure 8: Rose Diagram of the Linear Structures of the Study Area Showing Dominant trends of N - S and E-W.
Figure 9: Reduction to Pole Map of the Aeromagnetic Data of the Study Area Showing Negative and Positive Anomalies.

The Pacific Journal of Science and Technology –567– http://www.akamaiuniversity.us/PJST.htm Volume 13. Number 1. May 2012 (Spring)
Figure 10: Second Vertical Derivative Map of the Aeromagnetic Data of the Study Area Showing Negative and Positive Anomalies.
Figure 11: Shaded Relief Map of the Aeromagnetic Data of the Study Area Showing Magnetic Basement
Relief.

The Pacific Journal of Science and Technology –568– http://www.akamaiuniversity.us/PJST.htm Volume 13. Number 1. May 2012 (Spring)
Figure 12: Typical 2-D Spectral Inversion Plot of the Aeromagnetic Data across the Study Area.
Table 2: Spectral Estimates to the Magnetic Basement Depth Layers in the Study Area.
SPECTRAL BLOCK LONGITUDE LATITUDE DEPTH KM X1 X1 Y1 Y1 D1 D1
A 4.50 4.75 6.75 7.00 0.6 3.9 B 4.75 5.00 6.75 7.00 0.9 3.6 C 4.50 4.75 6.50 6.75 0.8 3.7 D 4.75 5.00 6.50 6.75 0.2 4.1 E 5.00 5.25 6.75 7.00 0.2 3.6 F 5.25 5.50 6.75 7.00 0.6 4.1 G 5.00 5.25 6.50 6.75 0.9 4.3 H 5.25 5.50 6.50 6.75 0.5 4.2 I 5.50 5.75 6.75 7.00 0.2 3.7 J 5.75 6.00 6.75 7.00 0.1 3.2 K 5.50 5.75 6.50 6.75 0.2 3.2 L 5.75 6.00 6.50 6.75 0.1 4.2 M 4.50 4.75 6.25 6.50 0.9 3.3 N 4.75 5.00 6.25 6.50 0.1 3.1 O 4.50 4.75 6.00 6.25 0.2 3.3 P 5.00 5.00 6.00 6.25 0.8 5.1 Q 5.25 5.25 6.25 6.50 0.7 5.2 R 5.50 5.50 6.25 6.50 0.2 6.2 S 5.25 5.25 6.00 6.25 0.7 6.2 T 5.50 5.50 6.00 6.25 0.5 6.4 U 5.75 5.75 6.25 6.50 0.4 6.2 V 6.00 6.00 6.25 6.50 0.3 5.5 W 5.75 5.75 6.00 6.25 0.1 5.4 X 6.00 6.00 6.00 6.25 0.5 6.0

The Pacific Journal of Science and Technology –569– http://www.akamaiuniversity.us/PJST.htm Volume 13. Number 1. May 2012 (Spring)
Figure 13: Depth to Magnetic Basement Map (in meters) of the Aeromagnetic Data across the Study Area.
These spectral depths are in agreement with depth estimates from Peter’s rule which revealed the depth to the shallow layer to be in the range of 0.338km to 1.76km, while the depth to the magnetic basement varies between 2.68km to 6.488km. Zaborski (1998) explained that the Benin Basin is an Atlantic margin basin containing a Cretaceous and Cenozoic sedimentary succession reaching a thickness of over 3000m(>3km).Along strike, the Benin Basin is subdivided into a number of horst and graben structures by N-S to NE-SW trending faults. Coker and Ejedawe (1987) recognized a western Benin Basin proper and an eastern Okitipupa structure. Over the latter the basement floor typically occurs at depths of 1000 to 1400m but down drops occur in the Ise graben where basement is at 1800-2000m.Evamy, et al[24] explained that to the east of the Okitipupa structure, the basement plunges rapidly to over 10km below the western Niger Delta. In the Benin Basin proper; there is a steady drop of basement along strike from about 1900m in the central part of the Nigerian sector to over 2200m at the Nigeria-Benin border. Immediately east of the border the basin also deepens from about 1500m
to 2700m along a N-S line 30km long crossing the present day coastline. Coker and Ejedawe (1987) and Zaborski (1998) proved that these latter drops represented as series of narrow step faulted basement aligned parallel to the coastline and with a regional southerly tilt. CONCLUSION The presence of boundary faults of the Benin Basin and the correlation and alignment of the major intrusions into the basin with both the strike and trend of the basin is enough reason to believe that rifting and wrench faulting are possible origins of the basin. Regional extension enhances brittle deformation to the degree that the style is commonly dominated by fractures. Protracted or episodic deformation involving two or more major wrench faults can be considerably more complex leading to a variety of trends. This variety of trends probably results from the interaction of two factors: pre-deformational anisotropies and external rotation and reactivation of the fractures.

The Pacific Journal of Science and Technology –570– http://www.akamaiuniversity.us/PJST.htm Volume 13. Number 1. May 2012 (Spring)
REFERENCES 1. Adediran, S.A. and O.S. Adegoke.1987. “Evolution
of the Sedimentary Basins of the Gulf of Guinea”. Current Research in Africa Earth Sciences. Matheis and Schandeimeier (eds).Balkema: Rotterdam, Germany.283-286.
2. Adekeye, O A. 2005. “Aspects of Sedimentology, Geochemistry, and Hydro-carbon Potentials of the Cretaceous- Tertiary sediments in the Dahomey Basin Southwestern Nigeria”. Unpublished Ph.D. Thesis, University of Ilorin: Nigeria.
3. Ajakaiye, D.E., D.N. Hall, T.W. Miller, P.J.T. Verheij, M.B. Awad, and S.B.Ojo.1986. “Aeromagnetic Anomalies and Tectonic Trends in and around the Benue Trough, Nigeria”. Nature. 319(6054):582-584.
4. Ajayi, C.O., A.E. Ikpokonte, and E.C. Ike.1991. “Structural Pattern in the Lower Benue Trough Nigeria: Deductions from Ground Magnetic Data”. Journal of Mining and Geology. 27(2):33- 40.
5. Ananaba, S.E. and D.E. Ajakaiye. 1987. “Evidence of Tectonic Control of Mineralization of Nigeria from Lineament Density Analysis: A Landsat Study”. Int. Jour. Rem. Sensing. 1(10):1445-1453.
6. Coker, S.J.L. and J.E. Ejedawe. 1987. “Petroleum Prospects of the Benin Basin”. Nigeria Nig. Jour. of Min. and Geol. 34:424-439.
7. Chukwu-Ike, I.M, and J.W. Norman. 1997. “Mineralized Crustal Fractures shown on Satellite Imagery of Nigeria”. Inst. of Min. and Metatransactions. 86:55-67.
8. Elueze, A.A.1982. “Geochemistry of the Ilesha
Granite Gneiss in the Basement Complex of Southwestern Nigeria”. Precambrian Res. 19:167-177.
9. Elueze, A.A. 2000. “Compositional Appraisal and
Petrotectonic Significance of the Imelu Banded Ferruginous Rock in the Ilesha Schist Belt, South Western Nigeria”. Journal of Mining and Geology. 36(1):9-18.
10. Emery, K., O.E. Uchupi, J. Phillips, C. Bowin, and
J. Mascle. 1975. “Continental Margin off West Africa: Angola to Sierra Leone”. Bulletin American Association of Petroleum Geologists. 59:2209-2265 .
11. Evamy , B.D., J. Harembourne, P. Kamerling, W.A. Knaap, F.A. Molley, and P.H. Rowlands.1978. “Hydro-carbon Habitat of the Tertiary Niger Delta”. AAPG Bulletin. 62:1–39.
12. Francheteau, J. and X. Le Pichon.1972. “Marginal Fracture Zones as Structural Framework of Continental Margins in South Atlantic Ocean”. Bulletin American Association of Petroleum Geologists. 56:991-1007.
13. Idowu, J.O., S.A. Ajiboye, M.A. Ilesanmi, and A. Tanimola. 1993. “Origin and Significance of Organic Matter of Oshosun Formation, South Western Dahomey Basin, Nigeria”. Journal of Mining and Geology. 29:9–17.
14. Mascle, J., E. Blarez ,M. and Marinho.1988. “The Shallow Structures of the Guinea and Ivory Coast- Ghana Transform Margins: Their Bearing on the Equatorial Atlantic Mesozoic Evolution”. Tectonophysics. 15:193-209.
15. Murat, R.C. 1972. “Stratigraphy and Palaeo-Geography of the Cretaceous and Lower Tertiary in Southern Nigeria”. In: African Geology. T.F.J. Dessauvagie and A.J. Whiteman (eds.). 251-266. Ibadan University Press: Ibadan, Nigeria.
16. Nettleton, L.L. 1976. Gravity and Magnetics in Oil Prospecting. Mc Graw Hill: New York, NY.
17. Olade, M.A. and A.A. Elueze.1979. “Petrochemistry of the Ilesha Amphibolites and Precambrian Crustal Evolution in the Pan-African Domain of Southwestern Nigeria”. Pre-Cambrian Res. 8:303-318.
18. O’Leary, D.M., J.D. Friedman, and H.A. Pohm.1976. “Lineament, Linear, Lineation; Some Proposed New Standards for Old Terms”. Geol.Soc.Amer.Bull.87:1463-1469.
19. Omatsola, M.E. and O.S. Adegoke. 1981. “Tectonic Evolution and Cretaceous Stratigraphy of the Dahomey Basin”. Journal of Mining and Geology. 18(1):130-137.
20. Onyedim, G.C. 1996. “An Investigation of
Structural and Lithologic Controls of Drainage Patterns in Parts of Ilesha Area Using Remote Sensing Data. Journal of Mining and Geology. 32(1):53-58.
21. Onyedim, G.C., M.O. Awoyemi., E.A. Ariyibi, and J.B. Arubayi. 2006. “Aeromagnetic Imaging of the Basement Morphology in Part of the Middle Benue Trough, Nigeria”. Journal of Mining and Geology. 42(2):57-163.
22. Onuoha, K.M. and Ofoegbu,C.O.1988. “Subsidence and Thermal History of the Dahomey Embayment: Implications for Petroleum Exploration”. Nigerian Association of Petroleum Explorationists Bulletin. 3(2):131-142.

The Pacific Journal of Science and Technology –571– http://www.akamaiuniversity.us/PJST.htm Volume 13. Number 1. May 2012 (Spring)
23. Spector, A. and F.S. Grant. 1970. “Statistical Models for Interpreting Aeromagnetic Data”. Geophysics. 35:293-302.
24. Simpson, S.M. 1954. “Least Squares Polynomial Fitting to Gravitational Data and Density by Digital Computers”. Geophysics.19:255-265.
25. Udoh, A.N. 1988. “Remote Sensing Imageries of
Nigeria, North of 70401”. In: Oluyide, P.O., et. al. (eds). Precambrian Geology. Geological Survey of Nigeria: Lagos, Nigeria. 99- 102.
26. Zaborski, P.M. 1998. “A Review of the Cretaceous System in Nigeria”. Africa Geoscience Review.5(4):385-483.
SUGGESTED CITATION Opara, A.I., A.C. Ekwe, C.N. Okereke, I.A. Oha, and O.P. Nosiri. 2012. “Integrating Airborne Magnetic and Landsat Data for Geologic Interpretation over part of the Benin Basin, Nigeria”. Pacific Journal of Science and Technology. 13(1):556-571.
Pacific Journal of Science and Technology