integrating dynamic pricing of electricity into energy ...lan/publications/sc13_final.pdf ·...
TRANSCRIPT

Integrating Dynamic Pricing of Electricity into EnergyAware Scheduling for HPC Systems
Xu Yang, Zhou Zhou, Sean Wallace, Zhiling LanIllinois Institute of Technology, Chicago, IL, USA
{xyang56, zzhou1, swallac6}@hawk.iit.edu, [email protected]
Wei Tang, Susan Coghlan, Michael E. PapkaArgonne National Laboratory, Argonne, IL, USA
{wtang, smc, papka}@anl.gov
ABSTRACTThe research literature to date mainly aimed at reducing en-ergy consumption in HPC environments. In this paper wepropose a job power aware scheduling mechanism to reduceHPC’s electricity bill without degrading the system utiliza-tion. The novelty of our job scheduling mechanism is itsability to take the variation of electricity price into consid-eration as a means to make better decisions of the timingof scheduling jobs with diverse power profiles. We verifiedthe effectiveness of our design by conducting trace-based ex-periments on an IBM Blue Gene/P and a cluster system aswell as a case study on Argonne’s 48-rack IBM Blue Gene/Qsystem. Our preliminary results show that our power awarealgorithm can reduce electricity bill of HPC systems as muchas 23%.
KeywordsPower, Electricity Bill, Job Scheduling, System Utilization
1. INTRODUCTIONAs HPC systems continue to grow so does their energy
consumption. The electricity bill is now a leading com-ponent of total cost of ownership(TCO) of HPC systems.The typical current petascale system on average consumes2-7 MW of power [21]. Case in point, the Argonne Lead-ership Computing Facility (ALCF) budgets approximately$1M annually for electricity to operate its primary super-computing resource. Based on current projections, exascalesupercomputers will consume 60-130 MW, which will proveto be an unbearable burden for any facility. Therefore, elec-tricity savings are crucial for reducing the operational costof extreme scale systems.
There is a significant number of research studies aboutimproving energy efficiency for HPC systems and most ofthem focusing on the following topics: energy-efficient or en-ergy proportional hardware, dynamic voltage and frequency
Permission to make digital or hard copies of all or part of this work forpersonal or classroom use is granted without fee provided that copies arenot made or distributed for profit or commercial advantage and that copiesbear this notice and the full citation on the first page. To copy otherwise, torepublish, to post on servers or to redistribute to lists, requires prior specificpermission and/or a fee. Request permissions from [email protected]’13 November 17-21 2013, Denver, CO, USACopyright 2013 ACM 978-1-4503-2378-9/13/11$15.00.http://dx.doi.org/10.1145/2503210.2503264.
Figure 1: Job Power Distribution on BGQ
scaling (DVFS) techniques, shutting down hardware compo-nents at low system utilizations, power capping, and thermalmanagement.
Being orthogonal to existing studies, this work focuseson reducing the electricity bill of HPC systems via a smartjob scheduling mechanism. The rationale is based on a keyobservation of HPC jobs: parallel jobs have distinct powerconsumption profiles. Hennecke et al. [13] analyzed the en-ergy characteristics of the production workload at ResearchCenter Julich (FJZ) and found the power consumption of thejobs running on their Blue Gene/P(BGP) system range from20 kW/rack to 33 kW/rack per. In our recent work [28], weprovided analysis of a one-month workload on Mira, the 48-rack IBM Blue Gene/Q (BGQ) system at Argonne NationalLaboratory (Figure 1). The histogram displays percentagespartitioned by size ranging from single rack jobs to full sys-tem runs. The power consumption of those jobs varies fromaround 40 kW/rack to 90 kW/rack. It can’t tell from the fig-ure that the size of these jobs affects their energy efficiencyor not.
We hypothesize that it is possible to save a significantamount on an electric bill by exploiting a dynamic elec-tricity pricing policy. To date, dynamic electricity pricingpolicies have been widely adopted in Europe, North Amer-ica, Oceania, and parts of Asia. For example, in the U.S.A,wholesale electricity prices vary by as much as a factor of10 from one hour to the next [23]. Under dynamic pricing,the power grid has on-peak time (when it bears a heavier
burden and consequently the electricity price is higher) andoff-peak time (when there is less demand for electricity andthe price is lower) alternatively in a day.
In this work, we develop a job power aware schedulingmechanism. The novelty of this scheduling mechanism isthat it can reduce system’s electricity bill by scheduling anddispatching jobs according to their power profiles and the realtime electricity price, while causing negligible impact on thesystem’s utilization and scheduling fairness. Preferentially,it dispatches the jobs with higher power consumption duringthe off-peak period, and the jobs with lower power consump-tion during the on-peak period.
A key challenge in HPC scheduling is that system utiliza-tion should not be impacted. HPC systems require a tremen-dous capital investment, hence taking full advantage of thisexpensive resources is of great importance to HPC centers.Unlike the utilization of Internet data centers, which onlyfluctuate about 20%, systems at HPC centers are highlyemployed with a typical utilization around 50%-80% [3]. Toaddress this challenge, we propose a novel window-basedscheduling mechanism[26]. In this work, rather than allo-cating jobs one by one from the front of the wait queue asexisting schedulers do, we schedule and dispatch a ”window”of jobs at a time. Those jobs placed into the window are cho-sen to maintain job fairness, and the allocation of these jobsonto system resources is done in such a way as to minimizeelectricity bill. Two scheduling algorithms, namely a Greedypolicy and a 0-1 Knapsack based policy, are presented in thiswork for decision-making.
We evaluate our job power aware scheduling design viaextensive trace-based simulations and a case study of Mira.In this paper, we present a series of experiments comparingour design against the popular first-come, first-serve (FCFS)scheduling policy, with backfilling done in three different as-pects (electricity bill saving, scheduling performance, andjob performance). Our preliminary results demonstrate thatour design can cut electricity bill by up to 23% without animpact on overall system utilization. Considering HPC cen-ters often spend millions of dollars on even the least ex-pensive energy contracts, such savings can translate into areduction of hundreds of thousands in terms of TCO.
The structure of the paper is as follows. In section 2, wediscuss the existing work about energy reduction for HPCsystems. Section 3 describes the job power aware schedul-ing problem. Section 4 gives a detailed description of ourjob power aware scheduling design. Sections 5-7 presentour evaluation methodology, trace-based simulations, and acase study by comparing our design against the widely-usedFCFS scheduling policy under a variety of configurations.Our findings are presented in Section 8.
2. RELATED WORKFirst, we give a brief survey of dynamic electricity pricing
policies in different countries to demonstrate the applicabil-ity of this work. The European Exchange Market (EEX)in Germany, PowerNext in France, and APX in the Nether-lands and Iberian market all vary their cost of electricityon an hourly basis[12]. In [20], the author stated dynamicelectricity pricing policies are well adopted in Nordic coun-tries as Norway, Finland, Sweden, and Denmark. Otherpower markets such as England, New Zealand, and Aus-tralia also have similar policies. Since the electricity crisisin 2011-2012, the Japanese Ministry of Economy, Trade and
Industry (METI) has initiated the Smart Community PilotProjects in four cities in Japan(Yokohama, Toyota, Kyoto,and Kitakyushu) to investigate the effect of dynamic pric-ing and smart energy equipment on residential electricitydemand[15]. In China, major cities such as Beijing, Shang-hai, Guangzhou have initiated dynamic electricity pricing forboth domestic and industrial use since 2006. Dynamic elec-tricity pricing has also been carried out in several provincessuch as Zhejiang, Jiangsu, and Guangdong.
As we can see from the survey above, the dynamic elec-tricity pricing policy has already been carried out in powermarkets in Europe, North America, Oceania, and China.Japan has initiated preliminary tests in some major citiesto see the effect of this dynamic electricity pricing policy onthe reduction of electricity consumption. While in this studywe evaluate our design based on the on-/off-peak electricitypricing in U.S.A, we believe our design is applicable to othercountries(e.g., those listed above) for cutting the electricitybill of their HPC systems.
Although there is no known effort to provide job poweraware scheduling support in the field of HPC, there is alarge body of related work. Due to space limitations, in thissection we discuss some closely related studies and point outkey differences among them.
From the hardware perspective, hardware vendors are ded-icated to produce energy-efficient devices. For instance, Bar-roso and Holzle [5] argued that the power consumption ofa machine should be proportional to its workload, i.e., itshould consume no power in idle state, almost no powerwhen the workload is very low, and eventually more powerwhen the workload is increased. Ideally, an energy propor-tional system could save half of the energy used in datacenter operations. Li [18] optimized the power/ground gridto make the power supply more efficient for the chip.
Since processor power consumption is a significant portionof the total system power (roughly 50% under load [14]),DVFS is widely used for controlling CPU power [7]. Byrunning a processor at a lower frequency/voltage, energysavings can be achieved at the expense of increased job ex-ecution time. In order to meet user’s SLAs (Service LevelAgreements), DVFS is typically applied at the period of lowsystem activity. Some research studies on this topic can befound in [22] [19] [9] [16].
In a typical HPC system, nodes often consume consider-able energy in idle state without any running application.For example, an idle Blue Gene/P rack still has a DC powerconsumption of about 13 kW [13]. During low system uti-lization, some nodes or their components could be shut downor switched to a low-power state. This strategy tries to min-imize the number of active nodes of a system while still sat-isfying incoming application requests. Since this approachis highly dependent on system workload, the challenge is todetermine when to shut down components and how to pro-vide a suitable job slowdown value based on the availabilityof nodes.
Hikita et al.[14] performed an empirical study by imple-menting an energy-aware scheduler for an HPC system. Theoperation of the scheduler is simple: if a node is inactive for30 minutes, it is powered off; when the node is required forjob execution, it is powered on and moved to an active state.Powering up a node on their system takes approximately 45minutes, which is substantial. This strategy can improvepower efficiency by 39% at best. Because the rebooting of a

node may consume significant time that will lead to a per-formance degradation if it happens to be peak job requestperiod and more nodes are required than the active ones.
Pinheiro et al. [22] presented a mechanism that dynam-ically turns cluster nodes on and off. This approach usesload consolidation to transfer workload onto fewer nodes sothat idle nodes can be turned off. The experimental testson a static 8-node cluster indicate a 19% saving in energy.It takes about 100 seconds to power on a server and 45 sec-onds to shut it down on the cluster. The degradation inperformance is approximately 20%.
Thermal management techniques are another method fre-quently discussed in the literature [19] [16]. The rationaleis that higher temperatures have a large impact on systemreliability and can also increase cooling costs. By using ther-mal management, system workload is adjusted according toa predefined temperature threshold: if the temperature ona server rises above that threshold, its workload is reduced.Disadvantages of thermal management are delayed response,high risk of overheating, excessive cooling and recursive cy-cling [16].
Many data centers use power capping or power budgetingto reduce the total power consumption. The operator canset a threshold of power consumption to ensure the actualpower of the data center does not exceed it [10]. It preventssudden rises in power supply and keeps the total power con-sumption under a predefined budget. Basically, the powerconsumption can be reduced by rescheduling tasks or CPUthrottling, for example, Etinski et al. proposed a paralleljob scheduling policy based on integer linear programmingunder a given power profile [9]. Lefurgy et al. presenteda technique for high density servers that controls the peakpower consumption by implementing a feedback controller[17].
This work has two major differences as compared to ourprevious work presented in [30]. First, our previous worktargets Blue Gene/P systems, which have a special require-ment on job scheduling, i.e., available nodes must be con-nected in a job specific shape before they can be allocatedto a job[26] [24]. This work intends to provide a generic jobpower aware scheduling mechanism for various HPC sys-tems. Second, our previous work relies on a power budget(similar to power capping) for energy cost saving, which de-grades system utilization slightly during on-peak electricityprice period. The scheduling policies presented in this workdo not use power budget, and they minimize the electric-ity bill without impacting system utilization, during bothon-peak and off-peak electricity pricing periods.
3. PROBLEM DESCRIPTIONTypically, user jobs are submitted to an HPC system
through a batch scheduler, and then wait in a queue forthe requested amount of system resources to become avail-able. There may be one or multiple job queues with differentpriories. A job is generally defined by its arrival time, its es-timated runtime, the amount of computing nodes requested,etc. The scheduler is responsible for assigning computingnodes to the jobs in the queues. FCFS with backfilling is acommonly used scheduling policy in HPC [11]. Under thispolicy, the scheduler picks a job from the head of the waitqueue and dispatches it to the available system resources.The nodes assigned to a job become unavailable until thejob is complete (i.e., space sharing).
As mentioned in Section 1, our work is based on twokey observations in HPC: (1) electricity price is dynamicallychanging within a day; and (2) HPC jobs have distinct powerconsumption profiles. We shall point out that usually HPCjobs also tend to be repetitive. These repetitive jobs canbe easily identified by user ID, project, expected runtime,etc. A batch scheduler can extract job power profile basedon historical data and use it for power aware scheduling.For the simplicity of method description, we assume that adaily electricity price is divided into on-peak and off-peakperiods, where on-peak period is referred to the time whenmore electricity is demanded (e.g., during the daytime). Byexploring these two observations, the basic idea of our workis to allocate jobs with lower power consumption profilesduring on-peak time and to allocate jobs with higher powerconsumption profiles during off-peak time. Furthermore, theallocation is made under the assumption that there will beno impact to system utilization, meaning that a situationwhere a job is waiting in the queue while there is a sufficientamount of idle/available computing nodes is not allowed.
Getting job power consumption profiles is feasible on to-day’s supercomputers. Most production HPC systems aredeployed with built-in sensors that monitor the health sta-tus of its hardware components. These sensors, deployedin various locations inside the system, report environmen-tal conditions such as motherboard, CPU, GPU, hard diskand other peripherals for temperature, voltage, and/or fanspeed. A number of software tools/interfaces are publiclyavailable for users to access these sensor readings[6] [2] [4][28].
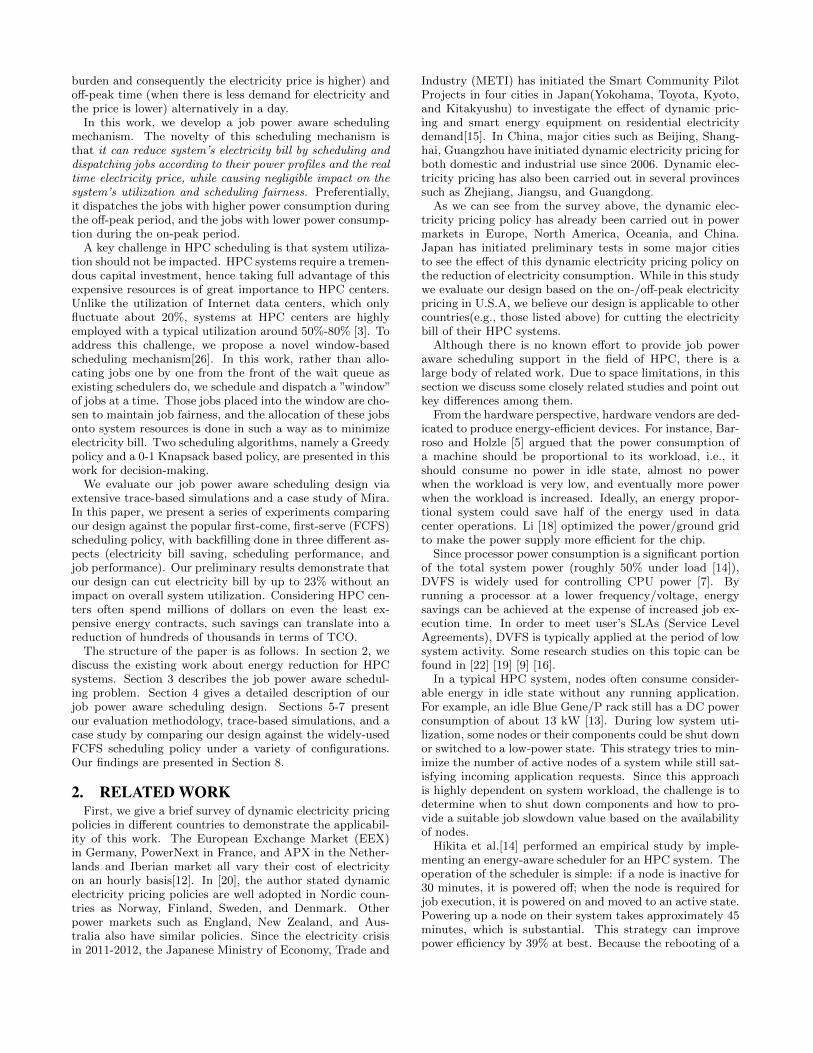
Figure 2 pictorially illustrates an example to highlightthe key idea of our design as compared to the conventionalFCFS. Suppose five jobs J0, J1, J2, J3, J4 are submitted to a12-node system. Each job is associated with several param-eters, such as the amount of nodes needed, the estimatedruntime, etc. Further, each job is also associated with apower consumption profile pi, which can be determined fromhistorical data[28]. Suppose these jobs have the followingparameters:
Job Power Profile (W/node) Job SizeJ0 50 6J1 20 3J2 40 3J3 30 3J4 10 6
Under the conventional FCFS policy, the scheduling se-quence is always < J0, J1, J2 > in spite of the schedulingtime. Our scheduling mechanism provides different schedul-ing sequences depending on the dynamic electricity priceand job’s power profile. More specifically, our schedulingalgorithm allocates < J4, J1, J3 > during the on-peak pe-riod, and allocates < J0, J2, J3 > during the off-peak pe-riod. By comparing the total power consumptions of usingFCFS to that of our design, it is clear that our design is ableto reduce the accumulated power consumption during theon-peak time where as to increase the accumulated powerconsumption during the off-peak time, hence reducing theoverall electricity bill.
4. METHODOLOGYIn Table 1, we list the nomenclature that will be used in
the rest of this paper. Figure 3 gives an overview of our job
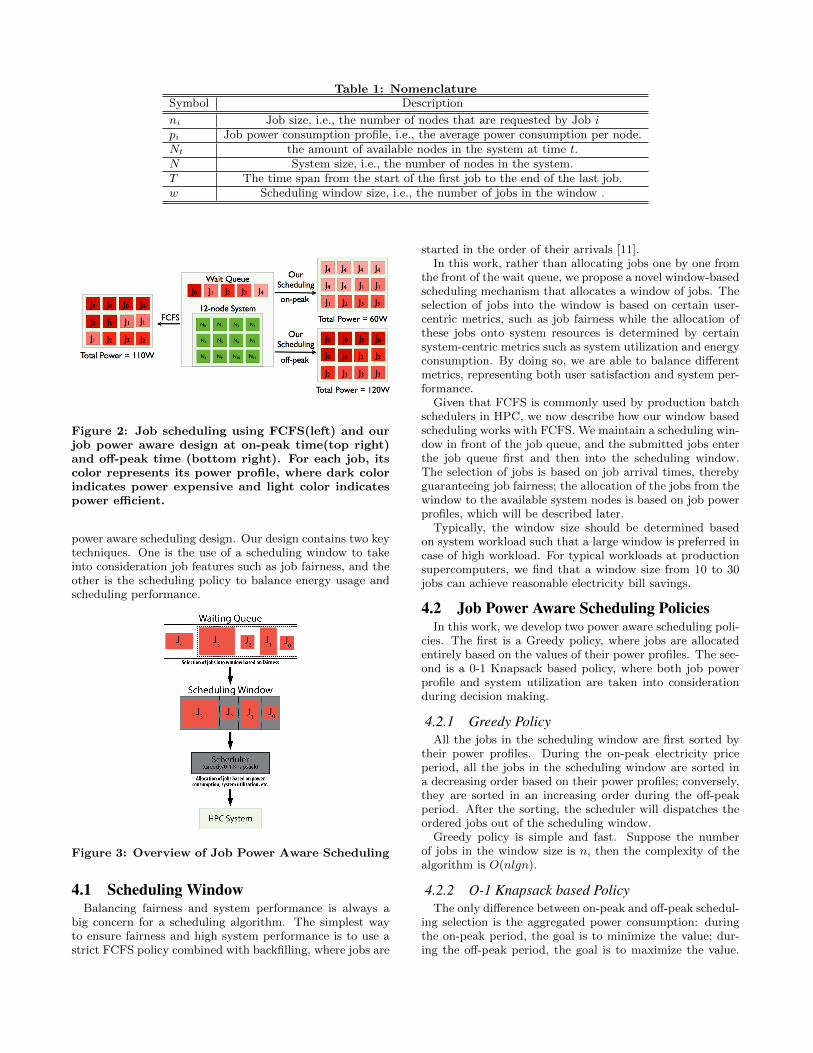
Table 1: NomenclatureSymbol Description
ni Job size, i.e., the number of nodes that are requested by Job ipi Job power consumption profile, i.e., the average power consumption per node.Nt the amount of available nodes in the system at time t.N System size, i.e., the number of nodes in the system.T The time span from the start of the first job to the end of the last job.w Scheduling window size, i.e., the number of jobs in the window .
Figure 2: Job scheduling using FCFS(left) and ourjob power aware design at on-peak time(top right)and off-peak time (bottom right). For each job, itscolor represents its power profile, where dark colorindicates power expensive and light color indicatespower efficient.
power aware scheduling design. Our design contains two keytechniques. One is the use of a scheduling window to takeinto consideration job features such as job fairness, and theother is the scheduling policy to balance energy usage andscheduling performance.
Figure 3: Overview of Job Power Aware Scheduling
4.1 Scheduling WindowBalancing fairness and system performance is always a
big concern for a scheduling algorithm. The simplest wayto ensure fairness and high system performance is to use astrict FCFS policy combined with backfilling, where jobs are
started in the order of their arrivals [11].In this work, rather than allocating jobs one by one from
the front of the wait queue, we propose a novel window-basedscheduling mechanism that allocates a window of jobs. Theselection of jobs into the window is based on certain user-centric metrics, such as job fairness while the allocation ofthese jobs onto system resources is determined by certainsystem-centric metrics such as system utilization and energyconsumption. By doing so, we are able to balance differentmetrics, representing both user satisfaction and system per-formance.
Given that FCFS is commonly used by production batchschedulers in HPC, we now describe how our window basedscheduling works with FCFS. We maintain a scheduling win-dow in front of the job queue, and the submitted jobs enterthe job queue first and then into the scheduling window.The selection of jobs is based on job arrival times, therebyguaranteeing job fairness; the allocation of the jobs from thewindow to the available system nodes is based on job powerprofiles, which will be described later.
Typically, the window size should be determined basedon system workload such that a large window is preferred incase of high workload. For typical workloads at productionsupercomputers, we find that a window size from 10 to 30jobs can achieve reasonable electricity bill savings.
4.2 Job Power Aware Scheduling PoliciesIn this work, we develop two power aware scheduling poli-
cies. The first is a Greedy policy, where jobs are allocatedentirely based on the values of their power profiles. The sec-ond is a 0-1 Knapsack based policy, where both job powerprofile and system utilization are taken into considerationduring decision making.
4.2.1 Greedy PolicyAll the jobs in the scheduling window are first sorted by
their power profiles. During the on-peak electricity priceperiod, all the jobs in the scheduling window are sorted ina decreasing order based on their power profiles; conversely,they are sorted in an increasing order during the off-peakperiod. After the sorting, the scheduler will dispatches theordered jobs out of the scheduling window.
Greedy policy is simple and fast. Suppose the numberof jobs in the window size is n, then the complexity of thealgorithm is O(nlgn).
4.2.2 O-1 Knapsack based PolicyThe only difference between on-peak and off-peak schedul-
ing selection is the aggregated power consumption: duringthe on-peak period, the goal is to minimize the value; dur-ing the off-peak period, the goal is to maximize the value.

In the following, we present the 0-1 Knapsack based policyworks at off-peak time.
Suppose there are Nt available nodes in the system, thescheduling window size is w {Ji, |1 6 i 6 w}, and each jobJi requires ni nodes, with a power profile of pi. Now, thescheduling problem can be formalized as follows:
Problem 1. To selecting a subset of {Ji, |1 6 i 6 k}from the scheduling window such that the aggregate nodes∑
1≤i≤k ni is no more than Nt, with the objective of maxi-
mizing the aggregated power consumption∑
1≤i≤k ni · pi.The above problem can be formalized into a 0-1 Knapsack
problem. We set the available nodes Nt as the knapsack’ssize and consider the jobs in the scheduling window as theobjects that we intend to put into the knapsack. For eachjob, its power profile (measured in W/node or kW/rack) isits value, the number of required node is considered as theweight. Hence we can further transform Problem 1 into astandard 0-1 Knapsack model.
Problem 2. To determine a binary vectorX = {xi, |1 6 i 6 k} such that:
maximize∑
1≤i≤k
xi · pi, xi = 0 or 1
subject to∑
1≤i≤k
xi · ni ≤ Nt
(1)
The standard 0-1 Knapsack model can be solved in pseudo-polynomial time by using dynamic programming[8]. To avoidredundant computation, when implementing this algorithmwe use the tabular approach by defining a 2D table G,where G[k,w] denotes the maximum gain value that can beachieved by scheduling jobs {ji|1 ≤ i ≤ k} which require nomore than Nt computing nodes, where 1 ≤ k ≤ J . G[k,w]has the following recursive feature:
G[k,w]=
{0 kw = 0G[k−1,w] wi ≥ wmax(G[k−1,w],vi+G[k−1,w−wi]) wi ≤ w
(2)
The solution G[J,Nt] and its corresponding binary vectorX determine the selection of jobs scheduled to run. Thecomputation complexity of Equation 2 is O(J ·Nt).
During on-peak time, 0-1 Knapsack-based policy is mod-ified by changing the selection criterion into minimizing thetotal value of the objects in the knapsack with the constraintof knapsack size.
5. EVALUATION METHODOLOGYWe conduct a series of experiments using trace-based sim-
ulations. In our experiments, we compare our design asagainst the well-known FCFS scheduling policy [11]. In therest of the paper, we simply use Greedy, Knapsack, andFCFS to denote our scheduling policies and the conven-tional batch scheduling policy. This section describes ourevaluation methodology, and the experimental results willbe presented in the next section.
5.1 CQSim: Trace-based Scheduling Simula-tor
Simulation is an integral part of our evaluation of vari-ous scheduling policies as well as their aggregate effect onperformance and power consumption. We have developeda simulator named CQSim to evaluate our design at scale.
The simulator is written in Python, and is formed by sev-eral modules such as job module, node module, schedulingpolicy module, etc. Each module is implemented as a class.The design principles are reusability, extensibility, and ef-ficiency. The simulator takes job events from a trace, andan event may be job submission, job start, job end, andother events. Based on these events, the simulator emulatesjob submission, allocation, and execution based on specificscheduling policy. CQsim is open source, and is available tothe community [1].
5.2 Job TracesIn this work, we use two real workload traces collected
from production supercomputers to evaluate our design. Theobjective of using multiple traces is to quantify the impactof different factors on electricity bill saving. The first tracewe used is from a machine named Blue Horizon at the SanDiego Supercomputer Center (denoted as SDSC-BLUE inthe paper), which ran 14,4830 jobs in 2001.
Figure 4: (A) Job size distribution of ANL-BGP, (B)Job size distribution of SDSC-BLUE
The second trace we used is from two racks of the IBMBlue Gene/P machine named Intrepid at Argonne (denotedas ANL-BGP in the paper)[25] [29]. This trace contains26,012 jobs. Since this trace is extracted out of the origi-nal 40-rack workload, the utilization rate is relatively low.A well-known approach to remedy this problem is to de-crease job arrival intervals by a certain rate [27]. After wedecrease job arrival intervals by 40%, the trace becomes 5-month long with the utilization rate ranging between 39%and 88%. Figure 4 summarize job size distribution of thesetraces. ANL-BGP is used to represent capability comput-ing where the computing power is explored to solve largerproblems, whereas SDSC-BLUE is used to represent capac-ity computing where the computing power is utilized to solvea large number of small problems.
5.3 Dynamic Electricity PriceIn our experiments, we set two different electricity prices:
on-peak and off-peak pricing. We set the price in on-peaktime (from 12pm to 12am) higher than the off-peak time(from 12am until 12pm). This is done to simplify our calcu-lation and statistical analysis. Indeed, we are not concernedabout the absolute value of electricity price; instead the ra-tio of on-peak price to off-peak price is more important.According to [23], the most common ratio of on-peak andoff-peak pricing varies from 1:2 to 1:5. Hence we set thedefault ratio to 1:3.
5.4 Job Power ProfileSince job power profile is not included in the original
traces, we assign each job with a power profile between 20

to 60W per node using a normal distribution according tothe power profile presented in Figure 1. Similarly, we arenot concerned about the absolute power profile value; in-stead the ratio of maximum power profile to minimal powerprofile is more important. The default ratio is set to 1:3.
5.5 Evaluation MetricsIn this work, we use three metrics to evaluate our design
against the conventional FCFS.
Electricity Bill Saving. We calculate the relative differ-ence between the electricity bill using our design andFCFS to measure the electricity bill savings achievedby our design. The simulator sums up electricity billon a daily basis for the calculation of this metric.
System Utilization Rate. This metric denotes the ratioof the node-hours that are used for useful computationto the elapsed system node-hours. Specifically, let T bethe total elapsed time for J jobs, ci be the completiontime for job i and si be its the start time, and ni be thesize of job i, then system utilization rate is calculatedas ∑
0≤i≤J (ci − si) · ni
N · T (3)
Average Job Wait Time. For each job, its wait time refersto the time elapsed between the moment it is submit-ted to the moment it is allocated to run. This metricis calculated as the average across all the jobs sub-mitted to the system. This metric is a user-centricmetric, measuring scheduling performance from user’sperspective.
6. EXPERIMENT RESULTSWe conduct four sets of experiments on the traces de-
scribed in Section 5.2 to evaluate our design as against FCFS.
6.1 Baseline ResultsBaseline results are presented in Figures 5 - 10, where we
use the default setting described in Sections 5.3-5.4, mean-ing that job power profile ratio is 1:3 and the off-peak/on-peak pricing ratio is 1:3. On production supercomputers,the scheduling frequency is typically on the order of 10 to30 seconds. Hence, the simulator is set to make a schedulingdecision every 10 seconds.
Since our evaluation focuses on the relative reduction ofelectricity bills, so the absolute value of idle power consump-tion, which is set to 0 in our experiments, does not impactthe results.
Figure 5 and Figure 6 compare system utilization ratesachieved by using different job scheduling policies. It is clearthat the utilization degradation introduced by our designis always less than 5%, no matter which scheduling policywe choose (Greedy or Knapsack). Moreover, for the 3rdand 5th month of SDSC-BLUE trace, both our schedulingpolicies may achieve higher system utilization compared toFCFS. These results clearly demonstrate that our schedulingdesign brings negligible impact on system utilization, whichis critical to HPC systems.
Figure 7 and Figure 8 present electricity bill savings ob-tained by our designs as against FCFS. In general, the monthlyelectricity bill saving ranges from 0.5% to 10% by using
Figure 5: System Utilization of SDSC-BLUE
Figure 6: System Utilization of ANL-BGP
Figure 7: Electricity bill saving obtained on SDSC-BLUE using Greedy and Knapsack scheduling com-pared with FCFS. The average electricity bill savingobtained by using Greedy and Knapsack schedulingpolicy are 4.33% and 3.16% respectively.
Greedy, and it is from 2% to 10% by using Knapsack. Theaverage electricity bill saving is 3.16%-5.53%. We also maketwo interesting observations. First is that Greedy achievesmore electricity bill saving on SDSC-Blue, whereas Knap-sack brings in more cost saving on ANL-BGP. Second, wecan see that more energy saving is obtained from ANL-BGP.As we can see from Figure 4, these traces have distinctivejob characteristics in term of job size. In ANL-BGP trace,38% jobs request 512 nodes, 19% request 1024 nodes and8% request 2048 nodes. Given the system size is 2,048, thismeans 65% jobs are relatively large in the sense that these
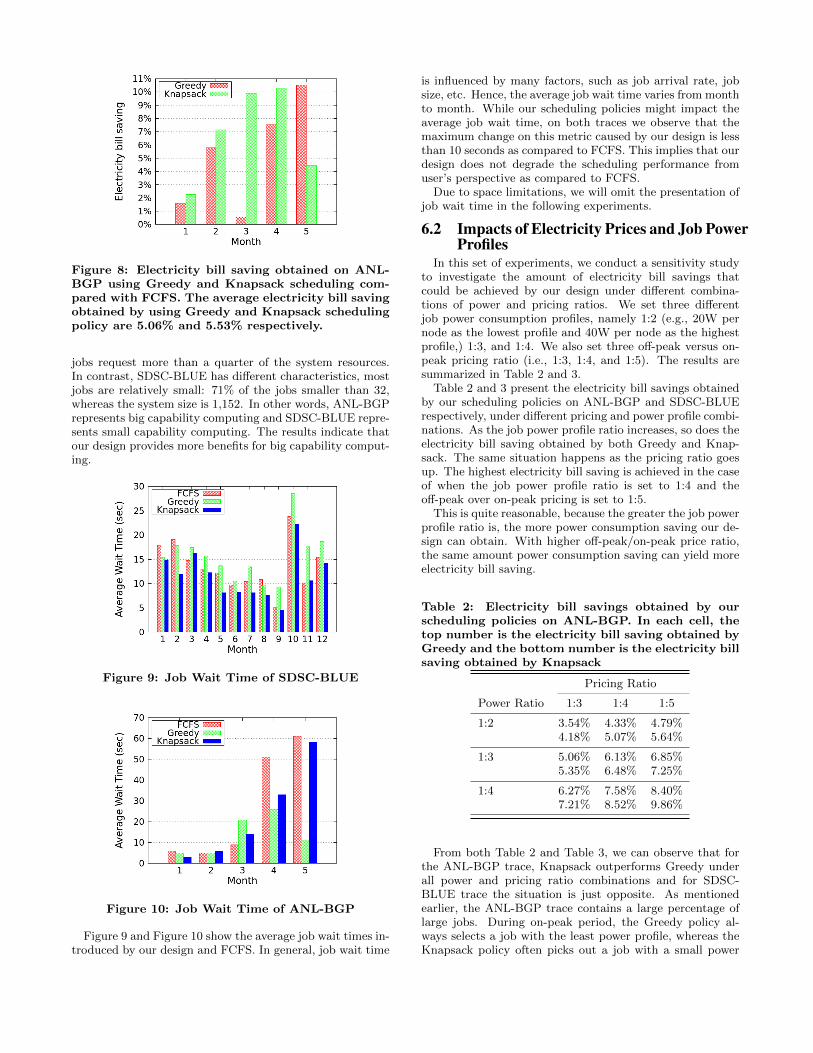
Figure 8: Electricity bill saving obtained on ANL-BGP using Greedy and Knapsack scheduling com-pared with FCFS. The average electricity bill savingobtained by using Greedy and Knapsack schedulingpolicy are 5.06% and 5.53% respectively.
jobs request more than a quarter of the system resources.In contrast, SDSC-BLUE has different characteristics, mostjobs are relatively small: 71% of the jobs smaller than 32,whereas the system size is 1,152. In other words, ANL-BGPrepresents big capability computing and SDSC-BLUE repre-sents small capability computing. The results indicate thatour design provides more benefits for big capability comput-ing.
Figure 9: Job Wait Time of SDSC-BLUE
Figure 10: Job Wait Time of ANL-BGP
Figure 9 and Figure 10 show the average job wait times in-troduced by our design and FCFS. In general, job wait time
is influenced by many factors, such as job arrival rate, jobsize, etc. Hence, the average job wait time varies from monthto month. While our scheduling policies might impact theaverage job wait time, on both traces we observe that themaximum change on this metric caused by our design is lessthan 10 seconds as compared to FCFS. This implies that ourdesign does not degrade the scheduling performance fromuser’s perspective as compared to FCFS.
Due to space limitations, we will omit the presentation ofjob wait time in the following experiments.
6.2 Impacts of Electricity Prices and Job PowerProfiles
In this set of experiments, we conduct a sensitivity studyto investigate the amount of electricity bill savings thatcould be achieved by our design under different combina-tions of power and pricing ratios. We set three differentjob power consumption profiles, namely 1:2 (e.g., 20W pernode as the lowest profile and 40W per node as the highestprofile,) 1:3, and 1:4. We also set three off-peak versus on-peak pricing ratio (i.e., 1:3, 1:4, and 1:5). The results aresummarized in Table 2 and 3.
Table 2 and 3 present the electricity bill savings obtainedby our scheduling policies on ANL-BGP and SDSC-BLUErespectively, under different pricing and power profile combi-nations. As the job power profile ratio increases, so does theelectricity bill saving obtained by both Greedy and Knap-sack. The same situation happens as the pricing ratio goesup. The highest electricity bill saving is achieved in the caseof when the job power profile ratio is set to 1:4 and theoff-peak over on-peak pricing is set to 1:5.
This is quite reasonable, because the greater the job powerprofile ratio is, the more power consumption saving our de-sign can obtain. With higher off-peak/on-peak price ratio,the same amount power consumption saving can yield moreelectricity bill saving.
Table 2: Electricity bill savings obtained by ourscheduling policies on ANL-BGP. In each cell, thetop number is the electricity bill saving obtained byGreedy and the bottom number is the electricity billsaving obtained by Knapsack
Pricing Ratio
Power Ratio 1:3 1:4 1:5
1:2 3.54% 4.33% 4.79%4.18% 5.07% 5.64%
1:3 5.06% 6.13% 6.85%5.35% 6.48% 7.25%
1:4 6.27% 7.58% 8.40%7.21% 8.52% 9.86%
From both Table 2 and Table 3, we can observe that forthe ANL-BGP trace, Knapsack outperforms Greedy underall power and pricing ratio combinations and for SDSC-BLUE trace the situation is just opposite. As mentionedearlier, the ANL-BGP trace contains a large percentage oflarge jobs. During on-peak period, the Greedy policy al-ways selects a job with the least power profile, whereas theKnapsack policy often picks out a job with a small power
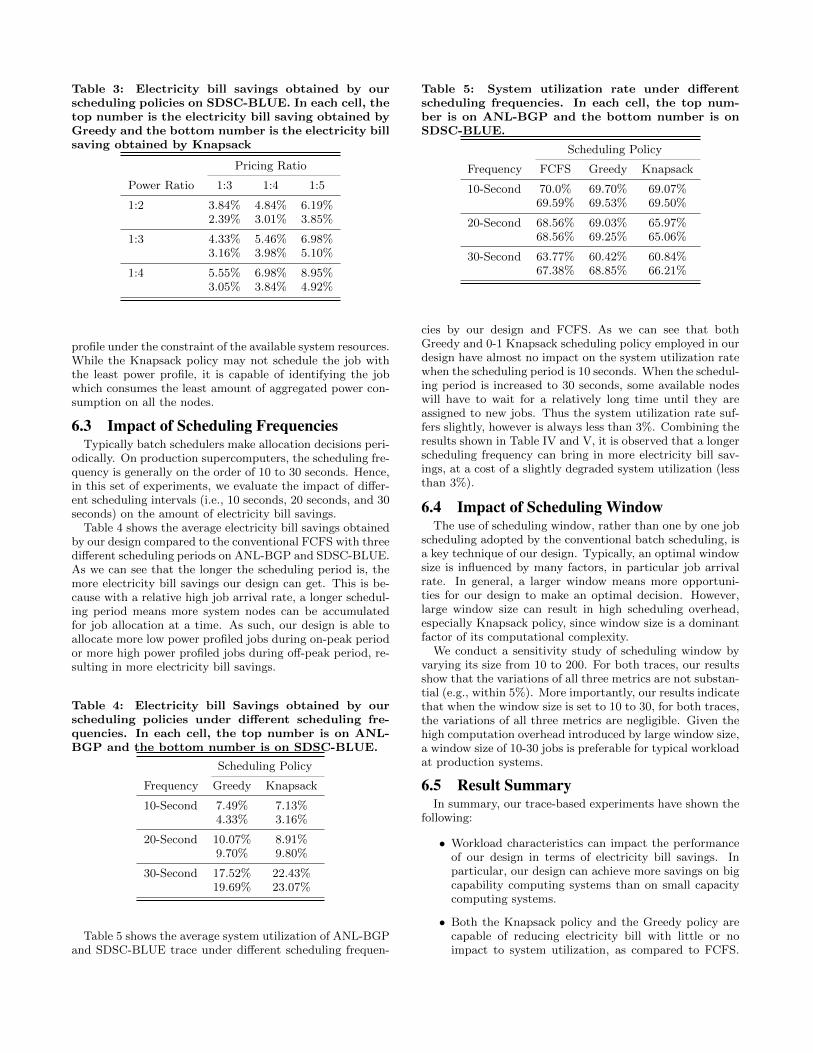
Table 3: Electricity bill savings obtained by ourscheduling policies on SDSC-BLUE. In each cell, thetop number is the electricity bill saving obtained byGreedy and the bottom number is the electricity billsaving obtained by Knapsack
Pricing Ratio
Power Ratio 1:3 1:4 1:5
1:2 3.84% 4.84% 6.19%2.39% 3.01% 3.85%
1:3 4.33% 5.46% 6.98%3.16% 3.98% 5.10%
1:4 5.55% 6.98% 8.95%3.05% 3.84% 4.92%
profile under the constraint of the available system resources.While the Knapsack policy may not schedule the job withthe least power profile, it is capable of identifying the jobwhich consumes the least amount of aggregated power con-sumption on all the nodes.
6.3 Impact of Scheduling FrequenciesTypically batch schedulers make allocation decisions peri-
odically. On production supercomputers, the scheduling fre-quency is generally on the order of 10 to 30 seconds. Hence,in this set of experiments, we evaluate the impact of differ-ent scheduling intervals (i.e., 10 seconds, 20 seconds, and 30seconds) on the amount of electricity bill savings.
Table 4 shows the average electricity bill savings obtainedby our design compared to the conventional FCFS with threedifferent scheduling periods on ANL-BGP and SDSC-BLUE.As we can see that the longer the scheduling period is, themore electricity bill savings our design can get. This is be-cause with a relative high job arrival rate, a longer schedul-ing period means more system nodes can be accumulatedfor job allocation at a time. As such, our design is able toallocate more low power profiled jobs during on-peak periodor more high power profiled jobs during off-peak period, re-sulting in more electricity bill savings.
Table 4: Electricity bill Savings obtained by ourscheduling policies under different scheduling fre-quencies. In each cell, the top number is on ANL-BGP and the bottom number is on SDSC-BLUE.
Scheduling Policy
Frequency Greedy Knapsack
10-Second 7.49% 7.13%4.33% 3.16%
20-Second 10.07% 8.91%9.70% 9.80%
30-Second 17.52% 22.43%19.69% 23.07%
Table 5 shows the average system utilization of ANL-BGPand SDSC-BLUE trace under different scheduling frequen-
Table 5: System utilization rate under differentscheduling frequencies. In each cell, the top num-ber is on ANL-BGP and the bottom number is onSDSC-BLUE.
Scheduling Policy
Frequency FCFS Greedy Knapsack
10-Second 70.0% 69.70% 69.07%69.59% 69.53% 69.50%
20-Second 68.56% 69.03% 65.97%68.56% 69.25% 65.06%
30-Second 63.77% 60.42% 60.84%67.38% 68.85% 66.21%
cies by our design and FCFS. As we can see that bothGreedy and 0-1 Knapsack scheduling policy employed in ourdesign have almost no impact on the system utilization ratewhen the scheduling period is 10 seconds. When the schedul-ing period is increased to 30 seconds, some available nodeswill have to wait for a relatively long time until they areassigned to new jobs. Thus the system utilization rate suf-fers slightly, however is always less than 3%. Combining theresults shown in Table IV and V, it is observed that a longerscheduling frequency can bring in more electricity bill sav-ings, at a cost of a slightly degraded system utilization (lessthan 3%).
6.4 Impact of Scheduling WindowThe use of scheduling window, rather than one by one job
scheduling adopted by the conventional batch scheduling, isa key technique of our design. Typically, an optimal windowsize is influenced by many factors, in particular job arrivalrate. In general, a larger window means more opportuni-ties for our design to make an optimal decision. However,large window size can result in high scheduling overhead,especially Knapsack policy, since window size is a dominantfactor of its computational complexity.
We conduct a sensitivity study of scheduling window byvarying its size from 10 to 200. For both traces, our resultsshow that the variations of all three metrics are not substan-tial (e.g., within 5%). More importantly, our results indicatethat when the window size is set to 10 to 30, for both traces,the variations of all three metrics are negligible. Given thehigh computation overhead introduced by large window size,a window size of 10-30 jobs is preferable for typical workloadat production systems.
6.5 Result SummaryIn summary, our trace-based experiments have shown the
following:
• Workload characteristics can impact the performanceof our design in terms of electricity bill savings. Inparticular, our design can achieve more savings on bigcapability computing systems than on small capacitycomputing systems.
• Both the Knapsack policy and the Greedy policy arecapable of reducing electricity bill with little or noimpact to system utilization, as compared to FCFS.
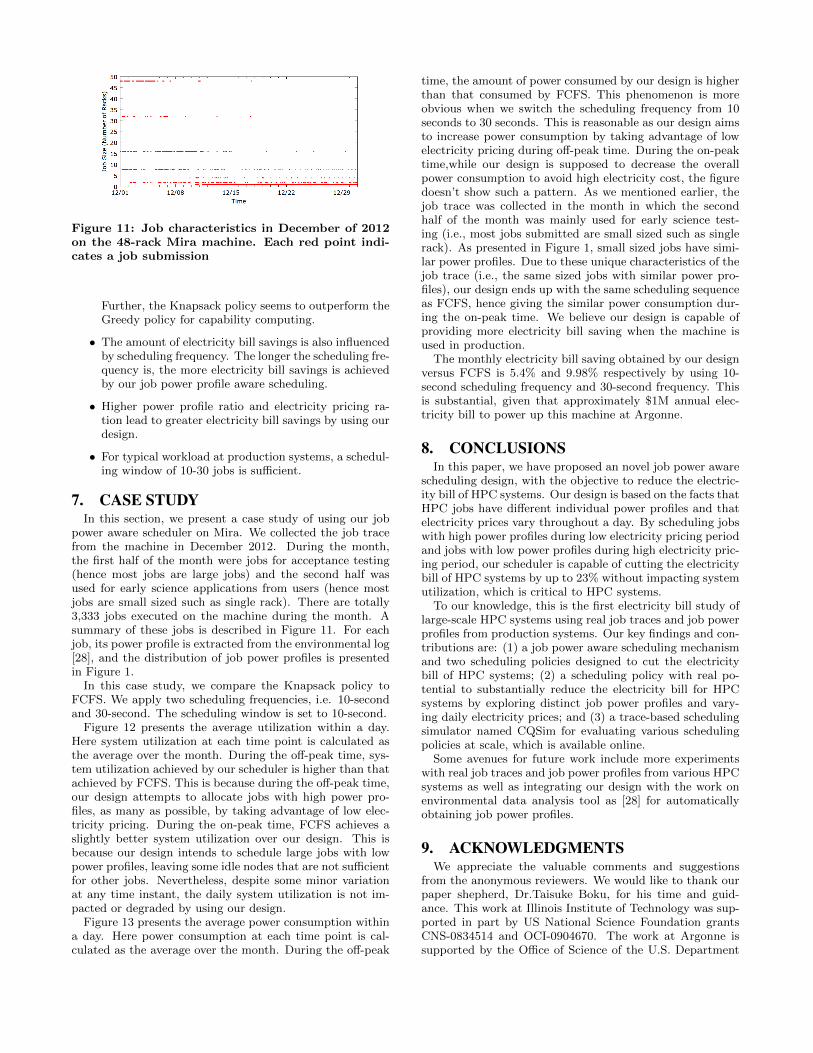
Figure 11: Job characteristics in December of 2012on the 48-rack Mira machine. Each red point indi-cates a job submission
Further, the Knapsack policy seems to outperform theGreedy policy for capability computing.
• The amount of electricity bill savings is also influencedby scheduling frequency. The longer the scheduling fre-quency is, the more electricity bill savings is achievedby our job power profile aware scheduling.
• Higher power profile ratio and electricity pricing ra-tion lead to greater electricity bill savings by using ourdesign.
• For typical workload at production systems, a schedul-ing window of 10-30 jobs is sufficient.
7. CASE STUDYIn this section, we present a case study of using our job
power aware scheduler on Mira. We collected the job tracefrom the machine in December 2012. During the month,the first half of the month were jobs for acceptance testing(hence most jobs are large jobs) and the second half wasused for early science applications from users (hence mostjobs are small sized such as single rack). There are totally3,333 jobs executed on the machine during the month. Asummary of these jobs is described in Figure 11. For eachjob, its power profile is extracted from the environmental log[28], and the distribution of job power profiles is presentedin Figure 1.
In this case study, we compare the Knapsack policy toFCFS. We apply two scheduling frequencies, i.e. 10-secondand 30-second. The scheduling window is set to 10-second.
Figure 12 presents the average utilization within a day.Here system utilization at each time point is calculated asthe average over the month. During the off-peak time, sys-tem utilization achieved by our scheduler is higher than thatachieved by FCFS. This is because during the off-peak time,our design attempts to allocate jobs with high power pro-files, as many as possible, by taking advantage of low elec-tricity pricing. During the on-peak time, FCFS achieves aslightly better system utilization over our design. This isbecause our design intends to schedule large jobs with lowpower profiles, leaving some idle nodes that are not sufficientfor other jobs. Nevertheless, despite some minor variationat any time instant, the daily system utilization is not im-pacted or degraded by using our design.
Figure 13 presents the average power consumption withina day. Here power consumption at each time point is cal-culated as the average over the month. During the off-peak
time, the amount of power consumed by our design is higherthan that consumed by FCFS. This phenomenon is moreobvious when we switch the scheduling frequency from 10seconds to 30 seconds. This is reasonable as our design aimsto increase power consumption by taking advantage of lowelectricity pricing during off-peak time. During the on-peaktime,while our design is supposed to decrease the overallpower consumption to avoid high electricity cost, the figuredoesn’t show such a pattern. As we mentioned earlier, thejob trace was collected in the month in which the secondhalf of the month was mainly used for early science test-ing (i.e., most jobs submitted are small sized such as singlerack). As presented in Figure 1, small sized jobs have simi-lar power profiles. Due to these unique characteristics of thejob trace (i.e., the same sized jobs with similar power pro-files), our design ends up with the same scheduling sequenceas FCFS, hence giving the similar power consumption dur-ing the on-peak time. We believe our design is capable ofproviding more electricity bill saving when the machine isused in production.
The monthly electricity bill saving obtained by our designversus FCFS is 5.4% and 9.98% respectively by using 10-second scheduling frequency and 30-second frequency. Thisis substantial, given that approximately $1M annual elec-tricity bill to power up this machine at Argonne.
8. CONCLUSIONSIn this paper, we have proposed an novel job power aware
scheduling design, with the objective to reduce the electric-ity bill of HPC systems. Our design is based on the facts thatHPC jobs have different individual power profiles and thatelectricity prices vary throughout a day. By scheduling jobswith high power profiles during low electricity pricing periodand jobs with low power profiles during high electricity pric-ing period, our scheduler is capable of cutting the electricitybill of HPC systems by up to 23% without impacting systemutilization, which is critical to HPC systems.
To our knowledge, this is the first electricity bill study oflarge-scale HPC systems using real job traces and job powerprofiles from production systems. Our key findings and con-tributions are: (1) a job power aware scheduling mechanismand two scheduling policies designed to cut the electricitybill of HPC systems; (2) a scheduling policy with real po-tential to substantially reduce the electricity bill for HPCsystems by exploring distinct job power profiles and vary-ing daily electricity prices; and (3) a trace-based schedulingsimulator named CQSim for evaluating various schedulingpolicies at scale, which is available online.
Some avenues for future work include more experimentswith real job traces and job power profiles from various HPCsystems as well as integrating our design with the work onenvironmental data analysis tool as [28] for automaticallyobtaining job power profiles.
9. ACKNOWLEDGMENTSWe appreciate the valuable comments and suggestions
from the anonymous reviewers. We would like to thank ourpaper shepherd, Dr.Taisuke Boku, for his time and guid-ance. This work at Illinois Institute of Technology was sup-ported in part by US National Science Foundation grantsCNS-0834514 and OCI-0904670. The work at Argonne issupported by the Office of Science of the U.S. Department
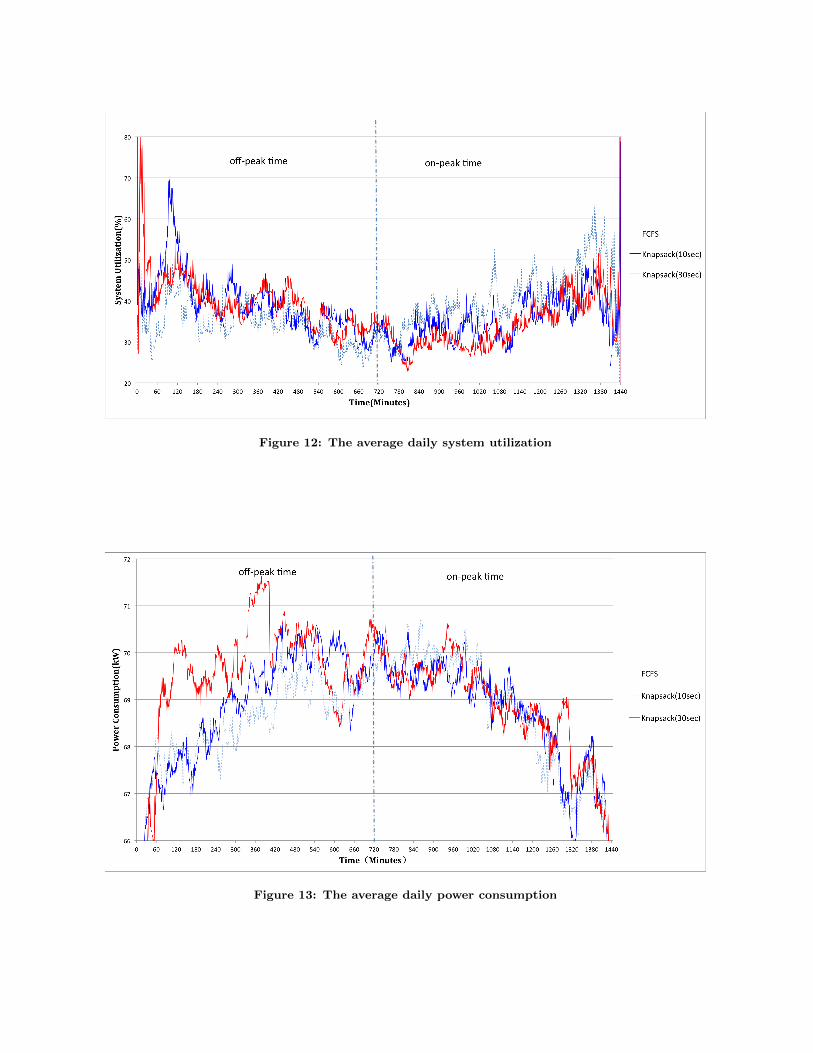
Figure 12: The average daily system utilization
Figure 13: The average daily power consumption

of Energy under contract DEAC02-06CH11357.
10. REFERENCES[1] Cqsim: An event-driven simultor.
http://bluesky.cs.iit.edu/cqsim
[2] IBM redbooks publication, IBM system Blue Genesolution: Blue Gene/Q system administration.
[3] Parallel Workload Archive.http://www.cs.huji.ac.il/labs/parallel/workload
[4] Managing System Software for Cray XE and Cray XTSystems. Cray Document. 2012.
[5] L. Barroso and U. Holzle. The case forenergy-proportional computing. Computer,40(12):33–37, 2007.
[6] J. Brandt, A. Gentile, D. J. Hale, and P. Pebay. OVIS:a tool for intelligent, real-time monitoring ofcomputational clusters. In International Symposiumon Parallel and Distributed Processing, 2006.
[7] Z. Cao, L. T. Watson, K. W. Cameron, and R. Ge. Apower aware study for VTDIRECT95 using DVFS. InProceedings of the Spring Simulation Multiconference,SpringSim ’09. Society for Computer SimulationInternational, 2009.
[8] T. H. Cormen, C. Stein, R. L. Rivest, and C. E.Leiserson. Introduction to Algorithms. McGraw-HillHigher Education, 2001.
[9] M. Etinski, J. Corbalan, J. Labarta, and M. Valero.Parallel job scheduling for power constrained HPCsystems. Parallel Comput., 38(12):615–630, 2012.
[10] X. Fan, W.-D. Weber, and L. A. Barroso. Powerprovisioning for a warehouse-sized computer. In 34thACM Annual International Symposium on ComputerArchitecture, 2007.
[11] D. Feitelson and A. Weil. Utilization andpredictability in scheduling the IBM SP2 withbackfilling. In International Parallel and DistributedProcessing Symposium, 1998.
[12] C. Garciia-Martos, J. Rodriiguez, and M. Sanchez.Forecasting electricity prices by extracting dynamiccommon factors: application to the Iberian market.Generation, Transmission Distribution, IET,6(1):11–20, 2012.
[13] M. Hennecke, W. Frings, W. Homberg, A. Zitz,M. Knobloch, and H. Bottiger. Measuring powerconsumption on IBM Blue Gene/P. Computer Science- Research and Development, 27:329–336, 2012.
[14] J. Hikita, A. Hirano, and H. Nakashima. Saving 200kwand $200 k/year by power-aware job/machinescheduling. In IEEE International Symposium onParallel and Distributed Processing, 2008.
[15] I. Koichiro, I. Takanori, and T. Makoto. Usingdynamic electricity pricing to address energy crisesevidence from randomized field experiments. 2013.http://www.stanford.edu/ itok/ItoIda-Tanaka-Dynamic-Pricing.pdf.
[16] E. Lee, I. Kulkarni, D. Pompili, and M. Parashar.Proactive thermal management in green datacenters.The Journal of Supercomputing, 60:165–195, 2012.
[17] C. Lefurgy, X. Wang, and M. Ware. Power capping: aprelude to power shifting. Cluster Computing,11(2):183–195, June 2008.
[18] P. Li. Variational analysis of large power grids byexploring statistical sampling sharing and spatiallocality. In IEEE/ACM International Conference onComputer-Aided Design, 2005.
[19] Y. Liu and H. Zhu. A survey of the research on powermanagement techniques for high-performance systems.Softw. Pract. Exper., 40(11):943–964, 2010.
[20] J. Lundgren, J. Hellstrom, and N. Rudholm.Multinational electricity market integration andelectricity price dynamics. In 5th InternationalConference on European Electricity Market, 2008.
[21] C. Patel, R. Sharma, C. Bash, and S. Graupner.Energy aware grid: Global workload placement basedon energy efficiency. In HPL Technical Report,November 2002.
[22] E. Pinheiro, R. Bianchini, E. V. Carrera, andT. Heath. Load balancing and unbalancing for powerand performance in cluster-based systems, 2001.
[23] A. Qureshi, R. Weber, H. Balakrishnan, J. Guttag,and B. Maggs. Cutting the electric bill forinternet-scale systems. SIGCOMM Comput. Commun.Rev., 39(4):123–134, Aug. 2009.
[24] W. Tang, N. Desai, D. Buettner, and Z. Lan.Analyzing and adjusting user runtime estimates toimprove job scheduling on the Blue Gene/P. In 2010IEEE International Symposium on Parallel DistributedProcessing, 2010.
[25] W. Tang, N. Desai, D. Buteener, and Z. Lan. Jobscheduling with adjusted runtime estimates onproduction supercomputers. Journal of Parallel andDistributed Computing (JPDC), 73(7):926–938, 2013.
[26] W. Tang, Z. Lan, N. Desai, D. Buettner, and Y. Yu.Reducing fragmentation on torus-connectedsupercomputers. In 2011 IEEE InternationalSymposium on Parallel Distributed ProcessingSymposium, 2011.
[27] D. Tsafrir, K. Ouaknine, and D. Feitelson. Reducingperformance evaluation sensitivity and variability byinput shaking. In 15th International Symposium onModeling, Analysis, and Simulation of Computer andTelecommunication Systems, 2007.
[28] S. Wallace, V. Vishwanath, S. Coghlan, Z. Lan, andM. Papka. Measuring power consumption on IBMBlue Gene/Q. In The Ninth Workshop onHigh-Performance, Power-Aware Computing, 2013.
[29] Z. Zheng, L. Yu, W. Tang, Z. Lan, R. Gupta,N. Desai, S. Coghlan, and D. Buettner. Co-analysis ofRAS log and job log on Blue Gene/P. In 2011 IEEEInternational Symposium on Parallel DistributedProcessing Symposium, pages 840–851, 2011.
[30] Z. Zhou, Z. Lan, W. Tang, and N. Desai. Reducingenergy costs for IBM Blue Gene/P via Power-Awarejob scheduling. In 17th Workshop on Job SchedulingStrategies for Parallel Processing, 2013.