integrating hydro-meteorological and physiographic factors for assessment of vulnerability to...
TRANSCRIPT
Water Resour Manage (2010) 24:4199–4217DOI 10.1007/s11269-010-9653-5
Integrating Hydro-Meteorological and PhysiographicFactors for Assessment of Vulnerability to Drought
Rajendra Prasad Pandey · Ashish Pandey · Ravi V. Galkate ·Hi-Ryong Byun · Bimal C. Mal
Received: 3 October 2009 / Accepted: 14 April 2010 /Published online: 6 May 2010© Springer Science+Business Media B.V. 2010
Abstract This study has been carried out for Sonar basin of Ken River system in theMadhya Pradesh. The study was aimed at devising a suitable method for assessmentof vulnerability to drought. Analysis of annual and seasonal rainfall records for theperiod from 1901–2007 revealed that the study basin had faced drought conditionwith an average frequency of once in every 5 years. The maximum rainfall deficiencyrecorded in the basin was of the order of −68% in 1979. Recently, drought conditionsprevailed in the study basin in the years 2006 and 2007 with annual rainfall deficiencyof −35% and −43%, and Standardized Precipitation Index (SPI) values as −1.14and −1.24 respectively. The paper presents a method for spatially representativedepiction of vulnerability to drought using multiple indicators in Sonar basin. Theseindicators include topography characteristics, land-use types, soil types, relativeavailability of surface water and groundwater, water demand and utilization and therainfall departures from corresponding mean values. Spatial information of aboveindicators was categorized in to various sub classes and maps were prepared inspatial domain using Geographic Information system (GIS). Different layers ofabove independent indicators and rainfall deficiency have been integrated using a
R. P. Pandey (B)National Institute of Hydrology, Roorkee, 247 667 Uttaranchal, Indiae-mail: [email protected]
A. PandeyIndian Institute of Technology Roorkee, Roorkee, 247 667 Uttaranchal, India
R. V. GalkateNational Institute of Hydrology, Regional Centre, Sagar, 470 001 M.P., India
H.-R. ByunDept. of Environmental Atmospheric Sciences, Pukyong National University, Daeyeon-3dong,Namku, 608 737 Busan, Korea
B. C. MalIndian Institute of Technology Kharagpur, Kharagpur, 721 302 West Bengal, India

4200 R.P. Pandey et al.
weighing scheme. Thus, the integrated values of weights of various indicators havebeen computed on 100 × 100 m grid scale in spatial domain and maps have beenprepared to represent integrated vulnerability to drought. For rationalization of theapproach drought vulnerability Index (DVI) for each grid has been calculated. TheDVI has been defined as the ratio of sum of the weights of factors to the sum of theirmaximum weight values. The results have been validated with intensive field surveys.The proposed method represented drought vulnerability scenarios in the Sonar basinappropriately. It is hoped that this method may set a better direction for the studieson drought monitoring and mitigation.
Keywords Drought vulnerability · Geographic information system ·Water availability · Rainfall deficit · Water utilization
1 Introduction
Droughts affect more people than any other natural hazards on the earth (Wilhiteand Vanyarkho 2000). It is a normal feature of climate and its recurrence isinevitable. Rainfall is the primary indicator of drought and is the basis for mostdrought watch systems. The occurrences of droughts are generally linked to deficitprecipitation, low soil moisture, deficit river flows or groundwater as compared totheir corresponding normal values. Drought is defined as the deficiency of availablewater that injuriously affects the usual crops, causes temporary scarcity of waterfor human/livestock consumption and influences the economic renewable resources.Over the years, various indices have been proposed to identify onset, characterizeand quantify the attributes of meteorological, hydrological and agricultural droughtsby various researchers like Palmer (1965), Rossi et al. (1992), McKee et al. (1993),Byun and Wilhite (1999), Tsakiris et al. (2007), Pandey et al (2008a, b), Nalbantisand Tsakiris (2009), and many others. Drought is one of the significant aspects whichare responsible for socio-economic imbalance in several parts of the India on cyclicbasis (every 3 to 7 years; Pandey and Ramasastri 2001). It has greater impacts on theIndian economy. For example, crop loss during 1987–1988 droughts (36 million tonsof food production loss) had caused GNP decline by 7% (NIH 2002).
Vulnerability refers to the degree of susceptibility to a hazard either as the resultof varying exposure to the hazard or because of variation in the ability to cope withits impact. Area that have high exposure and low coping capabilities would havethe highest risk from a given drought event and those with low exposure and highcoping abilities would have the lowest risk. It is now being realized that a methodicalplanning is essential including followings options to cope with drought: (1) integratedinformation for strategic planning and management control and (2) reactive toproactive strategies for coping with drought.
Social vulnerability to drought is complex and it is reflected by society’s capacityto anticipate, cope with and respond (Tsakiris and Pangalou 2009; Iglesias et al.2009b). Keeping in view the experiences and emerging lessons in development andimplementation of drought management plans, Iglesias et al. (2009a) emphasized toadopt risk-based approaches for different levels of vulnerability to meet the chal-lenges of coping with impacts of drought and water shortages. Also, Iglesias et al.(2009b) proposed methods for evaluating social vulnerability to drought using the
Integrated Assessment of Vulnerability to Drought 4201
natural resource structure, the economic capacity, the human and civic resources, andaspects of agricultural innovation etc. They weighted above factors appropriately andcomputed final value of the vulnerability index. The severe drought events recentlyoccurred all over the world have increased awareness of the harmful impacts theycause. Since drought, unlike other natural disasters, evolves in a long period of time,an effective reduction of related impacts is possible by implementing appropriatemitigation measures planned in advance (Rossi et al. 2007).
Vulnerability changes over time, incorporating social responses as well as newround of hazardous events. Vulnerability constantly changes because of changesin technology, population behavior, practices, and policies. Thus, vulnerability hasdimensions of time and space (Downing and Bakker 2000; Wilhite 2000). Risk todrought at a given place is function of hazard and vulnerability. Where hazard refersto climatology and the vulnerability includes physiographic, social, environmentaland other factors like coping ability, awareness and regional economic activities(Alcomo et al. 2008; Hamouda et al. 2009). Drought vulnerability is different fordifferent individuals, regions and nations. Concepts of hazard and risk have beenused in a wide spectrum of disciplines including natural hazards. Tsakiris (2007)devised a comprehensive methodology for calculating hazard and risk of a naturalcause including particular reference to water-related hazards. For the purpose ofproactive planning the concept of average (annualized) risk has been proposed asa key factor for the prioritization of appropriate reclamation measures. Rossi et al.(2007) discussed the importance of legislation for a correct drought management,based on a proactive approach, namely including both long-term actions orientedto reduce vulnerability of water supply systems and short-term actions to be imple-mented during droughts. They suggested a framework for a timely implementationof drought mitigation measures and the adoption of an effective monitoring systemfor the evaluation of drought risk using multi-criteria analysis.
In developing countries, drought vulnerability constitutes a threat to livelihoods,the ability to maintain productive systems, and healthy economics. In developedeconomies, drought poses significant economic risks and cost for individuals, publicenterprises, commercial organizations and governments. The concept of this studyis based on a new approach to assess spatial vulnerability to drought using multiplefactors which includes physiographic, social and climatic factors. A similar approachwas used by Wilhelmi and Wilhite (2002) for integrated assessment of vulnerabilityto agricultural drought in Nabraska USA.
This study was taken up in the Sonar basin, in Madhya Pradesh. Purpose of thisstudy was to evolve a methodology for integrated assessment of vulnerability todrought in time and space domain using Geographic information system (GIS). It isunderstood that geographical location, physical characteristics of watershed, surfaceand ground water availability, variability of rainfall, regional climatic factors, andsocio-economic factors have been responsible for water deficits and crop loss fromtime to time in the Sonar basin (Pandey et al. 2008a, b; NIH 2002). The specificobjectives of the study were: (1) to study regional drought characteristics in studybasin, and (2) to device a technique for assessment of vulnerability to drought, usingmultiple factors. In this study annual and seasonal rainfall values from three rain-gauge stations in Sonar basin have been analyzed. This includes long-term rainfallof Sagar, Damoh and Hatta stations varying from 85 to 107 years. During this studyin the year 2006 and 2007, comprehensive field investigations were carried out in
4202 R.P. Pandey et al.
the sonar basin to monitor the onset and progression of drought, and quantificationmagnitude of drought severity. It is hoped that the a factual method for assessmentof vulnerability to drought, which assimilate multiple factors in spatial and temporaldomain using GIS, can be helpful to the decision makers in visualizing the hazardand to disseminate the concept of vulnerability to stakeholders, natural resourcemanagers, agricultural producers and others.
2 Description of the Study Area
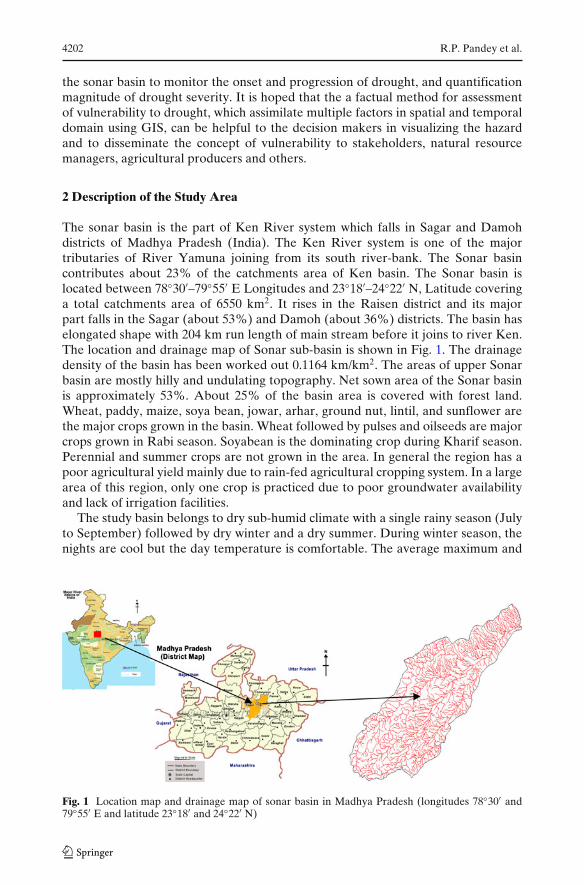
The sonar basin is the part of Ken River system which falls in Sagar and Damohdistricts of Madhya Pradesh (India). The Ken River system is one of the majortributaries of River Yamuna joining from its south river-bank. The Sonar basincontributes about 23% of the catchments area of Ken basin. The Sonar basin islocated between 78◦30′–79◦55′ E Longitudes and 23◦18′–24◦22′ N, Latitude coveringa total catchments area of 6550 km2. It rises in the Raisen district and its majorpart falls in the Sagar (about 53%) and Damoh (about 36%) districts. The basin haselongated shape with 204 km run length of main stream before it joins to river Ken.The location and drainage map of Sonar sub-basin is shown in Fig. 1. The drainagedensity of the basin has been worked out 0.1164 km/km2. The areas of upper Sonarbasin are mostly hilly and undulating topography. Net sown area of the Sonar basinis approximately 53%. About 25% of the basin area is covered with forest land.Wheat, paddy, maize, soya bean, jowar, arhar, ground nut, lintil, and sunflower arethe major crops grown in the basin. Wheat followed by pulses and oilseeds are majorcrops grown in Rabi season. Soyabean is the dominating crop during Kharif season.Perennial and summer crops are not grown in the area. In general the region has apoor agricultural yield mainly due to rain-fed agricultural cropping system. In a largearea of this region, only one crop is practiced due to poor groundwater availabilityand lack of irrigation facilities.
The study basin belongs to dry sub-humid climate with a single rainy season (Julyto September) followed by dry winter and a dry summer. During winter season, thenights are cool but the day temperature is comfortable. The average maximum and
Fig. 1 Location map and drainage map of sonar basin in Madhya Pradesh (longitudes 78◦30′ and79◦55′ E and latitude 23◦18′ and 24◦22′ N)

Integrated Assessment of Vulnerability to Drought 4203
minimum temperature varies from 40.7◦C in May and 11.6◦C in January respectively.Rainfall occurs mostly in monsoon months (June to October) with very few wintershowers in the region. Mean annual rainfall in the sub-basin is between 1,019 and1,224 mm with a maximum and minimum rainfall recorded at Hatta as 4603 mm in2005 and 330 mm in 1979, respectively. The rainfall over the basins is highly variableand unevenly distributed.
The basin encompasses diverse range of soils dominated by medium clay. Soilsfound on hill and hill ridges are fine loamy to coarse loamy in texture and grayishbrown to dark reddish brown in color. They are of shallow depth with low nutrientstatus, highly erodible, excessively drained, stony and gravelly in nature with loworganic matter content and have poor water retentive capacity. Plateau soils areyellowish brown to dark brown soils and are found in plane to gently undulatingterrain of the Sagar and Damoh districts. Soils of level alluvial plain and undulatingflood plain are covered with deep to very deep, fine to fine loamy soils.
3 Analysis of Historical Rainfall Data
1. Annual and seasonal rainfall departure
India Meteorological Department (IMD) defines an area/region to be droughtaffected if it receives seasonal total rainfall less than 75% of its normal value (AppaRao 1986). A simple approach to delineate good or bad monsoon year has beensuggested by Banerjee and Raman (1976). A year is considered as a bad monsoonyear if seasonal rainfall is deficient in more than two-third number of meteorologicalstations. For the present study, a year and a monsoon season (June to October) areconsidered as drought year and drought season, respectively, if the total amount ofannual rainfall over an area is deficient by more than 25%. A month is consideredas a drought month if the total amount of rainfall over an area is deficient by 50%of the mean rainfall of the corresponding month (Appa Rao 1986). The mean annualrainfall at a given rain-gauge station was obtained as the arithmetic average ofannual rainfall values over the period of records used in analysis. The annual rainfalldepartures were computed as the deviation of the rainfall from the mean divided bythe mean rainfall for the station. The year having annual/seasonal rainfall deficiencymore than or equal to 25% is considered as a drought year/season.
Long term monthly rainfall records for the period from 1901–2000 were obtainedfrom India meteorological, Pune, India. Rainfall records from 2001–2007 were col-lected from offices of District Magistrates at Sagar and Damoh. Annual and seasonal
Table 1 Summary of annual and seasonal rainfall departures analysis
Sl no. Name of No. of Missing record No. of Average Maximum Maximumstation years of drought drought recorded recorded
annual years return annual seasonalrainfall period deficit, deficit,records (year) % %
1 Hatta 107 18 (1970–1975), 21 4 −52 (1979) −69 (1979)(1988–1999)
2 Damoh 107 2 (1998–1999) 22 5 −55 (1979) −65 (1979)3 Sagar 107 Nil 17 6 −59 (1979) −61 (1981)
4204 R.P. Pandey et al.
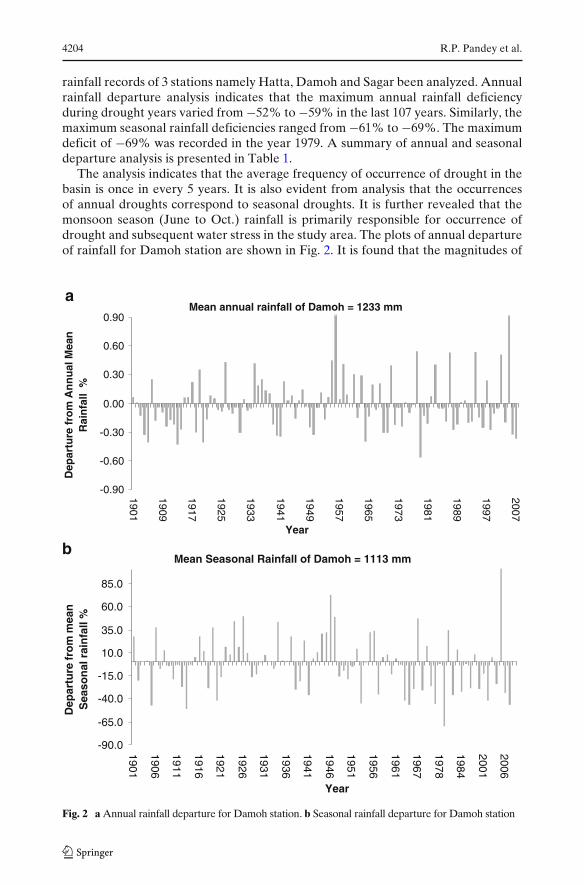
rainfall records of 3 stations namely Hatta, Damoh and Sagar been analyzed. Annualrainfall departure analysis indicates that the maximum annual rainfall deficiencyduring drought years varied from −52% to −59% in the last 107 years. Similarly, themaximum seasonal rainfall deficiencies ranged from −61% to −69%. The maximumdeficit of −69% was recorded in the year 1979. A summary of annual and seasonaldeparture analysis is presented in Table 1.
The analysis indicates that the average frequency of occurrence of drought in thebasin is once in every 5 years. It is also evident from analysis that the occurrencesof annual droughts correspond to seasonal droughts. It is further revealed that themonsoon season (June to Oct.) rainfall is primarily responsible for occurrence ofdrought and subsequent water stress in the study area. The plots of annual departureof rainfall for Damoh station are shown in Fig. 2. It is found that the magnitudes of
Mean annual rainfall of Damoh = 1233 mm
-0.90
-0.60
-0.30
0.00
0.30
0.60
0.90
1901
1909
1917
1925
1933
1941
1949
1957
1965
1973
1981
1989
1997
2007
Year
Dep
artu
re f
rom
An
nu
al M
ean
R
ain
fall
%
a
bMean Seasonal Rainfall of Damoh = 1113 mm
-90.0
-65.0
-40.0
-15.0
10.0
35.0
60.0
85.0
1901
1906
1911
1916
1921
1926
1931
1936
1941
1946
1951
1956
1961
1967
1978
1984
2001
2006
Year
Dep
artu
re fr
om
mea
n
Sea
son
al r
ain
fall
%
Fig. 2 a Annual rainfall departure for Damoh station. b Seasonal rainfall departure for Damoh station
Integrated Assessment of Vulnerability to Drought 4205
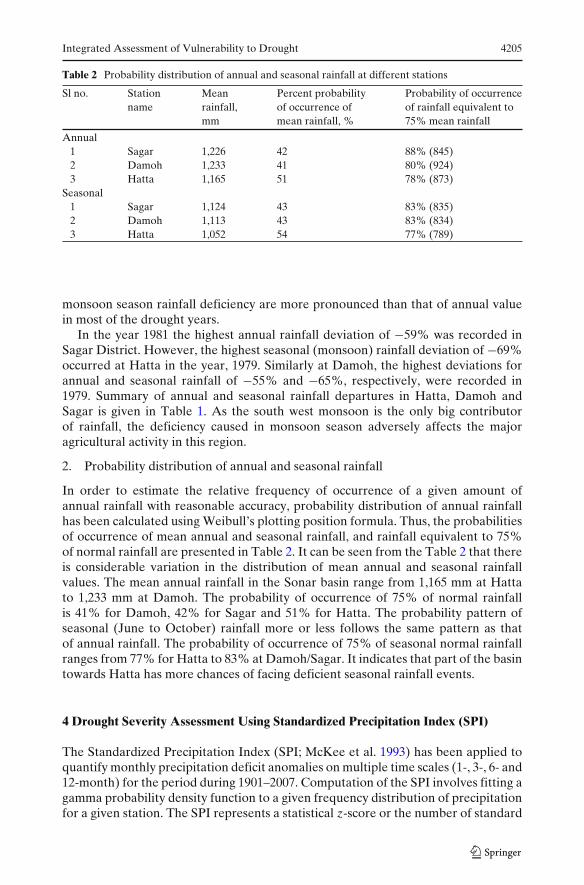
Table 2 Probability distribution of annual and seasonal rainfall at different stations
Sl no. Station Mean Percent probability Probability of occurrencename rainfall, of occurrence of of rainfall equivalent to
mm mean rainfall, % 75% mean rainfall
Annual1 Sagar 1,226 42 88% (845)2 Damoh 1,233 41 80% (924)3 Hatta 1,165 51 78% (873)
Seasonal1 Sagar 1,124 43 83% (835)2 Damoh 1,113 43 83% (834)3 Hatta 1,052 54 77% (789)
monsoon season rainfall deficiency are more pronounced than that of annual valuein most of the drought years.
In the year 1981 the highest annual rainfall deviation of −59% was recorded inSagar District. However, the highest seasonal (monsoon) rainfall deviation of −69%occurred at Hatta in the year, 1979. Similarly at Damoh, the highest deviations forannual and seasonal rainfall of −55% and −65%, respectively, were recorded in1979. Summary of annual and seasonal rainfall departures in Hatta, Damoh andSagar is given in Table 1. As the south west monsoon is the only big contributorof rainfall, the deficiency caused in monsoon season adversely affects the majoragricultural activity in this region.
2. Probability distribution of annual and seasonal rainfall
In order to estimate the relative frequency of occurrence of a given amount ofannual rainfall with reasonable accuracy, probability distribution of annual rainfallhas been calculated using Weibull’s plotting position formula. Thus, the probabilitiesof occurrence of mean annual and seasonal rainfall, and rainfall equivalent to 75%of normal rainfall are presented in Table 2. It can be seen from the Table 2 that thereis considerable variation in the distribution of mean annual and seasonal rainfallvalues. The mean annual rainfall in the Sonar basin range from 1,165 mm at Hattato 1,233 mm at Damoh. The probability of occurrence of 75% of normal rainfallis 41% for Damoh, 42% for Sagar and 51% for Hatta. The probability pattern ofseasonal (June to October) rainfall more or less follows the same pattern as thatof annual rainfall. The probability of occurrence of 75% of seasonal normal rainfallranges from 77% for Hatta to 83% at Damoh/Sagar. It indicates that part of the basintowards Hatta has more chances of facing deficient seasonal rainfall events.
4 Drought Severity Assessment Using Standardized Precipitation Index (SPI)
The Standardized Precipitation Index (SPI; McKee et al. 1993) has been applied toquantify monthly precipitation deficit anomalies on multiple time scales (1-, 3-, 6- and12-month) for the period during 1901–2007. Computation of the SPI involves fitting agamma probability density function to a given frequency distribution of precipitationfor a given station. The SPI represents a statistical z-score or the number of standard

4206 R.P. Pandey et al.
deviation (following a gamma probability distribution transformation to a normaldistribution). Above or below that an event is demarcated with reference to mean(Edward and Mckee 1997).
A plot of SPI for 3-month time scale is shown in Fig. 3a and b. The values of SPIbetween 1 > Z > −1 shows the near normal precipitation event. Further the z-score−1 or less indicates the drought events. When the value of z-score goes lower than−1.5, it is the indication of severe drought condition. The estimated values of SPI(z-score) for one month time scale revealed that the extreme dry events with z-scoreless than −2 are mostly experienced in the months of July, August, and September.The precipitation anomalies at various stations in Sonar basin were identified andpresented in the form of histograms. Typical histograms of precipitation anomaliesderived for Sagar station using SPI for 1-month time scale is presented in Fig. 4. Theplots of histogram indicated that the month of September experienced maximumnumber of anomalies followed by the months of June, July and August.
SPI for 3-months time scale (1901-1953)
-3
-2
-1
0
1
2
3
1901190219041906190819101912191419161918192019221924192519271929193119331935193719391941194319451947194819501952
Time
SP
I
SPI for 3-months time scale (1954- 2007)
-3-2-101234
19541955195719591961196319651967196919711973197519771978198019821984198619881990199219941996199820002001200320052007
Time
SP
I
b
a
Fig. 3 a Time series of SPI for 3-month time scale for Sagar station (1901–1953). b Time series ofSPI for 3-month time scale for Sagar station (1954–2007)

Integrated Assessment of Vulnerability to Drought 4207
Fig. 4 Histogram of rainfallanomalies for 1-month timescale of SPI (drought)for Hatta
0
5
10
15
20
JAN
FE
B
MA
R
AP
R
MA
Y
JUN
E
JUL
Y
AU
G
SE
P
OC
T
NO
V
DE
C
Month
No
. of D
rou
gh
t Eve
nts
5 Assessment of Vulnerability to Drought
Drought is often considered as climatic phenomena. It is driven by the precipi-tation deficiency in space and time. The impact of drought on agriculture, wateravailability and regional social and economical activities depend on various physio-graphic, environmental, and social factors. Drought vulnerability thus depend uponon multiple factors such as topographic features, soil, land used, water resourcesdevelopment (irrigation supports), in-situ water conservation, utilizations of groundwater, and regional water demand for domestic, industrial and agriculture activities.The concept for derivation of drought vulnerability map was originally describedin the ‘DRASTIC’ methodology for groundwater pollution assessment (Aller et al.1987), Eastman et al. (1997) for food security mapping, and Thiruvengadachariand Gopalkrishna (1993) for drought mapping. Wilhelmi and Wilhite (2002) andWilhelmi et al. (2002) described drought vulnerability for the state of Nebraska inU.S.A. using biophysical and social factors in spatial domain. Iglesias et al. (2009b)presented presented guidelines to develop drought management plans using risk-based approach to mitigate drought the impact at different vulnerabilities.
To produce an integrated drought vulnerability map for Sonar basin, variouslayers representing spatial maps of different factors were prepared using Arc-GISsoftware. Spatial maps representing watershed geography, surface water availability,ground water availability, soil type, land use, and demand per unit area were pre-pared on a grid system of 100 × 100 m. Spatial information on the above maps wascategorized in different classes in respect of their degree of significance in vulnerabil-ity to drought (Table 3). The rainfall deficiency in spatial and temporal domain wasprepared as separate layers on similar grid system.
6 Spatial Representation of Physiographic Factors
Topographic Feature of the Basin Watershed geography has been categorized in tothree sub-classes viz. upper reach watershed areas, middle reach watershed areas andlower reach watershed areas. The upper, middle and lower reach watershed areashave been delineated considering topographic features (i.e. average slopes), streamorders and streamflow characteristics. The upper reach watershed areas refer to hilly
4208 R.P. Pandey et al.
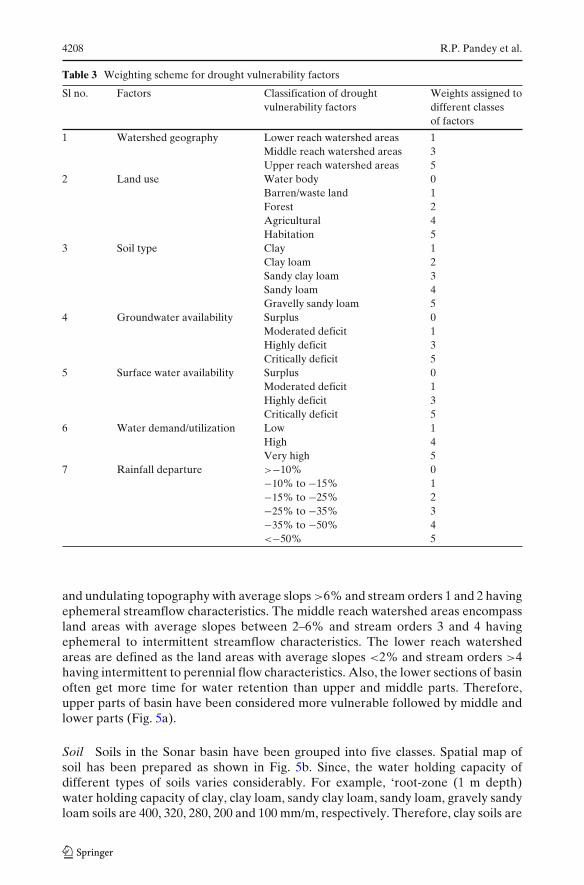
Table 3 Weighting scheme for drought vulnerability factors
Sl no. Factors Classification of drought Weights assigned tovulnerability factors different classes
of factors
1 Watershed geography Lower reach watershed areas 1Middle reach watershed areas 3Upper reach watershed areas 5
2 Land use Water body 0Barren/waste land 1Forest 2Agricultural 4Habitation 5
3 Soil type Clay 1Clay loam 2Sandy clay loam 3Sandy loam 4Gravelly sandy loam 5
4 Groundwater availability Surplus 0Moderated deficit 1Highly deficit 3Critically deficit 5
5 Surface water availability Surplus 0Moderated deficit 1Highly deficit 3Critically deficit 5
6 Water demand/utilization Low 1High 4Very high 5
7 Rainfall departure >−10% 0−10% to −15% 1−15% to −25% 2−25% to −35% 3−35% to −50% 4<−50% 5
and undulating topography with average slops >6% and stream orders 1 and 2 havingephemeral streamflow characteristics. The middle reach watershed areas encompassland areas with average slopes between 2–6% and stream orders 3 and 4 havingephemeral to intermittent streamflow characteristics. The lower reach watershedareas are defined as the land areas with average slopes <2% and stream orders >4having intermittent to perennial flow characteristics. Also, the lower sections of basinoften get more time for water retention than upper and middle parts. Therefore,upper parts of basin have been considered more vulnerable followed by middle andlower parts (Fig. 5a).
Soil Soils in the Sonar basin have been grouped into five classes. Spatial map ofsoil has been prepared as shown in Fig. 5b. Since, the water holding capacity ofdifferent types of soils varies considerably. For example, ‘root-zone (1 m depth)water holding capacity of clay, clay loam, sandy clay loam, sandy loam, gravely sandyloam soils are 400, 320, 280, 200 and 100 mm/m, respectively. Therefore, clay soils are
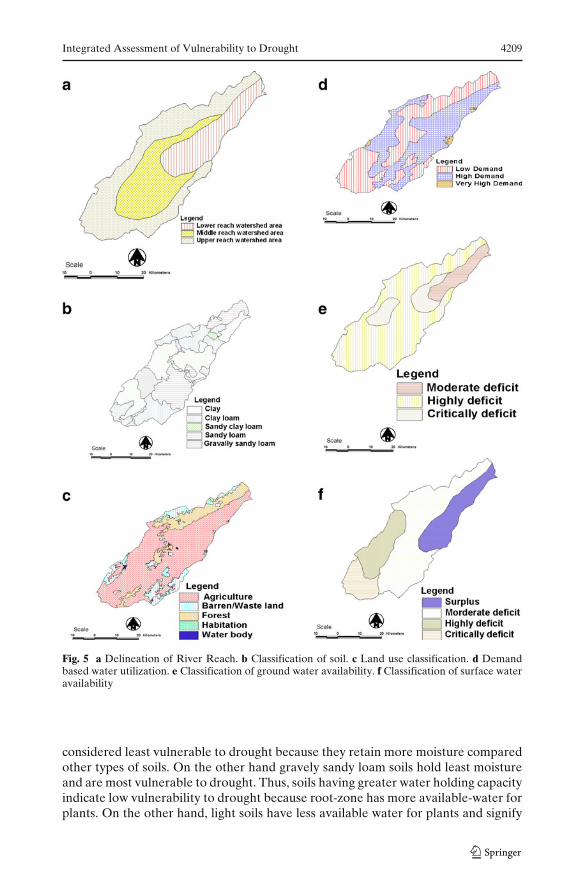
Integrated Assessment of Vulnerability to Drought 4209
Fig. 5 a Delineation of River Reach. b Classification of soil. c Land use classification. d Demandbased water utilization. e Classification of ground water availability. f Classification of surface wateravailability
considered least vulnerable to drought because they retain more moisture comparedother types of soils. On the other hand gravely sandy loam soils hold least moistureand are most vulnerable to drought. Thus, soils having greater water holding capacityindicate low vulnerability to drought because root-zone has more available-water forplants. On the other hand, light soils have less available water for plants and signify

4210 R.P. Pandey et al.
high vulnerability to drought. Accordingly, areas with lighter soils are consideredrelatively more vulnerable than clayey soil areas.
Land Use The land use is one of the important driving forces behind water demandand a significant factor for drought vulnerability. Land use in the basin is dominatedby rain-fed crop cultivation (about 70%) followed by forest (16%), warren or wastelands (13.5%) and other uses (0.5%). The input map Fig. 5c shows spatial distributionof land use classes in the basin. Different land uses show diverse range of sensitivityto water scarcity in spatial domain. For example, rain-fed agricultural is often thefirst sufferer of water scarcity and drought compared to forest and other vegetations.Thus, agricultural lands are considered next most vulnerable to habitation land areas.On the other hand, waste lands encompass rare economic activities, and therefore,least sensitive to water shortages. The habitation areas usually have greater waterdemand than any other land uses and therefore, these areas have been consideredhighly vulnerable.
Water Utilization The pattern of water utilization in some regions is also an alarm-ing concern of water scarcities in lean periods (non-rainy season). Pereira et al. (2009)presented comprehensive thoughts on important conceptual and ownership issuesthat can over-ride the physical and engineering aspects of coping with water scarcity.The expressed that the water has a very high value for support of life, but it is oftennot fully valued by the community of water users. In this study, areas with greaterwater utilization are considered to be more vulnerable than those with low waterutilization. For example, habitation areas and agriculture areas need continuouswater supply. Therefore, from water utilization point of view, cities, towns andbigger villages are considered to be critically vulnerable. Seasonal water utilizationby agriculture is substantial and therefore agricultural areas have been consideredhighly vulnerable. Area with least socio economics activities have been kept withlow water utilization category and hence are least vulnerable. Spatial distribution ofwater utilization in the study area is shown in Fig. 5d.
Ground Water Availability The state ground water department at Sagar andDamoh districts has demarcated in to four-zones of replenish-able groundwaterpotential. Accordingly, the study area has been categorized in to surplus, moderatedeficit, highly deficit and critically deficit groundwater zones. The map of spatialgroundwater availability is shown in Fig. 5e.
Surface Water Availability The zones where surface water is available as streamflow and in storage tank, round the year, are considered as area with sufficient/surplus water availability. The region having storage in local tanks exhaust beforethe arrival of summer season and also flows in stream and do not sustain beyond theOctober/November have been classified as low surface water availability zone. Theareas, where usual water availability in tanks shows intermittent behavior and flowsin river courses are also intermittent in nature, have been defined as moderatesurface water deficit zone. The spatial distribution of surface water availability inSonar basin is given in Fig. 5f.

Integrated Assessment of Vulnerability to Drought 4211
7 Weighing Scheme for Integration of Vulnerability Factors
The physiographic factors considered in this study are watershed geography, soiltype, land use, water demand/utilization per unit area, surface water availability,and ground water availability. Each of the above factors has been categorized in tovarious sub-classes to distinguish their degree of susceptibility to drought and waterscarcity. A numerical weighting scheme has been proposed to assess vulnerabilityto drought. Each sub-class of vulnerability factors has been assigned a relativenumeric weight (WV) between 1 to 5. The value of weight depends on the relevanceof attributes of a given sub-class in aggravation of relative water shortages andvulnerability to drought. The weight value of 1 (i.e. WV = 1) indicates that the sub-class of a given factor is least vulnerable to drought. On the other hand, a weightvalue of 5 (i.e. WV = 5) indicates that the sub-class is highly vulnerable to drought.For more clarity, it may be explained that more weight value is assigned to the classwhich is more vulnerable. For example, heavy (clay) soils have greater water holdingcapacity than sandy soils. Therefore, areas of sandy soils are more vulnerable thanthat of heavy soils areas. Hence, sandy soils were assigned more weight values thanheavy soils (Table 3). Similarly, weights have been assigned to various sub-classesof other factors. The details of weights assigned to various sub-classes of factors aregiven in Table 3.
In this study an uniform weighing scheme (i.e., 0–5) has been chosen for allthe seven factors. The choice of weights (Table 3) for each factor is based onthe assumption of relative influence of sub-categories of factors to overall droughtvulnerability. For instance, barren land, forest land, cropland and habitation wereassigned relative weights as 1, 2, 4 and 5 respectively. It is because the habitationareas (WV = 5) have greater concentration of population and socio-economicactivities and these areas are highly sensitive to impact of water shortages followed byagricultural areas (WV = 4). It shows that agricultural lands and habitation land usetypes may signify respectively high and very high degree of vulnerability to drought.However, barren/waste land (WV = 1) and forest land (WV = 2) were assigned lowerweight values because these areas will be relatively less sensitive to impact of watershortages than habitation areas and agricultural land uses. Since area under waterbodies does not have significance in the drought vulnerability assessment, therefore,‘zero’ weights have been assigned to the water bodies.
Irrigation support in a basin can be one of the key factors in the assessment ofvulnerability to drought. Since, there is no command area under canal irrigation inthis study area, hence the factor for irrigation support could not be considered in thepresent methodology.
Different layers of spatial maps of physiographic factors were prepared using‘Arc’ GIS software. The spatial information of different layers was distributed ina grid system of 100 × 100 m. All the GIS data layers are co-registered with theirrespective cell coordinates. The weight assigned to various sub classes of factors wereintegrated using a simple scheme of addition of weight in each grid. For example, if aparticular pixel/cell has a value of 3 on the surface water deficit map, 3 on the groundwater deficit map, 4 on the land use map, and 5 on the water demand map, thenthe composite value weight for that pixel becomes 3 + 4 + 3 + 5 = 15. The outputnumeric values of weight were obtained for physiographic factors in spatial domain(Sl. No. 1 to 6 in Table 3). Composite spatial map of six physiographic factors was

4212 R.P. Pandey et al.
Fig. 6 Composite map ofphysiographic factors
thus obtained and it is presented in Fig. 6. Estimates of areas under this compositerepresentation of physiographic factor indicating spatial assessment of vulnerabilityto drought are shown in Sl. No. 7 in Table 4. In Fig. 6, a geographic area showinggreater numeric value of sum of weights is relatively more vulnerable to droughtthan that of less value.
8 Spatial Representation of Precipitation Deficit
Precipitation over a given region varies with space and time. It is considered that thevulnerability to drought changes both in space and time. Therefore, in order to assessvulnerability to drought in spatial and temporal domain, the variability of seasonalrainfall (percent rainfall departure w.r.t mean value) was included as a factor varyingwith time also. In this study, percentage seasonal rainfall departure (June to October2007) has been considered to assess the vulnerability of drought at the end of October2007. Accordingly, seasonal rainfall (June to October) departure map was preparedusing Thisen polygon method (Fig. 7). Depending on the magnitude of percentagedeparture of seasonal rainfall at three stations, namely, Sagar, Damoh and Hatta,the values of weight between 0 to 5 were assigned as shown in Sl. No.7 in Table 3.Seasonal rainfall deficiency up to 10% (i.e., seasonal rainfall departure >−10%) hasbeen considered insignificant.
9 Integrated Appraisal of Vulnerability to Drought
To obtain integrated assessment of vulnerability to drought both in spatial andtemporal dimension, the composite map of physiographic factors (Fig. 6) has beencombined with seasonal rainfall departure map (Fig. 7) using ‘Arc’ GIS software.The resulting map (Fig. 8) is, thus, showing integrated vulnerability to drought at the

Integrated Assessment of Vulnerability to Drought 4213
Table 4 Estimates of area under various classes of physiographic factors
Sl no. Type of classification Classification Area under different Areaand reference figure of factors classes, km2 in %
1 Delineation of watershed Lower reach 1,522.09 23.24reach sections as in Fig. 5a Middle reach 1,858.42 28.37
Upper reach 3,169.49 48.392 Distribution of soils as in Fig. 5b Clay 2,422.25 36.98
Clay loam 1,612.77 24.62Sandy clay loam 49.08 0.75Sandy loam 2,013.08 30.73Gravelly sandy loam 452.82 6.92
3 Distribution of land use as Water bodies 8.20 0.12in Fig. 5c Barren/waste land 897.34 13.48
Forest 1,068.92 16.06Agricultural land 4,659.24 70.07Habitation 16.08 0.24
4 Delineation of water utilization Low demand 3,202.59 48.89per unit area as in Fig. 5d High demand 3,285.74 50.16
Very high 61.67 0.955 Distribution of groundwater Surplus 0 0
availability as in Fig. 5e Moderate deficit 721.82 11.02Highly deficit 850.68 12.99Critically deficit 4,977.50 75.99
6 Distribution of surface water Surplus 1,394.14 20.95availability as in Fig. 5f Moderate deficit 3,417.85 51.37
Highly deficit 1,138.90 17.14Critically deficit 701.66 10.54
7 Composite representation Least 512.290 7.70of vulnerability based Moderate 1,986.840 29.87on physiographic factors Severe 3,822.180 57.45only as in Fig. 6 Critical 331.290 4.98
end of October 2007. Thus, an integrated assessment of vulnerability to drought wasobtained which has both spatial and temporal dimension. For rational application ofthe proposed methodology, the absolute values of sum of weights of vulnerabilityfactors have been transformed in to a new drought vulnerability index (DVI). TheDVI is defined as the ratio of sum of weights of the vulnerability factors (indicators)to the sum of upper limit of vulnerability weights. Where, sum of upper limit of vul-nerability weights is nothing but the multiplication of upper value of weights andnumber of vulnerability indicators. For quantitative assessment of vulnerability theDVI may be described in mathematical term as follows:
DVI =∑
wi
kN
where,
DVI Drought Vulnerability Index;N Number of indicators under consideration;Wi Weights of drought vulnerability indicators (where, i = 1, 2, . . .N);k upper limit of vulnerability weights (say, range = 0 − k, where k is highest
value of Wi).

4214 R.P. Pandey et al.
Fig. 7 Classification of rainfalldeparture (October 2007)
Thus, an integrated map was obtained and presenting integrated vulnerability todrought at the end of October 2007 (Fig. 7). Table 3 two shows estimates of areaunder various vulnerability classes. The proposed index is validated using physicalsurveys conducted at study site. The output map (Fig. 8) was reclassified into fourclasses: identifying geographic areas as ‘least vulnerable’, ‘moderate vulnerable’,‘severe vulnerable’, and ‘critically vulnerable’. The limiting values of these classes
Fig. 8 Output map ofintegrated vulnerabilityto drought

Integrated Assessment of Vulnerability to Drought 4215
Table 5 Estimates of area under various vulnerability classes at the end of Oct. 2007
Sl no. Vulnerability class Values of DVI Area (km2) % of Basin area
1 Least 0–0.4 50.79 0.782 Moderate 0.4–0.6 1,752.43 26.753 Severe 0.6–0.8 4,446.83 67.894 Critical >0.8 299.94 4.58
are presented in column 3 in Table 5. The limiting values for derived classes of thefinal map are based on the analysis of the combined input variables and judgmentof the investigating team after repeated discussions and field surveys. Area underdifferent vulnerability classes are given in Table 5. From Table 5, it can be seen thatmajor portion of the study basin fall under moderate and severe vulnerable zonesencompassing areas of about 26.76% and 67.89%, respectively. During November/December 2007, a team of NIH scientists conducted intensive field investigationsfor ground verification of the output map (Fig. 8). It was found that the ‘least’ vul-nerability class includes areas of barren land and small patches near outlet in northand central parts of Sonar basin. It is because low water demands in waste land areas.In lower reaches, the river sections have perennial streamflow characteristics andsurplus surface and groundwater availability. In the severe vulnerable area, paddycrops were completely lost and the colour of soya been crop turned up yellowish andbrown due to water stress. Farmers reported that they are expecting more than 80%loss to their soya been crop yield. The critically vulnerable patches were identifiedin western as well as eastern parts of the basin. These critical areas appears to befully justified as city of Sagar is located in the western ridge areas with low surfaceand ground water availability plus very high municipal water demands which posedserious threats of water deficits. It was found that the municipal supply of water wasalso curtailed by 25% during December to June in the year 2007.
Similarly, Damoh city is located in eastern ridge parts of the basin. The croplandand village habitation areas are mostly assessed under ‘severe’ vulnerability class andsupport the concept of the proposed methodology. In the case of persistent droughts,areas under critical and severe categories may suffer with greater negative impacts ofdrought. Results of this study, provides better assessment of the situation and it mayhelp to decision making in better drought management. This proposed methodologycan thus provide a guideline to compute integrated influence of various factors onvulnerability to drought in spatial and temporal manner.
10 Conclusions
Following conclusions could be drawn from this study.
1. Annual and seasonal departure analysis indicated that the Sonar basin hadexperienced droughts with an average frequency of once in 5 years.
2. In last 107 years maximum annual and seasonal rainfall deficits could be expe-rienced in the order of −59% and −69% respectively. Significant anomalies inrainfall had been observed during August followed by July, June, and Septembermonth.

4216 R.P. Pandey et al.
3. Methodology proposed in this study provides reasonable estimates of vulnera-bility to drought in spatial and temporal domain. Application of this method inidentification of drought vulnerabilities in space and time can lead to effectiveresponse for coping with drought. However, it requires further verification andinsertion of other relevant social factors for more comprehensive assessment ofvulnerability.
References
Alcomo J, Michlik LA, Carius A, Frank E, Klein R, Kronker D, Tanzler D (2008) A new approachto quantifying and computing vulnerability to drought. Reg Environ Change 8:137–149
Aller L, Bennett T, Lehr J, Petty RJ, Hackett G (1987) Drastic—a standardized system for eval-uation of ground water pollution potential using hydrogeologic setting. NWWA/EPA series,EPA/600/2-87/035, Washington, DC
Appa Rao G (1986) Drought climatology, Jal Vigyan Samiksha. High Level Technical Committeeon Hydrology, National Institute of Hydrology, Roorkee
Banerjee AK, Raman CRV (1976) One hundred years of Southwest monsoon rainfall over India.Scientific report no. 76/6, IMD, Pune, India
Byun H-R, Wilhite DA (1999) Objective quantification of drought severity and duration. J Climate12(2):747–756
Downing TE, Bakker K (2000) Drought discourse and vulnerability. In: Wilhite DA (ed) Drought:global assessment, natural hazards and disaster series. Routledge, UK
Eastman JR, Emani S, Hulina S, Jiang H, Johnson A, Ramachandrand M (1997) Application ofGeographic Information System (GIS) technology in environmental risk assessment and man-agement. Idrisi Project, Clark University, Worcester, MA
Edward EC, Mckee TB (1997) Characteristics of 20th century drought in the United States atmultiple time scales. Paper no. 634, Climatology report no. 97-2 Colorado State University,p 155
Hamouda MA, Nour El-Din MM, Moursy FI (2009) Vulnerability assessment of water resourcessystems in Eastern Nile Basin. Water Resour Manag 23:2697–2925
Iglesias A, Garrote L, Concelliere A (2009a) Guidelines to develop drought management plans.In: Iglesias A, Garrote L, Concelliere A (eds) Advances in natural and technological haz-ards research. Coping with drought risk in agriculture and water supply. Springer, New York,pp 55–65
Iglesias A, Moneo M, Quiroga S (2009b) Methods for evaluating social vulnerability to drought.In: Iglesias A, Garrote L, Concelliere A et al (eds) Advances in natural and technologicalhazards research. Coping with drought risk in agriculture and water supply. Springer, New York,pp 153–159
McKee TB, Doesjen NJ, Kelist J (1993) The relationship of drought frequency and duration to timescales. In: 8th AMS conference on applied climatol, Anaheim, CA, American MeteorologicalSociety, Boston, 17–22 January, pp 179–184
Nalbantis I, Tsakiris G (2009) Assessment of hydrological drought revisited. Water Resour Manag23:881–897
NIH (2002) Study for drought prone districts in Bundelkhand region. Technical report CS(AR)/200.National Institute of Hydrology, Roorkee, pp 1–53
Palmer WC (1965) Meteorological drought. Weather Bureau, WashingtonPandey RP, Ramasastri KS (2001) Relationship between the common climatic parameters and
average drought frequency. Hydrol Process 15(6):1019–1032Pandey RP, Mishra SK, Singh R, Ramasastri KS (2008a) Streamflow drought severity analysis of
Betwa river system (INDIA). Water Resour Manag 22(8):1127–1141Pandey RP, Sharma KD, Mishra SK, Singh R, Galkate RV (2008b) Assessing streamflow drought
severity using ephemeral streamflow data. Int J Ecol Econ Stat 11(S08):77–89Pereira LS, Cordery I, Iacovides I (2009) Conceptual thinking in coping with water scarcity.
In: Coping with water scarcity. Addressing the challenges. Springer, New YorkRossi G, Castiglione L, Bonaccorso B (2007) Methods and tools for drought analysis and man-
agement. In: Guidelines for planning and implementing drought mitigation measures. Springer,pp 325–347

Integrated Assessment of Vulnerability to Drought 4217
Rossi G, Benedini M, Tsakins G, Giakoumakis S (1992) On regional drought estimation and analysis.Water Resour Manag 6:249–277
Thiruvengadachari S, Gopalkrishna HR (1993) An integrated PC environmental for assessment ofdrought. Int J Remote Sens 14(17):3201–3208
Tsakiris G (2007) Practical application of risk and hazard concept in proactive planning. EuropeanWater, 19/20. E.W. Williams Publications, New York, pp 47–56
Tsakiris G, Pangalou D (2009) Drought characterization in the Mediterranean. In: Iglesias A,Garrote L, Concelliere A (eds) Coping with drought risk in agriculture and water supply.Advances in natural and technological hazards research. Springer, New York, pp 69–80
Tsakiris G, Pangalou D, Vangelis H (2007) Regional drought assessment based on ReconnaissanceDrought Index (RDI). Water Resour Manag 21(5):821–833
Wilhelmi OV, Wilhite DA (2002) Assessing vulnerability to agricultural drought: a Nebraska casestudy. Nat Hazards 25:37–58
Wilhelmi OV, Hubbard KG, Wilhite DA (2002) Spatial representation of agro-climatology in a studyof agricultural drought. Int J Climatol 22:1399–1414
Wilhite DA (2000) Drought as a natural hazard: concept and definition. In: Wilhite DA (ed)Drought: a global assessment, natural hazards and disaster series, vol 1. Routledge, UK
Wilhite DA, Vanyarkho D (2000) Drought: pervasive impacts of a creeping phenomena. In: WilhiteDA (ed) Drought: a global assessment, natural hazards and disasters series. Routledge, UK