integrating life sciences, engineering & operations
TRANSCRIPT

Integrating Life Sciences, Engineering & Operations Research to Optimize Human Safety
and Performance in Planetary Exploration
Mike GernhardtAugust 20, 2009Mike GernhardtAugust 20, 2009

The Challenge of Moving Past Apollo
Apollo was a remarkable human achievement, however fewer than 20 total program EVAs
Both surface crew performed EVA, but a maximum of 3 EVAs per mission
Up to 2000 EVAs (8 hrs/EVA) without LER, up to 10,000 EVAs (shorter duration) with LER
Limited mobility, dexterity, center of gravity and other features of the suit required significant crew compensation to accomplish the objectives. It would not be feasible to perform the Constellation EVAs using Apollo vintage designs
The vision is to develop an EVA system that is low overhead and results in close to (or better than) 1g shirt sleeve performance i.e. “
A suit that is a pleasure to work in, one that you would want to go out and explore in on your day off”
Lunar EVA will be very different from Earth orbit EVA –
a significant change in design and operational philosophies will be required to optimize suited human performance in lunar gravity
Unlike Shuttle & ISS, all CxP
crewmembers must be able to perform EVA –
and suits must be built to accommodate and optimize performance for all crew
Page 2

Biomedical & Technological Challenges of EVA
•
Decompression (denitrogenation
required to work in low pressure suit (4.3 psi)) *separate proposed risk*
•
Thermoregulation (-120oC to + 120oC)
•
Nutrition (200 kcal/hr requirement)
•
Hydration (1 liter/EVA)
•
Waste Management
•
Radiation
•
Micrometeoroids and Orbital Debris
•
Suit Trauma
•
Mobility/Dexterity: current pressurized suits reduce mobility and dexterity
•
Visibility
Page 3

Human & EVA System Relationships
Biomechanics
Human Factors
Suit Trauma/Injury Prevention
Thermal & Metabolic
Space Medicine
Sensorimotor
Radiation Protection
DCS Protection
Nutrition
Bone & Muscle
Exercise Physiology
Recommendations for:
Optimal Suit Weight, Mass, Pressure, CG and Kinematics
Suit Trauma Countermeasures
Contingency Reponses (Walkback, Suit Leak, Degrade Cooling)
Consumables, Usage & Management
Biomedical Sensors and algorithms
Validated Prebreathe
Protocols
Nutrition & Hydration Systems
Waste Management System
Exercise Countermeasureof EVA
HRP/EPSP: Provides medical expertise on what the human requires
EVA System: Working with HRP, determines what the system shall provide for the human
Page 4

Challenges for EVA on the Moon
Dealing with risk and consequences of a significant Solar Particle Event (SPE)
Long duration missions with three 8hr EVAs
per person per week
Apollo suits were used no more than 3 times
Individual crewmembers might perform up to 76 EVAs
in a 6-month mission
Suit-induced trauma currently occurs with even minimal EVA time
With Apollo style un-pressurized rover (UPR), exploration range is limited by EVA sortie time and 10 km walkback
constraint
Science/geology community input that optimal scientific return within this range could be accomplished within ~ 30 days of EVA
Two UPRs
could extend exploration range up to 15-20 km (crew-day limited)
Apollo highlighted the importance of dust control for future long duration missions
Increased Decompression Sickness (DCS) risk and prebreathe
requirements associated with 8 psi 32% O2
cabin pressure versus Apollo with 5 psi 100% O2
The high frequency EVA associated with the projected lunar architectures will require significant increases in EVA work efficiency (EVA time/prep time)
Page 5

“The Wall of EVA”
ISS Construction
GeminiApollo/Skylab
Pre-ChallengerShuttle Shuttle
“The Wall”
Page 6
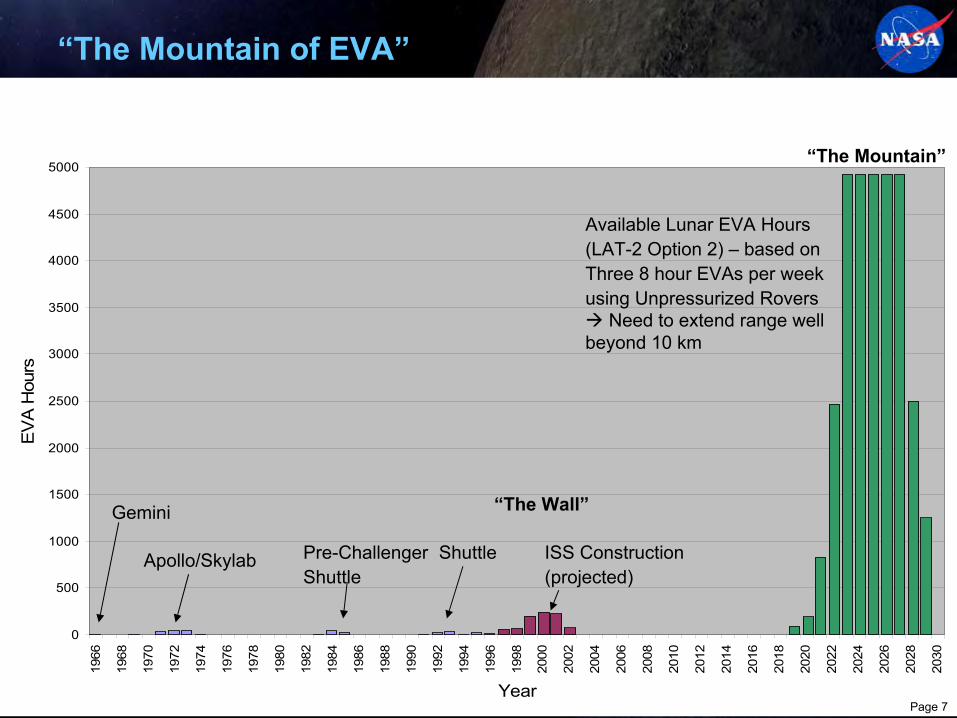
“The Mountain of EVA”
0
500
1000
1500
2000
2500
3000
3500
4000
4500
5000
1966
1968
1970
1972
1974
1976
1978
1980
1982
1984
1986
1988
1990
1992
1994
1996
1998
2000
2002
2004
2006
2008
2010
2012
2014
2016
2018
2020
2022
2024
2026
2028
2030
Year
EV
A H
ours
ISS Construction (projected)
Available Lunar EVA Hours (LAT-2 Option 2) –
based on Three 8 hour EVAs
per week using Unpressurized Rovers Need to extend range well beyond 10 km
Gemini
Apollo/Skylab Pre-ChallengerShuttle
Shuttle
“The Wall”
“The Mountain”
Page 7

Systems Engineering Approach to Optimizing Human Safety & Performance in Planetary Exploration
‘Contributing Factors’ in RMAT
Page 8
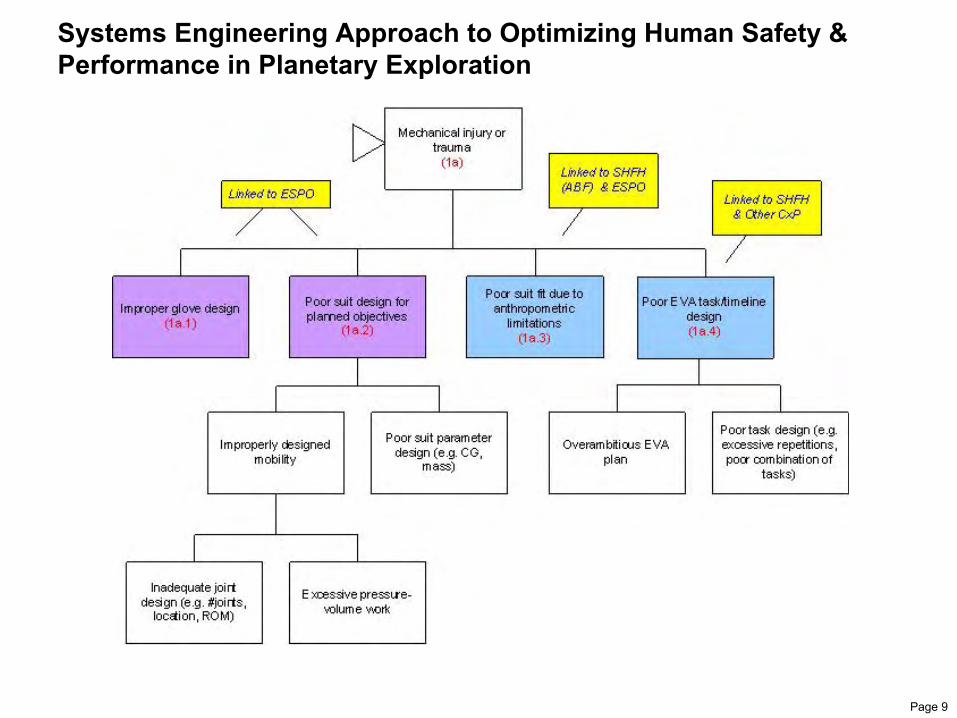
Systems Engineering Approach to Optimizing Human Safety & Performance in Planetary Exploration
Page 9

Systems Engineering Approach to Optimizing Human Safety & Performance in Planetary Exploration
Page 10
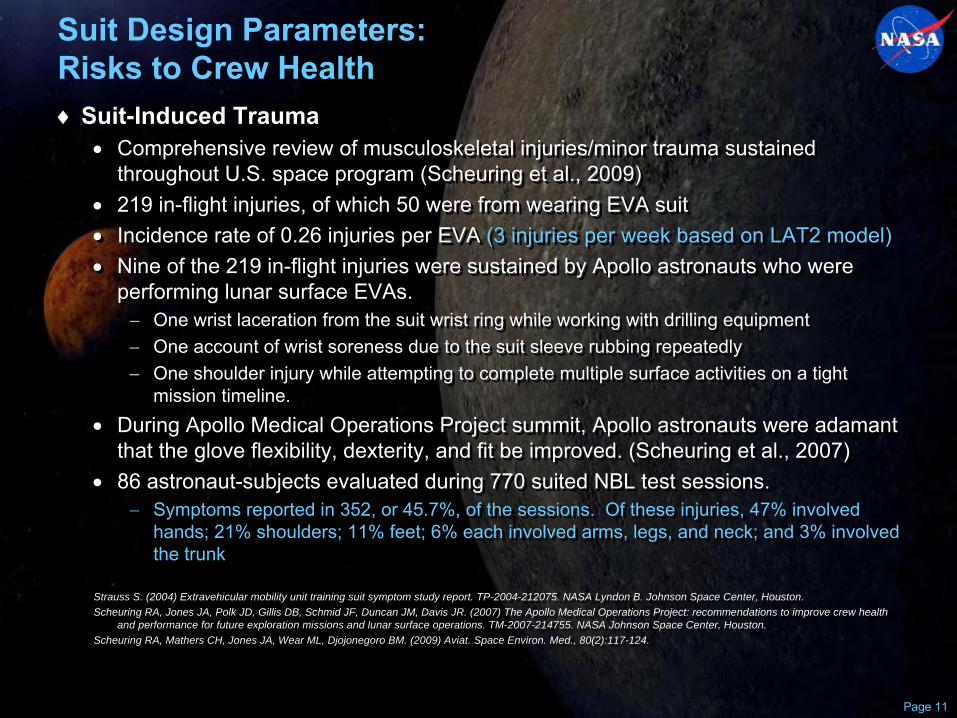
Suit Design Parameters: Risks to Crew Health
Suit-Induced Trauma
Comprehensive review of musculoskeletal injuries/minor trauma sustained throughout U.S. space program (Scheuring
et al., 2009)
219 in-flight injuries, of which 50 were from wearing EVA suit
Incidence rate of 0.26 injuries per EVA (3 injuries per week based on LAT2 model)
Nine of the 219 in-flight injuries were sustained by Apollo astronauts who were performing lunar
surface EVAs.
One wrist laceration from the suit wrist ring while working with
drilling equipment
One account of wrist soreness due to the suit sleeve rubbing repeatedly
One shoulder injury while attempting to complete multiple surface activities on a tight mission timeline.
During Apollo Medical Operations Project summit, Apollo astronauts were adamant that the glove flexibility, dexterity, and fit be improved. (Scheuring
et al., 2007)
86 astronaut-subjects evaluated during 770 suited NBL test sessions.
Symptoms reported in 352, or 45.7%, of the sessions. Of these injuries, 47% involved hands; 21% shoulders; 11% feet; 6% each involved arms, legs, and
neck; and 3% involved the trunk
Strauss S. (2004) Extravehicular mobility unit training suit symptom study report. TP-2004-212075. NASA Lyndon B. Johnson Space Center, Houston.Scheuring RA, Jones JA, Polk JD, Gillis DB, Schmid JF, Duncan JM, Davis JR. (2007) The Apollo Medical Operations Project: recommendations to improve crew health
and performance for future exploration missions and lunar surface operations. TM-2007-214755. NASA Johnson Space Center, Houston. Scheuring RA, Mathers CH, Jones JA, Wear ML, Djojonegoro BM. (2009) Aviat. Space Environ. Med., 80(2):117-124.
Suit-Induced Trauma
Comprehensive review of musculoskeletal injuries/minor trauma sustained throughout U.S. space program (Scheuring
et al., 2009)
219 in-flight injuries, of which 50 were from wearing EVA suit
Incidence rate of 0.26 injuries per EVA (3 injuries per week based on LAT2 model)
Nine of the 219 in-flight injuries were sustained by Apollo astronauts who were performing lunar
surface EVAs.
One wrist laceration from the suit wrist ring while working with
drilling equipment
One account of wrist soreness due to the suit sleeve rubbing repeatedly
One shoulder injury while attempting to complete multiple surface activities on a tight mission timeline.
During Apollo Medical Operations Project summit, Apollo astronauts were adamant that the glove flexibility, dexterity, and fit be improved. (Scheuring
et al., 2007)
86 astronaut-subjects evaluated during 770 suited NBL test sessions.
Symptoms reported in 352, or 45.7%, of the sessions. Of these injuries, 47% involved hands; 21% shoulders; 11% feet; 6% each involved arms, legs, and
neck; and 3% involved the trunk
Strauss S. (2004) Extravehicular mobility unit training suit symptom study report. TP-2004-212075. NASA Lyndon B. Johnson Space Center, Houston.Scheuring RA, Jones JA, Polk JD, Gillis DB, Schmid JF, Duncan JM, Davis JR. (2007) The Apollo Medical Operations Project: recommendations to improve crew health
and performance for future exploration missions and lunar surface operations. TM-2007-214755. NASA Johnson Space Center, Houston.Scheuring RA, Mathers CH, Jones JA, Wear ML, Djojonegoro BM. (2009) Aviat. Space Environ. Med., 80(2):117-124.
Page 11

Suit Induced Trauma
Page 12

Mechanisms of Injury & Countermeasures for EVA Associated with Finger Pressure in EVA Gloves Study
Results:
The pressure bulb compression test resulted in 50% and 45% decreased blood flow at 100 mmHg and 200 mmHg, respectively (top right).
Contact forces during the bulb task were highest in the palmar
side of the finger, followed by the palm.
Blood flow decreased more than 60% during pressing tasks, more rapidly for finger pad compression (4 N) than for finger tip compression (10 N) (middle right)
Significant reactive hyperemia occurred upon release of axial compression (bottom right); this rapid return of blood flow to capillaries may be source of microvascular
damage that contributes to fingernail delamination. This needs to be further understood.
Future Work:
Pilot study to compare EVA astronauts with-
and without documented finger injury begins Sept 2009
Results will help understand compression-induced fingertip blood flow changes and drive follow-on studies to include non-
astronaut population, refinement of techniques to identify root cause(s) of fingertip injury
Skin Blood Flow (%)
Page 13

Human Performance Testing Series Objectives & Measurements
Human Performance Measurements Collected:
•
Metabolic Rate• CO2
and humidity produced
•
Body heat production & storage
•
Human kinematics (range of motion, cycles)
•
Gait parameters•
Subjective measurements of perceived exertion, comfort, and
•
Ground Reaction Forces (from surface contact)
Human Performance Measurements Collected:
•
Metabolic Rate•
CO2
and humidity produced
•
Body heat production & storage
•
Human kinematics (range of motion, cycles)
•
Gait parameters•
Subjective measurements of perceived exertion, comfort, and
•
Ground Reaction Forces (from surface contact)
Identify the relative contributions of weight, pressure, and suit kinematics to the overall metabolic cost of the MKIII suit in its POGO configuration in lunar gravity
To quantify the effects of varied gravity, varied mass, varied pressure, varied cg, and suit kinematic constraints on human performance
To develop predictive models of metabolic rate, subjective assessments, and suit kinematics based on measurable suit, task, and subject parameters
Page 14

Initial Metabolic Data –
Lunar
Gravity
0
5
10
15
20
25
30
35
40
45
1 2 3 4 5 6 7 8
Speed (mph)
VO
2 (m
l/min
/kg) Moon, suited (■)
Earth, unsuited ()
Moon, unsuited / weighted ()
Moon, unsuited (Δ)
Total Metabolic Cost of Suit
Weight Factors
Inertial MassKinematics
Pressure
50
100
150
200
250
300
350
400
450
500
1 2 3 4 5 6 7 8
Speed (mph)
Tra
nspo
rt C
ost (
ml/k
g/km
)
Moon, suited
Moon, unsuited weighted
Earth, unsuited
Moon, unsuited
Transport Cost
Metabolic Cost
Page 15

Exploration Task Metabolic Cost Varied Weight
0
1
2
3
4
5
6
7
0 50 100 150 200 250 300 3501-g Equivalent Suit Weight (kg)
Tota
l O2 -
l/ta
sk (B
usy
Boa
rd &
Roc
k Tr
ansf
er)
0
20
40
60
80
100
120
140
VO2 -
ml/k
g ro
ck (S
hove
ling)Rock
Transfer
Busy Board
Shoveling
Page 16

Exploration Task Metabolic Costs Varied Pressure
0
1
2
3
4
5
6
7
8
0 5 10 15 20 25 30 35Suit Pressure (kPa)
Tota
l O2 -
l/ta
sk (B
usy
Boa
rd, R
ock
Tran
sfer
)
0
10
20
30
40
50
60
70
80
VO2 -
ml/k
g ro
ck (S
hove
ling)Shoveling
Busy Board
RockTransfer
Page 17

Inclined Walking Results
0
5
10
15
20
25
30
35
40
45
50
0% 5% 10% 15% 20% 25% 30% 35%
Treadmill Incline (%grade)
VO2 (
ml*k
g-1*m
in-1
)
Lunar Shirt Sleeve
Lunar SS Weight-Matched
Lunar Suited
1-g Shirt Sleeve
Lowest walking speed used
(1.4 –
2.2 mph)3 min per grade
Lowest walking speed used(1.4 –
2.2 mph)3 min per grade
Metabolic cost of weight increased with grade
Metabolic costs unrelated to weight decrease with grade•
Indicates energy recovery from suit
Metabolic cost of weight increased with grade
Metabolic costs unrelated to weight decrease with grade•
Indicates energy recovery from suit
Page 18

Contributions of Weight, Pressure & Other Factors to Metabolic Cost of MKIII, Pogo Configuration in 1/6 Gravity
Baseline, 34%Baseline, 55%
Baseline, 37%
Weight, -37% Weight, -40% Weight, -46%
Pressure, 9%
Pressure, 2%
Pressure, -1%
Other Factors, 93%Other Factors, 83%
Other Factors, 110%
-50%
-25%
0%
25%
50%
75%
100%
125%
150%Busy Board Rock Transfer Shoveling
% M
etab
olic
Cos
t
Baseline, 50% Baseline, 51% Baseline, 55%
Weight, 11% Weight, 31%Weight, 39%
Pressure, 15%
Pressure, 10%
Pressure, 5%
Other Factors, 24%
Other Factors, 8%
Other Factors, 0%
0%
10%
20%
30%
40%
50%
60%
70%
80%
90%
100%
10% 20% 30%
Treadmill Incline (% Grade)
% M
etab
olic
Cos
t
Exploration Tasks
Ambulation
*Data for weight only,not mass-matched
Page 19

Predicted Metabolic Rate Algorithm
Preliminary linear regression model
Uses the following combination of variables to predict normalized metabolic rates during locomotion in the MKIII EVA suit:
MR = b0 + (b1·Vlocomotion
· Wtotal
) + (b2·Mbody
) + (b3·(Wtotal
·Lleg
)) + (b4·Psuit
) where MR
= metabolic rate expressed as normalized VO2 (ml·kg-1·min-1)Vlocomotion
= locomotion speed (km/h)Wtotal
= total weight of EVA suit plus astronaut (N)Mbody
= body mass of unsuited astronaut (kg)Lleg
= leg length of astronaut (cm)Psuit
= suit pressure (kPa)
R2 = 1
R2 = 0.8464
0.00
5.00
10.00
15.00
20.00
25.00
30.00
35.00
40.00
45.00
50.00
0.0 5.0 10.0 15.0 20.0 25.0 30.0 35.0 40.0 45.0 50.0
Measured VO2 (ml·kg-1·min-1)
Mod
el P
redi
cted
VO
2 (m
l·kg-1
·min
-1)
Root mean square error = 2.52 ml·kg-1·min-1 (< 3.5 ml·kg-1·min-1)
-7.0
-3.5
0.0
3.5
7.0
10.5
14.0
17.5
0 1 2 3 4 5 6 7 8 9 10 11
Speed (km·h-1)
Δ V
O2 (
ml·k
g-1·m
in-1
)
Intrasite Translation
Site to SiteWalkback
63 kg
186 kg
247 kg
308 kg
121 kg Baseline
± 3.5 ml·kg-1·min-1
Translation
Predicted effect of suit weight on metabolic rate (operational concepts)
Page 20

Center of Gravity Studies
Background:•
Center of Gravity (CG) is likely to be an important variable in astronaut performance during partial gravity EVA
•
The Apollo lunar EVA experience revealed challenges with suit stability and control
•
Likely a combination of mobility and center of gravity factors
CG Studies conducted in several environments:
NBL (2007)
NEEMO (Missions 9-13)
Pogo (Integrated Suit Test 3)
C-9 Parabolic Aircraft
Initial testing focused on 6 different CG locations that included the baseline PLSS design and the extremes of what was considered a realistic PLSS mass distribution
After initial testing, PLSS packaging was refined resulting in two new configurations (fanny pack, flex pack). Additionally the Apollo PLSS, and a true 0,0 CG location were evaluated
Page 21

Underwater CG Study Results
Modified Cooper-Harper Ratings for Varied CG Configuration Ambulation vs. Exploration Tasks
0.0
1.0
2.0
3.0
4.0
5.0
6.0
7.0
8.0
9.0
10.0
Ideal Low Forward High Aft Baseline Flex.Backpack
Flex. FannyPack
Apollo 0,0,0
CG Configuration
Mod
ified
C-H
Rat
ing
Average C-H(ambulation)
Average C-H(exploration)
Task Performance Adequate w/o hardware improvement
Initial 6 CG configs Refined CG configs,
plus Apollo
•
Forward•
Ideal•
Low•
High•
Baseline•
Aft
Rank Order (Best to Worst)Ambulation
•
Forward•
Ideal•
Low•
Baseline•
High•
Aft
Exploration Tasks•
Forward•
Ideal•
Low•
High•
Baseline•
Aft
Incline•
Forward•
Ideal•
Low•
Baseline•
High•
Aft
Decline
Page 22

NEEMO/NBL GCPS (C-H) Probabilities vs. CG Location
-4.0
-2.0
0.0
2.0
4.0
6.0
8.0
10.0
12.0
-8.0 -6.0 -4.0 -2.0 0.0 2.0
Aft (in) Forward (in)
Low
(in)
H
igh
(in)
HIGH
CTSD 2005BASELINE
APOLLO
AFT
LOW
FANNYPACK
BACKPACK
IDEAL
0,0,0 CH=1-3
CH=4-6
CH=7-10
PROBABILITY OF:
MODIFIED COOPER-HARPER PROBABILITY VS. CG LOCATION
Exploration Tasks
-4.0
-2.0
0.0
2.0
4.0
6.0
8.0
10.0
12.0
-8.0 -6.0 -4.0 -2.0 0.0 2.0
Aft (in) Forward (in)
Low
(in)
H
igh
(in)
HIGH
CTSD 2005BASELINE
APOLLO
AFT
LOW
FANNYPACK
BACKPACK
IDEAL
0,0,0 CH=1-3
CH=4-6
CH=7-10
PROBABILITY OF:
MODIFIED COOPER-HARPER PROBABILITY VS. CG LOCATION
Level Ambulation Tasks
Page 23
RPE CH RPE CH RPE CH RPE CH RPE CH RPE CHBackpack 8 3 9 3 12 5 10 4 12 4 12 3
CTSD 8 4 9 4 12 4 10 4 12 4 12 4POGO 9 5 11 6 12 5 11 5 11 4 12 4
Backpack 8 3 9 2 11 4 10 5 12 5 9 3CTSD 8 4 9 4 12 4 10 4 12 4 12 3POGO 8 5 11 5 13 6 10 6 12 5 13 5
Backpack 8 2 9 5 11 5 10 4 12 5 9 3CTSD 8 3 9 4 12 5 10 4 12 4 12 4POGO 8 3 11 6 13 7 10 4 12 4 13 4
Backpack 8 3 10 4 12 7 11 5 12 5 11 3CTSD 8 4 10 4 11 4 10 4 11 4 10 5POGO 8 4 11 5 12 7 10 5 12 5 11 5
Backpack 8 3 10 4 12 7 10 4 11 5 11 3CTSD 8 5 9 3 11 4 10 4 11 4 10 4POGO 9 4 11 5 12 6 10 5 12 7 12 6
Shoveling
19074
29.3
Walking
Kneel/ Recover (down)Kneel/ Recover (up)
Rock Pickup
PHASE II DATA Subject ID2080 2501 1051 1459 7068 6678
2874.529.3
16269
28.471
29.1Task CG
1607328
14869
215 173
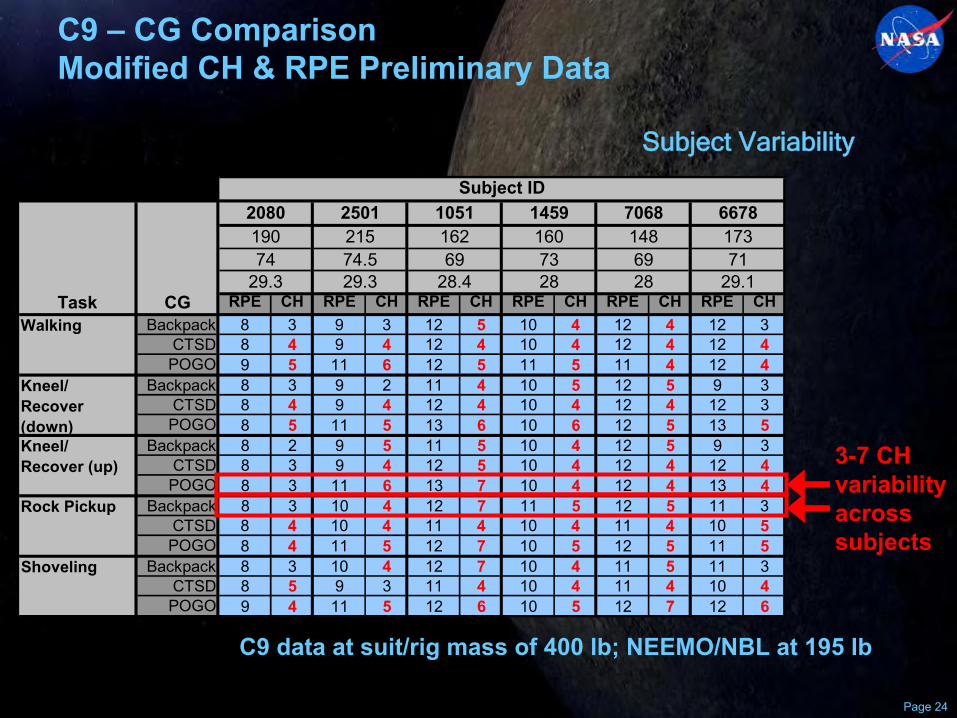
C9 –
CG Comparison Modified CH & RPE Preliminary Data
Page 24
C9 data at suit/rig mass of 400 lb; NEEMO/NBL at 195 lb
3-7 CHvariabilityacrosssubjects
Subject Variability

Earth Shirt-Sleeve Performance Index (ESSPI)
Earth Shirt-sleeve Performance Index = MET RATE X
MET RATE earth shirt-sleeved
Ambulation
Exploration Tasks
where x = condition being tested (1/6g suited, etc.))
ESSPI is an index which relates metabolic rate for a given condition of interest to metabolic rate during the same task in the reference 1g shirt-
sleeved condition
Page 25

10 km Walkback
Summary10 km Walkback Summary Data
(averaged across entire 10 km unless noted)
MEAN SD
Avg walkback velocity (mph) 3.9 0.5
Time to complete 10 km (min) 95.8 13
Avg %VO2 pk 50.8% 6.1%
Avg met rate (BTU/hr) 2374 303.9
Max. 15-min-avg met rate (BTU/hr) 2617 315
Total energy expenditure (kcal) 944.2 70.5
RPE 11.8 1.6
Cooper-Harper 3.5 1.4
Water used for drinking (oz) ~24-32 N/A
Planning / PLSS Sizing Data Walkback Apollo
O2 Usage 0.4 lbs/hr 0.15 lbs/hr
BTU average 2374 BTU/hr 933 BTU/hr
Cooling water 3.1 lbs/hr 0.98 lbs/hr
Energy expenditure 599 kcal/hr 233 kcal/hr
1
2
3
4
5
6
0 20 40 60 80 100 120
Time (min)
Spee
d (m
ph)
Page 26

100
150
200
250
300
350
400
0 1 2 3 4 5 6 7
Speed (mph)
Tran
spor
t Cos
t (m
l/kg/
km)
1000
1500
2000
2500
3000
3500
Hea
t Pro
duct
ion
(BTU
/hr)
Transport cost,Moon suited (□)
Heat Production ( ) Cooling Limit ofApollo & STS
Suits
Faster speeds provide improved efficiency, but require higher metabolic cost and associated heat production
Cooling is a limiting factor
Implications for Walkback
Page 27

HMP: Effects of Terrain and Navigation
↑
VO2
by 56% on average(range 41-67%)
↑
Distance by 7% (up to 21%)
↑
VO2
by 56% on average(range 41-67%)
↑
Distance by 7% (up to 21%)
10.18 9.8410.30
9.79 9.57 9.81 9.91 9.89 9.89
0.690.42
1.24
0.520.27
2.06
0.35 0.37 0.48
0.00
2.00
4.00
6.00
8.00
10.00
12.00
1 2 3 1 2 3 1 2 3
Route and Subject
Stra
ight
Lin
e D
ista
nce
(km
)
Radial 17Radial 00 Radial 23
0
5
10
15
20
25
30
35
40
45
50
0 20 40 60 80 100 120
Time
VO2 (
ml/m
in/k
g)
JSCHMPDelta VO2
Summary (n=3) HMP JSCJSC ΔVO2
AvgAvg
VOVO
22
((mLmL··kgkg--11··minmin--11))
26.9 ±
6.4
17.1 17.1 ±±
4.94.9
9.8 ±
3.8
Page 28

The New Lunar Architecture Drives Out The Need For A New Class Of EVA Surface Support Vehicles
Page 29

Small Pressurized Rover Design Features (Slide 1 of 2)
Suitports: allows suit donning and vehicle egress in < 10min with minimal gas loss
Work Package Interface: allows attachment of modular work packages e.g. winch, cable reel, backhoe, crane
Ice-shielded Lock / Fusible Heat Sink:
lock surrounded by 5.4 cm frozen water provides SPE protection. Same ice is used as a fusible heat sink, rejected heat energy by melting ice vs. evaporating water to vacuum.
Aft Driving Station: enables crew to drive rover while EVA
Suit PLSS-based ECLSS: reduces mass, cost, volume and complexity of Pressurized Rovers ECLSS
Radiator on Roof: allows refreezing of fusible heat sink water on extended sorties

Small Pressurized Rover Design Features (Slide 2 of 2)
Modular Design:
pressurized module is transported using Mobility Chassis. Pressurized module and chassis may be delivered on separate landers
or pre-integrated on same lander.
Docking Hatch: allows pressurized crew transfer from Rover-to-Habitat, Rover-to-Ascent Module and/or Rover-to-Rover
Dome windows:
provide visibility as good, or better than, EVA suit visibility
Pivoting Wheels:
enables crab-
style driving for docking
Cantilevered cockpit:
Mobility Chassis does not obstruct visibility
Exercise ergometer
(inside):
allows crew to exercise during translations
Two Pressurized Rovers: low mass, low volume design enables two pressurized vehicles, greatly extending contingency return (and thus exploration) range

Comparison of Small Pressurized Rovers vs. Unpressurized Rovers: Much more capability for the size
Page 32

Small Pressurized Rovers: Functional Requirements
Power-up and Check-out including suit/PLSS power up and check-out: ≤1hr
Mate/de-mate from Hab/Lander: ≤
10mins and ≤
0.03kg gas losses
Nominal velocity: 10kph
Driving naked-eye visibility should be comparable to walking in suit i.e. eyes
at same level, similar Field-of-View
Augmented by multi-spectral cameras/instruments
Visual accessibility to geological targets comparable to EVA observations i.e. naked eyes ≤
1m of targets
Possibility of magnification optics providing superior capability than EVA observations
Suit don and Egress/Egress
≤
10mins
≤
0.03kg gas losses per person
≥
2 independent methods of ingress/egress
Vehicle Mass (not incl. mobility chassis) ≤
2400kg
Habitable volume: ~10 m3
12 2-person EVA hours at 200km range on batteries and nominal consumable load
Ability to augment power and consumables range and duration to achieve ≥
1000km
PLSS recharge time ≤
30mins
Crewmembers ≤
20mins
from ice-shielded lock SPE protection (incl. translation to Small Pressurized Rovers and ingress)
Heat and humidity rejection provided by airflow through ice-shielded lock and condensing heat exchanger
Page 33

Black Point Lava Flow, Arizona
October 18-31, 2008
Preliminary Results of Small Pressurized Rover Testing
Black Point Lava Flow, Arizona
October 18-31, 2008
Preliminary Results of Small Pressurized Rover Testing

Hypotheses
1.
Performance achieved during 1-day exploration/mapping/geological traverses using the Small Pressurized Rover (SPR) will be equal to or greater the performance achieved during Unpressurized Rover (UPR) traverses, with less suit time.
2.
Range achieved during 1-day exploration/mapping/geological traverses in the SPR will be greater than during 1-day UPR traverses.
3.
Subjective assessment of contextual observations from inside an SPR will be equal to suited contextual observations.
4.
Human interfaces to the SPR suit ports and alignment guides will
be acceptable as assessed by human factors metrics.
5.
The human factors and crew accommodations within the SPR will be
acceptable to support a 3-day exploration/mapping/geological traverse.
6.
Single-person EVA from the SPR exploiting the advantages of IVA and EVA
crewmembers will result in performance equal to or greater than a two-
person EVA from the SPR or UPR, with less EVA suit time.
Page 35

Study Design
Two 2-person EVA crews
One astronaut per crew
One field geologist per crew
Only one crew performed the 3-day SPR traverse
For the purpose of UPR-SPR comparisons, practically significant differences in metrics were prospectively defined for the testing of study hypotheses
10% difference in time, range and productivity metrics
Categorical difference in subjective human factors metrics
36
11--dayday 33--dayday
Crew ACrew A UPRUPR SPRSPR SPRSPRTraverse UPR1ATraverse UPR1A Traverse SPR1ATraverse SPR1A Traverse SPR3ATraverse SPR3A
Crew BCrew B SPRSPR UPRUPRTraverse UPR1BTraverse UPR1B Traverse SPR1BTraverse SPR1B
Page 36


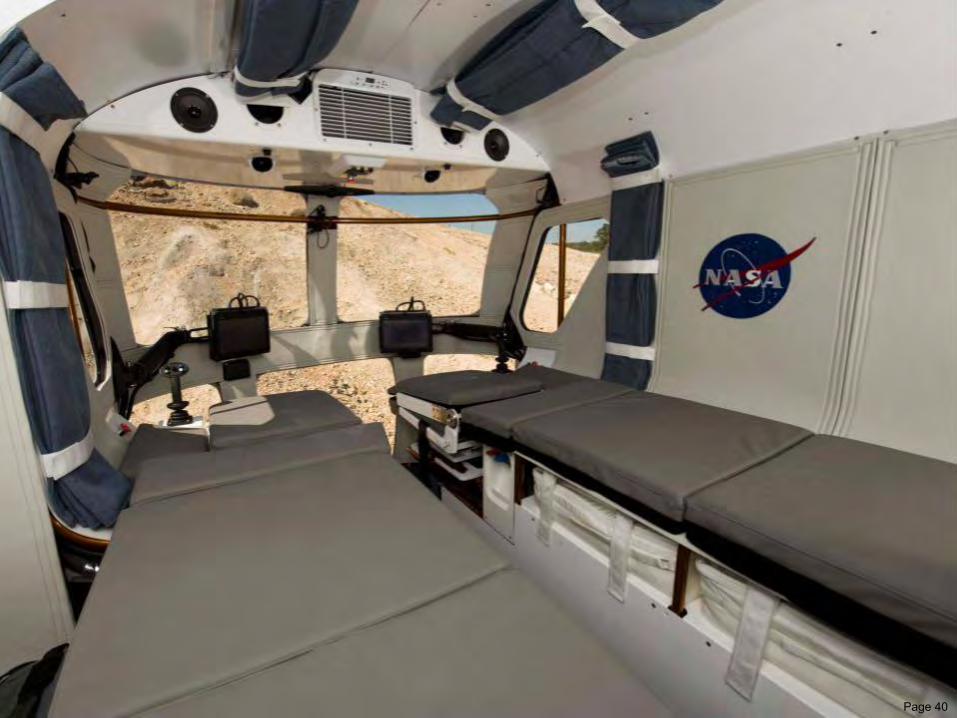
Page 40

Page 41

Page 42

Page 43


Page 48

Page 49

UPR 1-day Traverse Timeline
Page 50

SPR 1-day Traverse Timeline
Page 51

SPR 3-day Traverse Plan
SPR 3-day Traverse Plan
Page 52

Performance Metric
Page 53

Value of Traverse Objectives pre-assigned by Science Team
Data Quality scores assigned post-traverse by science team consensus
Unique Performance Data Sheets created for each traverse based on pre-
defined traverse objectives
Page 54
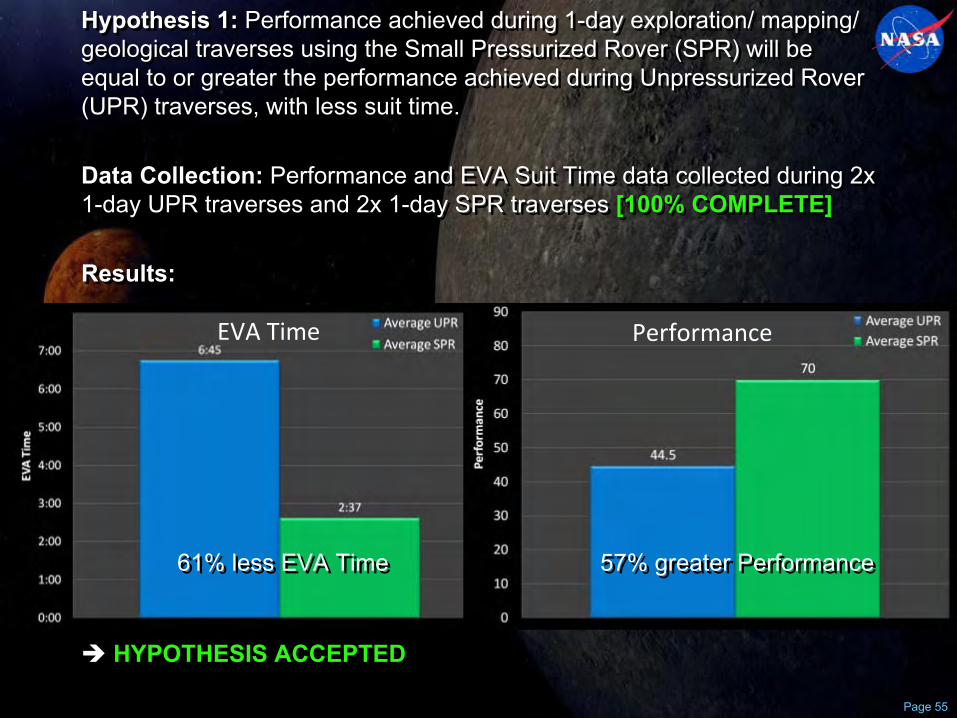
Hypothesis 1:
Performance achieved during 1-day exploration/ mapping/ geological traverses using the Small Pressurized Rover (SPR) will be equal to or greater the performance achieved during Unpressurized Rover (UPR) traverses, with less suit time.
Data Collection:
Performance and EVA Suit Time data collected during 2x 1-day UPR traverses and 2x 1-day SPR traverses [100% COMPLETE]
Results:
HYPOTHESIS ACCEPTED
EVA Time Performance
61% less EVA Time61% less EVA Time 57% greater Performance57% greater Performance
Page 55

Hypothesis 1:
Performance achieved during 1-day exploration/ mapping/ geological traverses using the Small Pressurized Rover (SPR) will be equal to or greater the Performance achieved during Unpressurized Rover (UPR) traverses, with less suit time.
HYPOTHESIS ACCEPTEDComments: SPR performance per EVA hr = 3.4 to 6.1 x greater than UPR
Mean: 4.7 x more productive per EVA hr than UPR
Hypothesis 1:
Performance achieved during 1-day exploration/ mapping/ geological traverses using the Small Pressurized Rover (SPR) will be equal to or greater the Performance achieved during Unpressurized Rover (UPR) traverses, with less suit time.
HYPOTHESIS ACCEPTEDComments: Comments: SPR performance per EVA hr = 3.4 to 6.1 x greater than UPRSPR performance per EVA hr = 3.4 to 6.1 x greater than UPR
Mean: 4.7 x more productive per EVA hr than UPRMean: 4.7 x more productive per EVA hr than UPRPage 56

Hypothesis 3:
Subjective assessment of contextual observations from inside an SPR will be equal to suited contextual observations.
Data Collection:
Four geologists were allowed up to 20 mins
to make shirt-sleeve observations of an area of the BPLF. They were then allowed up to 20 mins
to make observations from within the SPR and then rated the Geological Observation Quality (scale below) from inside the
SPR and provided other subjective remarks. [100% COMPLETE]
Page 57
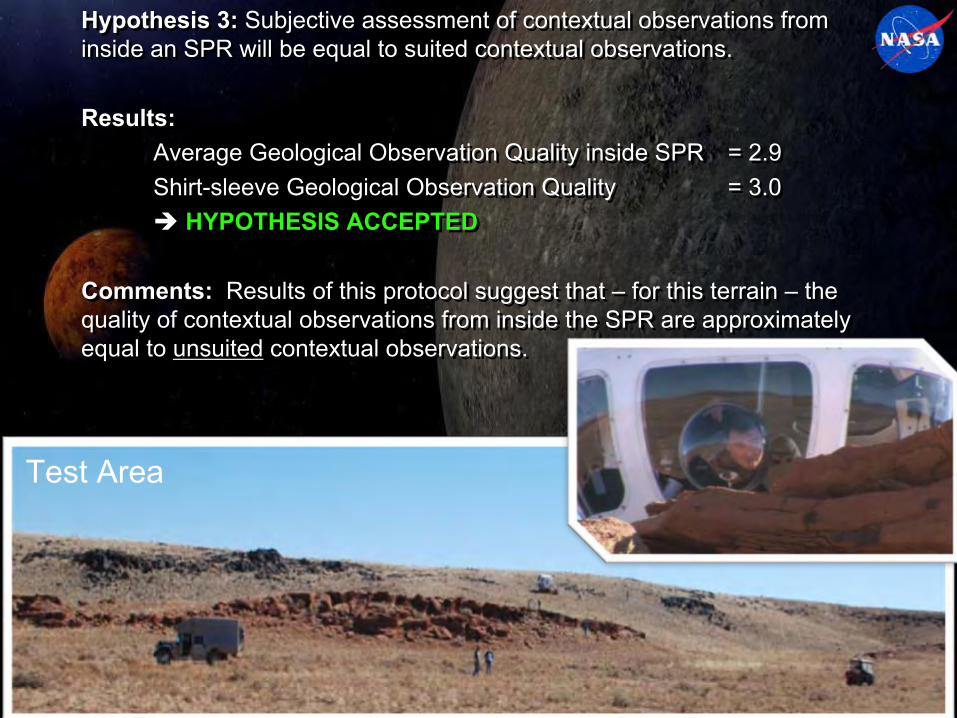
Hypothesis 3:
Subjective assessment of contextual observations from inside an SPR will be equal to suited contextual observations.
Results:
Average Geological Observation Quality inside SPR = 2.9Shirt-sleeve Geological Observation Quality = 3.0 HYPOTHESIS ACCEPTED
Comments: Results of this protocol suggest that –
for this terrain –
the quality of contextual observations from inside the SPR are approximately equal to unsuited
contextual observations.
Hypothesis 3:
Subjective assessment of contextual observations from inside an SPR will be equal to suited contextual observations.
Results: Average Geological Observation Quality inside SPR = 2.9Shirt-sleeve Geological Observation Quality = 3.0 HYPOTHESIS ACCEPTED
Comments: Results of this protocol suggest that –
for this terrain –
the quality of contextual observations from inside the SPR are approximately equal to unsuited
contextual observations.
Test Area

Suitport
Egress

Hypothesis 4:
Human interfaces to the SPR suit ports and alignment guides will be acceptable as assessed by human factors metrics.
Data Collection:
Suit port human factors data collected from four subjects during 5 days of SPR traverses [100% COMPLETE]
Results:Suit port human factors data are currently being analyzed. Preliminary analysis of data (next slide), including data collected during JSC dry-runs, suggests that human factors of the suit ports and alignment guides are indeed acceptable. Issues have been identified with the latching mechanisms and potential solutions identified.
HYPOTHESIS ACCEPTED

Suit Port Human Factors
1
2
3
4
5
6
7
8
9
10
Intern
al ac
cess
Interi
or ha
nd ho
lds
Genera
l IVA op
eratio
nsExte
rnal a
cces
sExte
rnal h
and h
olds
Genera
l EVA op
eratio
ns
Overal
l hum
an fa
ctors
Donnin
g
Doffing
Interi
or ve
hicle
volum
e for
donn
ing
Interi
or ve
hicle
volum
e for
doffin
g
Transla
tion i
nto su
it port
Transla
tion o
ut of
suit p
ortM
odifi
ed C
oope
r-H
arpe
r
Unacceptable
Acceptable
Borderline
Page 61

Hypothesis 5:
The human factors and crew accommodations within the SPR will be acceptable to support a 3-day exploration/ mapping/ geological traverse.
Hypothesis 5:
The human factors and crew accommodations within the SPR will be acceptable to support a 3-day exploration/ mapping/ geological traverse.
0
1
2
3
4
5
6
7
8
9
10
UPR SPR UPR SPR
Pre-Flight Post-Flight
Ave
rage
Fat
igue
Fatigue: Pre-
and Post-
1-day Traverses
Page 62

Hypothesis 5:
The human factors and crew accommodations within the SPR will be acceptable to support a 3-day exploration/ mapping/ geological traverse.
Results (cont.d):
Hypothesis 5:
The human factors and crew accommodations within the SPR will be acceptable to support a 3-day exploration/ mapping/ geological traverse.
Results (cont.d):
Fatigue Ratings during 3-day SPR Traverse
0
1
2
3
4
5
6
7
8
9
10
Pre Post Pre Post Pre Post
Day 1 Day 2 Day 3
Fatig
ue
Subject 1Subject 2
Page 63

Base CampBase Camp
Page 64

Base CampBase Camp
Page 65

Base CampBase Camp
Page 66

Base CampBase Camp
Page 67

Base CampBase Camp
0
5
10
15
20
25
30
35
40
45
1 2 3 4 5 6 7 8
Speed (mph)
Met
abol
ic R
ate
(ml/k
g/m
in)
Moon, suited (■)
Earth, unsuited ()
Moon, unsuited / weighted ()
Moon, unsuited (Δ)
Metabolic Cost of Suit
2 2.5 3 3.5 4 4.5 5 5.5 650
100
150
200
250
300
350
400
450
Speed (mph)
Ver
tical
Gro
und
Rea
ctio
n Fo
rce
(lbs)
Earth
Suited
UnsuitedUnsuited weighted
Combining Field Operational Concept Data with Laboratory Physiological Data
Page 68

Integrated Suit Tests: Test Traceability to Life Science Implications
Operations Concepts
Bone Maintenance
Muscle Maintenance
Cardiovascular Maintenance
Behavioral Health &
PerformanceHuman Factors &
PerformanceX X X X X EVA WalkbackX X X X X IST-1X X X X X IST-2X X HMP WalkbackX X NEEMO 9-13X X NBL
X X X Desert RATS '08(Small Pressurized Rover)
X X X C-9 Test(varied mass)
X X X X IST-3(shirtsleeve)
X X X C-9 Test(varied weight)
X X X C-9 Test(varied center of gravity)
X X X X IST-3(suited)
Test Traceability to Life Sciences ImplicationsUnderstand the impacts of EVA, from a life sciences perspective, on ______
Prio
rFu
ture
Test
Page 69

Summary of SPR Test Performance1‐day Traverse Distance: 31% increase
Productivity:
57% increase
Productivity per EVA Hour: 470 % increase
Boots‐on‐Surface EVA Time: 23% increase
Total EVA Time:
61% decrease
Crew Fatigue:
Statistically significant decrease
Crew Discomfort:
Statistically significant decrease
Summary of SPR Test PerformanceSummary of SPR Test Performance 11‐‐day Traverse Distance: 31% increaseday Traverse Distance: 31% increase
Productivity: Productivity:
57% increase57% increase
Productivity per EVA Hour: 470 % increaseProductivity per EVA Hour: 470 % increase
BootsBoots‐‐onon‐‐Surface EVA Time: 23% increaseSurface EVA Time: 23% increase
Total EVA Time:Total EVA Time:
61% decrease61% decrease
Crew Fatigue: Crew Fatigue:
Statistically significant decreaseStatistically significant decrease
Crew Discomfort: Crew Discomfort:
Statistically significant decreaseStatistically significant decreasePage 70

Reduced Decompression Stress (DCS)
Suit Ports enable crew members to perform multiple short extravehicular activities (EVAs) at different locations in a single day versus a single 8-hr EVA
Intermittent Recompressions (IR) during saturation decompression previously proposed as a method for decreasing decompression stress and time (Gernhardt,1988)
Gas bubbles respond to changes in hydrostatic pressure on a time scale much faster than the tissues
0
1
2
3
4
5
6
7
8
9
0 1 2 3 4 5 6 7 8 9 10 11 12 13 14 15
Time (hours)
Pres
sure
(psi
a)EVA EVA
Cabin Pressure
Recompression
Suit Pressure
IR has been shown to decrease decompression stress in humans and animals (Pilmanis
et al. 2002, Møllerløkken
et al. 2007)
Page 71

Tissue Bubble Dynamics Model (TBDM)-
Provides Significant Prediction and Fit of Diving and Altitude DCS Data
Decompression stress index based on tissue bubble growth dynamics (Gernhardt, 1991)
Diving: n = 6437 laboratory (430 DCS cases)
Logistic Regression Analysis: p <0.01
Hosmer-Lemeshow Goodness of Fit = 0.77
Altitude: n = 345 (57 DCS, 143 VGE)
Logistic Regression Analysis (DCS): p <0.01
Logistic Regression Analysis (VGE): p <0.01
Hosmer-Lemeshow Goodness of Fit (DCS): p = 0.35
Hosmer-Lemeshow Goodness of Fit (VGE): p = 0.55
r = Bubble Radius (cm)t = Time (sec) a = Gas Solubility ((mL
gas)/(mL
tissue))D = Diffusion Coefficient (cm2/sec)h(r,t) = Bubble Film Thickness (cm)Pa
= Initial Ambient Pressure (dyne/cm2)v = Ascent/Descent Rate (dyne/cm2cm3)g = Surface Tension (dyne/cm)M = Tissue Modulus of Deformability (dyne/cm2cm3)PTotal
= Total Inert Gas Tissue Tension (dyne/cm2)Pmetabolic
= Total Metabolic Gas Tissue Tension
Gernhardt
M.L. Development and Evaluation of a Decompression Stress Index Based on Tissue Bubble Dynamics. Ph.D
dissertation, University of Pennsylvania, UMI #9211935, 1991.
Page 72

Reduced Decompression Stress 3 x 2hr EVA at 4.3 psi
0
5
10
15
20
25
30
35
40
0 1 2 3 4 5 6 7 8 9 10 11 12 13 14 15 16 17
Time (hours)
Bub
ble
Gro
wth
Inde
x (B
GI)
3hr between 2hr EVAs
0.5hr between 2hr EVAs1hr between 2hr EVAs
2hr between 2hr EVAs
6hr Continuous EVA
Page 73

Shuttle Ground Test-
Repetitive EVAs
from 10.2 psi
•VGE associated with repetitive EVA from 10.2 psi •~28% DCS for single 6 hr. EVA exposure ( n=35)•No DCS observed after first EVA exposure ( n=12)
Page 74

2 2.5 3 3.5 4 4.5 5 5.5 650
100
150
200
250
300
350
400
450
Speed (mph)
Ver
tical
Gro
und
Rea
ctio
n Fo
rce
(lbs)
Earth
Suited
UnsuitedUnsuited weighted
Lunar Ground Reaction Forces: Implications for Prebreath
and Exercise Countermeasures
0
20
40
60
80
Ambulatory Non-Amb.%
DCS
2/203/21
10/20
1/21
Legs (p=0.0008)
95% CI
Arms (NS)
Duke, NASA micro-gravity simulation (non ambulation-3.5 hr prebreathe)
Page 75

Background: Background: Abbreviated Suit Purge Abbreviated Suit Purge ––
Mass and Time SavingsMass and Time Savings
EVA suits are purged of N2
prior to depressurization to achieve ≥
95% O2
Purge requires ~ 8 minutes and uses 0.65 lb gas per purge per suit
In an airlock, most of this gas is reclaimed but with a suit port this gas is vented to vacuum Shortening the purge will expedite vehicle egress & save gas
A 2 min purge saves ~0.48 lb gas and 6 minutes of crew time per person per egress compared with a standard 8 min purge
EVA suits are purged of N2
prior to depressurization to achieve ≥
95% O2
Purge requires ~ 8 minutes and uses 0.65 lb gas per purge per suit
In an airlock, most of this gas is reclaimed but with a suit port this gas is vented to vacuum Shortening the purge will expedite vehicle egress & save gas
A 2 min purge saves ~0.48 lb gas and 6 minutes of crew time per person per egress compared with a standard 8 min purge 6 month mission, 4 crew, 3 egresses /day,
6 days/week:
900 lb gas + tankage
= 1800 lb (819 kg)
Over 31 hours
of crew time saved
0.16lb
0.32lb
0.81lb
0.65lb
Cumulative Gas and Crew Time Saved by Abbreviated Purge
Page 76

Background: Abbreviated Suit Purge –
Decreased Off-Gassing Gradient
An abbreviated purge saves gas and crew time, but decreases the tissue N2
off-gassing gradient because suit O2
reaches only 80% compared with 95% O2
achieved during an 8 minute purge
However, the benefit of 95% O2
vs. 80% O2
for denitrogenation
is reduced when initial saturation pressure is 8 PSI, 32% O2
(LER) vs. 14.7 PSI 21% O2
(ISS) as there is a smaller change in off-gassing gradient
Approximate. Based on 1.5ft3
floodable volume @ 8 PSI
Page 77

Pressurized Safe Haven for Treatment of Injuries or Decompression Sickness
Crewmembers always within 20 minutes of a pressurized safe haven
Enables treatment for decompression sickness and expedited on-site treatment/medication of injured crewmembers
SPR will carry an expeditionary medical kit
Medical capabilities of SPR will match the standards of care mandated by NASA requirements based on the duration of the expedition and the distance from the outpost
Incapacitated crewmembers brought into SPR cabin using side hatch
Two SPRs
provides pressurized contingency return capability
With a single Large Pressurized Rover, contingency return capability would be provided by an Unpressurized Rover, which decreases contingency return range
Page 78

Exercise Countermeasures
Time spent inside SPR during long translations may be spent exercising
Exercise device being designed to provide cardiovascular (up to 75% VO2
peak) and resistive exercise capability Crewmembers’
mechanical energy during exercise may be converted to electrical energy and used to help recharge SPR batteries
Page 79

Radiation Protection
Water and polyethylene shield will provide protection against Solar Particle Events (SPEs)
Shielding will vary from 1.3cm to 5.3 cm (0.5”
to 2.4”) with less shielding needed in areas where the central lock is also shielded by the rest of the SPR structure
Preliminary analysis based on reducing the effective dose (organ averaged) below 10cSv (Rem) for the historically largest SPE
Page 80
Polyethylene shielding will be used for surfaces where the use of water shielding would interfere with interior layout during nominal operations or be complicated by other structures e.g. suitport
hatches
SPE safe haven in the SPRs
should eliminate the need for dedicated SPE shielding in either the habitats

Page 81
Alternate Configuration “Pancake”
V-NodeCylindrical inflatable dome:Height: 5.2mVolume: 63m3
Diameter: 4.2mFlr
area: 12m2
(129ft2) x2
Inflatable dome is same diameter as pressure vessel, so nodes with domes can be docked together
Deployable lightweight metal decking and supports (assembled autonomously, or by crew after inflation)
Minimal node contains ECLSS, core functions, plumbing, water wall shielding, etc.
Pancake V-Node in Lunarbago
modePage 81

Advantages of early HRP participation in SPR Evolution
In addition to all of the health and safety benefits of the SPR itself, early HRP participation provides a better understanding of operational
concepts and vehicle capabilities
In addition to all of the health and safety benefits of the SPR itself, early HRP participation provides a better understanding of operational
concepts and vehicle capabilities
#19 -
Medical#16 -
Life Science
Head start on
Exercise countermeasures
Food packaging concepts
Waste management concepts
Human factors/ergonomics
Medical treatment delivery concepts
Mitigating potential BHP issues
Low entry cost opportunities for dedicated life sciences & medical laboratories
Head start on
Exercise countermeasures
Food packaging concepts
Waste management concepts
Human factors/ergonomics
Medical treatment delivery concepts
Mitigating potential BHP issues
Low entry cost opportunities for dedicated life sciences & medical laboratories
Page 82

Exploration:•
Exploration range of up to 1000km (vs. 240km w/ large pressurized rover)
•
Shirt-sleeve envnmt
with visibility as good as suited EVAs•
Multi-spectral sensors & instruments always available•
Single-person EVA capability
Exploration:•
Exploration range of up to 1000km (vs. 240km w/ large pressurized rover)
•
Shirt-sleeve envnmt
with visibility as good as suited EVAs•
Multi-spectral sensors & instruments always available•
Single-person EVA capability
Operational / Engineering:•
Potential for transfer under pressure from Ascent Module and/or hab
(PLSSs
kept in controlled envnmnt
for re-use)
•
Reduced cycles on suit
•
Uses suit PLSS for life support
•
Potential for 4hr (lighter weight) PLSS-
Mars forward
•
Potential to achieve Work Efficiency Index (WEI) of up to 9.0 for individual EVA excursions
•
Reduces suit nutrition, hydration and waste mgmnt
needs
•
Eliminates need for contingency walkback, decreasing design reqts
for suit
•
>50% reduction in EVA time for equal or greater productivity and
increased range
Health & Safety:•
SPE protection within 20mins•
Pressurized safe-haven within 20mins •
DCS treatment within 20mins•
Expedited on-site treatment and/or medication of injured crewmember
•
Reduces suit induced trauma•
Better options for nutrition, hydration, waste management•
Increased DCS safety, decreased prebreathe
reqts
through intermittent recompression (would allow 3.5psi suit)
•
Provides resistive and cardiovascular exercise (75% VO2 peak) during otherwise unproductive translation time
•
Better background radiation shielding vs. EVA suit•
Dust control through use of suit port
Architectural: •
2 Pressurized Rovers weigh less than single large pressurized rover
–
Enables earlier delivery, possibly on crewed landers•
Up to 12,000 kg H2
O mass savings (with Rover and PLSS Heat Sink)
•
1000kg+ O2
and N2
mass savings and up to 144 days
less depress time using suit port vs. suitlock
–
Earlier long-duration crew missions–
Aggressive development of Hab
ECLSS less important•
“Gods-eye view”
capability (highly desirable for public outreach)•
Vehicle design and required technologies highly relevant to Mars
missions
•
No major cost burden for early SPRs
-
majority of DDT&E for critical components needed early anyway
Architectural: •
2 Pressurized Rovers weigh less than single large pressurized rover–
Enables earlier delivery, possibly on crewed landers•
Up to 12,000 kg H2
O mass savings (with Rover and PLSS Heat Sink)
•
1000kg+ O2
and N2
mass savings and up to 144 days
less depress time using suit port vs. suitlock–
Earlier long-duration crew missions–
Aggressive development of Hab
ECLSS less important•
“Gods-eye view”
capability (highly desirable for public outreach)•
Vehicle design and required technologies highly relevant to Mars
missions•
No major cost burden for early SPRs
-
majority of DDT&E for critical components needed early anyway
Advantages of Lunar Electric Rover
Floating Through the Terminator in the Sea Space Continuum

Slide Title